
 Submit a Paper
 Propose a Special lssue
 Open Access
ARTICLE

Experimental Assessment of Net Zero Energy Office under Natural and Forced Ventilation by Rooftop Solar Chimney
1 Department of Mechanical Engineering, College of Engineering, University of Kerbala, Karbala, Iraq
2 Affiliation Department of Mechanical and Energy Engineering, Erbil Technical Engineering College, Erbil Polytechnic University, Erbil, Iraq
3 College of Engineering Technologies, University of Hillah, Hillah, Iraq
4 Department of Petroleum Engineering, University of Kerbala, Karbala, Iraq
5 Air Conditioning and Refrigeration Techniques Engineering Department, University of Warith Al-Anbiyaa, Karbala, Iraq
* Corresponding Author: Ali M. Tukkee. Email:
(This article belongs to the Special Issue: Advancements in Energy Resources and Their Processes, Systems, Materials and Policies for Affordable Energy Sustainability)
Energy Engineering 2026, 123(5), 9 https://doi.org/10.32604/ee.2026.076252
Received 17 November 2025; Accepted 27 January 2026; Issue published 27 April 2026
 View Full Text
 Download PDF
Abstract
Energy supply and ventilation for isolated offices in rural areas are strongly recommended to be powered by renewable or standalone energy systems under the concept of net-zero-energy building (netZEB). A rooftop solar chimney is one of the adopted methods for space ventilation to improve thermal comfort. This approach has not been investigated under forced convection to support the netZEB. The objective of the current work is to experimentally assess the effectiveness of natural and forced ventilation methods for a prototype net-zero-energy office with a rooftop solar chimney. The prototype is a low-cost office constructed in the solar research site at University Teknologi PETRONAS, Malaysia. The weather is typical of a tropical climate. Three cases have been investigated. Case-1 with closed-door natural ventilation, Case-2 with open-door natural ventilation, and Case-3 with forced ventilation. Many ventilation parameters have been evaluated to compare the three ventilation cases. The measurement results show that, whether natural or forced, the installed chimney created a stack effect that reduced the temperature inside the office, but not to the required comfortable ventilation temperature. The mean measured indoor temperatures are higher than the proposed ventilation comfort temperatures, with differences of 6, 5.2, and 3.35°C for Case-1, Case-2, and Case-3, respectively. In natural ventilation, Case-2 reduced the indoor-to-outdoor temperature ratio by 2.7% and improved thermal comfort by 32.4% compared to Case-1. With forced ventilation, Case-3 reduced the indoor-to-outdoor temperature ratio by 27.3% and improved thermal comfort by 65.2% compared to Case-1. The large, unshaded glass windows have a significant negative effect on ventilation, and it is recommended to avoid such a design for netZEB in the tropical climate.Graphic Abstract
Keywords
The U.S. Energy Information Administration [1] forecast that energy demand will increase by around 56% in 2040 compared to 2010 levels. The industrial sector is the largest consumer of energy, followed by transportation, and households are the third. In his review paper, Ref. [2] reported that the European Environment Agency performed a study and found that the residential sector consumes around 18% of global energy. The household’s energy consumption is expected to increase 1.5% annually. As such, reliance on fossil fuel resources to cover the household’s increasing energy demand is contributing to higher GHG emissions and increased global warming, and shifting to renewable energies is vital in this regard. Kwan and Guan [3] recommended that the direction towards net-zero-energy buildings (netZEB) could annually save energy by 66% if supported by natural ventilation. Worth mentioning are the most reviewed studies that compile the background and development of netZEB, as summarized in Table 1. The publications are arranged in the table from oldest to newest. The following definitions were prepared for uniform EPBD recast implementation:

Net Zero Energy Building (netZEB): is a building that operates entirely on renewable energy, with zero fraction from non-renewable or national grid primary energy, i.e., 0 kWh/(m2a). A netZEB is a building that produces as much energy as it consumes annually, utilizing the potential renewable energy resources, leading to reduced dependence on fossil fuels and lower carbon emissions.
Nearly Zero Energy Building (nZEB): is a building that operates with reasonable non-renewable primary energy or national energy power, i.e., >0 kWh/(m2a) with high efficiency, but no more than a national limit value, achieved with a combination of renewable energy resources.
Kurnitski et al. [12] defined the nZEB as “A building that has very high energy performance. The nearly zero or very low amount of energy required should be covered to a very significant extent by energy from renewable sources, including energy from renewable sources produced on-site or nearby”. There are many methods for calculating the energy balance within the avoided burden approach. Bourrelle et al. [13] suggested four methods to predict energy balance, including: (a) Site balance, (b) Source energy balance, (c) Source energy balance with building embodied energy, and (d) Source energy balance with RES embodied energy. A source netZEB is a building that does not burden the energy grids at all during a specific time frame. This approach does not consider the energy embodied in the construction of the building or the RES within it. The strategy to measure energy balance is outlined in Fig. 1.

Figure 1: ZEB source energy balance.
An nZEB is proposed to consume low amounts of energy, which could be generated from renewable energy sources within the building envelope. Minimizing the low/zero energy buildings could be achieved through passive design, energy-efficient, or a hybrid approach as outlined in Fig. 2. Passive design techniques include using the building’s envelope, orientation, and geometric ratios to reduce the energy for the nZEB [14]. However, energy-efficiency measures could significantly reduce energy consumption through higher-efficiency HVAC systems, appliances, and lighting.

Figure 2: Low and zero-energy building techniques (modified after [6]).
International thermal comfort standards, such as ISO 7730 [15] and ASHRAE Standard 55 [16], provide guidelines for achieving a thermally comfortable indoor environment during the design of a sustainable building. Nevertheless, they are conducted in mid-latitude regions in North America and northern Europe. After extensive research and hundreds of surveys, ASHRAE Standard 55 has released a method to calculate the Predicted Mean Vote (PMV) based on the generated model by Fanger, 1970 [17], as in Eq. (1).
However, ASHRAE Standard 55 guidelines are not applicable in a tropical climate, where it is hot and humid year-round. While the PMV model predicts thermal sensation well in buildings with HVAC systems, field studies in warm climates have shown that it predicts a warmer thermal sensation than occupants feel [18]. It is for this reason that Ole Fanger and Toftum [19] have introduced a method to adjust PMV values from the standard ASHRAE calculation to better match measured PMV in warm-climate countries where buildings are without air conditioning. It is introduced to highlight the expectations of people based on local climate and mechanical conditioning, particularly in warm, humid climates, for naturally ventilated buildings [20]. A correction factor, also known as the expectancy factor (ep), is incorporated, ranging from 0.5 to 1.0 depending on the identified conditions. The ePMV scheme has been discussed and explained by many researchers, e.g., Refs. [19–22] are expressed in Eq. (2).
The PMV can be calculated based on the air temperature within the building, the mean radiant temperature, the occupants’ feel, air speed, relative humidity, metabolic rate, and clothing level [21]. However, Ref. [21] demonstrated, through experimental measurements, that even the ePMV model is insufficient in tropical climates, and they introduced a new, modified adaptive predictive mean vote thermal comfort model, the maPMV model, for low-cost buildings in tropical areas, as in Eq. (3).
where λ is the correlation correction factor with values of 0.295 and 2.05 for the cases of 1 to 10 occupants and 11 to 20 occupants, respectively.
The HVAC systems in buildings may account for more than 50% of the total electricity consumption [23]. Traditional air conditioning systems consume about 15% of the total worldwide electricity produced [24], which supports the direction towards ZEB. Studies show that solar natural ventilation is expected to meet the cooling requirement with a power-saving of 10%–15% in annual fan power consumption [25].
The SC creates a buoyancy-driven airflow within the space due to the density difference between the air in the building and the air exiting the SC, creating the stack effect. When the air changes between fresh outdoor air and the warm building space is maintained, the fresh outdoor air reduces the temperature, and the movement provides a sensory experience for occupants.
Many research works have been conducted on the natural ventilation of spaces and buildings under natural ventilation. The SC in buildings is a passive ventilation strategy, either natural or forced, without the need for HVAC systems. The ultimate objective of using the solar chimney (SC) is to achieve continues air change within the building while reducing energy consumption. Solar chimneys for ventilation have been widely studied in different configurations and designs: on the side wall of the building [26–28] or on the roof [29–31], and combined side vertical and roof horizontal SC [32], and combined side vertical and roof inclined SC [33]. The review by Maghrabie et al. [34] is an important compilation of SCs for ventilation, covering the fundamental principles, investigation methods, and a wide range of discussion for each type of SC.
In summary, ventilation in ZEBs and low-cost constructed buildings is essential for occupant thermal comfort and lowering household energy consumption. The thermal comfort of the spaces could be achieved by ventilation. For energy saving, ventilation could be achieved by a rooftop- or side-wall-installed SC. However, so far, there is no evaluation of whether natural or forced ventilation secures the recommended environment in ZEB. The PMV and ePMV thermal comfort concepts recommended by ASHRAE are not suitable indicators for natural ventilation, as they do not account for space ventilation but rather serve as subjective indicators for occupants.
Accordingly, the objective of the current experimental investigation is to assess the RTSC’s ability to secure a reasonable level of ventilation and an acceptable indoor environment for a ZEB. The investigations included three cases: natural ventilation with a closed door, natural ventilation with an open door, and forced ventilation by solar-operated fans. The first case serves as a benchmark for predicting the effectiveness of natural and forced ventilation. The building used as a ZEB for the assessment was a low-cost, prefabricated office for five postgraduate students at the solar research site at Universiti Teknologi PETRONAS (UTP), Malaysia. As thermal comfort is insufficient for evaluating ventilation, another indicator, the comfort temperature, was adopted from the literature. Additionally, a new indicator was developed and used to evaluate each case’s ventilation performance.
The problem at hand is to confirm whether the installed ventilation system is sufficient to achieve thermal comfort within the netZEB. An answer to the question could not be correct without proper monitoring and measurement of the thermal parameters in a real netZEB. Hence, the research has been designed to follow the process identified in the flowchart shown in Fig. 3.

Figure 3: Flowchart of the research procedure.
The temperatures and RH inside and outside the building must be measured to compare different operational conditions. Measurements were performed continuously for 24 h each day and repeated for 4 days per case to reduce data uncertainty. Three cases have been studied as described in Table 2.

2.1 Process Description and Variable Identification
The dependence of netZEB to reach thermal comfort and reduce indoor temperature by natural ventilation is presented schematically in Fig. 4. Natural ventilation is a result of air circulation between the outdoor and indoors. This process is fundamentally based on the pressure difference as the fluid moves from a higher-pressure zone to a lower-pressure zone. The cold outdoor air flows into the building at the lower level. At the top level, the process is reversed, where indoor air has higher pressure than colder outdoor air. The hotter indoor air flows outside the building. The net effect is continuous airflow between indoors and outdoors. This circulation, called natural ventilation, helps renew the air inside the building and cool it. During this air movement, the air’s moisture content and, in turn, the humidity level are reduced, leading to a better environment and improved thermal comfort.

Figure 4: Stack effect and natural ventilation in buildings.
However, air circulation is insufficient to achieve the required thermal comfort without boosting the airflow. A solar chimney, side wall, or rooftop-mounted system would enhance natural circulation by increasing the pressure difference. The RTSC method is adopted in the current study.
2.2 NetZEB Experimental Prototype
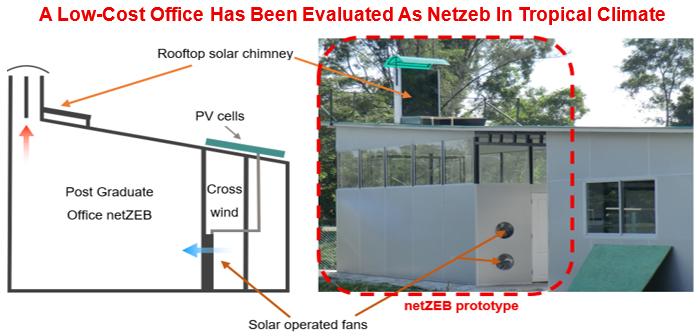
The building prototype consists of the PG office room, a hallway where crosswind flows, and a third room that is of no interest to the project at hand. Fig. 5 shows a schematic and an image of the experimental prototype. The PG office is constructed using low-cost materials.

Figure 5: Net-zero energy building prototype. (a) Schematic side view, (b) real image of the office.
The walls are made of double aluminum composite sheets up to 2.5 m high. The aluminum composite has a thickness of 2 mm and a thermal conductivity of 0.95 W/m·K. The air gap between the sheets is 24.5 mm. Hence, the overall heat transfer coefficient of the walls is 3.03 W/m2∙K. Above the aluminum wall is a 6 mm-thick glass window 1.0 m high, with an emissivity of around 0.85–0.9. The roof is made of sandwich panels with slopes of 4.0 and 3.5 m at the rear and front ends, respectively, to prevent rainwater from stagnating. The office floor area is 7.5 m long by 4.5 m wide, giving a prototype volume of 126.6 m3. The roof is made of sandwich panels with glass wool-embedded insulation, which typically has a thermal conductivity of 0.043 W/m∙K.
The cold air enters the office from the open door on the ground floor. The hallway, where the crosswind acts, is the main source of fresh air to the office. The installed RTSC helps to heat the air within its collector, acting as an area of low pressure to suck up the air inside the building, and allows air change from outside the office.
Two 400-mm-diameter, 20-W solar-powered wall-mounted fans (model Omicron Industrial Ventilation Fans) were installed on the side wall of the building near the office door. Each fan operates on 12 VDC electricity supplied by a 50 W polycrystalline PV solar panel (model SPM050-M) and a battery. Each of the two PV panels supplies 20 W to power the DC fan motor directly during sunny conditions, and 30 W to charge a 16 Ah, 12.8 V Lithium battery (model lifePO4, AGM Battery). The stored power in the battery operates the fan in sunless periods. The PV modules were mounted on the building’s roof.
The RTSC was designed and fabricated locally. The design and performance of the RTSC were investigated and reported by Al-Kayiem and Heng [35]. It has a rectangular chimney section measuring 1000 mm long by 300 mm wide. The chimney height is 1500 mm. The chimney collector has a rectangular cross-section and a glass cover. The collector inlet is 300 mm high and 1500 mm wide, and the area converges to 200 mm × 1000 mm at the chimney inlet. The bottom of the chimney is open to receive the hot air flow from the highest zone of the building. A schematic of the designed and fabricated SC is shown in Fig. 6.

Figure 6: The rooftop-mounted solar chimney (the original design by [35]).
2.3 Measurements and Instrumentations
To calculate ventilation performance parameters, many variables must be measured in accordance with ASHRAE standards. To track the temperature change throughout the day and night, a thermocouple and data logger have been used. The humidity level inside the building was measured by a hygrometer, which was also connected to the data logger. A vane anemometer allowed measurements of the flow rates and the air velocity inside the office building. The placement of the measuring tools is critical and influences the quality of the measured data. The installation of the instruments is shown in Fig. 7.

Figure 7: Schematics of the ZEB with identifications of the measuring instruments and locations. The left is a top view, and the right is a side view.
However, the two most critical variables are air temperature inside the office, radiant temperature sensed by the occupant, and air flow within the office. Thermocouples T1 and T2 measure the air temperature inside the office. The average of T1 and T2 is then used as the office’s average air temperature. To measure the average radiant temperature inside the office, the Mean of T3 and T4 is used. Thermo probe with thermocouple Type K model (AMI 300) used for the measurement of temperature with measuring ranges from −100°C to 750°C, with an accuracy of ± 0.8°C. A KIMO portable hot-wire model TPI 575C1 digital reader with a hot-wire velocity probe AMI 300 was used to measure air velocity with an accuracy of ±5%.
A Graphtec GL840 data logger records data at intervals for room temperature at three different heights, external and internal wall temperatures for each wall, mean radiant temperature, and relative humidity. Two globe probe units of 150 mm DIA globe thermometer type TESTO were used for indoor radiation temperature measurements in accordance with ISO 7243, ISO 7726, and DIN 33403. The globe probes have a measuring range from 0 to 120°C with an accuracy of ±1°C at 22°C. Adjustment time approx. 30 min. A hygrometer connected to the Graphtec GL840 measures the room’s humidity. The ambient temperature, solar irradiance, and wind speed data are collected from the weather station in the solar research site. The wind speed recorded by the weather station installed in the experiment site shows that the mean minimum is 0.55 m/s and the mean maximum is 1.4 m/s. Table 3 compiles the instrumentations used and their specifications.
• The total uncertainty in the temperature measurements is ±0.752%. As the maximum measured temperature is 48.2°C, then the maximum possible error in the temperature is ±0.36°C.
• The uncertainty in velocity measurement is ±5%. As the maximum measured velocity was 1.59 m/s, the maximum possible error in the velocity is ±0.08 m/s.
• The uncertainty in the solar radiation is solar irradiance, is ±5%. Given a maximum measured solar irradiation of 1020 W/m2, the maximum error in solar irradiation is ±51 W/m2.

The total uncertainty in RH% is 5.02%. Given a maximum measured RH of 80%, the maximum error in RH% is ±0.41%.
2.4 Ventilation Performance Factors
There is no doubt that the building’s interior temperature is the primary indicator of the effectiveness of the ventilation method. Accordingly, this parameter has been measured and analyzed over the entire testing period, 24/7. The envelope conditions, identified by the ambient temperature, have been combined with the measured indoor temperature in the results and analysis.
However, the indoor measured temperature is not the only effective parameter for comparing the three ventilation cases presented in Table 2. More indicators have been used as described in the following subsection.
2.4.1 Thermal Comfort by Predictive Mean Vote
The adjusted ePMV model developed by Fanger and Tcomf, presented in Eq. (2), was adapted to compare the three cases in this study with a recommended expectancy factor of 0.7, as it has been used in Malaysia by [21] and in Singapore by Liping and Hien [22], for the application of thermal comfort prediction in tropical areas. Typical values of the variables in the PMV calculation are based on recommendations from previous works [15,16,19–23,36,37]. They are tabulated in Table 4 for this study, along with their values and prediction procedures.

2.4.2 Thermal Comfort Temperature
Another comparison factor is used in the current study to account for ambient temperature, as the PMV and ePMV only indicate thermal comfort within the building and do not consider ambient weather conditions. Nguyen et al. [38] proposed a very simple thermal comfort temperature model as an indicator for satisfaction in the hot, humid Southeast Asia. This study also adopted the model and compared the three investigated cases.
2.4.3 Ventilation Temperature Indicator
In addition, a new indicator has been proposed and utilized to compare the three ventilation cases. The new indicator uses the ratio of the mean room temperature to the mean ambient temperature to allow fair comparison of the proposed natural ventilation methods. The indoor to ambient temperature ratio is named the Ventilation Temperature Indicator, V.T.I., as in Eq. (5).
According to the Department of Standards Malaysia (DOSM), the recommended indoor design temperature is 23°C to 26°C and a relative humidity of about 60% to 70% [39].
The air change per hour (ACH) is an effective comparison parameter for assessing ventilation performance. The air flow velocity can be measured at a known area within the ventilated space to estimate the volumetric flow rate. By measuring the space’s dimensions, Eq. (6) can be used to estimate the ACH.
where Qair is the air flow rate in m3/s, and Vroom is the ventilated space volume in m3.
The results of the three experimented cases are presented and discussed. Then, a conclusion is drawn from the comparison. The mean measured room air velocity at different locations in the ZEB, and the predicted convective heat transfer using Eq. (3) for each case, are shown in Table 5. Those values have been used in the ePMV prediction procedure. The convective heat transfer coefficient is considerably different from ventilation cases, according to the increased mean velocity inside the building. In this analysis, the values predicted by Eq. (4) of Ekici and Atilgan [37] have been used.

3.1 Results and Analysis of Case-1
In this case, the door was closed to deactivate any possible natural ventilation. The data were collected over 4 days, 24/7. The recorded temperature data inside and outside the building are shown in Fig. 8a for the four days. Fig. 8b displays the average temperature for the four days recorded, including indoor, outdoor, and radiative indoor temperatures. Each indoor data point is the mean of two temperature sensors, as discussed in Section 2.3. The radiative temperature is relatively high during the daytime due to the large glass windows. The reduction in indoor air and radiant temperatures is due to rain and clouds, which reduce the solar heating effect on the interior of the building.

Figure 8: The recorded temperatures during the experiments with Case-1 conditions, (a) for four days, (b) the mean of the four days.
The mean measured indoor air velocity in this case indicates stagnant air with 0.15 m/s. The mean measured RH is 54.2%. It is almost every day that the indoor temperature is higher than the outdoor temperature, even at night. The reason is that the air inside the building operates as thermal storage with stagnant air. In spite of the existence of the RTSC, the stack effect is still very low as there is no air change inside the building.
Thus, follows the first set of data collected with a closed door and no active ventilation system. Fig. 8b shows that the maximum indoor temperature, which is the mean of four days, is 44.8°C. During the night, the indoor temperature dramatically reduced to a minimum of 27°C. The adjusted predictive mean vote, ePMV, has been predicted at the building conditions at maximum and minimum temperatures and presented in Table 6.

3.2 Results and Analysis of Case-2
The office door is opened in this case for active natural ventilation by allowing air flow and change within the office, utilizing the stack effect created by the chimney. The data was taken for 4 days, 24/7 consecutively, and presented in Fig. 9a. The mean of the four days of collected data is shown in Fig. 9b.

Figure 9: The recorded temperatures during the experiments with Case-2 conditions, (a) for four days, (b) the means of data acquisition.
Similar trend of the measured temperatures in Case-1, where the indoor temperature is hotter than the outdoor temperature. Some hours during the night showed that the indoor temperature was lower than the outdoor temperature. In spite of the air change in the building, the accumulated thermal energy inside the office is too high due to the solar radiation, and the natural ventilation is not sufficient to extract the accumulated heat from the interior of the building.
Fig. 9b shows the means of the recorded temperature data of the four measurement days. At the maximum point, the radiant temperature reaches 48.16°C while the office maximum air temperature is 42.67°C. Table 7 shows the predicted thermal comfort based on the maximum and minimum measurements for this case. The mean measured velocity was 0.72 m/s, and the mean RH of four days was 55.7%

3.3 Results and Analysis of Case-3
In this case, the ventilation fans were turned on to create active forced ventilation. The four-day acquired temperature data are presented in Fig. 10a. The mean temperatures of the four days are shown in Fig. 10b.

Figure 10: The recorded temperatures during the experiments with Case-3 conditions, (a) for four days, (b) the means of data acquisition.
The solar ventilation fans allow more air change within the office, and hence, lower temperatures are expected. Fig. 10 shows the resulting data from this ventilation case. A drop in the maximum temperature is noticeable, and the thermal comfort throughout the day was also improved, as shown in Table 8. The mean measured velocity was 1.59 m/s, and the mean RH = 57.7%.

3.4 Comparison between the Cases
Based on the predicted variables, hc, and pa, assumed variables M, W, Icl, and measured variables, Tindoor, Tmrt, RH, and V values, the ePMV of each case has been predicted at maximum and minimum indoor temperatures. The results are presented and discussed in the coming subsections.
To compare the results of all investigated cases, the achieved ePMV for the three cases is presented in Fig. 11. Although the assessed netZEB has never reached the required thermal comfort, the results indicate that the forced ventilation, Case-3, reduces the ePMV compared to Case-1 and Case-2. During the day, the building’s interior, according to ASHRAE’s standard, was very hot. At night, thermal comfort decreased, reaching slightly warm in all tested ventilation cases. We emphasize again that the ePMV is not a suitable indicator for the ventilation performance. Hence, another method to compare the tested cases has been used.

Figure 11: The maximum and minimum adjusted predicted mean vote for thermal comfort estimation.
Fig. 12 shows another comparison method between the three ventilation cases. The mean temperatures of the four days of measurement of each case were determined, and the ratios of the mean indoor to the mean ambient temperatures were predicted. The results indicate that the indoor temperature in case-1, with 1.1 V.T.I., is much higher than the ambient temperature, where the closed door converted the office into a thermal energy storage with almost stagnant air. The V.T.I. is reduced to 1.07 and 1.02 for Cae-2 and Case-3, respectively. As the V.T.I. is higher than unity, it means that the indoor temperature is higher than the ambient temperature, and the ventilation methods failed to achieve sufficient ventilation. However, the forced ventilation showed a mean V.T.I. lower than that of the cases. It is the design of the office with large glass walls that is to be blamed. The four-day measured temperatures are displayed in Figs. 8a, 9a, and 10a provide clear support to this claim of the design mistake, where the measured radiation temperature is always higher than the indoor and the ambient temperatures.

Figure 12: Values of the ventilation temperature indicator for the three tested ventilation cases.
Fig. 13 displays the maximum, minimum, and mean comfortable ventilation temperature, Tcomf. Predicted in accordance with Eq. (4) proposed by Nguyen et al. [38]. During the daytime, when the solar radiation imposes heat inside the building, the indoor measured temperature is too high compared with the proposed comfortable temperature. This trend is obvious for the three tested cases. During the night, when there is no solar energy input to heat the building, the maximum measured indoor temperatures have been reduced to a minimum from 44.8°C to 27°C for Case-1, from 32.4°C to 28.2°C for Case-2, and from 39.8°C to 26.9°C for Case-3. This difference in temperatures between day and night means the office has a large exposure to solar radiation, and a large heat flux penetrates the interior, causing accumulated thermal energy. On the other hand, the mean measured indoor temperatures are higher than the proposed ventilation comfort temperatures, with differences of 6°C, 5.2°C, and 3.35°C for Case-1, Case-2, and Case-3, respectively. However, during the night, when the indoor temperatures are around 27°C–28°C, the proposed V.T.I. is around 28°C–29°C.

Figure 13: The predicted comfortable ventilation temperature based on the proposed criteria by [38].
To quantify the required improvement, a rough estimate has been made and presented in Fig. 14. The data in the figure is based on the mean values of the measured indoor and outdoor temperatures and the proposed comfort temperature. The required change is to improve the office design and the ventilation performance to reach a comfortable temperature by adopting the forced ventilation method, Case-3, with a reduced mean room temperature by about 3.2°C. This span represents the coverage of −0.5°C and 2.8°C. The situation at night is manageable as the difference between the measured indoor temperature, around 26.9°C, and the proposed comfort temperature, 27.7°C, is very close. The problem is associated with the solar radiation, and solar energy penetrates the office. The analysis of the thermal environment in the office and the associated with the existing forced ventilation suggests that a good shedding of the glass wall could be a factual solution. For the future design of the netZEB, it is highly recommended to reduce the solar day lighting as it is combined with large solar radiation entering the building. Appropriate shading of the large glass windows and walls would reduce the solar heating during the day and allow the building to reach a reasonable comfortable temperature by forced ventilation.

Figure 14: Analysis of the actual measured and the comfort temperatures for the three ventilation cases.
One more comparison indicator is based on the ACH. Fig. 15 shows the mean predicted ACH for the three ventilation cases. Theoretically, as the door is closed in case-1, there is still a small airflow, averaging 1.28, due to air penetrating through the fan’s gap between the blades and the open and closing of the door during the day of measurements. As for the natural ventilation of case-2, where the door is open, but the fans are off, the ACH is increased to 6.14, where the RTSC imposed the stack effect and enhanced the air flow from outdoor to indoor. The ACH is doubled in case 3 with the use of the solar fans. The fans have more than doubled the ACH in the building. This increase in the ACH led to great improvement in the thermal comfort inside the tested prototype of the netZEB, as shown in Fig. 11, and considerably improved the V.T.I. from 1.1 for case-1, to 1.07 for case-2, and 1.02 for case-3. The reason is that the incoming air from the ambient contains high moisture content, which evaporates inside the building zone, reducing indoor air temperature.

Figure 15: Predicted values of the air change per hour for the three ventilation cases.
3.5 General Observation and Discussion
The experimental assessment successfully provided a view of the various tested types of netZEB ventilation with the assistance of roof mounted solar chimney. Results of Case-1 showed that the office’s interior acted as a heat trap, causing the internal temperature to rise to an extreme high. The radiant temperature inside the building reached a maximum of 47.2°C, resulting in a poor thermal comfort rating of 5.56, which is considered too hot according to ASHRAE-55 standards. The indoor temperature is 6°C above the comfortable ventilation temperature, described in Eq. (4) [38]. Such conditions are highly insufficient as a working environment.
The second natural ventilation type, Case-2, with the office door open, allows air to flow into the building. This situation allows air change, where cooler air from the surrounding envelope enters, gains thermal energy from the interior heated air, and exits at the top with assistance from the RTSC. This arrangement is purely passive natural ventilation. It is cheap, and only the initial capital for RTSC fabrication and installation is required, with no need for mechanical tools to force air circulation, which may improve conditions inside the office. This passive natural ventilation arrangement reduced the building interior temperature ratio by 2.7% and improved thermal comfort by 32.4% compared to Case-1. Although the thermal comfort level is still far from the ASHRAE-recommended range, enhanced ventilation performance is achieved at only the RTSC cost. The mean indoor temperature is 5.2°C higher than the mean comfortable ventilation temperature.
The assessment of the third tested Case-3, a forced-ventilation arrangement with 24 h/day solar fans set to ON, was conducted. The fans run on 12 VDC supplied from the battery, which is connected to a PV solar panel. The two ventilation fans greatly improved airflow throughout the office and helped improve the indoor environment. With the tested forced ventilation arrangement, the maximum temperature dropped by 5°C, and thermal comfort improved by 65.2% compared to the bare Case-1. This confirms that the RTSC with enforced air circulation is an effective method for achieving reasonable thermal comfort in low-cost buildings in hot, humid conditions. However, the minimum thermal comfort of 1.03 was close to accepted levels within the ASHRAE-55 standards, while at worst, the 3.47 ePMV was beyond the scale.
The main comparison parameters between the studies have been summarized in Table 9, showing the max/min indoor temperatures, comfort temperatures, V.T.I., ePMV, temperature ratio, and ACH.

The author’s opinion is that the wall design mistake caused the high indoor temperature and low thermal satisfaction. The mistake lies particularly in the use of large glass windows 1 m above the composite wall sheets. It is aimed to achieve daylighting by large glass windows, but the penalty is the high indoor temperature caused by the penetrating solar radiation inside the office.
A netZEB has been experimentally assessed and compared under three different ventilation arrangements. The experimental netZEB prototype was designed and constructed using low-cost materials and used as a postgraduate office at the solar research site at Universiti Teknologi PETRONAS, Malaysia, which is characterized by hot, humid weather year-round. The office is equipped with an RTSC that aids in ventilation, along with two ventilation fans powered by PV panels. Many comparison indicators have been adopted to provide a reasonable basis for comparison and understanding of natural and forced ventilation without air conditioning systems. A natural ventilation system with only the office door open reduced the maximum interior temperature by 2.13°C, while forced ventilation with solar fans reduced it by 5.8°C and, consequently, improved thermal comfort by 65.2%. Under forced ventilation, the air change per hour was approximately 10 times higher than in the bare case (no ventilation).
Nevertheless, the resulting thermal comfort levels are not within the acceptable range of ASHRAE Standard 55. The use of large glass windows has a significant negative impact on thermal comfort in netZEB, and it is advised to minimize their use and to employ sufficient shading in tropical regions. The envelope of the evaluated netZEB is a subject of future work. Also, the results call for further research to identify what can be improved in the office envelope to enhance ventilation. Another suggestion is to install an RTSC with a larger collector and to test simulation software with different building orientations. Furthermore, since windows are the main contributor to poor ventilation performance, the window sizes and shading methods are of great importance to investigate.
Acknowledgement: The authors acknowledge Universiti Teknologi PETRONAS for providing access to the solar research site and for the use of the postgraduate office on the site for experimental measurements. Also, the authors express their gratitude to Mahmoud S. Mousa for assisting with the installation of the measuring instruments and data collection.
Funding Statement: The authors received no specific funding for this study.
Author Contributions: The authors confirm contribution to the paper as follows: Conceptualization, Hussain H. Al-Kayiem and Ali M. Tukkee; methodology, Hussain H. Al-Kayiem and Ali M. Tukkee; formal analysis, Hussain H. Al-Kayiem; investigation, Safaa M. Ali, Ranj S. Abdullah; data curation, Hussain H. Al-Kayiem, Safaa M. Ali; writing—original draft preparation, Safaa M. Ali; writing—review and editing, Hussain H. Al-Kayiem, Safaa M. Ali, Ranj S. Abdullah, Ali M. Tukkee; project administration, Hussain H. Al-Kayiem. All authors reviewed and approved the final version of the manuscript.
Availability of Data and Materials: The data that support the findings of this study are available from the Corresponding Author, Dr. Ali M. Tukkee, upon reasonable request.
Ethics Approval: Not applicable.
Conflicts of Interest: The authors declare no conflicts of interest.
References
1. U.S. Energy Information Administration. International energy outlook: with projections to 2040. Washington, DC, USA: U.S. Energy Information Administration; 2013. [Google Scholar]
2. González-Torres M, Pérez-Lombard L, Coronel JF, Maestre IR, Yan D. A review on buildings energy information: trends, end-uses, fuels and drivers. Energy Rep. 2022;8:626–37. doi:10.1016/j.egyr.2021.11.280. [Google Scholar] [CrossRef]
3. Kwan Y, Guan L. Design a zero-energy house in Brisbane, Australia. Procedia Eng. 2015;121:604–11. doi:10.1016/j.proeng.2015.08.1046. [Google Scholar] [CrossRef]
4. Casini M. Designing the third millennium’s buildings. In: Smart buildings. Amsterdam, The Netherlands: Elsevier; 2016. p. 3–54. doi:10.1016/b978-0-08-100635-1.00001-0. [Google Scholar] [CrossRef]
5. Lin Y, Zhong S, Yang W, Hao X, Li CQ. Towards zero-energy buildings in China: a systematic literature review. J Clean Prod. 2020;276(10):123297. doi:10.1016/j.jclepro.2020.123297. [Google Scholar] [CrossRef]
6. Bi C, Little JC. Integrated assessment across building and urban scales: a review and proposal for a more holistic, multi-scale, system-of-systems approach. Sustain Cities Soc. 2022;82(3):103915. doi:10.1016/j.scs.2022.103915. [Google Scholar] [CrossRef]
7. Satola D, Wiberg AH, Singh M, Babu S, James B, Dixit M, et al. Comparative review of international approaches to net-zero buildings: knowledge-sharing initiative to develop design strategies for greenhouse gas emissions reduction. Energy Sustain Dev. 2022;71:291–306. doi:10.1016/j.esd.2022.10.005. [Google Scholar] [CrossRef]
8. Wilberforce T, Olabi AG, Sayed ET, Elsaid K, Maghrabie HM, Ali Abdelkareem M. A review on zero energy buildings–Pros and cons. Energy Built Environ. 2023;4(1):25–38. doi:10.1016/j.enbenv.2021.06.002. [Google Scholar] [CrossRef]
9. Ali Mohammed G, Mabrouk M, He G, Abdrabo KI. Towards sustainable cities: a review of zero energy buildings techniques and global activities in residential buildings. Energies. 2023;16(9):3775. doi:10.3390/en16093775. [Google Scholar] [CrossRef]
10. Wang Y, Hu B, Meng X, Xiao R. A comprehensive review on technologies for achieving zero-energy buildings. Sustainability. 2024;16(24):10941. doi:10.3390/su162410941. [Google Scholar] [CrossRef]
11. Mengaw MA, Mengesha WJ, Madessa HB. Recent progress in net-zero-energy buildings in tropical climates: a review of the challenges and opportunities. In: The 1st International Conference on Net-Zero Built Environment. Cham, Switzerland: Springer Nature; 2025. p. 1003–13. doi:10.1007/978-3-031-69626-8_84. [Google Scholar] [CrossRef]
12. Kurnitski J, Allard F, Braham D, van Dijk D, Feldman C, Fox J. nZEB technical definition and system boundaries for nearly zero energy buildings. Brussels, Belgium: REHVA; 2013. [Google Scholar]
13. Bourrelle JS, Andresen I, Gustavsen A. Energy payback: an attributional and environmentally focused approach to energy balance in net zero energy buildings. Energy Build. 2013;65(53):84–92. doi:10.1016/j.enbuild.2013.05.038. [Google Scholar] [CrossRef]
14. Rodriguez-Ubinas E, Montero C, Porteros M, Vega S, Navarro I, Castillo-Cagigal M, et al. Passive design strategies and performance of net energy plus houses. Energy Build. 2014;83(4):10–22. doi:10.1016/j.enbuild.2014.03.074. [Google Scholar] [CrossRef]
15. ISO 7730: 2005. Ergonomics of the thermal environment—analytical determination and interpretation of thermal comfort using calculation of the PMV and PPD indices and local climate thermal comfort criteria. Geneva, Switzerland: International Organization for Standardization; 2005. [Google Scholar]
16. ANSI/ASHRAE Standard 55. Thermal environment conditions for human occupancy. Atlanta, GA, USA: ASHRAE; 2004. [Google Scholar]
17. Fanger PO. Thermal comfort, analysis and application in environmental engineering. Copenhagen, Denmark: Danish Technical Press; 1970. [Google Scholar]
18. Brager GS, de Dear RJ. Thermal adaptation in the built environment: a literature review. Energy Build. 1998;27(1):83–96. doi:10.1016/S0378-7788(97)00053-4. [Google Scholar] [CrossRef]
19. Ole Fanger P, Toftum J. Extension of the PMV model to non-air-conditioned buildings in warm climates. Energy Build. 2002;34(6):533–6. doi:10.1016/S0378-7788(02)00003-8. [Google Scholar] [CrossRef]
20. Katić K, Li R, Zeiler W. Thermophysiological models and their applications: a review. Build Environ. 2016;106:286–300. doi:10.1016/j.buildenv.2016.06.031. [Google Scholar] [CrossRef]
21. Al-Kayiem HH, Mohammed MN, Kelly K, Riyadi TWB, Effendy M. Experimental assessment and development of thermal comfort model for implication in tropical climate. Int J Comput Meth Exp Meas. 2023;11(1):35–43. doi:10.18280/ijcmem.110105. [Google Scholar] [CrossRef]
22. Wang L, Hien WN. The impacts of ventilation strategies and facade on the indoor thermal environment for naturally ventilated residential buildings in Singapore. Build Environ. 2007;42(12):4006–15. doi:10.1016/j.buildenv.2006.06.027. [Google Scholar] [CrossRef]
23. Hamdy M, Hasan A, Kai S. Applying a multi-objective optimization approach for design of low-emission cost-effective dwellings. Build Environ. 2011;46(1):109–23. doi:10.1016/j.buildenv.2010.07.006. [Google Scholar] [CrossRef]
24. Fernandes MS, Brites GJVN, Costa JJ, Gaspar AR, Costa VAF. Review and future trends of solar adsorption refrigeration systems. Renew Sustain Energy Rev. 2014;39(8):102–23. doi:10.1016/j.rser.2014.07.081. [Google Scholar] [CrossRef]
25. Emmerich SJ, Dols WS, Axley JW. Natural ventilation review and plan for design and analysis tools report. Washington, DC, USA: National Institute of Standards and Technology, Technology Administration; 2001. [Google Scholar]
26. Maerefat M, Haghighi AP. Natural cooling of standalone houses using solar chimney and evaporative cooling cavity. Renew Energy. 2010;35(9):2040–52. doi:10.1016/j.renene.2010.02.005. [Google Scholar] [CrossRef]
27. Imran AA, Jalil JM, Ahmed ST. Induced flow for ventilation and cooling by a solar chimney. Renew Energy. 2015;78(3):236–44. doi:10.1016/j.renene.2015.01.019. [Google Scholar] [CrossRef]
28. Huynh BP. Natural-ventilation flow in a 3-D room fitted with a solar chimney. In: Proceedings of the ASME 2012 International Mechanical Engineering Congress and Exposition; 2012 Nov 9–15; Houston, TX, USA; 2013. p. 755–60. doi:10.1115/IMECE2012-87455. [Google Scholar] [CrossRef]
29. Bansal NK, Mathur R, Bhandari MS. A study of solar chimney-assisted wind tower system for natural ventilation in buildings. Build Environ. 1994;29(4):495–500. doi:10.1016/0360-1323(94)90008-6. [Google Scholar] [CrossRef]
30. Torres-Aguilar CE, Moreno-Bernal P, Nesmachnow S, Aguilar-Castro KM, Cisneros-Villalobos L, Arce J. Annual evaluation of natural ventilation induction in solar chimneys under tropical, dry, and temperate climates of Mexico: a case study. Sustainability. 2023;15(23):16399. doi:10.3390/su152316399. [Google Scholar] [CrossRef]
31. Singh Rajput K, Bartaria VN. Experimental study of vertical air temperature distribution and ventilation with energy saving using solar chimney. Mater Today Proc. 2022;63(2):692–8. doi:10.1016/j.matpr.2022.04.914. [Google Scholar] [CrossRef]
32. Nguyen YQ, Huynh TN. Evaluating the performance of a combined vertical wall–horizontal roof solar chimney for the natural ventilation of buildings. Buildings. 2024;14(6):1501. doi:10.3390/buildings14061501. [Google Scholar] [CrossRef]
33. Cui H, Han M, Zhang J, Han Z, Xu F, Liu Q. Theoretical analysis and numerical study of natural convection inside combined solar chimney. Energy Sci Eng. 2024;12(5):2052–71. doi:10.1002/ese3.1729. [Google Scholar] [CrossRef]
34. Maghrabie HM, Ali Abdelkareem M, Elsaid K, Sayed ET, Radwan A, Rezk H, et al. A review of solar chimney for natural ventilation of residential and non-residential buildings. Sustain Energy Technol Assess. 2022;52:102082. doi:10.1016/j.seta.2022.102082. [Google Scholar] [CrossRef]
35. Al-Kayiem HH, Heng YM. Experimental investigation of rooftop solar chimney for natural ventilation. ARPN J Eng Appl Sci. 2015;10(1):10249–54. doi:10.4028/www.scientific.net/amm.672-674.109. [Google Scholar] [CrossRef]
36. Fanger PO, Toftum J. Prediction of thermal sensation in non-air-conditioned buildings in warm climates. In: Proceedings of the 9th International Conference on Indoor Air Quality and Climate; 2002 Jun 30–Jul 5; Monterey, CA, USA. [Google Scholar]
37. Ekici C, Atilgan I. A comparison of suit dresses and summer clothes in the terms of thermal comfort. J Environ Health Sci Eng. 2013;11(1):32. doi:10.1186/2052-336X-11-32. [Google Scholar] [PubMed] [CrossRef]
38. Nguyen AT, Singh MK, Reiter S. An adaptive thermal comfort model for hot humid Southeast Asia. Build Environ. 2012;56(3):291–300. doi:10.1016/j.buildenv.2012.03.021. [Google Scholar] [CrossRef]
39. Malaysian Standard 1525:2019. Energy efficiency and use of renewable energy for non-residential buildings—Code of practice (Third revision). Putrajaya, Malaysia: SEDA; 2019. [Google Scholar]
Cite This Article
 Copyright © 2026 The Author(s). Published by Tech Science Press.
This work is licensed under a Creative Commons Attribution 4.0 International License , which permits unrestricted use, distribution, and reproduction in any medium, provided the original work is properly cited.
 Downloads
 Citation Tools