
 Login
Login Register
 Submit a Paper
 Propose a Special lssue
 Open Access
ARTICLE

Towards Resilient Cities: Robust Selection of Rooftop Renewable Energy Technologies in Mediterranean Multifamily Buildings
1 Department of Industrial Engineering, University of Naples Federico II, Naples, Italy
2 School of Materials Science and Engineering, Nanyang Technological University, 50 Nanyang Avenue, Singapore
3 Information Technologies Institute, Centre for Research & Technology Hellas, Thermi, Thessaloniki, Greece
4 Department of Electrical and Computer Engineering, Democritus University of Thrace, Xanthi, Greece
* Corresponding Author: Federico Minelli. Email:
(This article belongs to the Special Issue: Innovative Renewable Energy Systems for Carbon Neutrality: From Buildings to Large-Scale Integration)
Energy Engineering 2026, 123(6), 20 https://doi.org/10.32604/ee.2026.074048
Received 30 September 2025; Accepted 08 April 2026; Issue published 27 May 2026
 View Full Text
 Download PDF
Abstract
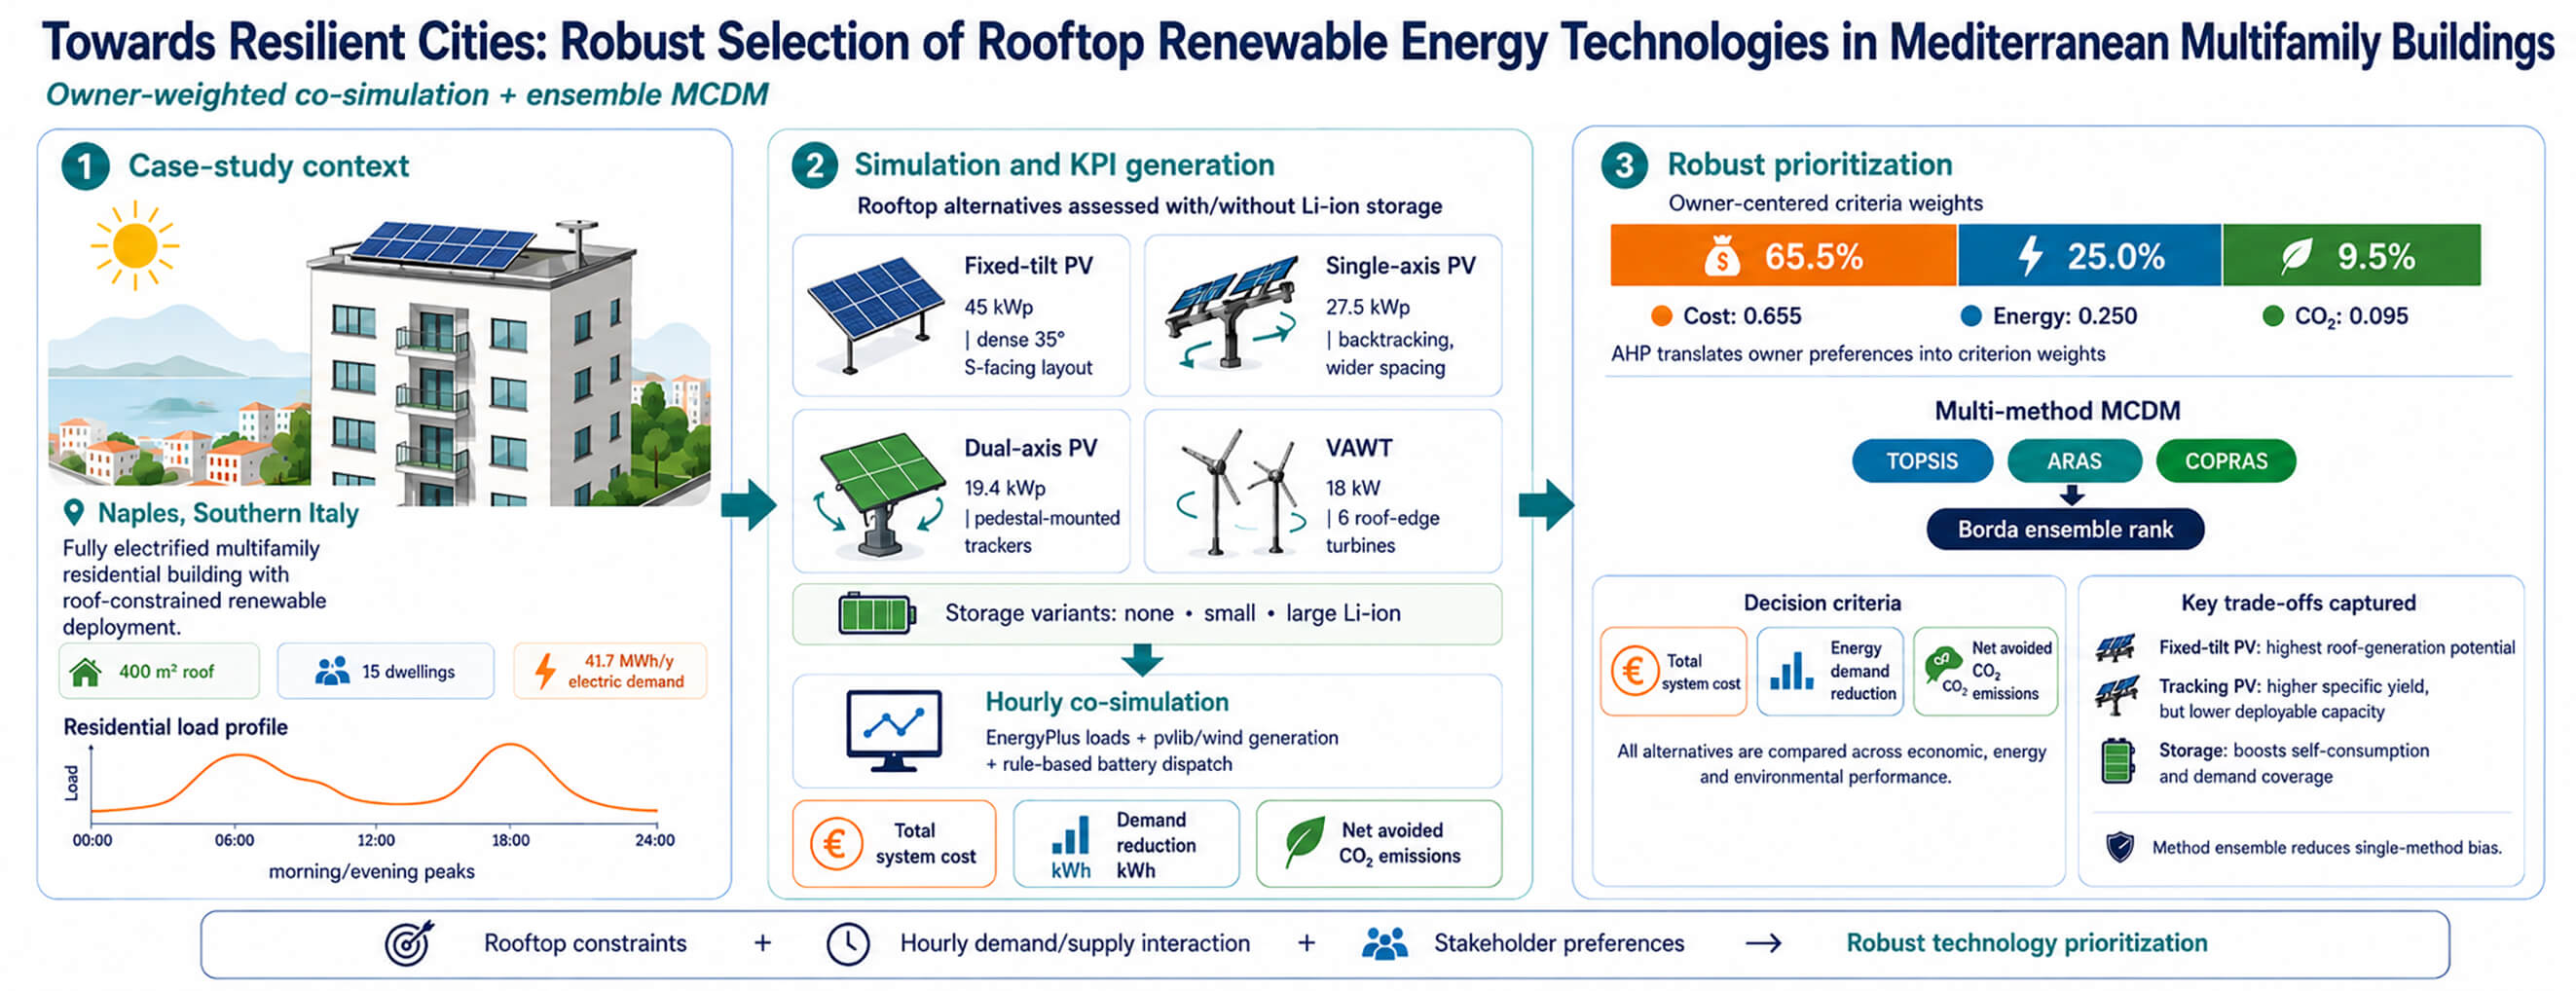
This study investigates the problem of prioritizing rooftop renewable energy (RE) system configurations for a multi-family residential building in Mediterranean climate. The analysis focuses on fixed-tilt photovoltaics (PV), single-axis and dual-axis tracking PV, and small vertical-axis wind turbines (VAWT), each assessed with and without lithium-ion storage. A co-simulation framework is used, coupling EnergyPlus building-HVAC system simulation with PV and wind generation modeling and rule-based battery dispatch to evaluate hourly demand–supply interactions. Three decision criteria are considered for each alternative: total system cost, annual building electric energy demand reduction, and net avoided life-cycle emissions. Stakeholder preferences are elicited via Analytic Hierarchy Process (AHP), considering the building owner as the decision-maker. The design alternatives are then ranked with three multi-criteria decision-making (MCDM) methods (TOPSIS, ARAS, and COPRAS) and a global rank is computed through an ensemble (Borda) aggregation. Results show that due to roof-area constraints, dense fixed-tilt PV system layouts are favored to achieve maximum annual generation (≈60.8 MWh per year), whereas tracking systems achieve higher specific yield but lower system capacity per roof because of increased need of spacing and maintenance corridors. Design alternatives that incorporate energy storage significantly raise self-consumption and demand reduction. Indeed, fixed PV with large storage can reach high annual coverage of building electric energy consumption, while the same PV without storage can reduce it by ~43.7%. VAWT options contribute modestly to energy demand reduction given unfavorable urban wind conditions and their shorter lifetime. Under owner-centric weights that emphasize cost, the ensemble ranking prioritizes low-CAPEX PV solutions (dual-axis PV without storage, single-axis PV without storage, single-axis PV with small storage, and fixed-tilt PV). Instead, design alternatives encompassing large energy storage and small-wind alternatives occupy the lower ranks. The findings provide useful insights and a stakeholder-wise tool to select rooftop RE technologies on Mediterranean residential buildings, balancing economic feasibility with energy and environmental performance.Graphic Abstract
Keywords
Accelerating the uptake of renewable energy sources in cities is essential for both decarbonization and energy security [1], but real-world deployment still falls short of what is technically achievable, especially in the existing residential stock, where rooftop areas are frequently not fully exploited for on-site clean electric energy generation [2]. While recent studies investigated the exploitation of renewable energy sources in non-urban areas or non-building-integrated contexts [3–5], this study evaluates the prioritization of rooftop renewable energy system deployment considering fixed-tilt PV, single- and dual-axis tracking PV, and small vertical-axis wind turbines (VAWTs) in urbanized contexts. Also, it analyzes how their performance changes when paired with lithium-ion batteries. The investigation is performed using a real residential building as a case study. The building owner is identified as the key decision-maker in this context, since both feasibility and value of the deployment of renewable energy sources in residential buildings are judged through the owner’s budget, preferences, and constraints. An owner-led ranking is, therefore, critical for prioritizing solutions that can actually be implemented across the residential stock [6–8].
The investigation is protracted in Mediterranean climate (Naples, Southern Italy). This climate is characterized by strong annual solar availability and building energy demand is often driven by summer cooling needs while winters remain relatively mild. In this context, the mismatch between residential load profile (characterized by morning and evening peaks) and the PV energy production profile (peaking in the central hours of the day) can lead to misalignment between generation and consumption, making energy storage very effective for boosting self-consumption and improving interactions between the building and the public grid [9,10]. Also, the dense historic fabric typical of Mediterranean cities often constrains façade interventions [11] and roofs, therefore, become an important opportunity for RE deployment, which deployment must be carefully planned to balance yield, self-shading, maintenance corridors and visual impact [12–14].
As regards the tradeoff between the analyzed technologies, it is known that fixed PV arrays are straightforward and economical, while tracking systems can increase plane-of-array irradiance but at the cost of spacing losses, higher capex and operation and maintenance complexity [15–18]. Also small wind systems on buildings have niche potential but face urban-flow turbulence, siting, noise and structural challenges, with more conservative yields than in open terrain [19–22]. Lastly, the energy storage presence strongly affects residential energy consumption profiles and both financial and environmental aspects. Indeed, in households with heavy consumption in the morning or evening, batteries substantially raise self-consumption and reduce peak exports when paired with PVs, but with upfront costs and embodied emissions that represent a known drawback [23–26].
Recent studies addressed the refinement of renewable energy potential assessment and emphasized PV–battery system integration and operational strategies in buildings and renewable energy communities under evolving market conditions [7,8,27]. In parallel, recent contributions highlight the value of robust, multi-method decision support to reduce method dependence when multiple stakeholder criteria must be balanced [28]. However, these two advancements have been rarely applied in a harmonized framework. This motivates the present study’s combination of dynamic building–RES simulation with an ensemble MCDM ranking framework for the choice of RE systems on Mediterranean multi-family rooftops.
Prioritizing among such options is inherently a multi-criteria decision problem that spans cost, energy savings and life-cycle environmental performance. Multi-Objective and Multi-Criteria Decision-Making (MCDM) methods are therefore appropriate because they transparently synthesize heterogeneous evidence and stakeholder preferences into robust rankings [29–31]. The literature on MCDM in energy planning is extensive, yet many studies rely on a single method (e.g., only TOPSIS or only AHP), leaving results sensitive to the chosen technique [29,32]. To improve robustness, this work combines AHP (for stakeholder weights) with three complementary ranking methods (TOPSIS, ARAS and COPRAS) then aggregates them into an ensemble ranking, reducing method-specific bias and highlighting consensus options [31,33–36].
Urban and rooftop PV potential is increasingly documented by high-resolution GIS and machine-learning studies, which reveal large but uneven technical potential across building stocks [37,38]. The main sources of uncertainty arise from shading, tilt and azimuth distributions, the fraction of roof area that is practically usable for modules deployment, and the quality and resolution of input data [12–14,39,40]. In the Mediterranean area, winters are usually mild but, in summer, the abundant solar irradiance not always coexists with peak cooling demand, which strengthens the need for on-site PV combined with storage and demand-side flexibility in order to improve energy self-consumption and reduce peak exports [9,10,41,42].
Studies that compared fixed vs. tracking PV indicate that tracking can increase plane-of-array irradiance and annual yield, although the magnitude is site specific and also dependent on cloud presence [15]. However, these gains are often limited by larger row spacing on constrained roofs, higher capital costs, and additional operations and maintenance requirements and costs. Therefore, the reported performance improvements range from marginal in sunny coastal locations to substantial in cloudier regimes, with local constraints influencing the net benefit on rooftop systems [15–18,43].
Energy storage is a common means to improve energy efficiency in the building sector and different typologies have been studied in the last years [41,42]. Existing literature studies about residential PV-battery performance show in a consistent way that batteries increase self-consumption and can mitigate the evening energy demand peaks when storage is sized considering the daily load from building systems and appliances and the PV energy production profile [23,26,44,45]. However, optimal energy storage capacities are also dependent on electricity tariffs and incentives, as well as on the quality of the energy production forecast method and system controls, which together shape the feasibility, the economic attractiveness, and the operational impact of these systems in the residential sector [23–26].
When coming to wind energy generation, several studies that investigated urban small wind applications highlight that vertical-axis wind turbines (VAWTs) are more tolerant of multidirectional, turbulent flows than horizontal-axis wind turbines (HAWTs), but achievable yields in dense city environments remain highly site-specific and often modest [21,22]. For these reasons, energy and financial projections, careful micro-siting, and structural and acoustic considerations are essential when assessing the viability of building-mounted wind systems [19–22].
For the management of the decision process, multi-criteria decision-making for renewable-technology selection is well established in sustainable energy planning [46–48]. Several comparative reviews, indeed, document widespread use of AHP for weighting and compensatory ranking methods such as TOPSIS, ARAS and COPRAS for the prioritization of the possible design alternatives [31,32,35,36]. Furthermore, multiple recent studies also emphasize that the simultaneous application of more than one MCDM method improves decision, robustness, credibility, and stakeholder acceptance in contrast to the application of single-method frameworks, especially when criteria are heterogeneous and trade-offs are pronounced [29,30,33,34].
The objectives of this study are to:
• Model a real Mediterranean residential case in Naples, explicitly framing the building owner as the decision-maker.
• Quantify performance for roof-deployable renewable energy alternatives under realistic roof-use constraints, including:
∘ fixed-tilt PV,
∘ single-axis tracking PV,
∘ dual-axis tracking PV,
∘ small vertical-axis wind turbines (VAWT), each with and without lithium-ion storage.
The assessment covers economics (CAPEX), energy performance (generation, self-consumption, demand reduction), and life-cycle environmental impacts (embodied/avoided/net avoided emissions).
• Rank the alternatives using AHP criteria weights, a multi-method MCDM workflow (TOPSIS, ARAS, COPRAS) and a consensus (ensemble) ranking based on Borda aggregation.
Key innovations can be summarized as follows:
• The study adopts a building owner centered decision perspective specifically suited to Mediterranean residential buildings, where cooling-dominated seasonal demand can reduce the effectiveness of PV-only solutions when storage is not included.
• The rooftop renewable layouts are modelled under realistic installation conditions, explicitly accounting for usable roof area, setbacks, shading and spacing constraints, and the clearance needed for maintenance access.
• The decision-support framework is strengthened by combining multiple MCDM methods with a final ensemble ranking, which helps to reduce the method-dependent bias and makes the final prioritization more robust.
The methodological workflow adopted in this study is summarized in Fig. 1. The figure shows step-by-step the process adopted in this study. The workflow can be summarized as follows:
1. The energy model of the case-study building is created (geometry, envelope, zoning, internal gains, schedules, HVAC systems) for the dynamic energy simulations. Model inputs are organized so they can be reused across scenarios.
2. Economic, energy, and environmental analyses are performed for each investigated design alternative of the RE rooftop system, as follows:
∘ The dynamic energy simulation generates hourly end-use loads and on-site generation profiles for each RE rooftop configuration.
∘ The economic analysis aggregates technology-specific financial aliquots (modules/turbines, inverters, structure/trackers, balance of system (BOS) and installation, batteries, EMS) into a total system cost.
∘ The environmental analysis quantifies embodied emissions (also considering components and replacements over lifetime) and avoided emissions (evaluated as lifetime energy generation (kWh) × grid emission factor), yielding net avoided emissions.
3. Pairwise comparisons on the three criteria (Total system cost [€], Energy consumption reduction [kWh], Net avoided emissions over lifetime [tCO2-eq]) and the application of the AHP method produce normalized weights that mirror the priorities of the analyzed stakeholder (building-owner).
4. The weighted decision matrix (composed by the performance scores of the evaluated alternatives under the three criteria considered in the study) is evaluated with TOPSIS, ARAS, and COPRAS MCDM methods.
5. The three method-specific rankings are combined into a final consensus ranking using the Borda rank aggregation approach. Mean rank and its standard deviation are also calculated to estimate the agreement across methods.
6. The ensemble ranking outcomes are interpreted and the most suitable rooftop configurations for the building owner are identified.

Figure 1: Workflow of the proposed framework (from residential building modeling to RE technology prioritization).
2.2 Building, HVAC and Renewable Energy Systems Simulation
The first phase of the methodological framework proposed in this study couples dynamic building-HVAC system and renewable energy generation simulation in a co-simulation workflow to produce hourly energy demand and supply profiles used to perform the economic, energy, and environmental assessments.
2.2.1 Building and HVAC System Energy
Energy simulations of the building-HVAC system are run with EnergyPlus [49] (a dynamic energy simulation engine widely tested and validated in the scientific community [50,51]) and use a typical meteorological year (TMY) weather file for Naples. The base timestep used for the dynamic energy simulations is 60 min with 6 warm-up days.
Thermal zones of the building are modelled following each apartment boundaries. Common spaces (stairs, landing) are considered as separate zones. Opaque structures of the building include exterior walls, roof deck, and intermediate slabs, while windows are modeled considering double-pane glazing and frames with thermal breaks. Thermal properties (U-values, solar-optical data) are aligned with local building stock. Occupancy schedules considered in the simulations follow a typical residential pattern (energy consumption peaks in the early morning and in the evening). Internal heat gains account for sensible and latent gains (people), lighting, and plug loads (appliances/ICT) dispersions. Also domestic hot-water (DHW) usage is scheduled with morning and evening peaks, following occupancy schedules. Infiltration uses a baseline air-change rate representative of the local stock (0.3 h−1). Thermostat setpoints are fixed to 20°C during the heating period and 26°C during the cooling period. No explicit demand-response strategies or dynamic setpoint setbacks are implemented in the model of the HVAC system controller. The thermostats are held at these values throughout the occupied periods, representing typical residential operation of the HVAC system. Space conditioning and DHW are served by electric heat pumps (air-source), with performance maps vs. outdoor/indoor conditions, part-load performance curves (PLF/PLR), defrost behavior, and auxiliary control logic. Fan-coil or ducted terminal units are modeled with supply air temperature control and autosized fans. DHW modeling includes storage tank stratification and heat-pump COP variation with inlet temperature. EnergyPlus outputs hourly electric demand by end-use (heating, cooling, DHW, lighting, appliances), used to compute total building electricity consumption and to interface with the storage and renewable energy dispatch described below. Energy consumption of the baseline case is detailed in the Section 3.
2.2.2 Rooftop Photovoltaic (PV)
Hourly building electricity demand is simulated in EnergyPlus and exported by end-use at a 60-min timestep. Renewable generation is simulated in Python and time-aligned to the EnergyPlus timestep. PV production is computed with pvlib (solar position, plane-of-array transposition, single-diode DC model, temperature model, and inverter conversion), while wind production is computed by correcting the weather-file wind speed to hub height and applying turbine power curve provided by the manufacturer. The co-simulation couples the hourly load with the calculated hourly PV or VAWT output and the battery dispatch described in Section 2.2.4 to obtain self-consumed energy, imports, and exports.
Three PV families are simulated on the case study building flat roof with maintenance corridors and setbacks (starting from ≈15% area for the fixed PV case) and technology-specific ground-coverage ratio (GCR) to avoid self-shading: fixed-tilt (35° south), single-axis tracking (north–south axis with backtracking), dual-axis tracking (pedestal mounts). Python PVlib computes solar position; plane-of-array irradiance uses a standard transposition model (Hay–Davies/Perez). Clear-sky and cloud-modified components are taken from the weather file; albedo of the surroundings is set to 0.2; a constant soiling factor is applied. The DC side uses a single-diode (CEC) model [52] with manufacturer parameters while the cell temperature is calculated from plane-of-array irradiance, wind and air temperature using the Faiman model [53]. The AC side uses a CEC/Sandia inverter model with a DC/AC sizing ratio set per configuration (checked to avoid curtailment in typical operation) [54]. Row-to-row shading is controlled via GCR. For single-axis and dual-axis tracking arrays, the solar position and tracker geometry are computed using the Python PVlib single-axis routine with backtracking enabled and a north–south horizontal axis oriented for the Naples latitude. Different ground-coverage ratios are chosen for the technologies investigated in order to avoid inter-row shading under backtracking and to preserve maintenance corridors. Fixed-tilt arrays use a higher GCR, while single-axis and dual-axis layouts employ progressively lower GCRs. For this reason, considering the same roof, PV solar trackers achieve higher specific yield (kWh/kWp) but lower installed power (kWp) than dense PV systems with fixed-tilt layouts. The number of modules varies in the same way since it is chosen under the same total roof area constraints. The PV simulation returns hourly AC energy generation for each PV alternative, aligned to the EnergyPlus timestep in order to allow the co-simulation with the building energy model.
2.2.3 Vertical-Axis Wind Turbines (VAWT)
Six VAWTs (with a capacity of 3 kW each) are placed along the edges of the considered roof with wake spacing (≈7–10 rotor diameters). The hourly wind at 10 m from the weather file is height-corrected to hub height with a logarithmic profile and urban roughness. The use of the manufacturer-type power curve (cut-in, rated, cut-out, part-load) yields hourly AC output.
2.2.4 Battery Storage and Dispatch
Li-ion storage is modeled with round-trip efficiency ≈92%, SOC bounds 10%–90%, and charge/discharge power limits based on a C-rate tied to the installed capacity.
Battery degradation is represented at an aggregate level: hourly dispatch assumes constant usable capacity within the SOC limits and constant round-trip efficiency, while lifetime battery-pack replacements are accounted for in both the economic and environmental analyses. For each configuration, an 80% state-of-health end-of-life criterion and typical cycle-life assumptions lead to two or three pack replacements over the analysis horizon. Two capacities (“small”, “large”) are assigned per renewable family (as defined in the Section 3).
A dispatch scheme that aims to maximize the self-consumption of the generated energy is applied at each timestep as follows: charge the batteries from on-site renewables when generation exceeds the building net load and the SOC is lower than the upper bound; discharge the batteries to meet the building load when renewables are insufficient and the SOC is higher than the lower admissible bound; export any residual energy surplus to the grid; electric energy imports from the public grid meet any remaining deficit.
To operate this logic, at each timestep of the co-simulation the following steps are performed:
1. the net surplus
2. if
3. if
4. any residual surplus is exported and any residual deficit is imported.
Round-trip efficiency and SOC bounds are enforced during the simulation. Alternative dispatch strategies (e.g., peak-shaving, time-of-use arbitrage, predictive MPC) are not compared in this work; the rule-based scheme is selected for transparency and consistency with the flat-tariff/no export-credit baseline.
This rule-based controller is equivalent to an objective of maximizing instantaneous self-consumption under a flat retail tariff with no explicit remuneration for exported energy. There are no additional export caps or penalties beyond technical inverter and battery limits, and no active curtailment is imposed other than that implicitly caused by DC/AC sizing and power/energy constraints. No feed-in tariff is credited in the base case (export is counted as zero revenue/benefit). Renewable generation (PV/VAWT) and battery dispatch are evaluated against the EnergyPlus load at each timestep; the resulting self-consumed energy determines the energy consumption reduction.
Detailed electrochemical degradation is not simulated hour-by-hour in this study. Instead, long-term battery performance is represented by accounting for battery-pack replacements over the project lifetime using an end-of-life state-of-health criterion (80%). Replacements are included consistently in both the economic inventory (CAPEX aliquots) and the environmental inventory (embodied emissions), while hourly dispatch uses fixed usable capacity within SOC bounds for operational accounting.
This co-simulation (EnergyPlus/Python PVlib + storage dispatch) provides time-resolved, physically consistent demand–supply interactions for each alternative, ensuring that the economic (CAPEX), energy (annual generation and demand reduction), and environmental (embodied/avoided emissions) results used in the multi-criteria analysis are grounded in the building physics and the local resource at Naples. The following KPIs are extracted from the simulations and used for the MCDM:
• The total system cost is the sum of the cost aliquots for each configuration.
• The energy consumption reduction (kWh) equals the annual energy demand covered by on-site renewable energy sources rather than by grid imports.
• The environmental metrics include embodied emissions (considering modules, trackers, BOS, inverters, and batteries with replacements over the stated lifetime), avoided emissions (lifetime generation × grid emission factor), and net avoided emissions (avoided − embodied).
Embodied emissions are obtained by multiplying the bill-of-materials of each configuration (modules, inverters, power electronics, support structures or trackers, BOS, VAWTs and Li-ion batteries) by component-specific greenhouse-gas emission intensities compiled from peer-reviewed PV LCA syntheses and battery production/home-storage LCA literature, complemented by European EPDs where available. The adopted boundary is manufacturing-focused (cradle-to-gate), i.e., it includes raw-material extraction, processing and manufacturing for the technologies installed on the Naples rooftop, consistently across all alternatives. This inventory is aligned with the technology “aliquots” already tracked in the economic breakdown (modules or turbines, inverters, structures or trackers, BOS, batteries, battery power electronics and EMS installation), ensuring that embodied impacts correspond to the same hardware scope used in the comparative assessment. PV manufacturing boundaries and reporting conventions follow established PV LCA review frameworks and harmonized guidance [55–58]. Battery embodied impacts are treated consistently with battery LCA evidence highlighting sensitivity to manufacturing energy mix and lifetime/replacement assumptions [59–61].
Component replacements are included when component lifetime is shorter than the project lifetime. In particular, battery-pack replacements over the analysis horizon (as described in Section 2.2.4) are accounted for by adding the embodied impacts of replacement packs to the embodied-emissions total, and power-electronics replacements are included. Transport impacts are not modeled as separate terms. Instead, they are considered implicitly when the selected literature factors/datasets already include typical upstream logistics and delivery to site, while construction-related civil works (e.g., roof reinforcement), routine O&M (e.g., cleaning), and end-of-life processes (recycling/landfill and any credits) are not explicitly modeled. End-of-life modeling can affect absolute values (especially for batteries) therefore it is identified as a refinement for future work. However, adopting a consistent boundary across all alternatives preserves comparability for ranking purposes [59,61]. Avoided emissions are computed as lifetime electricity generation multiplied by the baseline Italian grid emission factor adopted in the study, and net avoided emissions are calculated as avoided minus embodied.
2.3 Multi-Criteria Decision-Making
This study adopts a multi-criteria decision-making (MCDM) framework to rank rooftop renewable energy system alternatives against three, partially conflicting criteria: total system cost (cost criterion), energy consumption reduction (benefit criterion), and net avoided emissions over lifetime (benefit criterion). Furthermore, the proposed MCDM workflow allows to evaluate simultaneously these multiple performance metrics considering the priorities of a building owner (economic affordability, operational savings, and lifecycle environmental performance).
The procedure can be summarized as follows. First, after the performance assessment of each alternative, a decision matrix is assembled from the outputs (see Sections 4.1–4.3), with rows representing the design alternatives and columns representing the criteria. Second, stakeholder weights are derived applying the Analytic Hierarchy Process (AHP), which encodes the owner’s preferences via pairwise comparisons and verifies judgment consistency. Third, the following three different MCDM techniques are applied to the same weighted matrix for the prioritization task:
• Technique for Order of Preference by Similarity to Ideal Solution (TOPSIS), a distance-to-ideal method that ranks alternatives by proximity to a positive ideal (best on all criteria) solution and remoteness from a negative ideal (worst on all criteria) solution (Section 2.3.2).
• Additive Ratio Assessment (ARAS), an additive, utility-based method that compares each alternative to an ideal (aspiration) solution after column-sum normalization (Section 2.3.4).
• Complex Proportional Assessment (COPRAS), a proportional significance method that aggregates benefit and cost parts explicitly through separate sums (Section 2.3.5).
The three methods are selected because they apply different aggregation logics: geometric distance (TOPSIS), additive (ARAS), and proportional (COPRAS). Considering the outcomes of different approaches reduces method-specific bias. Furthermore, to ensure comparability of the results across methods, the following steps are adopted in all the approaches:
1. The total system cost is treated as a cost criterion (to be minimized) while the other two are considered benefit criteria (to be maximized).
2. Normalization of the decision matrix elements is provided in order to prevent scale effects due to heterogeneous units and magnitudes across criteria. However, each method applies its standard normalization technique (vector normalization for TOPSIS and column-sum normalization for ARAS and COPRAS).
3. The AHP weights obtained for the building owner are applied after normalization according to the procedure prescribed by each method.
4. Sensitivity to small weight changes is checked to confirm ranking stability.
The rankings obtained from the three methods are later compared and, for decision robustness, aggregated into an ensemble ranking, while keeping each method’s result available for the stakeholders.
TOPSIS uses vector normalization, while ARAS and COPRAS use column-sum normalization (with cost handled as a minimization criterion). Because the final ensemble is computed by aggregating ordinal ranks (Borda positional rule), the ensemble step is scale-free and does not require further cross-method score normalization. In case of equal Borda sums, ties are resolved by the best (minimum) rank achieved across the individual methods. If the tie persists, the second-best rank is used and if needed, the third-best rank is used.
In addition to the baseline normalization choices (vector normalization for TOPSIS and column-sum normalization for ARAS and COPRAS), a min–max normalization variant is tested. Lastly, a weight-sensitivity analysis is also carried out by perturbing each AHP weight by ±20% while preserving the order of importance between the three criteria, and by considering an equal-weight scenario.
The Analytic Hierarchy Process (AHP) is a well-established MCDM method defined by Saaty in the 1970s [62,63]. AHP is commonly adopted to estimate relative criterion weights when comparative judgments between the relevant decision criteria are available. A key advantage of this method is that it can handle quantitative and qualitative criteria within a single coherent framework. Criterion importance is elicited through pairwise comparisons, in which the Decision Maker (DM) expresses subjective preferences by judging how much one criterion dominates another, using verbal expressions (equal importance, slight preference of one over another, etc.). These DM judgments are mapped to numerical intensities using Saaty’s fundamental scale [64]. In this study, AHP is employed to compute the weights of the criteria considering verbal judgements that map the preferences of a DM identified with the building owner.
The statements of the AHP pairwise comparison procedure such as “criterion A is strongly more important than criterion B” and the corresponding values on the 1–9 scale are reported in Table 1. Ultimately, pairwise comparisons are used to set priorities while the final weights that reflect the DM’s stated preferences are used in the subsequent steps of the MCDM procedure.

The pairwise-comparison stage produces a reciprocal square matrix
The normalized criterion weights are then calculated as:
so that:
Once the normalized weight vector
The Consistency Index (CI) is defined as:
Saaty also provides a Random Consistency Index (RI) (Table 2) used to form the Consistency Ratio (CR) [62,63,65].

Consistency Ratio
When
The Technique for Order of Preference by Similarity to Ideal Solution (TOPSIS) is a compensatory MCDM method originally proposed by Hwang and Yoon (1981) [66] and subsequently extended in later works [67,68]. TOPSIS ranks alternatives by comparing each option to two reference solutions: a positive ideal solution (best attainable performance) and a negative ideal solution (worst attainable performance). Example applications can be found in [69], and the method has also been used to evaluate building-roof performance against sustainability targets [70].
The underlying principle is that the preferred alternative should be closest to the positive ideal and furthest from the negative ideal in terms of geometric distance. Since TOPSIS is compensatory, weak performance in one criterion may be partially offset by strong performance in another.
Let
The normalized matrix
The positive ideal alternative
The negative ideal alternative
Next, the Euclidean distance of each alternative
Finally, the relative closeness (preference score)
Alternatives are ranked in decreasing order of
2.3.3 Data Preprocessing for ARAS and COPRAS Application
Before applying ARAS and COPRAS, the decision matrix was preprocessed to handle criterion orientation and non-negativity requirements consistently. Total system cost is the only minimization criterion. For ARAS, the cost criterion was converted into a benefit-type variable through reciprocal transformation, i.e.,
where:
In the present case, this shift affects only the column of net avoided emissions and does not alter the ordering of alternatives on that criterion.
The Additive Ratio Assessment (ARAS) method is a MCDM technique proposed in 2010 by Zavadskas and Turskis [71]. ARAS evaluates and ranks alternatives by comparing them to an ideal alternative, considering both beneficial and non-beneficial criteria. This method is efficient and straightforward, making it appropriate for different decision-making problems, like those faced in the management of infrastructures and buildings [72,73].
In this study, ARAS is applied after the preprocessing described in Section 2.3.3. In particular, the cost criterion is transformed through reciprocal conversion
Let
The extended matrix is then normalized by column sums:
Each normalized value is multiplied by the corresponding criterion weight:
The optimality function of each alternative is:
and the relative utility degree is calculated as:
where
The Complex Proportional Assessment (COPRAS) method was proposed in 1994 by Edmundas Kazimieras Zavadskas, Antanas Kaklauskas, and Vaidotas Sarka. COPRAS method evaluates alternatives by separately accounting for benefit and cost criteria and then combining them into an overall significance measure. It is particularly suitable when the decision problem includes both criteria to be maximized and criteria to be minimized [67,68].
In this study, COPRAS is applied to the preprocessed decision matrix described in Section 2.3. The benefit set is
Let
The weighted normalized matrix is then obtained as:
For each alternative
The relative significance of each alternative is then calculated as:
Alternatives are ranked in descending order of
The case study is a multi-family residential building located in Naples, Southern Italy (Mediterranean climate, Köppen Csa). When considering the typical weather of Naples, the city experiences mild, wet winters and hot, dry summers. The mean annual outdoor air temperature is approximately 17.4°C, with winter minima around 4°C–6°C and summer maxima often exceeding 30°C–32°C. The city is characterized by 1034 heating degree days (base 20°C), and near 550 cooling degree days (base 26°C). These values highlight the dual demand for heating and cooling, with a higher cooling loads compared to northern Italian climates.
The building plan is rectangular with external dimensions of 25 m × 16 m, corresponding to a gross footprint area of 400 m2 (see Fig. 2). The building consists of five floors with three apartments per floor, for a total of 15 dwellings. The total gross floor area, therefore, reaches 2000 m2 (400 m2 × 5 floors). Each apartment has an average net floor area of approximately 120 m2 and a story height of 3.30 m, corresponding to a total volume of about 6600 m3.

Figure 2: 3D view of the residential building energy model—typical floor.
Three apartment typologies are present in the building. Apartment type “a” includes a corridor, a kitchen, a living room, two bedrooms, and two bathrooms. Apartments type “b” and “c” each include a corridor, a kitchen, a living room, two bedrooms, and a single bathroom. The building roof area coincides with the footprint, i.e., 400 m2 (i.e., almost 100% of the roof is potentially exploitable for renewable energy harvesting). The thermal characteristics of the building envelope comply with the Italian regulations. The thermal transmittance values of the external envelope elements are 0.30 W/m2 K for the outer walls, 0.29 W/m2 K for the roof, 0.36 W/m2 K for the ground floor and range from 1.62 to 1.80 W/m2 K for the windows.
The building is fully electrified and equipped with high-efficiency heat pumps for space heating, cooling, and domestic hot water (DHW) production. LED lights are modeled in all the apartments and typical residential appliances and plug loads are considered. The annual electricity consumption of the whole building is 41,666 kWh, corresponding to an average of near 2780 kWh per apartment or about 20.8 kWh/m2 per year.
The resulting electric energy demand is divided by end-use as follows (see also Table 3 and Fig. 3):
• Heating: 7786 kWh (19%)
• Cooling: 11,120 kWh (27%)
• DHW: 6750 kWh (16%)
• Lighting: 4399 kWh (11%)
• Appliances and plug loads: 11,611 kWh (28%)


Figure 3: End-use electricity breakdown.
This reflects the influence of Naples’ climatic conditions, with cooling loads prevailing over heating demand, and a balanced contribution of appliances and DHW to total energy use. The relatively low lighting share demonstrates the effect of LED adoption, while the modest specific energy use is compatible with the energy efficiency of high-performance heat pumps in the Mediterranean climate.
The rooftop renewable energy system alternatives were defined to represent the main technologies that can be deployed on a 400 m2 flat roof in Naples. The systems are designed to highlight the key design trade-offs relevant to a residential users showing an energy demand characterized by morning and evening peaks (Table 4). Each option has been dimensioned to maximize the exploitation of the available roof area while preserving maintenance access. Specifically, ~15% of the roof were reserved for perimeter setbacks, maintenance corridors and inverter and BOS equipment location. Technology-specific ground-coverage ratios (GCR) were applied to mitigate self-shading. This yields the following total capacities of the deployable systems:
• Fixed-tilt PV system (~35° S-facing): ~45 kWp (≈100 modules × 450 Wp).
• Single-axis tracking PV system (N–S axis with backtracking): ~27.5 kWp (≈61 modules).
• Dual-axis tracking PV system (pedestal mounts): ~19.4 kWp (≈43 modules).
• Vertical-axis wind turbines (VAWT): 18 kW total (6 × 3 kW) spaced to limit wake interactions and to keep the system units at roof edges.

In order to highlight the impact of the implementation of energy storage solutions in residential building operation and to test the value of the resulting flexibility, each PV technology includes no-storage, small storage, and large storage variants. In the same way, also the wind technology includes the same variants. Battery capacities are chosen proportionally to array power and expected surplus, as follows:
• Fixed PV system (45 kWp) battery: 70 kWh (small) and 210 kWh (large).
• Single-axis PV system (27.5 kWp) battery: 45 and 125 kWh.
• Dual-axis PV system (19.4 kWp) battery: 50 and 100 kWh.
• VAWT system (18 kW) battery: 55 and 110 kWh.
All PV layouts were sized under the same roof constraints: perimeter setbacks and maintenance (≈15% of roof area reserved), plus technology-specific ground-coverage ratios to limit inter-row shading. Tracking layouts require wider spacing and clearance for backtracking and access, which reduces deployable system capacity relative to fixed-tilt on the same roof. These constraints are enforced during sizing and explain why tracking increases specific energy yield (kWh/kWp) but can reduce the total annual energy production (kWh) per roof.
This scaling is sufficient to capture most midday PV surplus (and irregular wind surpluses) in the small-storage case, and to substantially reduce exports in the large/double-storage case, without oversizing the battery relative to the resource.
The bill-of-materials of each configuration (modules, inverters, support structures/trackers, BOS, VAWTs, and Li-ion batteries) is multiplied by component-specific greenhouse gas intensities gathered from current life cycle assessments and Environmental Product Declarations for European PV and storage technologies to determine embodied emissions [55].
To derive decision weights over the three evaluation criteria (total system cost [€], energy consumption reduction [kWh], and net avoided emissions over lifetime [tCO2-eq]) the Analytic Hierarchy Process (AHP) is applied using Saaty’s 1–9 fundamental scale and a reciprocal pairwise comparison matrix. In line with an owner’s priorities, cost is judged moderately more important than energy reduction and strongly to very strongly more important than lifecycle climate benefit. Energy consumption reduction, instead, is judged moderately more important than net avoided emissions. The resulting comparison matrix is reported in Table 5.

The principal eigenvector gives the normalized weights 0.655, 0.250, and 0.095 for cost, energy reduction, and net avoided emissions, respectively (Table 6). The corresponding principal eigenvalue is λmax ≈ 3.02, which also provides a consistency index

The obtained AHP weight vector represents, therefore, a private building owner in a Southern European context that strongly prioritizes the reduction of the investment cost of the retrofit intervention with respect to the other performance criteria. In similar settings, indeed, upfront investment typically represents a strong barrier to the building energy efficiency improvement and it often dominates the decision-making phase, while bill savings and lifecycle climate considerations are still valued but play a secondary role. To investigate the impact of variations in the relationship between the analyzed criteria, the sensitivity of the obtained weights is also tested by modifying the calculated weights, as reported in Appendix A.
In this section the economic, energy, and environmental outcomes for all rooftop alternatives are reported together with the interpretation of the MCDM outcomes. The section is organized as follows. Section 4.1 reports the total system costs by technology and storage size (Table 7). Section 4.2 presents annual generation, self-consumption, and demand reduction (Table 8), reflecting the interaction between hourly building loads and on-site generation. Section 4.3 quantifies embodied, avoided, and net avoided emissions over the assumed lifetimes (Table 9). These indicators form the decision matrix for the stakeholder analysis: owner preferences are elicited with AHP, and the resulting weights pass the standard consistency check (CR ≤ 0.10), which is the commonly accepted threshold in AHP practice.


Section 4.4 reports the results of the renewable energy design alternative ranking obtained with three complementary MCDM methods: TOPSIS (distance to an ideal and anti-ideal), ARAS (additive utility comparison to an aspiration level), and COPRAS (proportional assessment of benefit and cost parts). The sub-section concludes providing a comparison of the method-specific and the ensemble (Borda) aggregation rankings to highlight consensus options and method sensitivities, improving robustness relative to the application of a single MCDM technique.
The outcomes of the application of the whole framework are finally discussed and interpreted in the Mediterranean context of Naples, where strong solar resources and summer cooling loads shape technology performance and sizing trade-offs like roof coverage vs. spacing for trackers, and the role of batteries in shifting PV output toward evening demand (Section 4.5). This climatic setting is well documented and offers the possibility of providing a useful comparative assessment of the irradiance levels for rooftop PV, the potential for on-site generation, and the design of rooftop renewable energy systems under urban constraints.
The breakdown in Table 7 shows the economic performance outcomes of all the analyzed RES combinations providing both the partials and the totals calculated as the sum of the sub-system aliquots (modules or turbines, inverters, fixed structure or trackers, BOS & installation, battery pack, battery inverter and charge-regulator, EMS and battery installation). The table shows that Fixed-tilt PV (A1) exhibits the highest absolute CAPEX among PV-only options (54,000€) due to the higher installed capacity. Adding energy storage systems further increases the total cost proportionally to battery size (A2: 86,000€; A3: 145,800€). Single-axis (A4–A6) and dual-axis (A7–A9) PV system design alternatives present higher structure/trackers costs but lower aliquots for the other cost components when compared to fixed-tilt, mainly due to lower installed capacity and higher mechanical complexity of the system. The VAWT alternatives (A10–A12) show higher costs per installed capacity when compared to PV solutions, mainly due to the small-turbine hardware, installation, and structural needs typical of urban settings.
Comparing the results obtained for the analyzed alternatives, two patterns are notable. First, the battery pack is the dominant cost adder for hybrid options. These costs, together with the ones due to battery-related components (charge-regulator, EMS & install) account for the delta between “PV-only” and “PV+storage” alternatives. Second, although dual-axis hardware is costlier per installed capacity than fixed-tilt, the smaller nameplate capacities of the systems that can be actually deployed due to the constrained roof circumstances keep the total CAPEX comparable or even lower with respect to single-axis. Compared to similar systems, the resulting cost totals fall in ranges for Italian/EU mid-size rooftops: PV-only systems here cluster around 1200–2100€/kWp, and batteries around 400–500€/kWh installed when all BOS and EMS are included, which is consistent with recent European market reports.
The total system cost is interpreted as an undiscounted capital expenditure (CAPEX) indicator in EUR (€), obtained by summing all visible cost aliquots in Table 7 (modules or turbines, inverters, structures and trackers, BOS & installation, batteries, battery charge regulator, and EMS & battery installation). No financing structures, tax effects or escalating O&M are modelled, and a full net-present-value or levelized cost of energy is not computed. Because all alternatives are evaluated under the same financial treatment and the cost differences between alternatives are large, this CAPEX-based criterion is highly relevant for the comparative MCDM analysis presented here, while a discounted cash-flow or LCOE formulation is left for future work.
Table 8 compares the annual energy generation from rooftop systems, the obtained self-consumption factors, and the resulting building electric energy demand reduction. In this study, the availability of renewable energy generation does not interact with the HVAC system controls (no demand response, no RES-driven setpoint adjustment). Therefore, the building subsystem electric energy use (heating, cooling, DHW, lighting, and appliances) is identical across alternatives. Instead, the fraction of that electric energy that is supplied by on-site generation and storage vs. grid imports is evaluated with an energy balance upon the results of the co-simulations. The following main findings emerge from the analysis.
• Tracking improves specific yield but not necessarily the total energy generation. Fixed-tilt (A1–A3) attains the highest annual energy generation (60.75 MWh/year), whereas single-axis (A4–A6) and dual-axis (A7–A9) deliver 46.75 MWh/year and 33.95 MWh/year, respectively. This counter-intuitive decrease when tracking technology is used is the effect of the roof space-constraint. Indeed, to avoid row-to-row shading and provide maintenance access, trackers require wider row spacing (implying lower GCR) and additional clearances. As a consequence, fewer panels fit on the same roof even though the specific energy yield per unitary PV capacity is higher. This is consistent with tracker design guidance that links backtracking and shading control to the array ground-coverage ratio (GCR). In the simulations, these effects arise directly from the tracking model described in Section 2.2.2, where single-axis and dual-axis arrays are implemented through the Python PVlib single-axis routine with backtracking enabled and technology-specific GCRs. The lower GCRs and the requirement to preserve maintenance corridors under backtracking reduce the deployable rooftop capacity for the tracking cases, so that the gain in specific yield is more than offset by the smaller installed capacity, leading to the lower annual energy generation per roof reported in Table 8.
• The presence of energy storage systems highly influences self-consumption and thus energy demand reduction. For each analyzed PV technology, the building electric energy consumption reduction increases markedly from “no storage” to “small” and “large” storage since batteries allow to shift the midday energy surplus to cover morning and evening peaks. For example, as shown in the table, the fixed-tilt system progresses from 43.7% (A1) to 94.8% (A2) and 97.7% (A3). The same pattern can be recognized for single-axis (A4–A6) and dual-axis (A7–A9) PV design alternatives. External comparisons, show that the magnitude of these gains is consistent with studies showing that coupling residential PV with batteries can significantly raise self-consumption, depending on battery size and load profile.
• For the analyzed case study, the implementation of a small wind system provides modest benefits. Indeed, the VAWT system (A10–A12) yields 9.45 MWh/year that is significantly lower than the PV alternatives. Even with storage, the energy demand reduction remains around 20%. This aligns with evidence that small urban wind often exhibits low-capacity factors and strong site dependence. Although the dependence on a different energy source (wind) with respect to PVs (sun) that allows to diversify the generation profile (e.g., by providing energy generation also during nights), this effect contributes fewer to the per area energy generation with respect to rooftop PV in this Mediterranean city. The results obtained in this case, however, do not exclude the presence of niche conditions under which rooftop VAWTs could become more attractive than in the present analysis. As an example, tall high-rise roofs or coastal escarpments with persistent, channeled winds, or architecturally integrated parapet-mounted turbines in favorable urban wind corridors may represent potential alternatives to the current deployment situation. In such situations, it is possible that higher capacity factors could be achieved, and the proposed workflow could be directly reused to reassess the relative performance of wind and PV options.
Overall, under the purely energetic point of view, large storage options have great impact on self-consumption. Indeed, A3 (fixed-tilt PV + large Li-ion battery) maximizes the energy demand reduction for fixed technology, while for the tracking systems A6 (single-axis tracking + large storage) reaches ~93%, and A9 (dual-axis tracking + large storage) achieves ~69%. As aforementioned, this downward trend is driven by the installed peak power (constrained by the roof size) rather than by the specific yield alone. For users prioritizing energy generation per roof area, dense fixed-tilt layouts generally outperform trackers on constrained rooftops because of their higher coverage ratios. However, tracking systems remain attractive where the area is not constrained. VAWTs with the large battery size instead achieve lower values of building energy consumption reduction (20%) mainly due to the low capacity factors.
Table 9 shows the results of the environmental analysis, including lifetime generation, embodied emissions, avoided emissions from electricity generation, and net avoided emissions over lifetime. Avoided emissions are calculated as lifetime generation multiplied by the adopted Italian grid emission factor, while net avoided emissions are obtained as avoided minus embodied emissions. The following assumptions can be made analyzing the outcomes of this analysis.
• PV-only options exhibit the largest avoided emissions over the lifetime due to the combination of considerable lifetime compensation of emissions with comparatively modest embodied footprints. Considering the study’s grid factor and lifetimes, the A1 alternative offsets ~395 tCO2eq over 25 years against ~47.6 tCO2eq of embodied ones. The net balance (avoided—embodied) is therefore strongly positive (~347 tCO2eq). Slightly lower results in net avoided emission over the lifetime are obtained by tracking PV technologies without energy storage. These results are in line with state-of-the-art applications that place the PV life-cycle intensities well below those of fossil fuels.
• When considering the addition of energy storage, the increase in embodied emissions is not compensated by the increase in self-consumption ratio and, therefore, reduces the net balance, especially at larger battery sizes and when the renewable energy generator is relatively small (e.g., dual-axis PV) or has low annual yield (VAWT). This is consistent with battery LCA literature, which reports that battery pack manufacturing footprints provide high embodied emissions, also depending on chemistry and supply-chain electricity mix.
• In the analyzed case study, the small wind system with large energy storage shows the weakest performance in this inventory. In the case of the A12 alternative, indeed, the avoided emissions (≈49 tCO2eq) are outweighed by the embodied emissions (≈85 tCO2eq) over the assumed lifetime, leading to a negative net balance. This outcome reflects the combination of modest lifetime generation typical of urban small wind and the embodied load of sizable battery capacity relative to delivered kWh.
The uncertainties related to some parameters of the analysis deserve attention. First of all, the obtained results scale with the carbon intensity of the displaced grid electricity. In this case, Table 9 applies a fixed emission factor, but Italy’s annual electricity carbon intensity varies by year and has changed in recent years, with a temporary increase in 2022 and a return to a downward trend thereafter. A higher grid factor would increase the avoided-emissions totals; a lower factor would decrease them.
Second, the PV and battery system embodied emissions are expected to evolve with supply-chain decarbonization and technology improvements. These oscillations could, therefore, lead to some variations in the results obtained, leading to shifts in the embodied emission values and consequently in the net avoided emissions over lifetime too.
4.4 Multi-Criteria Decision-Making Results
Considering the economic, energy, and environmental analyses the following insights can be withdrawn:
• If the objective is maximum building demand reduction and highest net avoided emissions, the fixed-tilt PV option with energy storage dominates in this case study because it has the highest installed capacity and produces the most annual energy.
• The single-axis PV system with storage offers higher specific energy yield and a flatter production profile that slightly helps self-consumption, but lower energy production due to smaller system size (due to constrained roof space) at a total cost and lifetime benefit between fixed and dual-axis.
• The dual-axis PV system and VAWTs contribute lower total energy production under the same roof constraints. When these systems are complemented with large batteries, their embodied emission additions weigh more heavily against avoided emissions leading to higher environmental impact over lifetime. For wind, this is mainly due to urban resource limits, instead for dual-axis, it reflects the space penalty of trackers on rooftops.
However, since a clear preference cannot be expressed also due to the highly different costs of the analyzed solutions, in order to provide a prioritization of the different system technologies, the MCDM approach described in the previous section is applied with the following results (Fig. 4).

Figure 4: Ranking comparison across methods (TOPSIS, ARAS, COPRAS).
Analyzing the results of the decision process, all three methods favor low-cost PV options given the owner’s weight profile (cost dominates due to the high 0.655 weight). However, they differ on how much they reward additional energy and emission performance:
• TOPSIS method ranks A5 first, followed by A4 and A1. This method emphasizes closeness to an ideal solution that combines low cost with good energy and environmental performance. With the considered weights, A5 reaches the best balance under this method: a moderate cost (63,050€) paired with an energy consumption reduction equal to 31.8 MWh/y and ~235 tCO2e net lifecycle benefit under the standpoint of emissions, so it sits closest to the (low-cost, high-benefit) ideal.
• ARAS and COPRAS both rank A7 first (dual-axis PV without storage). Analyzing this result, it can be deduced that these additive, proportion-based MCDM techniques tend to reward the very lowest cost alternative more strongly when cost has a highest weight, while still accounting for the (moderate) benefits of A7. Consequently, the A7 alternative edges out A4 and A1 in ARAS and COPRAS, whereas TOPSIS prefers A5 for its better “all-round” proximity.
The alternatives A8 (dual-axis + small storage) and A2 (fixed + small storage) appear consistently in the upper middle. These design solutions carry noticeable cost adders for batteries but deliver large increments in energy reduction, so they remain competitive under TOPSIS and still respectable in ARAS and COPRAS rankings.
Large-battery and small-wind options (A3, A6, A9–A12) generally fall to the bottom of all the analyzed rankings. Indeed, since a cost-heavy weight set is considered, the embodied cost of larger storage and the lower energy production for wind penalize these alternatives.
Under the chosen weights, the best value options are low-CAPEX PV systems, with or without a small energy storage system. If the stakeholder wishes to favor energy savings and lifecycle environmental impact more (and cost less), the rankings can shift upward for the alternatives A5/A2/A8 and downward for pure low-cost options like A7. This can be tested in future studies considering different stakeholders.
In Table 10 it is reported the ensemble ranking obtained by aggregating the three single-method rankings (TOPSIS, ARAS, COPRAS) with a positional rule (Borda count), while in Fig. 5 the average rank and its standard deviation for each alternative are shown. The consensus ranking places the design alternative A7 (dual-axis PV) first, followed by the alternatives A4 (single-axis PV), A5 (single-axis PV + small battery) and A1 (fixed-tilt PV). These four options also consistently appear near the top across all the individual MCDM methods, and the ensemble ranking reflects this high overall priority for the building owner. The figure confirms a high level of cross-method agreement for the alternatives A4 and A1 (standard deviation ≈ 0), whereas A7 and A5 exhibit a slightly larger (but still modest) dispersion due to the aforementioned method–specific differences.


Figure 5: Ensemble ranking: average rank with standard deviation (consensus view).
Mid-table options, i.e., alternatives A8 (dual-axis + small battery) and A2 (fixed-tilt + small battery), retain competitive positions. These show a higher CAPEX than their storage-free counterparts but deliver larger energy reductions due to the presence of storage. The ensemble ranking balances these trade-offs under the owner’s cost-dominant weights. In contrast, design variants with large batteries (A6, A9, A3) and all VAWT configurations (A10–A12) remain in the lower half of the ranking. Under the adopted weights (financial performance preferred with respect to energy one, and energy performance preferred with respect to environmental one), the incremental benefits of large storage systems and small wind are not sufficient to compensate for their higher total system costs and indeed all three MCDM methods consistently penalize these.
The obtained ensemble ranking is useful to interpret method-specific divergences. TOPSIS favors A5 for its proximity to a low-cost/high-benefit ideal, whereas ARAS and COPRAS prioritize A7 as the lowest-cost PV option among PV tracker alternatives. By combining the outcomes obtained with the three methods, the ensemble ranking tempers these differences and yields a compromise final prioritization order. Performing a rank aggregation to combine multiple MCDM outputs, therefore, allows to improve the robustness of the final choice. The method used (Borda) is, indeed, widely used for this purpose since it leads to results easily interpretable by decision-makers.
In order to quantify the concordance between the three MCDM methods, the Kendall’s tau and the Spearman’s rho coefficients were computed between the TOPSIS, ARAS and COPRAS rank vectors reported in Table 10. The resulting 3 × 3 correlation matrices are shown as heatmaps in Fig. 6. Kendall’s tau lies between approximately 0.70 and 1.00, while Spearman’s rho is between approximately 0.88 and 1.00, indicating strong agreement across methods, particularly for the top-ranked alternatives. In pairwise terms, 0–10 discordant pairs occur out of 66 possible pairs, and the main divergence concerns the difference between TOPSIS and the ARAS/COPRAS pair. In particular, ARAS and COPRAS favor the lowest-CAPEX tracker case, whereas TOPSIS favors a more balanced small-storage PV case. Under the weight perturbations discussed above (±20% on each AHP weight), the Borda ensemble ranking does not flip the group of top four options, although some mid-ranked alternatives permute slightly.

Figure 6: Correlation matrices between different rankings: (a) Kendall’s tau and (b) Spearman’s rho.
To complement the correlation heatmaps (Fig. 6), pairwise disagreement between the ranking methods using the Kendall distance is reported in Fig. 7, i.e., the number of discordant alternative pairs (rank inversions) between two methods. As shown in Fig. 7, disagreements between the MCDM methods are limited: TOPSIS vs. ARAS and TOPSIS vs. COPRAS each exhibit 10 discordant pairs out of 66 possible pairs, whereas ARAS vs. COPRAS exhibits no discordant pairs. These values correspond to Kendall’s τ coefficients of approximately 0.70, 0.70, and 1.00, respectively, consistent with the strong cross-method agreement observed in Fig. 6. The observed divergences are mainly driven by differences in aggregation logic under the cost-dominant weight set. ARAS and COPRAS methods, indeed, tend to reward very-low-CAPEX PV options more strongly, whereas TOPSIS method tends to favor alternatives that are closer to a “balanced” low-cost/high-benefit ideal design solution (e.g., a small-storage PV option).

Figure 7: Pairwise disagreement between TOPSIS, ARAS, and COPRAS rankings quantified as Kendall distance (number of discordant alternative pairs) out of 66 possible pairs for the 12 analyzed alternatives. The corresponding Kendall’s
In summary, Table 10 and Fig. 5 show that, for a building owner who values total system cost most, low-CAPEX PV solutions dominate the decision space, with small storage providing a favorable performance improvement but at a higher cost. The ensemble ranking consolidates the outcomes of the different individual methods into a compromise preference order also evidencing areas of strong consensus (A4, A1) and moderate method sensitivity (A7, A5), thereby strengthening the robustness of the final decision recommendation.
To further test the robustness of these findings, a min–max scaling variant is tested and also a sensitivity analysis is conducted in which each AHP weight is perturbed by ±20% while preserving the order of importance, i.e., financial performance preferred with respect to energy one, and energy performance preferred with respect to environmental one. Across these scenarios, the ensemble ranking consistently retains the same group of alternatives (low-CAPEX PV configurations with and without small storage) as the top ranked ones while large-storage options move up only modestly. Although a full probabilistic treatment of weight uncertainty is beyond the scope of this study, these sensitivity outcomes indicate that the main conclusions of the MCDM analysis are not an artefact of a single weight set.
In addition to the ±20% perturbation, a sensitivity analysis upon the decision-maker weights is also performed by using the following two additional weight vectors: an equal-weights case and a less cost-dominant case. The resulting ensemble ranks are reported in Appendix A (Table A1) to show how ordering changes when the cost dominance is relaxed. Furthermore, a sensitivity analysis of the ensemble ranking to grid carbon intensity and battery embodied emissions has been performed and reported in Appendix B (Table A2).
It is also important to notice that the financial portion of the decision matrix is built under a simplified tariff representation with no explicit remuneration for the electric energy exported to the public energy grid and without a specific time-of-use price differentiation. Under dynamic tariffs with large on/off-peak spreads, capacity charges, or substantial export compensation, the relative economic performance of storage-enhanced options would improve, and the MCDM ranking could shift towards alternatives with larger batteries and higher self-consumption.
It should also be noted that, although the VAWT alternatives (A10–A12) are underwhelming for the specific Naples rooftop considered in the present investigation, this outcome should be interpreted as site-dependent, because small urban wind yields are strongly affected by shielding, turbulence intensity, and roof-level recirculation in the built environment [20–22]. Rooftop wind can nonetheless become viable under more favorable aerodynamic and climatic conditions, especially when the installation is: on exposed coastal high-rise buildings or seafront ridges, on isolated towers protruding above the surrounding urban canopy, at roof-edge or corner acceleration zones where local speed-up can occur, or on buildings aligned with persistent wind corridors and limited upstream obstruction [74–76]. However, even in these favorable contexts, the performance of these systems depends critically on turbulence intensity, vertical wind shear, and flow separation over the roof, which can increase fatigue loading and reduce net energy capture, particularly for small turbines operating close to the rooftop turbulence layer [20–22,77]. For these reasons, rooftop wind deployment should be preceded by micro-siting (exact placement and hub-height selection) supported by short-term on-site measurements and/or CFD-based resource verification (better if validated against rooftop measurements), rather than relying exclusively on bulk meteorological wind data [14,78]. Detailed numerical and field-oriented studies further show that hub height and building geometry can reshape rooftop velocity fields, while turbulence and clearance can materially affect rooftop VAWT performance, reinforcing the need for site-specific verification before technology selection [77,79,80].
Comparing the results obtained in the present study with the existing literature, beyond deterministic MCDM applications, recently also probabilistic and robustness-oriented frameworks have been proposed for the sizing and planning of building-integrated and rooftop PV storage systems, using stochastic reliability indices or scenario-based optimization to account for uncertainty in irradiance, load and market conditions [55,81]. These studies show that explicitly representing variability can influence the preferred PV and storage configurations. In this context, the present work focuses on a Mediterranean multi-family archetypical building and combines detailed building-HVAC-RES simulation with a multi-method and ensemble based MCDM approach that is easy to understand for stakeholders (thanks to the single final aggregated consensus rank) and easily extendable to probabilistic inputs in future developments.
4.5 Benchmarking against Recent Mediterranean and European Evidence
In this section, the results of the building-HVAC system analysis and the integration of renewable energy sources, are benchmarked against recent European and Mediterranean studies to compare the obtained performance indicators with previous studies.
Considering the simulated PV specific yields for Naples, these are within the ranges that are typically reported for Mediterranean or Southern European rooftop PV systems in the literature. The simulated self-consumption factors are also consistent with recent European and Mediterranean evidence for residential prosumers. In this study, PV-only configurations yield self-consumption rates of about 30%, while coupling PV with batteries increases these self-consumption shares to 65%–85% depending on storage size and operating strategy. Comparable studies in the Italian residential sector also show that self-consumption can decrease markedly when PV size becomes large relative to household demand. In Lazzeroni et al., for example, the self-consumption of a 6 kWp PV system without battery falls to about 13%–18% in the 2700 kWh/y demand case and to about 19%–27% in the 4000 kWh/y demand case, while adding battery storage raises it to about 25%–29% and 30%–36%, respectively, highlighting the sensitivity to the ratio between PV system capacity and building load magnitude and also to the availability of energy storage devices [82]. In another Italian domestic prosumer sizing study, a PV–BESS configuration of 6 kW peak power plus 7 kWh battery achieves ≈59% self-consumption, and PV–battery configurations typically reach ≈51%–60% under economically viable conditions [83]. A further Mediterranean case study analysis that combined PVs with an electric heat-pump based HVAC system reports self-consumption increasing from ≈34% (baseline PV system without an electric energy storage) to ≈69% when an electric energy storage device is included in the analysis, closely matching the upper end of the range obtained in the present study [84]. For a high-performance nZEB in Sicily, Causone et al. report that coupling the rooftop PV system with a 15 kWh battery increases self-sufficiency to about 83%, compared with about 45% in the case without battery storage [85]. These outcomes are consistent with the demand coverage achieved by the fixed and single-axis PV plus energy storage options in the present case study in Naples (alternatives A2–A3 and A5–A6), and with broader European ranges for PV-battery self-consumption reported in the literature. These comparable outcomes support the reliability of the simulated operating scenarios and the resulting MCDM rankings for the chosen system design configurations that are differentiated by on-site utilization of PV generation.
Considering instead the environmental impacts, the embodied-emission intensity calculated for the fixed-tilt PV alternative in this study lies within the ranges achieved by residential rooftop crystalline-silicon systems assessed for Europe by IEA PVPS Task 12, which estimates similar values for current installations and lower values under decarbonized supply-chain scenarios [56]. This comparison suggests that both the operational (self-consumption) and environmental (net avoided emissions) performance levels found in this study for the Naples multi-family building are in line with independent empirical and LCA evidence for European residential PV-battery systems. Recent European analyses of rooftop PV systems report life-cycle carbon intensities on the order of tens of gCO2-eq/kWh for PV electricity (e.g., ~36 gCO2-eq/kWh for optimally oriented rooftop PVs in Europe), consistent with the low environmental impact of PV-only configurations found here [86]. Adding batteries to the PV system configuration leads to an increase of the life-cycle intensity due to the fact that the energy storage devices introduce additional embodied environmental impacts and conversion losses that must be amortized by the delivered energy [60]. In particular, an LCA of a residential battery home storage system in a PV self-consumption analysis reports ~84 gCO2-eq/kWh of electricity delivered over the system lifetime, indicating that PV+battery solutions can approach ~80–90 gCO2-eq/kWh under realistic assumptions [59]. This is coherent with the present finding that the life-cycle emission intensity tends to increase with battery size. In other words, oversized or under-cycled batteries yield higher impacts per delivered energy. More generally, the existing reviews of battery storage LCAs highlight a wide spread of global-warming impacts per delivered energy depending on chemistry, lifetime and utilization (i.e., cycling intensity), reinforcing the importance of battery sizing and replacement assumptions during the interpretation phase of the environmental impact outcomes [60,61]. Overall, the benchmarking supports both the validity of the simulated self-consumption rates and the impact on the environmental results induced by adding energy storage systems based on Li-ion technology (see Table 11).

4.6 Influence of Tariff Structures and Export Remuneration
The economic criterion adopted in this study is only based on CAPEX, i.e., it does not explicitly account for operational costs or payback times, therefore neglecting time-varying retail prices, export remuneration, or tariff dynamics. This assumption mirrors the point that the main barrier for the building owner is considered the upfront cost of the investment. The aforementioned operational factors can nevertheless affect the relative economic attractiveness of alternatives and thus potentially modify the economic component of the ranking when a full multiyear cash-flow analysis (e.g., NPV/LCOE/payback) is performed, since the profitability of residential PV–battery systems is highly sensitive to import/export pricing rules and tariff model [9,87].
For example, when the exported electricity is remunerated at a non-negligible rate (e.g., when feed-in or net-billing schemes with meaningful export price are applied by the supplier), configurations with higher annual generation (including tracking PVs without storage) tend to gain relative economic appeal because the energy surplus produced by the system acquires a monetary value. Conversely, when the remuneration of the exported energy is low or zero, the profitability shifts toward the maximization of the on-site use of PV generation, and configurations that associate PVs to batteries tend to improve their relative attractiveness because the presence of the energy storage reduces the low-value exports and increases self-consumption. This effect is consistent with studies comparing pricing-policy regimes (net metering vs. feed-in or net billing) and the role of storage in the prosumer profitability [87,88].
Furthermore, under time-of-use or dynamic contracts, the presence of an energy storage device can create additional value by shifting PV electric energy toward higher-price periods and, in some cases, enabling limited arbitrage and flexibility-oriented operation of the system. Recent evidence, indeed, indicates that dynamic tariffs can measurably increase the gains of residential PV-battery systems relative to flat-tariff operation and that the economic return of batteries is highly sensitive to both tariff structure and export rules [25,89].
Therefore, while the CAPEX analysis is appropriate for comparing the investment cost across multiple system design alternatives, in the present owner-centric MCDM analysis, tariff-sensitive economic evaluations can shift the relative positions of the configurations that only use PV systems vs. the ones that also encompass energy storage, depending on whether the policy environment primarily rewards exported energy (favoring higher-yield PV systems) or self-consumption and flexibility (favoring the deployment of energy storage systems). A full economic analysis and MCDM ranking (e.g., NPV/LCOE under explicit import/export price structures) is identified as a valuable extension for future work [9,87,89].
As a final synthesis element, Table 12 summarizes the expected impact of export remuneration and time-varying electricity prices on the relative economic attractiveness of PV-only vs. PV+battery configurations.

4.7 Policy Implications and Practical Recommendations
While this study adopts an owner-centric weighting to rank rooftop RES configurations, the resulting performance outcomes provide also practical guidance that is relevant to building decision-makers and can inform how incentives can be designed in future. In particular, PV system design options that do not deploy energy storage devices consistently provide a robust techno-economic value, whereas batteries primarily improve self-consumption, but at the important cost of additional embodied impacts, an effect widely discussed in recent PV-battery and prosumer-tariff studies [45,90,91].
Future work could extend the present owner-centric analysis to other stakeholder perspectives, such as tenants, landlords, energy communities, or distribution system operators. In this perspective, some potentially relevant stakeholder groups for future extensions of the framework are briefly summarized here.
• Landlords and tenants. In rented buildings, indeed, the investment and bill-savings beneficiaries may not be coincident, which can penalize solutions that combine PVs and storage unless some benefit-sharing mechanisms are considered. Therefore, in this case, a multi-stakeholder weighting or an explicit benefit allocation constraint should be encompassed [92,93].
• Municipalities and local authorities. In dense urban areas, local authorities can support rooftop renewable deployment by simplifying administrative procedures and providing clear technical guidance for existing buildings, especially for PV integration on the urban building stock [2,11,37]. Under this perspective, PV-based solutions are likely to remain the most robust option in dense fabrics, while rooftop wind should be considered only where site-specific wind evidence supports its viability [14,20,21].
• Regulators and DSOs. When dynamic tariffs or flexibility rewards are present, storage can shift from being mainly a self-consumption device to a grid-support asset (e.g., providing peak shaving, export limiting, ancillary services participation etc.). Aligning incentives with system-level benefits can therefore alter stakeholder rankings and should be considered in broader-scale assessments [90,91].
• Energy communities and multi-owner buildings. Governance rules (e.g., shared CAPEX, allocation of benefits, collective objectives) can affect the preferred solution and should be represented through multi-stakeholder or group-decision weighting, potentially complemented by specific allocation rules for locally generated electricity [94–97].
In Table 13 an illustrative example about how the decision maker weights may differ for the aforementioned stakeholder is reported considering the same criteria used in the present study.

4.8 Limitations and Future Developments
Some limitations should be acknowledged regarding the analyses performed in this study. As regards the financial analysis, the study adopts a fixed grid-emission factor and excludes explicit tariff structures (time-of-use prices, capacity charges) and export remuneration. These assumptions allow the analysis to focus on the upfront investment that is a known barrier to RES deployment in residential buildings. However, considering more detailed tariff schemes (e.g., high evening price differentials or export premiums) the results may change and configurations with larger batteries and higher self-consumption would likely become more competitive than in the present flat-tariff setting [26,98].
Furthermore, the co-simulation uses a deterministic TMY weather file and crisp estimates for technology performance, costs, and the grid emission factor. But stochastic variability in irradiance, wind resource, and future costs could affect the ranking outcomes (especially those with close performance trade-offs), in particular when considering the high uncertainties related to small-wind yield. A full scenario-based or Monte Carlo propagation of these uncertainties into rank acceptability is left for future work that should also test robustness across multi-year weather datasets and additional Mediterranean sites. Despite this, the normalization and weight-sensitivity tests, together with the Kendall/Spearman concordance analysis performed, provide an initial indication that the main conclusions and the group of best-performing options are at least robust to reasonable variations in these inputs.
Future work should focus on incorporating dynamic tariffs, export remuneration, detailed battery and PV degradation, and demand-response strategies. It should also extend the decision problem to other relevant stakeholders (tenants, distribution system operators, municipal authorities) explicitly addressing multi-stakeholder settings (tenants or landlords, energy communities, and utilities/DSOs), where the performance objectives can be conflicting and the resulting preferred configurations may depend on governance and benefit allocation. For example, multi-tenancy collective self-consumption studies show that prioritizing cost recovery vs. self-consumption can lead to different operating strategies and performance outcomes, suggesting that group-decision MCDM (e.g., stakeholder-specific AHP weights, negotiated weights, or bilevel/game-theoretic formulations) is a natural extension of the proposed framework [92,93,96,99]. Likewise, under dynamic tariffs and emerging flexibility remuneration, the energy storage value may be driven by grid services rather than self-consumption alone, motivating the inclusion of additional KPIs (e.g., peak export, peak demand, flexibility revenues) in future MCDM analyses [45,90,91].
In this study a workflow to prioritize rooftop renewable energy systems for a Mediterranean multi-family building is developed and applied. The framework considers the building owner as the main decision-maker and calculates specific weights for the relevant performance criteria (CAPEX, energy consumption curtailment, and environmental impact reduction) to tailor the prioritization analysis to that specific stakeholder. Multiple MCDM methods are applied to overcome method specific bias and provide robustness to the study outcomes. The main conclusions are:
1. Building characteristics such as rooftop geometry, the need for PV module spacing, and the need for maintenance access dominate the deployable peak power of renewable energy systems and this reflects on the achievable annual renewable energy generation. In the layout considered, fixed-tilt PV occupies the roof most efficiently and yields the highest annual output (~60.8 MWh/year). Using tracking systems increases the specific energy yield but reduces the installed capacity under the same roof constraints, which leads to a lower absolute annual generation of single-axis and dual-axis tracking PV arrays.
2. Battery storage significantly improves self-consumption and demand reduction, particularly in a Mediterranean residential load profile with evening energy consumption peaks. Fixed PV coupled with a large battery reaches very high annual coverage, while single-axis tracking PVs with large storage approaches ~93% coverage. These outcomes reflect the temporal complementarity between daytime PV production and evening demand when storage is available.
3. PV-only options (without energy storage devices) exhibit high net avoided emissions over the lifetime (e.g., ~347 tCO2eq for fixed-tilt PVs), whereas adding storage increases embodied emissions and can narrow the net benefit, especially for arrays with lower annual generation or for small-wind alternatives with modest capacity factors. A large-battery VAWT configuration exhibits a negative net balance in this inventory due to low lifetime generation relative to embodied emissions.
4. The criteria weighting based on the preferences of the building owner shifts the favored options toward low-CAPEX ones. With AHP weights representing the typical owner perspective, TOPSIS, ARAS, and COPRAS all favor low-cost PV variants. The ensemble ranking (which mitigates method-specific biases) places dual-axis PV (no storage) first, followed by single-axis tracking PV (no storage), single-axis tracking PV with small storage, and fixed-tilt PV. Large-battery and wind options, instead, mostly rank in lower positions under these weights.
5. Although individual methods emphasize different aspects by applying different scoring criteria, their aggregated ranking shows strong consensus among the top options, providing a robust recommendation for stakeholders and facilitating communication with non-technical decision-makers.
6. The relatively weak performance of VAWT configurations in this case study should not be interpreted as a universal result: in sites with stronger and more directional urban winds (e.g., coastal high-rises, exposed escarpments, or favorable urban canyons), and with appropriately optimized micro-siting and structural integration, small wind could play a more significant complementary role, and the proposed workflow can be directly reused to assess the VAWT performance in such contexts.
Ultimately, from this study some implications for the design practice can be derived as follows. For Mediterranean multi-family building roofs, dense fixed-tilt PV should be the baseline when the goal is to maximize energy production per roof and lifecycle CO2 savings per euro invested. Deploying small storage systems can be a cost-effective enhancement where budget allows, while large storage should be avoided if not justified by explicit objectives (e.g., resilience, export constraints, tariff structures). Urban small wind should be considered only where site-specific wind corridors and structural integration are favorable.
Acknowledgement: The authors would like to thank the colleagues of the Department of Industrial Engineering at the University of Naples Federico II and the partner institutions for their valuable discussions and practical insights on rooftop renewable energy systems and building energy simulation. During the preparation of this work the authors used AI tools (OpenAI) to perform proofreading, language check, fluency improvement and correction. After using this tool, the authors reviewed and edited the content as needed and take full responsibility for the content of the publication.
Funding Statement: The authors received no specific funding for this study.
Author contributions: All authors contributed to the manuscript equally. Conceptualization: Federico Minelli, Diana D’Agostino, Vennapusa Jagadeeswara Reddy, Panagiotis Michailidis. Methodology: Federico Minelli, Diana D’Agostino, Vennapusa Jagadeeswara Reddy, Panagiotis Michailidis. Software: Federico Minelli, Diana D’Agostino, Vennapusa Jagadeeswara Reddy, Panagiotis Michailidis. Validation: Federico Minelli, Diana D’Agostino, Vennapusa Jagadeeswara Reddy, Panagiotis Michailidis. Formal analysis: Federico Minelli, Diana D’Agostino, Vennapusa Jagadeeswara Reddy, Panagiotis Michailidis. Investigation: Federico Minelli, Diana D’Agostino, Vennapusa Jagadeeswara Reddy, Panagiotis Michailidis. Writing—original draft: Federico Minelli, Diana D’Agostino, Vennapusa Jagadeeswara Reddy, Panagiotis Michailidis. Writing—review & editing: Federico Minelli, Diana D’Agostino, Vennapusa Jagadeeswara Reddy, Panagiotis Michailidis. Visualization: Federico Minelli, Diana D’Agostino, Vennapusa Jagadeeswara Reddy, Panagiotis Michailidis. Supervision: Federico Minelli, Diana D’Agostino, Vennapusa Jagadeeswara Reddy, Panagiotis Michailidis. All authors reviewed and approved the final version of the manuscript.
Availability of Data and Materials: The input data, EnergyPlus models and post-processing scripts used in this study are available from the corresponding author on reasonable request.
Ethics approval: Not applicable.
Conflicts of Interest: The authors declare no conflicts of interest.
Nomenclature
| AHP | Analytic Hierarchy Process |
| ARAS | Additive Ratio Assessment |
| BESS | Battery Energy Storage System |
| BOS | Balance of System |
| CAPEX | Capital expenditure |
| CDD | Cooling degree days |
| COPRAS | Complex Proportional Assessment |
| DHW | Domestic hot water |
| EMS | Energy management system |
| GCR | Ground-coverage ratio |
| HDD | Heating degree days |
| HVAC | Heating, ventilation and air conditioning |
| LCA | Life-cycle assessment |
| MCDM | Multi-criteria decision-making |
| PV | Photovoltaic |
| RES | Renewable energy system |
| SOC | State of charge |
| TMY | Typical meteorological year |
| VAWT | Vertical-axis wind turbine |
Appendix A Sensitivity Analysis of the Ensemble Ranking to Criteria Weights
To assess how the dominance of the cost criterion affects the resulting prioritization, a weight-sensitivity analysis was performed. The analysis uses the same decision matrix and workflow as the baseline MCDM assessment. The performance scores of the analyzed alternatives under the three criteria are taken from Tables 7–9 (total system cost [€], annual energy consumption reduction [kWh], and net avoided emissions over lifetime [tCO2eq]). As in the main framework TOPSIS method is implemented with vector normalization, whereas ARAS and COPRAS use column-sum normalization. Cost is treated as a minimization criterion, while the other two as maximization criteria. Because one of the alternatives exhibits negative net avoided emissions, a constant non-negativity shift is applied to the net-avoided column where required by additive normalization (ARAS and COPRAS), without altering relative differences among alternatives. The three method-specific rankings are aggregated using the Borda rule based on ordinal ranks and ties, if any, are resolved by the best (minimum) rank achieved across TOPSIS, ARAS, and COPRAS. If the tie persists, the second-best rank is used and, if needed, the third-best rank is used.
The baseline AHP weights calculated in the study are: CAPEX 0.655, building energy consumption reduction 0.250, net avoided emissions 0.095. In addition to the baseline weights, two alternative weight vectors are tested: an equal-weights case (0.333/0.333/0.333) and a less cost-dominant owner case (0.50/0.35/0.15). Table A1 reports the resulting ensemble ranks obtained by applying the alternative weights.

The sensitivity analysis shows that the ensemble ranking is not fully invariant to the adopted weight vector, especially within the upper and middle part of the ranking, but the broader dominance of PV-based solutions remains unchanged. Under the baseline owner-oriented weights, the first positions are occupied by A7, A4, A5, A1, and A2. When equal weights are applied, the ranking shifts toward alternatives with stronger combined energy and environmental performance, with A2 becoming first, followed by A1 and A5, while A7 drops to seventh position. Under the less cost-dominant case, A4 becomes first, followed by A2, A5, and A1, whereas A7 moves to fifth position. Across all three weight vectors, all VAWT alternatives remain in the lower part of the ranking, with A12 always last. Overall, the results indicate that the exact ordering of the PV alternatives is sensitive to the relative importance assigned to cost, energy performance, and net avoided emissions, while the general preference for PV-based configurations over rooftop wind remains stable.
Appendix B Sensitivity Analysis of the Ensemble Ranking to Grid Carbon Intensity and Battery Embodied Emissions
To complement the weight sensitivity analysis reported in Appendix A, the robustness of the ensemble ranking against uncertainties in the grid carbon intensity used to compute the avoided emissions, the battery embodied emissions, and the battery replacement assumptions is tested. The sensitivity analysis uses the same decision matrix and computational framework as described in the main text. Furthermore, the baseline AHP weights (0.655/0.250/0.095) are retained for the evaluation of uncertainty impact on environmental assumptions. The rationale of this analysis stems from the analysis of current scientific literature showing that electricity emission factor assumptions can materially affect long-term CO2 accounting, and that battery LCA results are sensitive to manufacturing energy mix and replacement frequency assumptions [59–61,100]
Net avoided emissions depend on the assumed grid emission factor
For each design alternative, the net avoided emissions criterion is updated consistently with the baseline definition (avoided minus embodied). Since embodied emissions are independent of grid carbon intensity, the update can be written as:
where
Battery embodied emissions are affected by manufacturing mix and replacement assumptions. Therefore, for alternatives including batteries, an uncertainty band is applied by scaling the battery embodied-emission contribution using multipliers
the perturbed embodied emissions are:
and the net avoided emissions become:
It is trivial that non-storage design alternatives have
Finally, the three grid-carbon-intensity cases (Low/Mid/High, via

After recalculating the net avoided emissions for all nine combined scenarios and rerunning TOPSIS, ARAS, COPRAS, and the Borda ensemble with the baseline weights, no rank reversals were observed. This indicates that the ranking is robust to the tested variations in grid carbon intensity and battery embodied-emission assumptions.
References
1. Kaya GN, Beyhan F. Integrated design approaches with photovoltaic panel and solar collectors in building envelope. World J Environ Res. 2021;11(2):49–61. doi:10.18844/wjer.v11i2.7232. [Google Scholar] [CrossRef]
2. Tao Y, Yan Z, Ni P, He BJ, Qin G, Yue Y, et al. Capturing available solar energy on urban-scale building surface: a multi-dimensional perspective. Energy Build. 2025;344:115989. doi:10.1016/j.enbuild.2025.115989. [Google Scholar] [CrossRef]
3. Maity R, Kumarasamy S, Razak AA, Minelli F. Solar energy analysis for agrivoltaic system design in tropical climates: a new integrated modeling framework. Energy. 2026;344(C):139970. doi:10.1016/j.energy.2026.139970. [Google Scholar] [CrossRef]
4. Kaur N, Sudhakar K, Mohamed MR, Cuce E, Barbulescu D. Wireless power transfer in offshore renewable energy: a review of technologies, challenges, and future directions. Unconv Resour. 2026;9(6):100287. doi:10.1016/j.uncres.2025.100287. [Google Scholar] [CrossRef]
5. Kaur N, Hariram NP, Mekha KB, Mohamed MR, Priya SS, Sudhakar K. Offshore floating solar with electrofuels for refuelling small ferries: a techno-economic-environmental study. Energy Convers Manag X. 2025;28(5):101234. doi:10.1016/j.ecmx.2025.101234. [Google Scholar] [CrossRef]
6. Lenarczyk A, Jaskólski M, Bućko P. The application of a multi-criteria decision-making for indication of directions of the development of renewable energy sources in the context of energy policy. Energies. 2022;15(24):9629. doi:10.3390/en15249629. [Google Scholar] [CrossRef]
7. Ahmed S, Ali A, Ciocia A, D’Angola A. Technological elements behind the renewable energy community: current status, existing gap, necessity, and future perspective—overview. Energies. 2024;17(13):3100. doi:10.3390/en17133100. [Google Scholar] [CrossRef]
8. Ahmed S, Ali A, D’Angola A. A review of renewable energy communities: concepts, scope, progress, challenges, and recommendations. Sustainability. 2024;16(5):1749. doi:10.3390/su16051749. [Google Scholar] [CrossRef]
9. Zakeri B, Cross S, Dodds PE, Gissey GC. Policy options for enhancing economic profitability of residential solar photovoltaic with battery energy storage. Appl Energy. 2021;290(C):116697. doi:10.1016/j.apenergy.2021.116697. [Google Scholar] [CrossRef]
10. Schram WL, Lampropoulos I, van Sark WGJHM. Photovoltaic systems coupled with batteries that are optimally sized for household self-consumption: assessment of peak shaving potential. Appl Energy. 2018;223(C):69–81. doi:10.1016/j.apenergy.2018.04.023. [Google Scholar] [CrossRef]
11. Kaya GN, Beyhan F. A study on the potential of photovoltaic panels in existing buildings: housing example in the mediterranean. Online J Art Des. 2024;12(1):73–87. [Google Scholar]
12. Assouline D, Mohajeri N, Scartezzini JL. Large-scale rooftop solar photovoltaic technical potential estimation using Random Forests. Appl Energy. 2018;217(10):189–211. doi:10.1016/j.apenergy.2018.02.118. [Google Scholar] [CrossRef]
13. Elmalky AM, Araji MT. Computational procedure of solar irradiation: a new approach for high performance façades with experimental validation. Energy Build. 2023;298:113491. doi:10.1016/j.enbuild.2023.113491. [Google Scholar] [CrossRef]
14. Wang Q, Wang J, Hou Y, Yuan R, Luo K, Fan J. Micrositing of roof mounting wind turbine in urban environment: CFD simulations and lidar measurements. Renew Energy. 2018;115(6):1118–33. doi:10.1016/j.renene.2017.09.045. [Google Scholar] [CrossRef]
15. D’Agostino D, Minelli F, D’Urso M, Minichiello F. Fixed and tracking PV systems for net zero energy buildings: comparison between yearly and monthly energy balance. Renew Energy. 2022;195(1):809–24. doi:10.1016/j.renene.2022.06.046. [Google Scholar] [CrossRef]
16. Singh R, Kumar S, Gehlot A, Pachauri R. An imperative role of Sun trackers in photovoltaic technology: a review. Renew Sustain Energy Rev. 2018;82:3263–78. doi:10.1016/j.rser.2017.10.018. [Google Scholar] [CrossRef]
17. Antonanzas J, Urraca R, Martinez-de-Pison FJ, Antonanzas F. Optimal solar tracking strategy to increase irradiance in the plane of array under cloudy conditions: a study across Europe. Sol Energy. 2018;163(4):122–30. doi:10.1016/j.solener.2018.01.080. [Google Scholar] [CrossRef]
18. Fathabadi H. Novel high accurate sensorless dual-axis solar tracking system controlled by maximum power point tracking unit of photovoltaic systems. Appl Energy. 2016;173(4):448–59. doi:10.1016/j.apenergy.2016.03.109. [Google Scholar] [CrossRef]
19. Akbari V, Naghashzadegan M, Kouhikamali R, Afsharpanah F, Yaïci W. Multi-objective optimization of a small horizontal-axis wind turbine blade for generating the maximum startup torque at low wind speeds. Machines. 2022;10(9):785. doi:10.3390/machines10090785. [Google Scholar] [CrossRef]
20. Kc A, Whale J, Urmee T. Urban wind conditions and small wind turbines in the built environment: a review. Renew Energy. 2019;131(4):268–83. doi:10.1016/j.renene.2018.07.050. [Google Scholar] [CrossRef]
21. Kumar R, Raahemifar K, Fung AS. A critical review of vertical axis wind turbines for urban applications. Renew Sustain Energy Rev. 2018;89:281–91. doi:10.1016/j.rser.2018.03.033. [Google Scholar] [CrossRef]
22. Walker SL. Building mounted wind turbines and their suitability for the urban scale—a review of methods of estimating urban wind resource. Energy Build. 2011;43(8):1852–62. doi:10.1016/j.enbuild.2011.03.032. [Google Scholar] [CrossRef]
23. Li Y, Gao W, Ruan Y. Performance investigation of grid-connected residential PV-battery system focusing on enhancing self-consumption and peak shaving in Kyushu. Japan Renew Energy. 2018;127(5):514–23. doi:10.1016/j.renene.2018.04.074. [Google Scholar] [CrossRef]
24. de Oliveira e Silva G, Hendrick P. Photovoltaic self-sufficiency of Belgian households using lithium-ion batteries, and its impact on the grid. Appl Energy. 2017;195:786–99. doi:10.1016/j.apenergy.2017.03.112. [Google Scholar] [CrossRef]
25. Dam MR, van der Laan MD. Techno-economic assessment of battery systems for PV-equipped households with dynamic contracts: a case study of the Netherlands. Energies. 2024;17(12):2991. doi:10.3390/en17122991. [Google Scholar] [CrossRef]
26. Wu X, Tang Z, Stroe DI, Kerekes T. Overview and comparative study of energy management strategies for residential PV systems with battery storage. Batteries. 2022;8(12):279. doi:10.3390/batteries8120279. [Google Scholar] [CrossRef]
27. Coban HH, Michailidis P, Yildirim YA, Minelli F. Flattening winter peaks with dynamic energy storage: a neighborhood case study in the cold climate of ardahan, Turkey. Sustainability. 2026;18(2):761. doi:10.3390/su18020761. [Google Scholar] [CrossRef]
28. D’Agostino D, Minelli F, Minichiello F. An innovative multi-stakeholder decision methodology for the optimal energy retrofit of shopping mall buildings. Energy Build. 2025;344(2017):115958. doi:10.1016/j.enbuild.2025.115958. [Google Scholar] [CrossRef]
29. D’Agostino D, Minelli F, Minichiello F. HVAC system energy retrofit for a university lecture room considering private and public interests. Energies. 2025;18(6):1526. doi:10.3390/en18061526. [Google Scholar] [CrossRef]
30. Carpino C, Austin MC, Mora D, Arcuri N. Retrofit measures for achieving NZE single-family houses in a tropical climate via multi-objective optimization. Buildings. 2024;14(3):566. doi:10.3390/buildings14030566. [Google Scholar] [CrossRef]
31. Shao M, Han Z, Sun J, Xiao C, Zhang S, Zhao Y. A review of multi-criteria decision making applications for renewable energy site selection. Renew Energy. 2020;157:377–403. doi:10.1016/j.renene.2020.04.137. [Google Scholar] [CrossRef]
32. Gassar AAA, Cha SH. Review of geographic information systems-based rooftop solar photovoltaic potential estimation approaches at urban scales. Appl Energy. 2021;291(5):116817. doi:10.1016/j.apenergy.2021.116817. [Google Scholar] [CrossRef]
33. Yilmaz I. A hybrid DEA-fuzzy COPRAS approach to the evaluation of renewable energy: a case of wind farms in Turkey. Sustainability. 2023;15(14):11267. doi:10.3390/su151411267. [Google Scholar] [CrossRef]
34. Ghenai C, Albawab M, Bettayeb M. Sustainability indicators for renewable energy systems using multi-criteria decision-making model and extended SWARA/ARAS hybrid method. Renew Energy. 2020;146(2):580–97. doi:10.1016/j.renene.2019.06.157. [Google Scholar] [CrossRef]
35. Mardani A, Jusoh A, Zavadskas EK, Cavallaro F, Khalifah Z. Sustainable and renewable energy: an overview of the application of multiple criteria decision making techniques and approaches. Sustainability. 2015;7(10):13947–84. doi:10.3390/su71013947. [Google Scholar] [CrossRef]
36. Estévez RA, Espinoza V, Ponce Oliva RD, Vásquez-Lavín F, Gelcich S. Multi-criteria decision analysis for renewable energies: research trends, gaps and the challenge of improving participation. Sustainability. 2021;13(6):3515. doi:10.3390/su13063515. [Google Scholar] [CrossRef]
37. Cuesta-Fernández I, Vargas-Salgado C, Alfonso-Solar D, Gómez-Navarro T. The contribution of metropolitan areas to decarbonize the residential stock in Mediterranean cities: a GIS-based assessment of rooftop PV potential in Valencia. Spain Sustain Cities Soc. 2023;97(11):104727. doi:10.1016/j.scs.2023.104727. [Google Scholar] [CrossRef]
38. Kaya GN, Beyhan F, İlerisoy ZY, Cudzik J. Evaluation of machine learning applications in building life cycle processes for energy efficiency: a systematic review. Energy Rep. 2025;13(4):4900–16. doi:10.1016/j.egyr.2025.04.034. [Google Scholar] [CrossRef]
39. Sander L, Schindler D, Jung C. Application of satellite data for estimating rooftop solar photovoltaic potential. Remote Sens. 2024;16(12):2205. doi:10.3390/rs16122205. [Google Scholar] [CrossRef]
40. Hu M, Liu Z, Huang Y, Wei M, Yuan B. Estimation of rooftop solar photovoltaic potential based on high-resolution images and digital surface models. Buildings. 2023;13(11):2686. doi:10.3390/buildings13112686. [Google Scholar] [CrossRef]
41. Izadi M, Afsharpanah F, Mohadjer A, Shobi MO, Mousavi Ajarostaghi SS, Minelli F. Performance enhancement of a shell-and-coil ice storage enclosure for air conditioning using spiral longitudinal fins: a numerical approach. Heliyon. 2025;11(4):e42786. doi:10.1016/j.heliyon.2025.e42786. [Google Scholar] [PubMed] [CrossRef]
42. Kurucan M, Michailidis P, Michailidis I, Minelli F. A modular hybrid SOC-estimation framework with a supervisor for battery management systems supporting renewable energy integration in smart buildings. Energies. 2025;18(17):4537. doi:10.3390/en18174537. [Google Scholar] [CrossRef]
43. Delfianti R, Mareai M, Minelli F, Harsito C, Nusyura F. Modeling and simulation of hybrid fuzzy-PID and model predictive control for enhanced dual-axis photovoltaic tracking precision. Unconv Resour. 2026;9(2):100303. doi:10.1016/j.uncres.2025.100303. [Google Scholar] [CrossRef]
44. Weniger J, Tjaden T, Quaschning V. Sizing of residential PV battery systems. Energy Proc. 2014;46:78–87. doi:10.1016/j.egypro.2014.01.160. [Google Scholar] [CrossRef]
45. Jakus D, Novaković J, Vasilj J, Jolevski D. Optimal residential battery storage sizing under ToU tariffs and dynamic electricity pricing. Energies. 2025;18(9):2391. doi:10.3390/en18092391. [Google Scholar] [CrossRef]
46. Zavadskas EK, Antucheviciene J. Multiple criteria evaluation of rural building’s regeneration alternatives. Build Environ. 2007;42(1):436–51. doi:10.1016/j.buildenv.2005.08.001. [Google Scholar] [CrossRef]
47. Selvan SU, Saroglou ST, Mosca F, Tyc J, Joschinski J, Calbi M, et al. Multi-species building envelopes: developing a multi-criteria design decision-making methodology for cohabitation. In: Proceedings of the 28th International Conference of the Association for Computer-Aided Architectural Design Research in Asia (CAADRIA). Hong Kong, China: Association for Computer-Aided Architectural Design Research in Asia (CAADRIA); 2023.p. 645–54. [Google Scholar]
48. Sun Y, Huang P, Huang G. A multi-criteria system design optimization for net zero energy buildings under uncertainties. Energy Build. 2015;97:196–204. doi:10.1016/j.enbuild.2015.04.008. [Google Scholar] [CrossRef]
49. EnergyPlus input output reference. EnergyPlus™ version 25.2.0 documentation, U.S. department of energy. 1996–2016 [cited 2026 Feb 10]. Available from: https://energyplus.net/assets/nrel_custom/pdfs/pdfs_v25.2.0/InputOutputReference.pdf. [Google Scholar]
50. U.S. department of energy EnergyPlus testing with building thermal envelope and fabric load tests from ANSI/ASHRAE standard 140-2011; Gard analytics, 115S. Wilke road, suite 105 Arlington Heights, IL 60005-1500 USA. 2011 [cited 2026 Feb 10]. Available from: https://labeee.ufsc.br/sites/default/files/disciplinas/ECV4202_EnergyPlus testing with Ashrae140.pdf. [Google Scholar]
51. U.S. department of Energy EnergyPlus testing with HVAC equipment performance tests from ANSI/ASHRAE standard 140-2011; Gard analytics, 115S. Wilke road, suite 105 Arlington Heights, IL 60005-1500 USA. 2011 [cited 2026 Feb 10]. Available from: https://apps1.eere.energy.gov/buildings/energyplus/energyplus_testing.cfm. [Google Scholar]
52. Laudani A, Lozito GM, Mancilla-David F, Riganti-Fulginei F, Salvini A. An improved method for SRC parameter estimation for the CEC PV module model. Sol Energy. 2015;120(2):525–35. doi:10.1016/j.solener.2015.08.003. [Google Scholar] [CrossRef]
53. Faiman D. Assessing the outdoor operating temperature of photovoltaic modules. Prog Photovolt Res Appl. 2008;16(4):307–15. doi:10.1002/pip.813. [Google Scholar] [CrossRef]
54. King DL, Boyson WE, Kratochvil JA. Sandia photovoltaic array performance model. Sandia National Laboratories Albuquerque, New Mexico 87185 and Livermore, California 94550. 2004[cited 2026 Feb 10]. Available from: https://www.osti.gov/servlets/purl/919131. [Google Scholar]
55. Frischknecht R, Stolz P, Krebs L, de Wild-Scholten M, Sinha P. Life cycle inventories and life cycle assessments of photovoltaic systems—report IEA-PVPS—task 12: PV sustainability. Golden, CO, USA: National Renewable Energy Laboratory (NREL); 2014. [Google Scholar]
56. Frischknecht R, Itten R, Wyss F. Life cycle assessment of future photovoltaic electricity production from residential-scale systems operated in Europe. Paris, France: International Energy Agency Photovoltaic Power Systems Programme (IEA-PVPS); 2015. [Google Scholar]
57. Peng J, Lu L, Yang H. Review on life cycle assessment of energy payback and greenhouse gas emission of solar photovoltaic systems. Renew Sustain Energy Rev. 2013;19(5):255–74. doi:10.1016/j.rser.2012.11.035. [Google Scholar] [CrossRef]
58. Gerbinet S, Belboom S, Léonard A. Life cycle analysis (LCA) of photovoltaic panels: a review. Renew Sustain Energy Rev. 2014;38(8):747–53. doi:10.1016/j.rser.2014.07.043. [Google Scholar] [CrossRef]
59. Jasper FB, Späthe J, Baumann M, Peters JF, Ruhland J, Weil M. Life cycle assessment (LCA) of a battery home storage system based on primary data. J Clean Prod. 2022;366(7):132899. doi:10.1016/j.jclepro.2022.132899. [Google Scholar] [CrossRef]
60. Gutsch M, Leker J. Global warming potential of lithium-ion battery energy storage systems: a review. J Energy Storage. 2022;52(8):105030. doi:10.1016/j.est.2022.105030. [Google Scholar] [CrossRef]
61. Peters JF, Baumann M, Zimmermann B, Braun J, Weil M. The environmental impact of Li-Ion batteries and the role of key parameters—a review. Renew Sustain Energy Rev. 2017;67(7490):491–506. doi:10.1016/j.rser.2016.08.039. [Google Scholar] [CrossRef]
62. Saaty TL. The analytic hierarchy process. New York, NY, USA: McGraw-Hill; 1980. [Google Scholar]
63. Saaty TL. A scaling method for priorities in hierarchical structures. J Math Psychol. 1977;15(3):234–81. doi:10.1016/0022-2496(77)90033-5. [Google Scholar] [CrossRef]
64. Andreolli F, Bragolusi P, D’Alpaos C, Faleschini F, Zanini MA. An AHP model for multiple-criteri a priori tization of seismic retrofit solutions in gravity-designed industrial buildings. J Build Eng. 2022;45(3–4):103493. doi:10.1016/j.jobe.2021.103493. [Google Scholar] [CrossRef]
65. Saaty RW. The analytic hierarchy process—what it is and how it is used. Math Model. 1987;9(3–5):161–76. doi:10.1016/0270-0255(87)90473-8. [Google Scholar] [CrossRef]
66. Hwang C-L, Yoon K. Multiple attribute decision making: methods and applications. Berlin/Heidelberg, Germany: Springer; 1981. [Google Scholar]
67. Yoon K. A reconciliation among discrete compromise solutions. J Oper Res Soc. 1987;38(3):277–86. doi:10.1057/jors.1987.44. [Google Scholar] [CrossRef]
68. Yoon K, Hwang CL. Multiple attribute decision making. Thousand Oaks, CA, USA: Sage Publications; 1995. [Google Scholar]
69. Chakraborty S. TOPSIS and modified TOPSIS: a comparative analysis. Decis Anal J. 2022;2(2):100021. doi:10.1016/j.dajour.2021.100021. [Google Scholar] [CrossRef]
70. Guzmán-Sánchez S, Jato-Espino D, Lombillo I, Diaz-Sarachaga JM. Assessment of the contributions of different flat roof types to achieving sustainable development. Build Environ. 2018;141:182–92. doi:10.1016/j.buildenv.2018.05.063. [Google Scholar] [CrossRef]
71. Zavadskas EK, Turskis Z. A new additive ratio assessment (ARAS) method in multicriteria decision-making. Technol Econ Dev Econ. 2010;16(2):159–72. doi:10.3846/tede.2010.10. [Google Scholar] [CrossRef]
72. Kutut V, Zavadskas EK, Lazauskas M. Assessment of priority options for preservation of historic city centre buildings using MCDM (ARAS). Procedia Eng. 2013;57(1):657–61. doi:10.1016/j.proeng.2013.04.083. [Google Scholar] [CrossRef]
73. Karagöz S, Deveci M, Simic V, Aydin N. Interval type-2 fuzzy ARAS method for recycling facility location problems. Appl Soft Comput. 2021;102(2):107107. doi:10.1016/j.asoc.2021.107107. [Google Scholar] [CrossRef]
74. Gil-García IC, García-Cascales MS, Molina-García A. Urban wind: an alternative for sustainable cities. Energies. 2022;15(13):4759. doi:10.3390/en15134759. [Google Scholar] [CrossRef]
75. Li QS, Shu ZR, Chen FB. Performance assessment of tall building-integrated wind turbines for power generation. Appl Energy. 2016;165(10):777–88. doi:10.1016/j.apenergy.2015.12.114. [Google Scholar] [CrossRef]
76. Toja-Silva F, Colmenar-Santos A, Castro-Gil M. Urban wind energy exploitation systems: behaviour under multidirectional flow conditions—opportunities and challenges. Renew Sustain Energy Rev. 2013;24:364–78. doi:10.1016/j.rser.2013.03.052. [Google Scholar] [CrossRef]
77. Kono T, Kogaki T, Kiwata T. Numerical investigation of wind conditions for roof-mounted wind turbines: effects of wind direction and horizontal aspect ratio of a high-rise cuboid building. Energies. 2016;9(11):907. doi:10.3390/en9110907. [Google Scholar] [CrossRef]
78. Mattar SJ, Nezhad MRK, Versteege M, Lange CF, Fleck BA. Validation process for rooftop wind regime CFD model in complex urban environment using an experimental measurement campaign. Energies. 2021;14(9):2497. doi:10.3390/en14092497. [Google Scholar] [CrossRef]
79. Siddiqui MS, Khalid MH, Zahoor R, Butt FS, Saeed M, Badar AW. A numerical investigation to analyze effect of turbulence and ground clearance on the performance of a roof top vertical-axis wind turbine. Renew Energy. 2021;164(C):978–89. [Google Scholar]
80. Zhang S, Du B, Ge M, Zuo Y. Study on the operation of small rooftop wind turbines and its effect on the wind environment in blocks. Renew Energy. 2022;183(1):708–18. doi:10.1016/j.renene.2021.11.059. [Google Scholar] [CrossRef]
81. Elazab R, Eid J, Amin A. Reliable planning of isolated building integrated photovoltaic systems. Clean Energy. 2021;5(1):32–43. doi:10.1093/ce/zkaa028. [Google Scholar] [CrossRef]
82. Lazzeroni P, Mariuzzo I, Quercio M, Repetto M. Economic, energy, and environmental analysis of PV with battery storage for Italian households. Electronics. 2021;10(2):146. doi:10.3390/electronics10020146. [Google Scholar] [CrossRef]
83. Ciocia A, Amato A, Di Leo P, Fichera S, Malgaroli G, Spertino F, et al. Self-consumption and self-sufficiency in photovoltaic systems: effect of grid limitation and storage installation. Energies. 2021;14(6):1591. doi:10.3390/en14061591. [Google Scholar] [CrossRef]
84. Gagliano A, Tina GM, Aneli S. Improvement in energy self-sufficiency in residential buildings using photovoltaic thermal plants, heat pumps, and electrical and thermal storage. Energies. 2025;18(5):1159. doi:10.3390/en18051159. [Google Scholar] [CrossRef]
85. Causone F, Tatti A, Pagliano L. Technical and economic assessment of a battery storage system for a NZEB in the mediterranean climate. In: Proceedings of the IOP Conference Series: Earth and Environmental Science. Bristol, UK: Institute of Physics Publishing; Vol. 296, 2019. [Google Scholar]
86. Virtuani A, Borja Block A, Wyrsch N, Ballif C. The carbon intensity of integrated photovoltaics. Joule. 2023;7(11):2511–36. doi:10.1016/j.joule.2023.09.010. [Google Scholar] [CrossRef]
87. Norouzi F, Shekhar A, Hoppe T, Bauer P. Analysing the impact of the different pricing policies on PV-battery systems: a Dutch case study of a residential microgrid. Energy Policy. 2025;204(2):114620. doi:10.1016/j.enpol.2025.114620. [Google Scholar] [CrossRef]
88. Aleksiejuk-Gawron J, Milčiuvienė S, Kiršienė J, Doheijo E, Garzon D, Urbonas R, et al. Net-metering compared to battery-based electricity storage in a single-case PV application study considering the Lithuanian context. Energies. 2020;13(9):2286. doi:10.3390/en13092286. [Google Scholar] [CrossRef]
89. Lorenz C, Bayer DR, Pruckner M, Staake T, Hopf K. Do dynamic electricity tariffs change the gains of residential PV-battery systems? A simulation-based evaluation using data from 448 households. Energy Policy. 2026;209:114952. doi:10.1016/j.enpol.2025.114952. [Google Scholar] [CrossRef]
90. von Bonin M, Dörre E, Al-Khzouz H, Braun M, Zhou X. Impact of dynamic electricity tariff and home PV system incentives on electric vehicle charging behavior: study on potential grid implications and economic effects for households. Energies. 2022;15(3):1079. doi:10.3390/en15031079. [Google Scholar] [CrossRef]
91. Kelm P, Mieński R, Wasiak I. Control of an energy storage system in the prosumer’s installation under dynamic tariff conditions. Energies. 2025;18(23):6313. doi:10.3390/en18236313. [Google Scholar] [CrossRef]
92. Kühn L, Fuchs N, Braun L, Maier L, Müller D. Landlord-tenant dilemma: how does the conflict affect the design of building energy systems? Energies. 2024;17(3):686. doi:10.3390/en17030686. [Google Scholar] [CrossRef]
93. Domenig C, Scheller F, Gunkel PA, Hermann J, Bergaentzlé CM, Lopes MAR, et al. Overcoming the landlord-tenant dilemma: a techno-economic assessment of collective self-consumption for European multi-family buildings. Energy Policy. 2024;189(1):114120. doi:10.1016/j.enpol.2024.114120. [Google Scholar] [CrossRef]
94. Mutule A, Borscevskis O, Astapov V, Antoskova I, Carroll P, Kairisa E. PV energy communities in residential apartments: technical capacities and economic viability. Sustainability. 2025;17(7):2901. doi:10.3390/su17072901. [Google Scholar] [CrossRef]
95. Syed MM, Morrison GM, Darbyshire J. Shared solar and battery storage configuration effectiveness for reducing the grid reliance of apartment complexes. Energies. 2020;13(18):4820. doi:10.3390/en13184820. [Google Scholar] [CrossRef]
96. Reis IFG, Gonçalves I, Lopes MAR, Antunes CH. Collective self-consumption in multi-tenancy buildings-To what extent do consumers’ goals influence the energy system’s performance? Sustain Cities Soc. 2022;80(1):103688. doi:10.1016/j.scs.2022.103688. [Google Scholar] [CrossRef]
97. Chaudhry S, Surmann A, Kühnbach M, Pierie F. Renewable energy communities as modes of collective prosumership: a multi-disciplinary assessment part II—case study. Energies. 2022;15(23):8936. doi:10.3390/en15238936. [Google Scholar] [CrossRef]
98. Tu R, Guo Z, Liu L, Wang S, Yang X. Reviews of photovoltaic and energy storage systems in buildings for sustainable power generation and utilization from perspectives of system integration and optimization. Energies. 2025;18(11):2683. doi:10.3390/en18112683. [Google Scholar] [CrossRef]
99. Li L, Peng K, Yang X, Liu K. Coordinated design of multi-stakeholder community energy systems and shared energy storage under uncertain supply and demand: a game theoretical approach. Sustain Cities Soc. 2024;100(2):105028. doi:10.1016/j.scs.2023.105028. [Google Scholar] [CrossRef]
100. Busato F, Noro M. Energy savings in industrial processes: the influence of electricity emission factor and financial parameters on the evaluation of long-term economics and carbon savings. Appl Sci. 2025;15(22):11852. doi:10.3390/app152211852. [Google Scholar] [CrossRef]
Cite This Article
 Copyright © 2026 The Author(s). Published by Tech Science Press.
This work is licensed under a Creative Commons Attribution 4.0 International License , which permits unrestricted use, distribution, and reproduction in any medium, provided the original work is properly cited.
 Downloads
 Citation Tools
