
 Login
Login Register
 Submit a Paper
 Propose a Special lssue
 Open Access
ARTICLE
Numerical Simulation of CO2 Huff-and-Puff Mechanism and CO2/N2 Synergistic Huff-and-Puff in the Edge-Bottom Water Reservoirs
1 Key Laboratory for Enhanced Oil & Gas Recovery of the Ministry of Education, Northeast Petroleum University, Daqing, 163318, China
2 Nanpu Operation Area, PetroChinaJidong Oilfield Company, Tangshan, 063200, China
3 Key Laboratory of Reservoir Stimulation, China National Petroleum Corporation, Daqing, 163318, China
* Corresponding Author: Huiying Zhong. Email:
(This article belongs to the Special Issue: Enhanced Oil and Gas Recovery in Unconventional Reservoirs)
Energy Engineering 2026, 123(8), 10 https://doi.org/10.32604/ee.2025.074439
Received 11 October 2025; Accepted 16 December 2025; Issue published 12 July 2026
 View Full Text
 Download PDF
Abstract
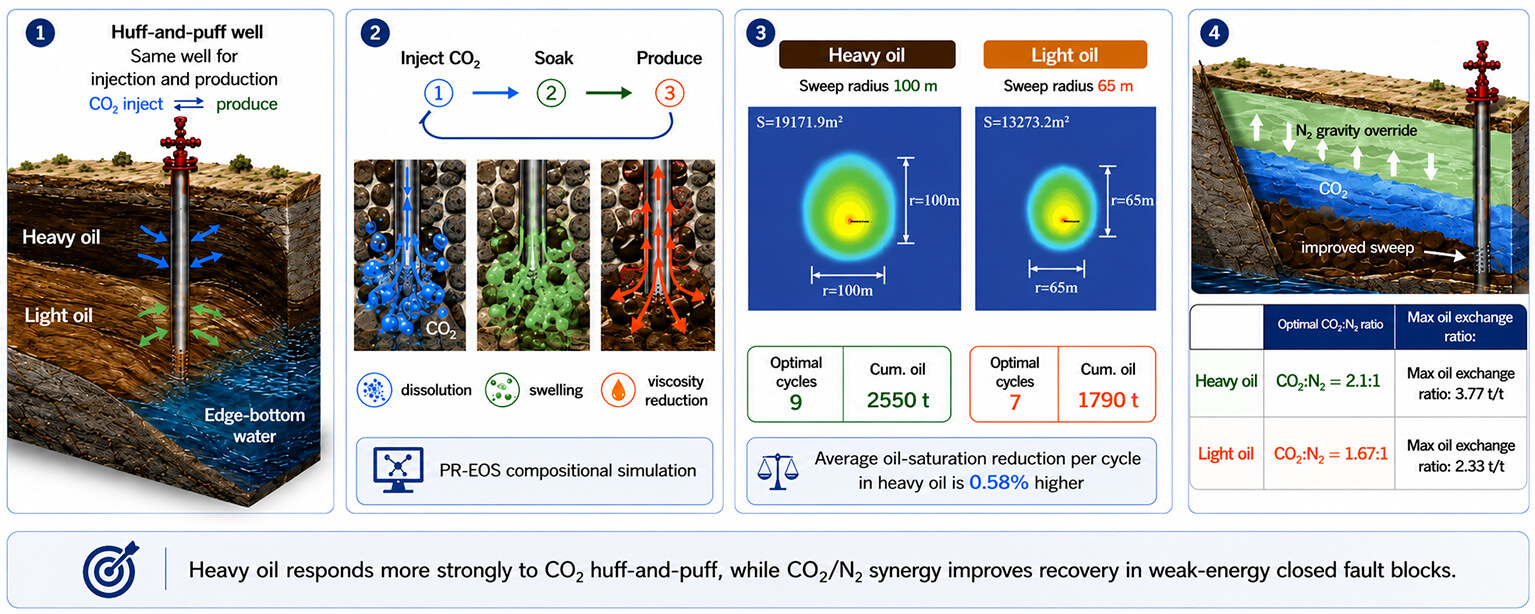
With the steady advancement of China’s “Dual-Carbon” goals, CO2 huff-and-puff technology has become one of the mainstream methods for enhancing oil recovery (EOR) in oilfields. However, differences in sweep radius of CO2, CO2-oil interaction mechanisms, injection parameters, and huff-and-puff modes between conventional heavy-oil and light-oil reservoirs still require further investigation. The NP oilfield consists of an upper heavy-oil zone and a lower light-oil zone, with the reservoir inclined at a certain angle. Taking this oilfield as the study area, a positively rhythmic reservoir geological model was established. A compositional numerical simulation approach was employed to analyze the sweep radius of CO2 and the mechanisms of oil-saturation reduction of various huff-and-puff cycles under edge-water reservoir conditions. To address the issue of insufficient energy supply in well groups within closed fault blocks, the effects of synergistic CO2–N2 huff-and-puff on the development performance of conventional heavy-oil and light-oil reservoirs were further investigated. The results show that the sweep radius of CO2 huff-and-puff in heavy-oil reservoirs is significantly larger than that in light-oil reservoirs. Under a 10 m oil-column height, the maximum sweep radius reaches 100 m for heavy oil reservoirs, compared with 65 m for light oil reservoirs. Moreover, the average oil-saturation reduction per cycle in heavy-oil reservoirs is 0.58% higher than that in light-oil reservoirs. For well groups in closed fault blocks with weak energy supply, synergistic CO2–N2 huff-and-puff can effectively enhance oil recovery, benefiting from the gravity override effect of N2. Based on numerical simulation, the optimal CO2: N2 injection ratios for synergistic huff-and-puff were determined to be 2.1:1 for heavy oil and 1.67:1 for light oil. These findings provide important theoretical support for optimizing CO2 flooding development strategies in reservoirs of similar types.Graphic Abstract
Keywords
Global temperatures continue to rise due to the emission of greenhouse gases [1–3]. The Paris Agreement seeks to keep the rise in global temperatures well below 2°C compared to pre-industrial levels [4,5]. This is the reason why an increasing number of countries and regions have adopted carbon neutral targets, which emphasize the significance of emission reduction technologies [6–10]. Driven by the global energy transition and carbon neutrality goals, CO2 huff-and-puff has become a key technological choice for the low-permeability reservoir, tight reservoir, and strong edge-bottom water reservoir. This is because CO2 huff-and-puff offers dual advantages of enhanced oil recovery (EOR) and carbon capture, utilization, and storage (CCUS) [11–13]. In recent years, there have been new insights for the study of the reservoirs with dip angle and edge-bottom water. To address the challenges of high viscosity and poor mobility of heavy oil as well as bottom water breakthrough, Xu et al. [14] developed a numerical model based on the Liuguanzhuang Oilfield in Dagang. The characteristics and production behavior of CO2 huff-n-puff in horizontal wells of heavy oil reservoirs are investigated. The results demonstrated that CO2 formed a viscosity reduction zone above the horizontal well. With increase of huff-and-puff cycles, the enhancement in the oil drainage area gradually decreases. Zhao et al. [15] combined large-scale physical simulations and numerical modeling. They investigated key parameters and development performances of CO2 huff-and-puff in multistage fractured horizontal wells in tight reservoirs. Their innovation demonstrated that fractures can reduce flow resistance and enhance CO2 sweep efficiency through pressure field visualization. Thus, this provides evidence of significantly enhanced oil recovery. Shabib-Asl et al. [16] investigated the performance of CO2 foam huff-and-puff and its impact on recovery in tight oil reservoirs by combining laboratory experiments with numerical simulations. This study addresses the problems of extremely low porosity and permeability. The results indicate that CO2 foam huff-and-puff can significantly enhance oil recovery. Key influence parameters include production time, injection time, and soaking time. Injection rate and incremental injection rate have relatively minor effects. Afari et al. [17] addressed the issue of insufficient understanding of key operational parameters during CO2 injection for developing unconventional reservoirs. Through component simulation and response surface methodology (RSM), five core parameters are studied. This identifies that bottomhole pressure and production cycle exerted the greatest influence (longer soaking time reduced oil recovery). Following optimization, incremental recovery exceeded 7%. Wei and Bai [18] addressed the issue of low recovery in North American shale formations by integrating laboratory experiments, reservoir numerical simulations, and pilot tests. The impact of molecular diffusion mechanisms of CO2 huff-and-puff in the Bakken formation is investigated. Their findings revealed CO2 diffusion was poor within this formation. It also explained the macroscopic-microscopic diffusion differences in unconventional reservoirs and the influence on enhanced oil recovery. Tang et al. [19] analyzed the dynamic characteristics, influence factors of CO2 huff-and-puff. Their analyses also revealed the contribution of sweep pattern to recovery through laboratory experiment. The results showed that CO2 injection volume and development speed are the main factors influencing the oil recovery. A reasonable soaking time exists in CO2 huff-and-puff. The oil recovery of CO2 huff-and-puff is primarily contributed by flow sweep and diffusion sweep. The diffusion sweep contributes more during the soaking time. Wang et al. [20] conducted laboratory experiments on N2 and CO2 mixture huff-and-puff. They explored the influence of injection ratio and injection sequence on oil increment and water cut control. The problems of excessive water production during the development of edge-water fault-block reservoirs are studied. The results show that N2 huff-and-puff has the most obvious effect on water cut control. CO2 huff-and-puff has the best effect on oil increment, and the optimal injection ratio of N2 and CO2 is 7:3.
In conclusion, existing studies have shown the effectiveness of CO2 huff-and-puff. It can control water cut and stabilize oil production in reservoirs with dip angles. However, relatively few studies exists on the huff-and-puff behaviors of conventional heavy oil and light oil groups. Comparative analyses in the same edge-bottom water reservoir are lacking. In this work, a numerical model that differs from prior studies in three aspects was established. First, taking NP oilfield—which simultaneously developed both light and conventional heavy oil groups—as an example, a positive-rhythm reservoir geological model with inclination was established. Second, numerical simulations were conducted using a component model. It was used to analyze the CO2 swept radius and the mechanism of oil saturation reduction in the edge water reservoir during different huff-and-puff cycles. It also enabled a comparison between heavy and light oils under identical conditions. Third, for small blocks of the NP oilfield characterized by limited natural energy, the study investigated the impact of CO2–N2 synergistic huff-and-puff on the development of conventional heavy and light oils. It also determined the optimal CO2/N2 injection ratio for different oil viscosities. These aspects will be discussed in detail in Section 3. The research findings provide crucial theoretical support for designing development methods for natural edge-bottom water-oil reservoirs with inclination.
The CO2 huff-and-puff mechanism is complex, involving multiphase flow, phase behavior, CO2 dissolution, and CO2 diffusion. Therefore, the mathematical model describes the CO2 huff-and-puff and fluid flow in pour media. It includes equations of state, basic differential equations and auxiliary equations.
The equation of state is widely used in phase calculations of oil and gas systems. Therefore, the PR equation of state is selected to simulate the oil and gas phase equilibrium in this paper [21,22]. For the multi-component mixed system, it is of the form
where R is the gas constant, taken as 8.206 J·K−1·mol−1; T is the temperature of the system, K; P is the pressure of the system, Pa; V is the molar volume of the system, L/mol. The equation takes into account the effects of molecular density and temperature on the intermolecular gravitational force, and am and bm are the average gravitational and repulsive constants of the mixed system, respectively, with the expressions:
where ai is the gravitational constant of component i; bi is the van der Waals co-volume of component i; xi is the composition of component i in the equilibrium mixed liquid phase; yi is the composition of component i in the equilibrium mixed gas phase; kij is the binary interaction coefficient, which can be obtained by phase fitting; n is the number of components in the hydrocarbon system of oil and gas.
The cubic equation of the compression factor Z of the state equation can be expressed by Eq. (4):
where Zm is the compression factor of the mixture; Am and Bm are the compression coefficients,
The fugacity coefficient of component i in a mixture can be calculated from the following equation
where fi is the fugacity coefficient of component i, which can be calculated according to the following equation:
2.2 Basic Differential Equation (BDE)
In this paper, the multi-phase multi-component model is used to establish the mathematical model of CO2 huff-and-puff, which can better reflect the CO2 huff-and-puff mechanism and can accurately describe the process of CO2-oil interaction. The basic assumptions are as follows:
(1) The fluid flow obeys Darcy’s law and the seepage process is isothermal;
(2) There are oil, gas and water phases in the reservoir, and the water component and various hydrocarbon components are considered. The water component exists only in the water phase, the hydrocarbon component can exist in both oil and gas phases, and CO2 exists in the hydrocarbon component.
(3) Fluid and rock are compressible, and the effects of gravity and capillary force are considered;
(4) The transfer of components between phases is considered, the diffusion behavior is not considered.
2.2.2 Differential Equations for Seepage
Combined with Darcy’s law, the hydrocarbon component seepage equation is
The water component seepage equation is
where zi is the total composition of component i (i = 1, ···, n); xi is the composition of component i in the oil phase; yi is the composition of component i in the gas phase; So is oil phase saturation; Sg is gas phase saturation; ρo is oil phase density, kg·m−3; ρg is gas phase density, kg·m−3; ρw is aqueous phase density , kg·m−3; K is the absolute permeability of the reservoir, m2; Kro is the relative permeability of the oil phase; Krg is the relative permeability of the gas phase; Krw is the relative permeability of the water phase; Po is the pressure of the oil phase, Pa; Pg is the pressure of the gas phase, Pa; Pw is the pressure of the water phase, Pa; D is the depth, m; g is the acceleration of gravity, and 9.8 m·s−2; μo is the viscosity of the oil phase, Pa·s; μg is the viscosity of the gas phase, Pa·s; μw is the viscosity of the water phase, Pa·s; and qi is the source term of component i, kg·s−1.
The oil phase density is expressed as
where Mi is the molar mass of component i, kg/mol; Zo is the compression factor of the oil phase, and is the minimum root of the cubic equation of the compression factor.
The gas phase density is
The aqueous phase density is
where Cw is the compression coefficient of water, Pa−1; P0 is the reference pressure, Pa; and ρw0 is the density of water at the reference condition, kg·m−3. The oil and gas phase viscosities in the component equations were calculated by using the method proposed by Jossi.
To ensure that the basic differential equation is solvable, the following equations are required
(1) Equilibrium equation
where L is the mass fraction of the liquid phase in the mixture; ki is the equilibrium constant of component i.
(2) Saturation equation
(3) Capillary pressure equation
where Pcow is the capillary pressure between oil and water, Pa; Pcgo is the capillary pressure between gas and water, Pa.
(4) Component molar fraction equations
The above equations represent the mathematical model of the compositional model, employing the finite difference method for discrete equation solving. The solution is shown in Fig. 1. The solution procedure is as follows:

Figure 1: Flowchart of PR-EOS-based multiphase flow simulation in reservoirs
(1) Given reservoir parameters such as permeability (K), porosity(ϕ), initial pressure (P), temperature (T), etc., component properties including the composition of the oil phase (xi) and gas phase (yi), as well as boundary conditions, initial saturation distribution of the oil phase (So), gas phase (Sg), and water phase (Sw), and the initial pressure field.
(2) Time stepping involves solving the equations for each component to determine the pressure at the current time step. Subsequently, water saturation is computed using the water component equation, followed by calculating the total composition of the current time step by integrating the fundamental hydrocarbon component differential equation.
(3) Phase equilibrium calculations involve utilizing the determined pressure and overall composition to derive the composition of oil-gas two-phase flow, as well as the density, viscosity, and oil-gas saturation. Subsequent iterations are conducted by revisiting step (2).
The NP oilfield is located in the NP depression in the northern part of the Huanghua depression in the Bohai Bay Basin, which has a complex geologic structure and consists mainly of fault-controlled fault block formations. The field contains a number of study blocks (NP-G, NP-M, etc.) due to the development of faults in the reservoir, closed small fault blocks with insufficient energy supply (NP-M) have been formed locally, different fault blocks in the reservoir have different dip angle development (2°~40°), the edge water of the blocks is developed, and bottom water is also developed in some areas. The upper part of the study block is a conventional heavy oil group, with crude oil viscosity ranging from 130.4 to 229.1 mPa·s, and the lower part develops a conventional light oil group, with an average crude oil viscosity of 2.76 mPa·s. The NP-G block was put into production with a natural water flooding then CO2 huff-and-puff was adopted, and CO2 huff-and-puff has been implemented in 65 wells so far. Based on the positive rhythmic features of geological evolution in Block NP-G, a conceptual model with a model dip angle of 2° is developed. The oil column heights in high, middle, and low positions are 10, 7, and 1.5 m, respectively. Based on an actual reservoir block, the conceptual model incorporates an edge water feature at the low position, set at 50 times the water body multiple. In Fig. 2. for attribute characteristics. In the numerical simulation process, the actual 1 m3/d production in the oilfield is used as the criterion for the failure of huff-and-puff cycles for the next cycle of CO2 huff-and-puff. Fig. 3 presents a comparison of multiphase flow parameters for heavy oil and light oil. Fig. 3a shows the relative permeability for heavy oil, Fig. 3b shows the relative permeability for light oil.

Figure 2: Conceptual model

Figure 3: Relative permeability curve (heavy oil and light oil)
3.1 CO2 Huff-and-Puff Radius on Heavy Oil and Light Oil
There are the mechanisms of dissolution, volume expansion and viscosity reduction when CO2 interacts with crude oil in the formation. For this reason, CO2 swept area in the formation is directly related to the effect of CO2 huff-and-puff. Therefore, the natural edge water energy is firstly utilized for water flooding in this study, and CO2 huff-and-puff is conducted when the water cut is 95%, and after selecting the CO2 swept area, the average oil saturation of the swept area is calculated, as shown in Fig. 4. Based on the numerical simulation results, the swept radius and swept area after CO2 huff-and-puff remain basically unchanged for 10 cycles of heavy oil and 9 cycles of light oil. Figs. 5 and 6 show the swept radius, swept area and oil saturation, respectively. It can be seen that with the increase of CO2 huff-and-puff cycles, the CO2 swept area gradually increased. After 10 cycles of CO2 huff-and-puff, the maximum CO2 swept radius in heavy oil is 100 m, and the swept area is 19,171.9 m3; After 8 cycles of CO2 huff-and-puff, the maximum CO2 swept radius in light oil is 65 m, and the swept area is 13,273.2 m3. From the variation of the four maximum sweep radius and the CO2 swept area, it can be seen that the increase of CO2 swept radius becomes smaller obviously when the seventh cycle injection is conducted. According to average oil saturation of the swept area, the reduction of the average oil saturation also significantly declines after the seventh cycle of CO2 huff-and-puff, indicating that the effect of CO2 huff-and-puff is also gradually deteriorating. The average oil saturation change over 10 cycles is calculated, the average oil saturation reduces by 0.8%–1.9% per cycle. Compared with Fig. 6, the maximum sweep radius and oil saturation in light oil shows that CO2 huff-and-puff shows superior performance in heavy oil reservoirs compared to light oil. This is primarily due to the high viscosity and poor mobility of heavy oil, and the rapid coning of edge-bottom water for heavy oil results in low oil recovery during water flooding. Residual oil saturation is high prior to the CO2 huff-and-puff, consequently, CO2 injection can interact with oil over a larger range, exhibiting stronger viscosity reduction and swelling effects on heavy oil. Therefore, the oil saturation reduction per cycle is more pronounced, with an average reduction in oil saturation per cycle being 0.58%, greater than that in light oil.

Figure 4: CO2 huff-and-puff swept radius and average oil saturation calculation

Figure 5: CO2 huff-and-puff molar fraction and oil saturation at 10 m oil column height (μ = 170 mPa·s)

Figure 6: CO2 huff-and-puff radius and average oil saturation at 10 m oil column height (μ = 2.7 mPa·s)
Fig. 7 illustrates daily oil production in CO2 huff-and-puff for crude oils with two different viscosities. Defining cumulative oil production of less 50 t per cycle as the criterion for huff-and-puff failure, the optimal CO2 huff-and-puff cycles for heavy oil are 9 with a cumulative oil production of 2550 t, while for light oil, the optimal cycles are 7 with a cumulative production of 1790 t. The daily oil production curve indicates that the CO2 huff-and-puff performance of crude oils with two different viscosities sharply declines from the fourth cycle onward. This is due to the reduced increase in the CO2 swept radius and swept area after the fourth cycle.

Figure 7: The daily oil production of different cycles for wells with different viscosities and 10 m oil column height
3.2 Adaptability of CO2 Huff-and-Puff to Heavy and Light Oil
Fig. 8 presents the oil production and oil exchange ratio (oil production/gas injection volume) during CO2 huff-and-puff cycles. The results are for oils of different viscosities with constant oil column heights. The results demonstrate that the cumulative heavy oil production and oil exchange ratio is greater than that of light oil. This comparison is made under the same gas injection volumes, soaking times, and injection rates.

Figure 8: CO2 huff-and-puff development effect in oil wells with oil viscosities and 10 m oil column heights
In the actual development of shallow NP reservoirs, the wells in the medium and high sections of heavy oil groups are regarded as Type I well, while the wells in the high sections of light oil groups and the low sections of heavy oil groups are regarded as Type II well. According to the actual well production, the oil exchange ratio and the cost-to-benefit ratio variations of CO2 huff-and-puff are calculated, as shown in Fig. 9. The cost-to-benefit ratio is defined as the total output revenue divided by the total input cost, with the oil price set at 444.15 $/t. Excluding fixed costs, the CO2 huff-and-puff cost is 63.09 $/t and the oil and gas production operating cost is 144.41 $/t.

Figure 9: Statistical diagram of the implementation effect of NP shallow reservoirs
As shown in Fig. 9, the average single-well oil production for Type I well is 359 t per cycle, while that for Type II well is 239 t per cycle. This study determined the optimal CO2 huff-and-puff cycles and the corresponding oil production per cycle for wells with a 10 m oil column height. The results are consistent with actual field development results. Therefore, the results of this study can provide important theoretical support for CO2 field practice in similar reservoirs.
3.3 Adaptability of CO2 and N2 Synergistic Huff-and-Puff to Heavy Oil and Light Oil
During the development of the NP-M block, the development of reservoir faults has led to the formation of small fault-block areas with poor energy supply locally. Considering that the reservoir has a dip angle, the gravity override of N2 is utilized in actual development, and the CO2 and N2 synergistic huff-and-puff is implemented. However, the adaptability to CO2 and N2 synergistic huff-and-puff technology to the oils of different viscosities, especially the optimal injection ratio of CO2 and N2 still lacks of in-depth understanding. Therefore, to accommodate the geological and dip characteristics of the NP-M block, the reservoir dip angle is set as 10°. The small-energy bottom water of 10 times the reservoir pore volume at the low part of the model is set. This study focuses merely on the development performance of production wells in the middle section. The wells are produced at the constant liquid rate of 10 m3/d until the oil production declines to 2 m3/d under depletion development, and the N2 and CO2 synergistic huff-and-puff is initiated, the development performance is calculated for the heavy oil and light oil. The injection volumes of N2 are 1 × 10⁴ m3, 5 × 10⁴ m3, 8 × 10⁴ m3, 10 × 104 m3, and 15 × 104 m3, while the injection volumes of CO2 are 200, 250, 300, 350, and 400 t. This study employs an orthogonal design method to formulate the simulation scheme, comprising a total of 12 schemes (as shown in Table 1). The optimal gas injection ratio is determined by comparing the oil exchange ratio of different schemes, and the simulation results as illustrated in Fig. 10.


Figure 10: Relationship curve between the ratio of oil draining rate and gas injection volume
As shown in the figure, with the decrease of the injection ratio (the increase of N2 injection volume), the oil exchange ratio of heavy oil and light oil initially increase and then decrease. This trend is primarily attributed to the fact that when the N2 injection volume is low, the gravity override is not significant in Fig. 11a. As the N2 injection volume increases, the gravity override effect becomes more pronounced, which leads to the higher displacement efficiency of residual oil in the upper zones (Fig. 11b). However, with increase of N2 injection volume, gas channeling occurs, which results in the formation of residual oil enrichment zones and the decline in oil displacement efficiency (Fig. 11c). Therefore, the oil exchange ratio is used as the evaluation criterion, and the inflection point of the gas injection ratio curve is taken as the optimal injection ratio. The optimal CO2: N2 injection ratio for heavy oil is 2.1, and the maximum oil exchange ratio is 3.77 t/t. For light oil, the optimal injection CO2:N2 ratio is 1.67, and the maximum oil exchange ratio is 2.33 t/t. The difference primarily arises from the higher viscosity of heavy oil compared to the light oil, and the greater CO2 injection volume, the more effectively viscosity reduction.

Figure 11: Gas saturation distribution of heavy oil under CO2 and N2 synergistic huff-and-puff
To further study the energy enhancement and supplement effects of N2, Fig. 12 presents the formation pressure under different injection schemes. It can be observed that the higher N2 injection volume leads to the greater increase in formation pressure under the same viscosity conditions, which indicates the more pronounced energy enhancement effect of N2. When the appropriate volume of N2 is injected, it can effectively enhance the gravity override effect of N2, thereby tapping into the residual oil in the upper reservoir zones and improving oil recovery. The reason is that N2 is a highly expansive gas. When the N2 is injected into the formation, as the injection volume increases, N2 that does not dissolve in the oil occupies the formation pore and fracture space. With the swelling of N2, the formation pressure gradually increases.

Figure 12: Formation pressure under different injection schemes
(1) CO2 huff-and-puff shows superior performance in heavy oil reservoirs compared to light oil. After 10 cycles of CO2 huff-and-puff, the maximum sweep radius in heavy oil reaches 100 m, the average oil saturation reduction by 0.8%–1.9% per cycle. The maximum sweep radius in light oil merely reaches 65 m, the average oil saturation reduction in light oil per cycle is 0.58% lower than in heavy oil.
(2) The daily oil production of CO2 huff-and-puff sharply declined in the fourth cycle. The optimal CO2 huff-and-puff cycles were 9 for heavy oil groups, with the cumulative oil production of 2550 t. The optimal CO2 huff-and-puff cycles were 7 for light oil groups, with a cumulative oil production of 1790 t.
(3) For oil wells with insufficient energy supply, CO2 and N2 synergistic huff-and-puff is employed to improve oil displacement efficiency. With increase of N2 injection volume, the gravity override effect of N2 improve oil recovery. However, further increasing the N2 injection volume may lead to gas channeling, which adversely affects development performance. The optimal CO2: N2 injection ratio for heavy oil is 2.1:1, achieving the maximum oil exchange ratio (3.77). For light oil, the optimal ratio is 1.67:1, achieving the highest oil exchange ratio (2.33).
Although the above results provide supporting evidence for the application of CO2 and CO2:N2 synergistic huff-and-puff technology in NP reservoirs, this study still has certain limitations. Specifically, the constructed numerical model has not yet incorporated the geochemical reactions among CO2, formation water, and rock. Future research will expand this model to include more influencing factors, thereby further validating and optimizing the technical approach proposed in this work.
Acknowledgement: None.
Funding Statement: The work presented in this study was financially supported by the National Natural Science Foundation of China (Grant No. 52374032) and the Key Research and Development Program of Heilongjiang Province (Grant No. JD22A004).
Author Contributions: The authors confirm contribution to the paper as follows: Writing, analysis and interpretation of results, preparation of the draft: Xiutai Cao; Review resources and methodology guidance: Huiying Zhong; Editing and writing: Yuxin Sun and Bowen Shi; Data collection, conception: Hao Zhang and Hongli Tang; Supervision: Yongbin Bi. All authors reviewed the results and approved the final version of the manuscript.
Availability of Data and Materials: The data that support the findings of this study are available from the corresponding author upon reasonable request.
Ethics Approval: Not applicable.
Conflicts of Interest: The authors declare no conflicts of interest to report regarding the present study.
References
1. Zhou X, Yuan Q, Peng X, Zeng F, Zhang L. A critical review of the CO2 huff ‘n’ puff process for enhanced heavy oil recovery. Fuel. 2018;215(2):813–24. doi:10.1016/j.fuel.2017.11.092. [Google Scholar] [CrossRef]
2. Liu J, Li H, Tan Q, Liu S, Zhao H, Wang Z. Quantitative study of CO2 huff-n-puff enhanced oil recovery in tight formation using online NMR technology. J Petrol Sci Eng. 2022;216(3):110688. doi:10.1016/j.petrol.2022.110688. [Google Scholar] [CrossRef]
3. Abedini A, Torabi F. Oil recovery performance of immiscible and miscible CO2 huff-and-puff processes. Energy Fuels. 2014;28(2):774–84. doi:10.1021/ef401363b. [Google Scholar] [CrossRef]
4. Rogelj J, den Elzen M, Höhne N, Fransen T, Fekete H, Winkler H, et al. Paris agreement climate proposals need a boost to keep warming well below 2°C. Nature. 2016;534(7609):631–9. doi:10.1038/nature18307. [Google Scholar] [PubMed] [CrossRef]
5. Lei Z, Liu Y, Wang R, Li L, Liu Y, Zhang Y. A microfluidic experiment on CO2 injection for enhanced oil recovery in a shale oil reservoir with high temperature and pressure. Energies. 2022;15(24):9461. doi:10.3390/en15249461. [Google Scholar] [CrossRef]
6. Zhou X, Li X, Shen D, Shi L, Zhang Z, Sun X, et al. CO2 huff-n-puff process to enhance heavy oil recovery and CO2 storage: an integration study. Energy. 2022;239:122003. doi:10.1016/j.energy.2021.122003. [Google Scholar] [CrossRef]
7. Ampomah W, Balch RS, Grigg RB, McPherson B, Will RA, Lee SY, et al. Co-optimization of CO2-EOR and storage processes in mature oil reservoirs. Greenhouse Gases. 2017;7(1):128–42. doi:10.1002/ghg.1618. [Google Scholar] [CrossRef]
8. Peng X, Wang Y, Diao Y, Zhang L, Yazid IM, Ren S. Experimental investigation on the operation parameters of carbon dioxide huff-n-puff process in ultra low permeability oil reservoirs. J Petrol Sci Eng. 2019;174(43):903–12. doi:10.1016/j.petrol.2018.11.073. [Google Scholar] [CrossRef]
9. Li S, Lu C, Wu M, Hu Z, Li Z, Wang Z. New insight into CO2 huff-n-puff process for extraheavy oil recovery via viscosity reducer agents: an experimental study. J CO2 Util. 2020;42(9):101312. doi:10.1016/j.jcou.2020.101312. [Google Scholar] [CrossRef]
10. Xu J, Wan H, Wu Y, Liu S, Yan B. Study on CO2-enhanced oil recovery and storage in near-depleted edge–bottom water reservoirs. J Mar Sci Eng. 2024;12(11):2065. doi:10.3390/jmse12112065. [Google Scholar] [CrossRef]
11. Dou LR, Sun LD, Lyu WF, Wang MY, Gao F, Gao M, et al. Trend of global carbon dioxide capture, utilization and storage industry and challenges and countermeasures in China. Petrol Explor Dev. 2023;50(5):1083–96. (In Chinese). doi:10.1016/s1876-3804(23)60463-x. [Google Scholar] [CrossRef]
12. Zhang L, Zhang T, Leng J, Zheng Z, Qi Y, Tang L, et al. Comprehensive numerical Eval-uation of CO2 huff-n-puff in an offshore tight oil reservoir: a case study in Bohai Bay Area. ACS Omega. 2024;9(22):23892–23902. doi:10.1021/acsomega.4c01907. [Google Scholar] [PubMed] [CrossRef]
13. Liu J, Xie M, Liu D, Cao L, Xie S, Chang Y, et al. Research on mechanism and effect of enhancing gas recovery by CO2 huff-n-puff in shale gas reservoir. ACS Omega. 2024;9(30):33111–33118. doi:10.1021/acsomega.4c04464. [Google Scholar] [PubMed] [CrossRef]
14. Xu Z, Zhou L, Ma S, Qin J, Huang X, Han B, et al. Study on CO2 huff-n-puff development rule of horizontal wells in heavy oil reservoir by taking Liuguanzhuang oilfield in dagang as an example. Energies. 2023;16(11):4258. doi:10.3390/en16114258. [Google Scholar] [CrossRef]
15. Zhao F, Wang Y, Huang S, Liu M, Yang C. Implementation and adaptability analysis of numerical simulation for shale oil CO2 huff and puff. Energies. 2024;17(2):454. doi:10.3390/en17020454. [Google Scholar] [CrossRef]
16. Shabib-Asl A, Chen SN, Zheng S. Performance of CO2 foam huff and puff in tight oil reservoirs. Front Energy Res. 2022;10:826469. doi:10.3389/fenrg.2022.826469. [Google Scholar] [CrossRef]
17. Afari S, Ling K, Sennaoui B, Maxey D, Oguntade T, Porlles J. Optimization of CO2 huff-n-puff EOR in the Bakken Formation using numerical simulation and response surface methodology. J Petrol Sci Eng. 2022;215(4):110552. doi:10.1016/j.petrol.2022.110552. [Google Scholar] [CrossRef]
18. Wei M, Bai B. Effect of molecular-diffusion mechanism on CO2 Huff-n-puff process in shale-oil reservoirs. In: Proceedings of the Society of Petroleum Engineers-SPE Kingdom of Saudi Arabia Annual Technical Symposium and Exhibition; 2017 Apr 27; Dammam, Saudi Arabia. p. 582–8. doi:10.2118/188003-MS. [Google Scholar] [CrossRef]
19. Tang X, Li YQ, Han X, Zhou YB, Zhan JF, Xu MM, et al. Dynamic characteristics and influencing factors of CO2 huff and puff in tight oil reservoirs. Petrol Explor Dev. 2021;48(4):817–24. (In Chinese). doi:10.1016/s1876-3804(21)60079-4. [Google Scholar] [CrossRef]
20. Wang P, Zhao F, Huang S, Zhang M, Feng H, Li Y, et al. Laboratory investigation on oil increment and water cut control of CO2, N2, and gas mixture huff-n-puff in edge-water fault-block reservoirs. J Energy Resour Technol. 2021;143(8):083001. doi:10.1115/1.4048862. [Google Scholar] [CrossRef]
21. Soave G. Equilibrium constants from a modified Redlich-Kwong equation of state. Chem Eng Sci. 1972;27(6):1197–203. doi:10.1016/0009-2509(72)80096-4. [Google Scholar] [CrossRef]
22. Peng DY, Robinson DB. A new two-constant equation of state. Ind Eng Chem Fund. 1976;15(1):59–64. doi:10.1021/i160057a011. [Google Scholar] [CrossRef]
Cite This Article
 Copyright © 2026 The Author(s). Published by Tech Science Press.
This work is licensed under a Creative Commons Attribution 4.0 International License , which permits unrestricted use, distribution, and reproduction in any medium, provided the original work is properly cited.
 Downloads
 Citation Tools
