
 Login
Login Register
 Submit a Paper
 Propose a Special lssue
 Open Access
ARTICLE
Techno-Economic Analysis of a Power-to-Heat System with Waste Water Heat Recovery Powered Mainly by an Off-Grid Wind Turbine
HAWK University of Applied Sciences and Arts Hildesheim/Holzminden/Göttingen, Göttingen, Germany
* Corresponding Author: Johannes D. Pelda. Email:
(This article belongs to the Special Issue: Selected Papers from the SDEWES 2025 Conference on Sustainable Development of Energy, Water and Environment Systems)
Energy Engineering 2026, 123(8), 25 https://doi.org/10.32604/ee.2026.079450
Received 21 January 2026; Accepted 28 April 2026; Issue published 12 July 2026
 View Full Text
 Download PDF
Abstract
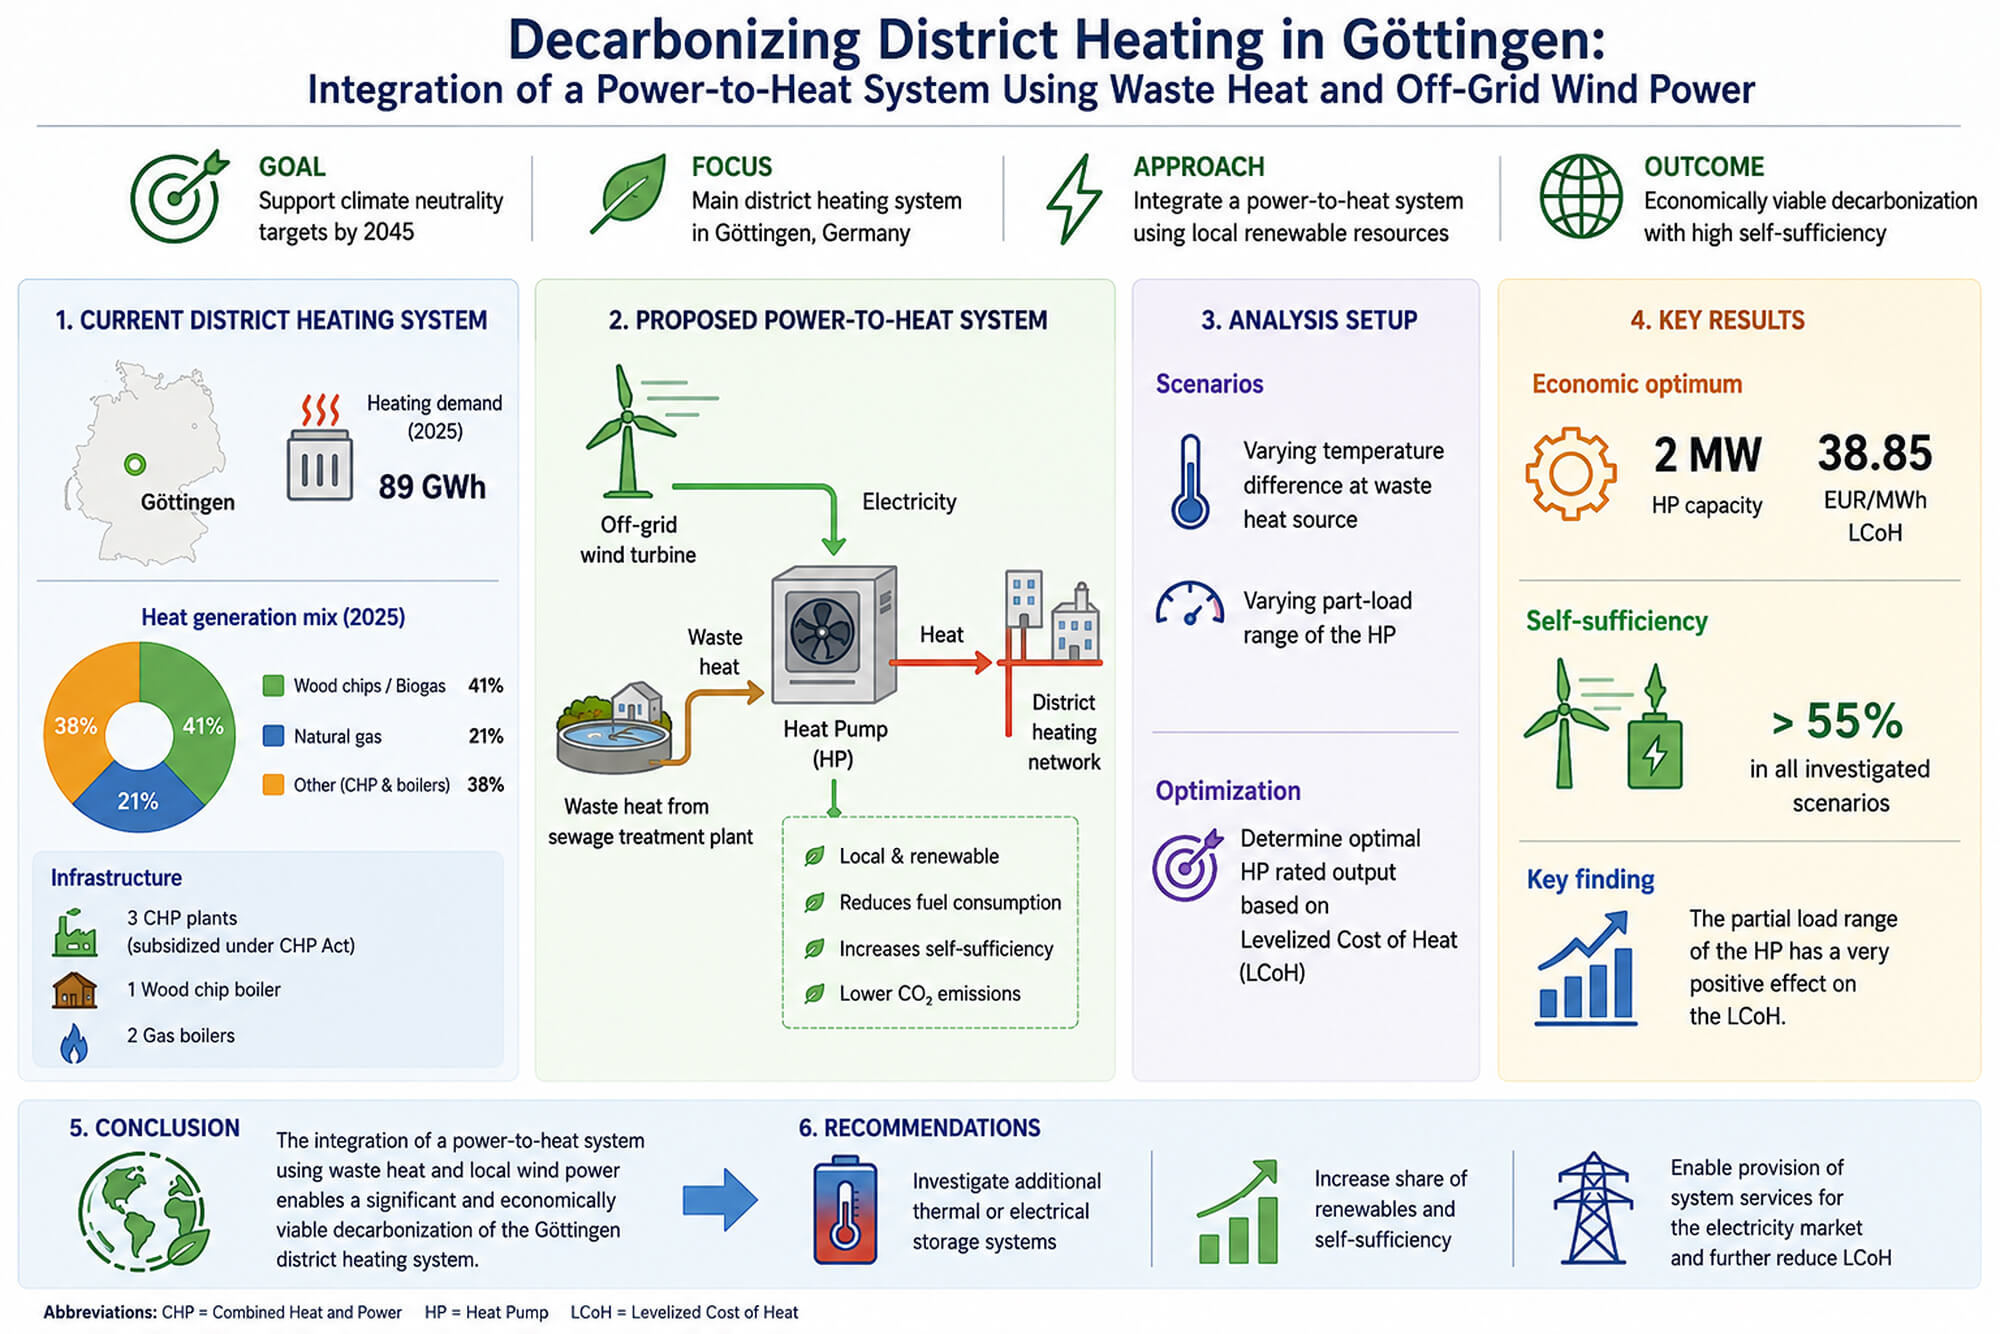
The transformation of district heating systems in Germany is a central topic in energy and climate policy, given the 2045 climate neutrality targets. This study focuses on the main district heating system in the city of Göttingen in Germany, whose heat generation currently relies primarily on three Combined Heat and Power (CHP) plants subsidized under the German CHP Act, one wood chip boiler and two gas boilers. In 2025, the network’s heating demand amounted to 89 GWh, which was mainly covered by wood chips or biogas (41%) and natural gas (21%). This paper examines an option for increasing the share of renewable energy in the main district heating system of Göttingen. Therefore, this work analyses the integration of a power-to-heat system from a technical and economic perspective. The power-to-heat system consists of a Heat Pump (HP) that uses waste heat from a sewage treatment plant and is primarily powered by an off-grid wind turbine. The scenarios simulated vary in the temperature difference at the waste heat source and the part-load range of the HP. The optimum rated output of the HP is then determined based on the Levelized Cost of Heat (LCoH). The results indicate that the economic optimum is achieved with a HP of 2 MW capacity reaching a LCoH of 38.85 EUR/MWh. The integration of an on-site wind power plant ensures a self-sufficiency ratio above 0.55 in all investigated scenarios. Furthermore, the partial load range of the HP has a very positive effect on the LCoH. Overall, this analysis demonstrates a significant and economically viable decarbonization of the district heating system using local resources. Based on these results, it is recommended to investigate the potential benefits of integrating additional thermal or electrical storage systems. This could increase the share of renewable energies in the district heating system as well as the degree of self-sufficiency, and enable the provision of system services for the electricity market. Such measures could also contribute to a further reduction in the LCoH.Graphic Abstract
Keywords
Greenhouse gas emissions caused by human activities are the primary cause of the observed warming of the climate system and one of the greatest threats of the 21st century [1]. Global greenhouse gas emissions have reached record levels in recent years, with energy-related
Reducing
In Germany, renewable energies account for around 55% of electricity generation, but only approximately 22% of heat supply. Overall, the heating sector is responsible for about 20% of total
A significant reduction in annual greenhouse gas emissions is possible, particularly in District Heating (DH). In 2024, the share of renewable energy in this sector was only 19% [8]. Providing heat with large-scale heat pumps (HPs) is one option for decarbonizing DH. Industrial waste heat or waste heat from waste water can be efficiently tapped for this purpose [6] (p. 413).
As part of its ambitious climate protection goals, the city of Göttingen wants to make its DH supply more sustainable. Stadtwerke Göttingen, the operator of the analysed DH system, has contractually committed to a primary energy factor below 0.5 and a
Currently, the district heating system in the city of Göttingen comprises two biomass boilers, several combined heat and power units fueled by biogas or natural gas, and direct utilization of industrial waste heat. In 2025, the DH system derived 41% of its energy from renewable sources and waste heat [10].
In addition to the existing renewable energy sources, one component in the transformation of DH supply in Göttingen could be the integration of waste heat from the treated waste water at the waste water treatment plant in Göttingen using a water-to-water HP. The electrical energy from an off-grid wind turbine promises low electricity procurement costs, since the economic viability of a HP depends mainly on electricity costs [11,12]. The system configuration is shown in Fig. 1.

Figure 1: Schema of the analysed energy system (Icons used from istock, pngtree.com, freepik.com, and flaticon.com).
There are several plants in Europe with HPs that utilize waste heat from waste water. Examples include [13] with a thermal capacity of 1.9 MW, [14] with 4.5 MW, and [15] with 40 MW, whereby the thermal energy of the waste water is increased from
This paper aims to address the techno-economic feasibility and optimal sizing of a HP and an off-grid wind turbine, as well as the associated energy flows when connected to the local DH network.
Using several scenarios, the energy and economic interactions of the most important system components—waste water flow, DH network, and wind turbines—are evaluated on the basis of hourly balances. The scenarios differ with respect to the temperature drop at the waste heat source, the nominal thermal output of the HP, and the Partial Load (PL) range. The PL range defines how a HP can reduce its power rating. 100% means a variation of 0 to maximum power rating is possible. Together with the investment and operating costs, economic parameters are calculated, including the LCoH. The LCoH is then used to determine the optimal system configuration.
The work begins with the fundamentals of the state of the art and current knowledge. The input data and methodology are then described. This includes data handling, energy balance calculations, formulation of adequate scenarios, and the basis for technical and economic analysis. The work concludes with the techno-economic results and further research questions.
The input data for the simulation include weather data, waste water volume flows and temperatures at the outlet of the waste water treatment plant, and the hourly DH demand in Göttingen. The energy system is influenced by local weather conditions. The German DWD Climate Data Center [17] provides weather data for the city of Göttingen including air temperature 2 m above ground level and wind speed 12 m above ground level. These data are available for all years in the study period; data from the year 2019 are used which match the year of measurement at the waste water treatment plan. In total, there are 122 h of missing outdoor temperature measurements, which are supplemented by the smoothed outdoor temperature of the measurements before and after. In the data set, there are 82 h of missing wind speed measurements, which are replaced by the monthly average wind speed.
For the energy system model, a wind turbine of type Enercon E-160 EP3 E2 was selected which provides the electrical energy for operating the HP in addition to the grid connection. The electrical output is calculated hourly using the system-specific performance curve and the wind speeds from [17] extrapolated to 120 m hub height with Eq. (1), which specifies the electrical power as a function of wind speed at hub height.
where
The wind turbine supplies the HP with electrical energy via a direct line, thereby avoiding grid fees. This results in electricity procurement costs from the wind turbine of 0.0735 EUR/kWh, which corresponds to the “
2.2 Waste Water Heat at the Effluent Outlet of the Waste Water Treatment Plant
According to [20,21], the waste water at the outlet of a waste water treatment plant is on average 5 to 10 Kelvin warmer than the outside air over the course of a year. The difference is greatest during the winter months from October to April. This is also seen at the outlet of the waste water treatment plant in the city of Göttingen in Fig. 2. There, the waste water flow at the outlet of the treatment plant is given with daily temperature and daily volume flow for the year 2019.

Figure 2: Temperature curve of the waste water stream at the waste water treatment plant. The difference in temperature between the waste water and the ambient temperature is greatest during winter months.
For the simulation, the daily values are distributed evenly across the hours of the day, with the heat extractable from the waste water being calculated using Eq. (2).
where
It is assumed that the heat exchanger is capable of transferring the required heat load. The reduction in heat transfer performance due to biofilm formation is accounted for by appropriate over-sizing of the heat transfer area. This corresponds to common engineering practice, where fouling resistances are considered during the design stage using fouling factors or safety margins [22].
In practical operation, biofilm growth and removal processes (e.g., due to shear stress) typically reach a dynamic equilibrium, resulting in an asymptotic fouling resistance and a quasi-steady heat transfer performance [22] (p. 11–15). This approach is also consistent with industrial design practices as described in heat exchanger design guidelines [23].
The HP is modelled on the basis of a standard thermodynamic cycle. The working medium evaporates in the heat exchanger on the heat source side, absorbing thermal energy in the process shown in Fig. 3 points ① to ②. A compressor in ② uses electrical energy to increase the temperature and pressure level of the working medium. Finally, the working medium releases its heat for heating purposes via a second heat exchanger, also referred to as the condenser on the heat sink side, between ② and ③. After passing through an expansion valve in ④, the temperature and pressure of the working medium drop back to their initial state. After condensation, the working medium begins the cycle anew. Overall, the HP raises the temperature of the treated waste water flow and feeds the thermal energy thus generated into the supply line of the district heating network. Ammonia (

Figure 3: Schematic flow diagram of a waste water-based heat pump, showing the typical units and components. Adapted from [25].
Various key figures are used for technical and economic evaluation: the Coefficient of Performance (COP), the Annual Performance Factor (APF)1, the Full Load Hour (FLH), the Levelized Cost of Heat (LCoH), and the Degree of Self-sufficiency (DSs).
Following [26], the operation of a HP can be described in a practical yet idealized manner by the Lorenz cycle. The corresponding
According to [26], the
Losses in the system components and peripherals are simplified and taken into account using the degree of quality (

With Eq. (8) the energy balance of the HP can be expressed. Depending on the consumed electric power (
The APF shows the annual (a) efficiency of a HP and is the quotient of the annual thermal energy (
The FLH is calculated from the annual amount of thermal energy generated (
The investment costs are derived from the costs of tapping the heat source, the HP itself, and other auxiliary equipment. The literature provides figures of different existing HP systems, given in Table 2. From these key metrics a regression function can be derived as shown in Fig. 4.


Figure 4: Specific investment costs of HPs and the regression function derived from them. The references can be found in Table 2.
Using the result from Fig. 4, the specific investment costs (
Additionally, the costs of Operation and Maintanance (O&M), excluding energy costs, must be determined. Literature assumes the O&M costs to be between 1.5% and 3% of the investment costs (see Table 3). In this paper, 3% is used.

Given an expected lifetime (
Following Eq. (14), the quotient of total costs (
The heat pump’s DSs is defined as the ratio of the electricity supplied to the HP by the wind turbine to the total electrical energy used by the HP.
The Agora Energiewende study “The roll-out of large-scale heat pumps in Germany” [11] compares different heat sources for large HPs. They conclude that the investment costs for HPs that use the heat at the outlet of a waste water treatment plant are the lowest [11] (p. 75). Furthermore, plants are designed for a high annual operating time in order to achieve low heat production costs. Up to 7500 FLH are achieved, for instance in [43]. In 2023, HPs with a total rated thermal output of 60 MW were installed in Germany and 600 MW were in planning or under construction [34].
The hourly heat load curve for the DH network from 2016 is adjusted to 2019 using the specific heating load curve. The geometric mean of the outside temperatures over the preceding four days, calculated in Eq. (15), is used to generate a smoothed outside temperature that takes into account the thermal inertia of buildings. Using the hourly DH demand and the smoothed hourly outside temperature, three specific heating load curves with the highest possible coefficient of determination are derived, see Eq. (16). With these three specific heating load curves, the DH demand is approximated for 2019 as a function of the outside temperature.
where
where
Data from the existing biomass plant of the Stadtwerke Göttingen show quarterly supply and return temperatures of approximately
The first result shows the potential of the heat source according to the scenarios in which heat consumption is guaranteed at all times. Next, the total heat that can be provided by the HP is only limited by the DH demand. Here, an inexhaustible heat source is considered. The combination of both results forms the basis for creating a time series over one year, calculating the electricity supply balance, and dimensioning the final HP.
3.1 Potential of the Heat Source
Fig. 5 shows that the amount of waste heat from the waste water increases linearly with the extraction capacity to just under 26 MW at a maximum temperature spread of

Figure 5: Influence of the temperature spread over the nominal thermal power of the heat pump. The available amount of waste heat from the waste water is not constrained by the district heating demand.
The temperature spread (
This indicates that, with few exceptions, the waste water temperature remains above
The extraction capacity also influences the number of FLHs in an almost linear fashion. In the worst case, the FLHs begin to decrease from 8760 to 3000 h in the case of a
3.2 Potential for Partial Load of the Heat Pump
The maximum heat quantity of 80 GWh/a is provided by a HP with a maximum PL range of 100% and a nominal thermal output between 21 and 26 MW (see Fig. 6). At a PL range of 75%, this is 70 GWh/a at a power rating of 17 MW, at 50% it is 62 GWh/a at 15 MW, and at 25% it is 52 GWh/a at 12 MW. In general, the lower the PL range, the greater the drop in heat output after the peak has been reached.

Figure 6: Influence of the partial load (PL) range over the nominal thermal power of the heat pump. The available amount of waste heat from the waste water is constrained by the district heating demand.
Up to a power rating of 2 MW, 8760 full utilization hours can be achieved. At maximum power rating, these are reduced to around 3000 h at 100% PL range and to just over 100 h at 25% PL range. FLHs decrease more significantly with increasing power rating and lower PL ranges.
3.3 Potential of the Overall System and System Design
According to Fig. 5, up to 7 MW of heat output can theoretically be extracted from the waste water stream, with the heat quantity and FLHs remaining the same across all scenarios. According to Fig. 6, however, the annual heat quantity increases sharply up to a nominal output of 3 MW. The increase slows down above 3 MW. At 3 MW, the ratio of heat quantity to nominal output is optimal with maximum annual heat quantity. Looking at Fig. 6, the FLHs are greatest up to a nominal thermal power of 2 MW. Therefore, an optimal LCoH can be assumed for a nominal output of up to 2 MW.
This is confirmed by the overview of the LCoH in Table 4. In accordance with the maximum achievable FLH in Fig. 6, all scenarios up to a nominal output of 2 MW have a favorable LCoH. These remain constant for increasing temperature spreads or PL ranges. The greater the nominal output, the greater the influence of the PL range on the LCoH. In general, the greater the PL range, the greater the nominal output of the HP can be. The temperature spread has a negligible influence on the LCoH. In summary, it should be noted that the HP is designed for the most advantageous LCoH at 2 MW.

The sensible choice of a rated power of 2 MW is also confirmed by the course of the APF. Fig. 7 shows the thermal energy and the APF over the nominal thermal power of the HP. The APF drops down strongly from nearly 4 to approximately 3.5 until a rated power of around 2 MW is reached for every scenario. For higher nominal thermal power, it levels out at around 3.

Figure 7: Thermal energy and annual performance factor of the scenarios.
As the temperature spread has no impact on the LCoH, Fig. 8 is important to determine

Figure 8: Energy balances and degree of self-sufficiency over different temperature spreads at waste heat source.
Fig. 9 shows DH generation in 2019, totaling 80 GWh, broken down by the types of heat generators used and the scenarios analysed in this study. In addition, the amount of heat generated by the HP is shown, which cannot be fed into the district heating network due to a lack of simultaneity between generation and demand.

Figure 9: Share of heat generation in the district heat demand and unused heat pump heat due to lack of simultaneity.
As an example, the scenario with a temperature spread of 4 Kelvin shows that 76% of the potential HP energy could be used, while 24% of the DH was provided by other heat generators. A further 23% of the total amount of district heat demand could also have been covered by the HP if demand and generation had been simultaneous.
It also shows that with a temperature spread of 5 Kelvin, the ratio of usable HP heat to total HP heat generated is highest at 1.59.
Taking everything into account, the system would be optimally designed according to the operating parameters in Table 5. This results in the costs and emission reductions shown in Table 6.


The HP has a power rating of 2 MW, and a PL capacity of 90% ensures a high degree of flexibility. The amount of heat provided over the course of the year 2019 is 17.5 GWh/a. The electrical energy required to operate the system comes from two sources: On the one hand, around 1.18 GWh/a is provided by the power grid, and on the other hand, 3.60 GWh/a is sourced directly from the connected wind turbine. This results in a total electricity consumption of 4.78 GWh/a. With a total of 8741 FLH, the HP is used intensively. The degree of electricity self-sufficiency is particularly noteworthy: with a self-sufficiency rate of around 75%, the majority of the electricity demand can be covered by renewable, locally generated wind energy. This results in low electricity costs and low
The economic parameters in Table 6 show that the annual investment costs for the HP amount to 171,000 EUR/a, plus 43,000 EUR/a for O&M. The electricity costs are divided proportionally between grid electricity, at approximately 200,707 EUR/a, and electricity from the wind turbine, at around 264,721 EUR/a. The total annual electricity costs therefore amount to approximately 465,311 EUR/a. The total annual system costs for the HP are therefore around 679,200 EUR/a. These total costs result in a LCoH of 38.85 EUR/MWh. The system achieves annual
The DH demand of 2016 has been transferred to 2019 using a smoothed outdoor temperature. This approach minimizes the influence of short-term weather fluctuations and allows the typical DH load curve to be represented more accurately. The data set has only minor data gaps in September. While the deviation between the generated load data and the climate-adjusted heat demand in 2016 is negligible in terms of annual balance, the accuracy of hourly values cannot be verified. As a result, peak loads and short-term variations in the simulated DH demand may differ from actual operation, which could lead to slight over- or underestimation of the HP performance and the corresponding LCoH and
Similarly, the waste water flow data are only available on a daily basis, which introduces additional uncertainties. Due to the hourly resolution of the simulation, short-term fluctuations in waste water availability might not be captured, potentially affecting the hourly heat supply from the HP. Access to higher-resolution data (e.g., 15-min intervals) would improve the reliability of the results and allow a more precise assessment of the economic and environmental impacts, such as sector coupling, wind power trading, and electricity demand of the HP.
The investment costs correspond to those in [45]. Since electricity prices in particular influence the economic efficiency of a HP, a sensitivity analysis should be carried out here. Nevertheless, assuming a trend toward lower electricity prices with increasing shares of renewable energy, the LCoH could be expected to decrease. If additional flexibility of large HPs to support the electrical grid is considered, further economic benefits may result. Moreover, the costs of connecting the HP to a wind turbine via a private line are currently uncertain, as the exact turbine location and applicable legal requirements are not yet determined. These factors could influence the overall economic assessment.
Furthermore, only a small portion of the waste heat potential of the waste water is utilized with a 2 MW HP. Given the relatively low LCoH compared to other renewable thermal sources such as geothermal, deploying a larger nominal capacity may be justified if it leads to greater

Figure 10: Hourly heat demand and difference between heat demand and thermal output of the heat pump.
The study shows that the use of waste water heat via HPs can be an attractive concept for decarbonizing municipal DH. The concept can be implemented economically, particularly with the wind turbine, which operates the HP via its own power grid. For the site in Göttingen, the best LCoH is achieved by installing a 2 MW HP covering up to 75% of its electricity requirements from wind power. The heat generated is cost-effective with a LCoH of 38.85 EUR/MWh, and the system enables 2867 t of
The combination of wind power and large-scale HPs using waste heat from waste water is an effective tool for the climate-friendly transformation of DH supply. From an economic and ecological perspective, it is important in Germany to supply the HP with local, off-grid, renewable, and cost-effective electricity as this is exempt from taxes and levies. The methodological assessment underscores the fundamental feasibility, but also identifies limitations in terms of data quality and influences that have not been taken into account: e.g., industrial base load, flexibly controllable loads.
Further analyses should use input data with higher temporal resolution. This applies in particular to load and source profiles. Heat and, where applicable, electricity storage should also be integrated in order to reduce the mismatch between heat source and sink. The resulting added value of balancing out possible fluctuations as a system service on the energy market could have a positive impact on the LCoH.
Acknowledgement: We would like to thank Stadtwerke Göttingen for providing data on district heating demand and GEB Göttinger Entsorgungsbetriebe for providing measurements of the waste water flows.
Funding Statement: The work described in this publication has received funding from the EU-Life-Program under grant agreement No. 101120948, https://webgate.ec.europa.eu/life/publicWebsite/project/LIFE22-CET-HeatMineDH-101120948/low-grade-renewable-and-waste-heat-mapping-and-investment-planning-for-efficient-district-heating and is part of the HeatMineDH research project. Views and opinions expressed are however those of the author(s) only and do not necessarily reflect those of the European Union or CINEA. Neither the European Union nor the granting authority can be held responsible for them.

Author Contributions: Conceptualization, Johannes D. Pelda, Sebastian Aichele; funding acquisition, Dmitry Romanov, Stefan Holler; methodology, Sebastian Aichele, Johannes D. Pelda; data curation, Sebastian Aichele; writing—original draft preparation, Johannes D. Pelda, Sebastian Aichele; validation, Johannes D. Pelda, Stefan Holler; writing—review and editing, Johannes D. Pelda, Sebastian Aichele, Dmitry Romanov, Stefan Holler; supervision, Johannes D. Pelda, Stefan Holler. All authors reviewed and approved the final version of the manuscript.
Availability of Data and Materials: Data not available due to legal/commercial restrictions. Due to the nature of this research, participants of this study did not agree for their data to be shared publicly, so supporting data are not available.
Ethics Approval: Not applicable.
Conflicts of Interest: The authors declare no conflicts of interest.
1Alternative terms used in the literature include Seasonal COP (SCOP) or Seasonal Performance Factor (SPF).
References
1. IPCC. Climate change 2023: synthesis report. In: Contribution of Working Groups I, II and III to the Sixth Assessment Report of the Intergovernmental Panel on Climate Change. Geneva, Switzerland: IPCC; [cited 2026 Apr 7]. Available from: https://www.ipcc.ch/report/ar6/syr/. [Google Scholar]
2. International Energy Agency. International Energy Agency, editor. Global energy review 2025: CO2 emissions. [cited 2026 Apr 7]. Available from: https://www.iea.org/reports/global-energy-review-2025/co2-emissions. [Google Scholar]
3. United Nations Environment Programme. Emissions gap report 2025 [cited 2026 Apr 7]. Available from: https://www.unep.org/resources/emissions-gap-report-2025. [Google Scholar]
4. Quaschning V. Regenerative Energiesysteme: Technologie, Berechnung, Klimaschutz. 12th ed. München, Germany: Hanser; 2024. (In German). doi:10.3139/9783446478398?locatt=mode:legacy. [Google Scholar] [CrossRef]
5. Brown PT, Saunders H. Approximate calculations of the net economic impact of global warming mitigation targets under heightened damage estimates. PLoS One. 2020;15(10):e0239520. doi:10.1371/journal.pone.0239520. [Google Scholar] [PubMed] [CrossRef]
6. Sahling U, editor. Klimaschutz und Energiewende in Deutschland: Herausforderungen—Lösungsbeiträge—Zukunftsperspektiven. Berlin/Heidelberg, Germnay: Springer; 2022. (In German). [Google Scholar]
7. Bundesverband der Energie- und Wasserwirtschaft e V, editor. Wärmewende: um die Klimaziele zu erreichen, braucht es eine Wärmewende. In: Wie kann diese umgesetzt werden und welche Rolle spielt dabei die Energiewirtschaft? 2025 [cited 2026 Apr 7]. Available from: www.bdew.de. (In German). [Google Scholar]
8. BDEW. Die Energieversorgung 2024 [cited 2026 Apr 7]. Available from: https://www.bdew.de/media/documents/2024_12_18_Die_Energieversorgung_2024_Final.pdf. [Google Scholar]
9. Rappenecker G. Wirtschaftliche Fernwärme [German]. Göttingen; 2024. [Google Scholar]
10. AGFW. waermepreise.info. 2026 [cited 2026 Apr 8]. Available from: waermepreise.info. [Google Scholar]
11. Agora Energiewende, Fraunhofer IEG. The roll-out of large-scale heat pumps in Germany: studie. 2023 [cited 2026 Apr 8]. Available from: https://www.agora-energiewende.org/fileadmin/Projekte/2022/2022-11_DE_Large_Scale_Heatpumps/A-EW_316_Large_Scale_Heatpumps_EN_WEB.pdf. [Google Scholar]
12. Pelda J, Salaymeh A, Holler S, Reuter S, Gebetsroither-Geringer E, Paradiso R, et al. MEMPHIS 2.0—advanced algorithm for spatial identification, evaluation of temporal availability and economic assessment of waste heat sources and their local representation. Frankfurt, Germany: IEA DHC; 2023. [Google Scholar]
13. Stadtwerke Duisburg. Stadtwerke Duisburg nehmen erste Großwärmepumpe in Betrieb. 2023 [cited 2026 Apr 8]. Available from: https://www.stadtwerkeduisburg.de/presse/medieninformationen/newsdetail/stadtwerke-duisburg-nehmenerste-. [Google Scholar]
14. Güntert T. Die Schweizer machen’s vor: So wird aus Abwasser quasi Gold. 2024 [cited 2026 Mar 15]. Available from: https://www.suedkurier.de/region/kreis-konstanz/singen/die-schweizer-machens-vor-so-wird-aus-abwasser-quasi-gold;art372458,11978680. (In German). [Google Scholar]
15. GEA. How GEA heat pumps are decarbonizing district heating in Sweden: EON turns sewage into a valuable resource with GEA heat pump technology. [cited 2026 Apr 8]. Available from: https://www.gea.com/en/customer-cases/heat-pump-technology-eon-malmo/. [Google Scholar]
16. NIRAS. Economic benefits of energy efficiency in danish wastewater treatment. Allerød, Denmark: NIRAS; 2021. [Google Scholar]
17. DWD Climate Data Center. Open source database. 2025 [cited 2026 Apr 8]. Available from: https://opendata.dwd.de/. [Google Scholar]
18. Bundesnetzagentur. Windenergieanlagen an land. 2024 [cited 2026 Apr 8]. Available from: https://www.bundesnetzagentur.de/DE/Fachthemen/ElektrizitaetundGas/Ausschreibungen/Wind_Onshore/start.html. (In German). [Google Scholar]
19. BDEW. Strompreisanalyse Dezember. 2024 [cited 2026 Apr 8]. Available from: https://www.bdew.de/service/daten-und-grafiken/bdew-strompreisanalyse/. (In German). [Google Scholar]
20. Ostlender S, Kannengießer R, Kröning P, Vering C, Müller D. The agony of the choice in district heating: the impact of heat source for heat pumps. HPT Magaz. 2023;41(3):14–17. [Google Scholar]
21. Pieper H, Ommen T, Kjær Jensen J, Elmegaard B, Brix Markussen W. Comparison of COP estimation methods for large-scale heat pumps used in energy planning. Energy. 2020;205:117994. doi:10.1016/j.energy.2020.117994. [Google Scholar] [CrossRef]
22. Bott TR. Fouling of heat exchangers. Amsterdam, The Netherlands: Elsevier; 1995. doi:10.1016/B978-0-444-82186-7.X5000-3. [Google Scholar] [CrossRef]
23. Heat Transfer Research, Inc. HTRI heat exchanger design guidelines. 2015. Available from: https://www.htri.net/design-manual. [Google Scholar]
24. Vannoni A, Sorce A, Traverso A, Fausto Massardo A. Large size heat pumps advanced cost functions introducing the impact of design COP on capital costs. Energy. 2023;284:129204. doi:10.1016/j.energy.2023.129204. [Google Scholar] [CrossRef]
25. Frederiksen S. District heating and cooling. 1st ed. Lund, Sweden: Studentlitteratur; 2013 [cited 2026 Apr 7]. Available from: https://www.lesestoff.ch/de/detail/ISBN-9789144085302/Frederiksen-Svend/District-Heating–Cooling. [Google Scholar]
26. Sofrata H. Carnot and Lorenz cycles for dual absorption system. Wärme-und Stoffübertragung. 1993;28(3):107–16. doi:10.1007/BF01541106. [Google Scholar] [CrossRef]
27. Tipler PA, Mosca G, Kersten P. Tipler Physik. Berlin/Heidelberg, Germany: Springer; 2024. doi:10.1007/978-3-662-67936-4. [Google Scholar] [CrossRef]
28. Dehli M, Doering E, Schedwill H. Grundlagen der Technischen Thermodynamik: Für eine praxisorientierte Lehre. 11th ed. Wiesbaden, Germany: Springer Vieweg; 2025. [cited 2026 Apr 7]. Available from: https://link.springer.com/book/10.1007/978-3-8348-8615-6. (In German). [Google Scholar]
29. Köfinger M, Geyer R, Basciotti D. Task 5.2 Methoden zur Auswahl, Auslegung und Integration von Wärmepumpen. Wien, Austria: AIT Austrian Institute of Technology GmbH; 2017. [cited 2026 Apr 7]. Available from: https://www.ait.ac.at/fileadmin/mc/energy/downloads/News_and_Events/2016-2017/2016_11_15_2.Praxis_und_Wissensforum_FWK/B1_Koefinger_20161115_AIT-Forum_nachhaltige_Waermenetze_MKoefinger.pdf. (In German). [Google Scholar]
30. Zahoransky R. Energietechnik. Wiesbaden, Germany: Springer Fachmedien Wiesbaden; 2022. (In German). doi:10.1007/978-3-658-34831-1. [Google Scholar] [CrossRef]
31. Roth S, Stahl A. Wärmelehre. Berlin/Heidelberg, Germany: Springer; 2023. (In German). doi:10.1007/978-3-662-67213-6. [Google Scholar] [CrossRef]
32. Frey H. Energieautarke Gebäude. Berlin, Heidelberg, Germany: Springer; 2019. (In German) doi:10.1007/978-3-662-57874-2. [Google Scholar] [CrossRef]
33. Huhtinen M, González RM, Pöntynen L. Large heat pumps in district heating systems. Kuopio, Finland: Savonia University of Applied Sciences; 2023 [cited 2026 Apr 7]. Available from: https://urn.fi/URN:NBN:fi-fe2024061955510. [Google Scholar]
34. Gruber-Glatzl W, Brunner C, Meitz S, Schnitzer H. From the wastewater treatment plant to the turnstiles of urban water and district heating networks. Front Sustain Cities. 2020;2:523698. doi:10.3389/frsc.2020.523698. [Google Scholar] [CrossRef]
35. Fraunhofer ISE. Verbundvorhaben: FernWP. 2025 [cited 2026 Apr 7]. Available from: https://www.ise.fraunhofer.de/de/forschungsprojekte/fernwp.html. (In German). [Google Scholar]
36. Pieper H, Ommen T, Buhler F, Paaske BL, Elmegaard B, Markussen WB. Allocation of investment costs for large-scale heat pumps supplying district heating. Energy Procedia. 2018;147:358–67. doi:10.1016/j.egypro.2018.07.104. [Google Scholar] [CrossRef]
37. Peters M, Bartenstein B, Hebisch H, Kaiser C, Anders F. Kommunale Wärmeplanung: einführung in den Technikkatalog. KEA Klimaschutz- und Energieagentur Baden-Württemberg GmbH. 2024 [cited 2026 Apr 7]. Available from: https://um.baden-wuerttemberg.de/fileadmin/redaktion/m-um/intern/Dateien/Dokumente/2_Presse_und_Service/Publikationen/Energie/Kommunale-Waermeplanung-Einfuehrung-in-den-Technikkatalog.pdf. (In German). [Google Scholar]
38. Ortner S, Köhler B, Ott B, Kluge C, Bartsch A, Langreder N, et al. Leitfaden Wärmeplanung. 2024 [cited 2026 Apr 7]. Available from: https://www.bmwsb.bund.de/SharedDocs/downloads/DE/veroeffentlichungen/wohnen/leitfaden-waermeplanung-lang.pdf?__blob=publicationFile&v=2. [Google Scholar]
39. Metz J. Entwicklung und experimentelle Analyse eines Mehrquellen-Wärmepumpensystems aus Erdreich und Außenluft. 2023 [cited 2026 Apr 7]. Available from: https://publica.fraunhofer.de/entities/publication/ef8af94a-3cd4-478a-8881-a01656365515. (In German). [Google Scholar]
40. Mathiesen BV, Blarke MB, Hansen K, Connolly D. The role of large-scale heat pumps for short term integration of renewabel energy. Aalborg, Denmark: Aalborg University; 2011 [cited 2026 Apr 7]. Available from: https://vbn.aau.dk/ws/files/58142269/. [Google Scholar]
41. AGFW. Praxisleitfaden Großwärmepumpen. Frankfurt am Main. 2024 [cited 2026 Apr 7]. Available from: https://www.agfw-shop.de/leitfaeden-umsetzungshilfen/agfw-praxisleitfaden-grosswaermepumpen.html. (In German). [Google Scholar]
42. Popovski E, Aydemir A, Fleiter T, Bellstädt D, Büchele R, Steinbach J. The role and costs of large-scale heat pumps in decarbonising existing district heating networks—a case study for the city of Herten in Germany. Energy. 2019;180:918–33. doi:10.1016/j.energy.2019.05.122. [Google Scholar] [CrossRef]
43. GEA. Mit GEA-Technologie Wärme aus Abwasser gewinnen und Wärmewende der Stadt Lemgo gestalten. 2024 [cited 2026 Apr 7]. Available from: https://www.gea.com/de/news/trade-press/2024/heatfrom-. (In German). [Google Scholar]
44. AGFW. AGFW-Regelwerk: FW 309 Teil 6—Energetische Bewertung von Fernwärme und Fernkälte—Emissionsfaktoren nach Arbeitswert—und Carnotmethode. 2024 [cited 2026 Apr 7]. Available from: https://www.agfw-shop.de/regelwerk/fw-309-teil-6-emissionsfaktoren-nach-arbeitswert-und-carnotmethode.html. (In German). [Google Scholar]
45. Generation of electricity and district heating: technology data. Kopenhagen, Denmark: Energy Agency; 2025 [cited 2026 Apr 7]. Available from: https://ens.dk/en/analyses-and-statistics/technology-data-generation-electricity-and-district-heating. [Google Scholar]
Cite This Article
 Copyright © 2026 The Author(s). Published by Tech Science Press.
This work is licensed under a Creative Commons Attribution 4.0 International License , which permits unrestricted use, distribution, and reproduction in any medium, provided the original work is properly cited.
 Downloads
 Citation Tools
