
 Login
Login Register
 Submit a Paper
 Propose a Special lssue
 Open Access
ARTICLE
Energy and Exergy Analysis with Heat Exchanger Network Optimization of an Indian Dairy Industry
1 Industrial & Production Engineering, SJCE, JSSSTU, Mysuru, Karnataka, India
2 Electrical and Electronics Engineering, SJCE, JSSSTU, Mysuru, Karnataka, India
3 Department of I and M Systems Engineering, West Virginia University, Morgantown, WV, USA
* Corresponding Author: Dayakar G. Devaru. Email:
Energy Engineering 2026, 123(8), 6 https://doi.org/10.32604/ee.2026.080851
Received 16 February 2026; Accepted 06 May 2026; Issue published 12 July 2026
 View Full Text
 Download PDF
Abstract
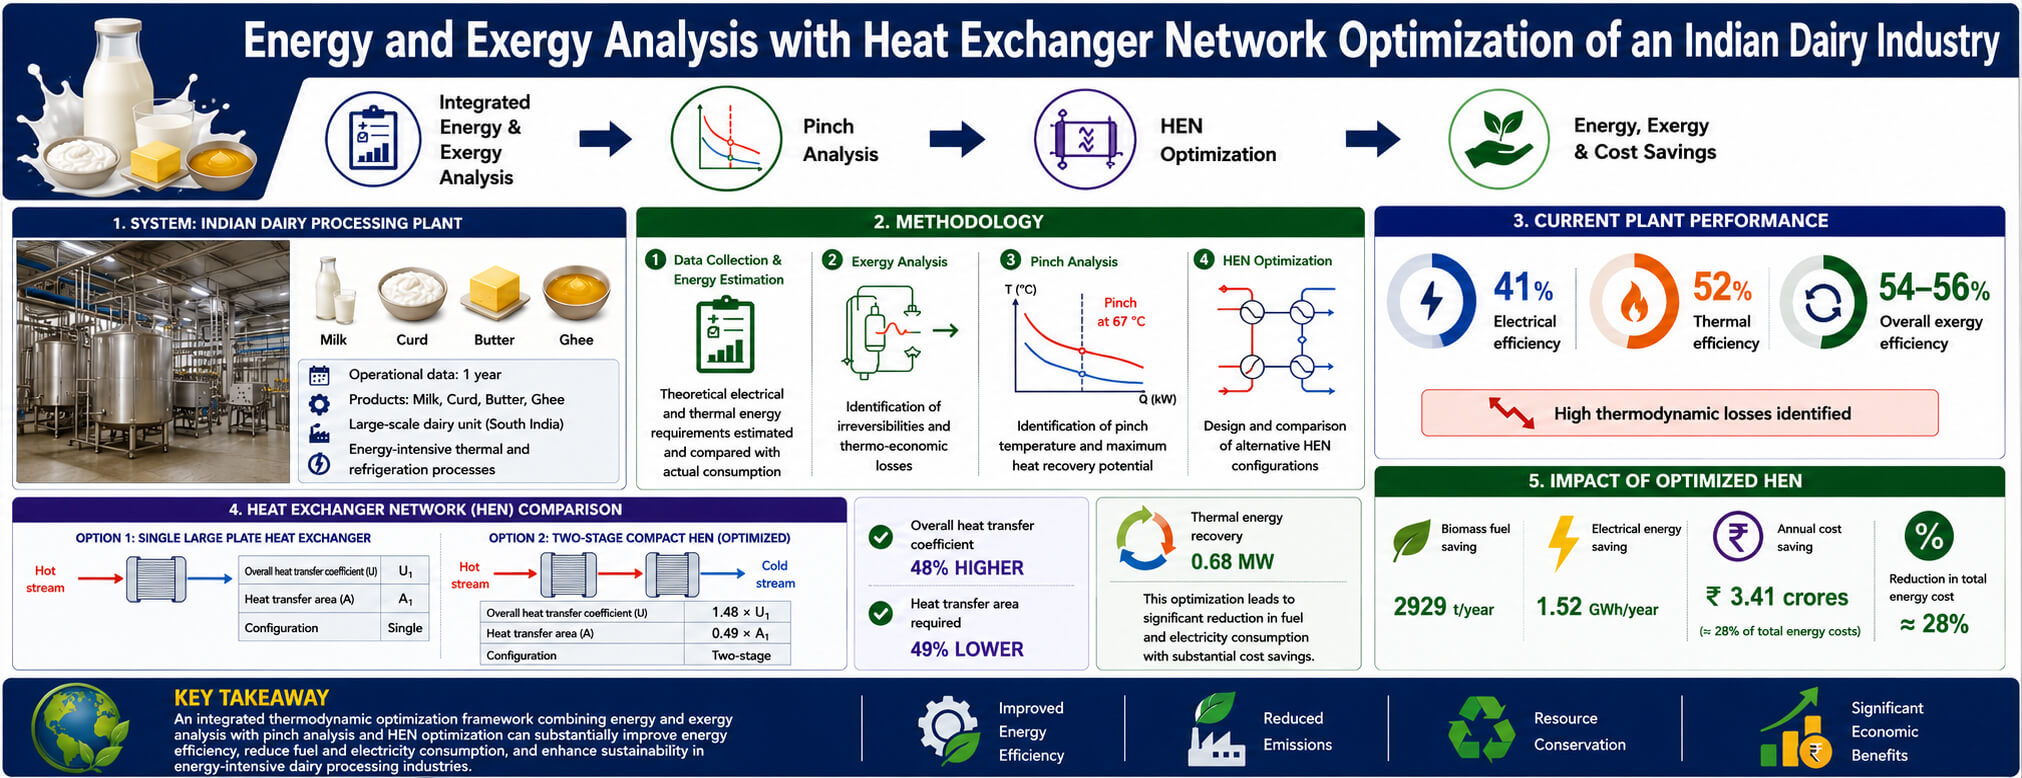
The dairy processing industries are energy-intensive because of the high level of thermal and refrigeration processes. In this study, a large-scale dairy processing unit in South India has been analyzed thermodynamically and optimized by applying integrated energy and exergy analysis along with heat exchanger network (HEN) optimization. The operational data of one year of a plant manufacturing milk, curd, butter and ghee was analysed. Estimation of theoretical electrical and thermal energy requirements was carried out and compared with the actual plant energy consumption. The exergy analysis was used to identify the thermodynamic irreversibilities and the thermo-economic losses, and pinch analysis was used to identify the potential of maximum heat recovery and to design an optimum HEN configuration. The outcomes reveal that the plant has a mean electrical efficiency of around 41%, a thermal efficiency of 52%, and the overall exergy efficiency is 54%–56%, which shows that the plant has high thermodynamic losses. A pinch analysis was performed, and a pinch temperature of 67°C and significant heat recovery opportunities were identified. Two HEN configurations were compared: one large plate heat exchanger and a two-stage compact system. The optimized two-stage design had an overall heat transfer coefficient that is 48% higher than the single-exchanger design and needed 49% of the heat transfer area. The proposed system can recover 0.68 MW of thermal energy, which translates to an annual reduction in biomass fuel consumption of 2929 t and electrical energy consumption of 1.52 GWh, equating to an estimated annual savings cost of ₹ 3.41 crores (or about 28% of the total energy costs). The proposed thermodynamic optimization framework is a viable and cost-effective method to enhance energy efficiency and sustainability in energy-intensive dairy processing industries.Graphic Abstract
Keywords
The dairy processing industry is one of the most energy-intensive industries in the food processing field because of the large amounts of energy needed for heating, cooling, and refrigeration for completing various processes like pasteurization, homogenization, fermentation, evaporation, and refrigeration [1–4]. These processes require large amounts of both thermal and electrical energy and energy efficiency is a major concern for sustainable dairy production. Rising energy costs and worldwide decarbonisation initiatives have contributed to the further need for better energy management strategies in industrial food processing systems.
Traditional energy analysis methods have been used extensively to identify energy use in dairy plants. However, energy analysis alone is not powerful enough to determine thermodynamic inefficiencies [1,2] since it does not account for the quality of energy or for irreversibilities in the system [5,6]. Exergy analysis, based on the second law of thermodynamics, is a more complete analysis [6] as it helps to identify places where useful energy is destroyed due to inefficiencies in the process. Previous studies have revealed that some of the main sources of exergy destruction [7–11] in dairy plants are boilers, refrigeration systems, pasteurization systems and evaporation systems [1,2,7].
Several researchers have studied energy and exergy performance of dairy processing systems. Friso et al. (2020) [1] analysed exergy losses in milk pasteurization processes and pointed out the importance of heat recovery in order to improve system efficiency. Buhler et al. (2018) [2] performed advanced exergy analysis of a milk processing factory and presented enormous thermodynamic losses in thermal processes. Singh et al. (2021) [3] and Juneja et al. (2023) [4] studied the influence of process integration on energy and exergy performance of spray drying units in dairy industries.
Quijera and Labidi (2013) [12] used pinch and exergy analysis to incorporate thermo solar energy in a dairy processing plant and proved that a substantial decrease in the use of fossil fuel is possible by means of enhanced thermal recovery. Similarly, Kaviani et al. (2022) [13] put forward an energy optimization method in dairy processing industries by combining techniques of heat integration and stated significant changes in the energy efficiency of the process.
The recent studies have also investigated the opportunities of energy integration in the production plants of milk powder. Bergamini et al. (2021) [14] examined the energy efficiency of dairy processing plants and observed that heat exchanger network configurations can be optimized to significantly cut the energy usage and operational expenses.
Moreover, Walmsley et al. (2024) [15] have highlighted how exergy analysis contributes to enhancing the electrification strategy and heat integration strategy of industrial processes. Their analysis showed that exergy analysis in conjunction with complex design of the heat exchanger networks can substantially enhance the thermodynamic performance of industrial processing systems.
Although these developments have been made, few studies have emphasized on the joint use of energy analysis, exergy analysis, and heat exchanger network optimization when used together in processing dairy products, especially in the Indian dairy industry that is fast-growing. The thermodynamic analysis of these techniques and the optimization of heat exchanger networks have not been properly integrated in previous studies and are typically analyzed separately.
Thus, the current work will aim at filling this gap in the research through thermodynamic analysis of a dairy processing system to include a thorough energy analysis, exergy analysis, and optimization of the heat exchanger network. The suggested method offers more insights into the thermodynamic inefficiencies and presents practical measures towards the realization of the energy efficiency of dairy processing plants.
In addition to the thermodynamic evaluation, the process integration methods such as pinch analysis and heat exchanger network (HEN) design have been successfully used in chemical and petrochemical industries to improve energy efficiency. Pinch analysis is used to determine thermodynamic limits for heat recovery and guidelines are given for the design of heat exchanger networks with minimum external heating/cooling requirements. Although these techniques have been widely used in chemical process industries, the combination with energy-exergy analysis in dairy processing systems is yet to be explored, especially with actual industrial operational data.
Most of the existing research work is theoretical analysis, simulation models or individual processing units, and comprehensive plant-level analysis based on integration of theoretical benchmarking, product-wise exergy evaluation and practical design of heat exchanger network is still missing. Moreover, there is little research on the optimization of energy in the dairy industries in India, where biomass-based thermal systems and multi-product processing are commonly used.
Therefore, this study attempts to address these gaps by conducting a detailed thermodynamic analysis of a large scale Indian dairy processing plant with actual operational data. The results give practical information on how to be more energy efficient in dairy industries and further developing sustainable food processing systems.
Majority of the past literature dealt with individual units of the processes or only dealt with the energy performance of the processes but did not consider the thermodynamic and process integration as a whole.
A detailed thermodynamic examination of a dairy processing system is conducted in this research by combining the energy and exergy analysis and optimization of the heat exchanger network. The suggested methodology offers a logical analysis of the thermal wastage and offers possible sources of recovery of energy in the system. Moreover, pinch analysis is used to optimize the design of the network of heat exchangers and to increase the use of energy in the process. The central originality of this work is the combination of the evaluation of energy use, exergy destruction, and possibility of process heat recovery in dairy processing processes, which offers a feasible framework of increasing energy efficiency and sustainability in the dairy industry.
System Description
In order to give a better view of the process being studied, this section expounds on the general system as illustrated in Fig. 1. The facility under study is a massive dairy processing plant in South India and deals with several products, such as milk, curd, butter, and ghee. The raw milk is received and then chilled to maintain the quality of the milk before it goes through additional processing. The milk is thereafter taken through the process of pasteurization, homogenization, and storage processes based on the product stream. In the production of curd, pasteurized milk is heated and fermented in controlled process and then cooled and packaged. During the butter and ghee manufacturing process, the separation of cream precedes the churning (butter) and high temperatures clarification (ghee), which requires a lot of thermal energy. The facility also contains auxiliary systems like boilers, refrigeration systems, pumps and cleaning-in-place (CIP) systems, which all consume significant amounts of energy. Fig. 1 below is the process flow diagram that shows interrelationship between these stages as well as the level of temperature and distribution of mass flow between different product lines. Most utilities are shared among processes; therefore, energy consumption is spread between varieties of products and hence it is not easy to directly measure. This requires theoretical energy allocation techniques to be used at the level of product.

Figure 1: Process flow diagram of the diary plant.
It outlines methods for assessing energy and exergy efficiency in dairy processing tasks like milk pasteurization, curd formation, butter churning, and ghee purification. The assessment included calculating theoretical and actual energy use to determine efficiency and energy losses, using thermodynamic equations for theoretical needs and operational data for actual usage. Exergy analysis evaluated energy potential and system irreversibilities. The methodology also incorporated optimization and pinch-based integration to improve heat recovery and energy efficiency, providing a structured approach for comparing theoretical outcomes with actual conditions for sustainable dairy production enhancement.
The main data set will include a year of records of operations of the dairy processing plant, which will be collected in August 2022 to July 2023. The plant manufactures four large product lines, namely milk, curd, butter, and ghee that have varying thermal and electrical processing specifications. Because the energy consumption of the product-specific items, i.e., boilers, compressors, pumps, and refrigeration systems, is shared among various production lines, it was not possible to directly measure the energy consumption of each product. Thus, the real plant energy use was assigned to the individual products on the basis of the calculated theoretical energy consumption of the products such that there was a uniform and representative allocation of the energy use between the various processing streams.
2.2 Theoretical Energy Consumption Modeling
Theoretical mass and energy balance relations were used [16–18] to determine the electrical and thermal energy requirement of each product in order to establish a thermodynamic standard of comparing the plant performance. The overall theoretical power requirement was written as:
Electricity Energy Consumption. The major use of electricity energy involves the chilling of milk, homogenization, pumping, packaging and other auxiliary processes. The chilling load was calculated as the amount of heat that was taken out of the stream of products through the following relation [16]:
where m = the mass flow rate of the product, Cp = specific capacity of heat and ΔT = the difference in temperature. This was calculated based on an estimated coefficient of performance (COP) of 5 of refrigeration system which was used in the estimation of the electrical energy that the refrigeration required to cool down.
Thermal Energy Consumption: Heating processes such as pasteurization, fermentation preparation, and evaporating processes were determined to be the activity that needed thermal energy. Pasteurization of milk was done under the temperature of 72°C and the curd production had to be heated up to 85°C. More aggressive temperature operations were also taken into account, in particular ghee clarification at around 120°C as one of the most energy-consuming dairy processing operations.
Exergy analysis was carried out to determine the quality of energy used and to determine thermodynamic irreversibilities of the processing system. Exergy analysis, as compared with conventional energy analysis, takes into account not only the amount of energy but also the possible useful work of energy flows into and out of the system with the environment. The total energy input and output of a particular physical exercise was calculated with the help of the following thermodynamic equations [16]:
This Eq. (2) expresses the exergy associated with the heat transfer operation. According to this expression, maximum work done is proportional to the heat transferred and inversely proportional to the heat sink/source temperatures.
This Eq. (3) represents the specific physical exergy associated with a flowing fluid medium. It takes into account the specific internal energy and entropy effects [16,17]. Exergy states the maximum possible work that can be done by a system when reaching the equilibrium with the surroundings. Exergy takes into consideration entropy production in contrast to energy [2].
Where, Ts is the source temperature and T0 is the ambient reference temperature which is defined as 277 K. Based on these relations, the exergy efficiency (ηex) of every stage of the process was calculated, allowing to determine the occurrence of significant energy losses at various thermal gradients, e.g., in the high-temperature clarification process during ghee production, in contrast to the tempering energy demanded in the process of milk pasteurization.
2.4 Pinch Analysis and Process Integration
The thermodynamic limits of the internal heat recovery were determined by the use of pinch analysis in the dairy processing system. Composite curves were created using process stream data such as supply and target temperatures and flow rates of heat capacity to determine the opportunities of heat recovery. The analysis of the simulation, with an approach temperature (ΔTmin) of at least 10°C, located a pinch temperature of about 67°C. This temperature is the critical temperature when the difference between the temperature of hot and cold streams is minimal. External heating facilities are needed above the pinch point and external cooling is needed below the pinch point. Results can be used in the recovery of thermal energy in the hot pasteurized streams so as to preheat the incoming cold milk streams hence minimizing the outside utility requirement.
2.5 Heat Exchanger Network (HEN) Optimization
Two possible alternative heat exchanger network (HEN) designs were developed [19,20] based on the heat recovery potential identified as a result of pinch analysis to enhance heat integration in the pasteurization process.
Alternative 1: One large plate heat exchanger that has the total area of heat transfer of 12.71 m2.
Alternative 2: Two-stage compact heat exchanger network, which comprises small units aimed at improving the performance of turbulence and heat transfer with the enhancement factor of about 2.85 to 2.95. The execution of the two setups was compared with log mean temperature difference (LMTD) analysis and the subsequent decrease in the area of needed heat transfer. Economic parameters like capital investment, implementation costs, payback period, in addition to thermodynamic performance, were also evaluated in order to ascertain the viability of the proposed configurations of heat recovery.
3.1 Theoretical Energy Consumption Formula for Milk Production in Indian Dairy Industry
Energy consumption in the dairy industry in India is influenced by several stages, including milk collection, chilling, pasteurization, homogenization, storage, packaging, and cleaning. A theoretical formula is provided to estimate energy consumption for processing l kg of milk, adaptable according to production capacity as shown in Eqs. (4)–(6).
Overall Theoretical Energy Consumption Formula
3.1.1 Theoretical Electrical Energy Consumption Formula for Milk Processing
For ‘m = 1 kg’ of milk processed:
This formula uses the law of thermodynamics which states that the heat transferred depends on mass flow rate, heat capacity and temperature difference between inlet and outlet flows of the system [1,4].
Step 1: Chilling (27°C → 4°C) [16]
This equation is based on the steady-flow energy balance based on the first law of thermodynamics. Herein, this equation represents the thermal energy removed during chilling operation. The heat removed is a function of the mass flow rate, specific heat capacity, and temperature difference [16,18].
Typical Coefficient of performance is assumed to be 5.
Results of theoretical electrical energy consumption for milk production are shown in Table 1.

From Table 1, it is observed that the energy consumption for electricity is not only related to the main processes but also includes auxiliary processes such as pumping and packaging. This means that there is a considerable amount of energy involved in the auxiliary processes, thus offering possibilities for optimization.
Theoretical electrical energy consumption for milk production is 0.01402 kWh per 1 kg of milk.
3.1.2 Theoretical Electrical Energy Consumption Formula for Curd Production
Let m be the mass of milk (e.g., 1 kg), and Cp ≈ 3.93 kJ/kg K
Total Energy is calculated by using the Eq. (7)
Results of theoretical electrical energy consumption for curd production are shown in Table 2.

It can be seen from the above table that the consumption of electrical energy in curd production is higher than in milk processing because of extra processes involved in curd processing such as heating and incubation.
3.1.3 Theoretical Electrical Energy Consumption Formula for Butter and Ghee Production
Let m be the mass of input milk (in kg) and mc be the cream extracted (~8%–10% of milk).
a) Butter & Ghee Production Formula
Total Energy for Butter/Ghee production is calculated by using the Eq. (8):
The energy consumption for each operation will be calculated separately and added to yield the total energy requirement. In this way, all the mechanical and thermal loads are considered.
Results of theoretical electrical energy consumption for butter/ghee production are shown in Table 3.

3.2 Theoretical Thermal Energy Consumption Formula for Milk Production
Energy inputs include:
• Thermal energy: steam or hot water from boilers
3.2.1 Theoretical Thermal Energy Consumption Formula for Milk Processing
For ‘m = 1 kg’ of milk processed, total theoretical thermal energy of milk is calculated by using Eq. (9):
Dairy industry specific values of significant parameters are shown in Table 4.

Results of theoretical thermal energy consumption for milk production are shown in Table 5.

To estimate the theoretical thermal energy consumption for curd production in Indian Dairy Industry, the milk processing energy model must be expanded to incorporate fermentation and incubation steps, typically following a semi-automated batch process for curd, dahi, or yogurt-style products.
3.2.2 Theoretical Thermal Energy Consumption Formula for Curd Production
Let m be the mass of milk (e.g., 1 kg), and Cp ≈ 3.93 kJ/kg-K
Calculations of theoretical thermal energy consumption for curd production drawn by using Eq. (10) and are shown in Table 6.

3.2.3 Theoretical Thermal Energy Consumption Formula for Butter and Ghee Production
Theoretical Thermal Energy Formula
Let m be the mass of input milk (in kg), and mc the cream extracted (~8%–10% of milk).
1. Butter Production Formula
The above formulas state sensible heat, in which heat energy depends on temperature change and thermophysical properties of milk. There are other formulas to take into account the heat transfer during phase changes of products like ghee [9,10].
Calculations of theoretical thermal energy consumption for butter production drawn by using Eq. (11) and are shown in Table 7.

2. Ghee Production Formula
– Eclarify: Heating butter (10°C → 120°C) = (mb * Cp * 110)
– Eevaporate: Moisture evaporation (~16%) = (mb * 0.16 * Lv) [19], Lv ≈ 2260 kJ/kg
Calculations of theoretical thermal energy consumption for ghee production drawn by using Eq. (12) and are shown in Table 8.

These relations have been obtained using the principles of thermodynamics. Here, the heat absorbed/transmitted is proportional to mass, specific heat, and temperature difference. Additionally, there are extra terms to account for the latent heats involved in ghee formation.
If 1 kg milk yields 0.045 kg butter and it is heated from 10°C → 110°C:
Total Ghee Energy is given by:
Eghee = 1177 kJ/kg
Total Energy:
– Butter: 585 kJ per kg of milk
– Ghee: 1177 per kg of milk
As per the information obtained from the plant, in the mix of Butter and Ghee sales, around 30% is butter and 70% is Ghee. Hence the total thermal energy consumption for ghee and butter together averages to 585 ∗ 0.3 + 1177 ∗ 0.7 = 1000 kJ/kg.
Allocation of actual energy for production of different products based on theoretical energy requirement
Since the equipment like boiler, compressor, pumps, motors, Chillers etc were used to manufacture all the products milk, curd, butter and ghee. So, it was not possible to collect the actual energy consumption data for each individual product. Hence the total consumption was allocated to individual products based on the share of the theoretical energy consumption (Table 9) of each product with the total energy consumption.

Electrical Energy Consumption, milk, curd, butter and ghee production data of a south Indian diary plant from August 2022 to July 2023 is shown in Table 10.

The deviation from theoretical to practical consumption values implies inefficient processes like heat losses, limits to process capacity, as well as changes in process operation.
Ratios for allocating actual electrical energy consumption for different products is calculated as:
Ratio for allocating actual energy consumption for milk = Theoretical Energy Consumption for milk × Total Milk Sales/(Total Theoretical Energy Consumption for milk × Total milk Sales + Total Theoretical Energy Consumption for curd × Total curd Sales + Total Theoretical Energy Consumption for butter & Ghee × Total butter & Ghee sales).
Energy Consumption is calculated as:
Actual Electrical Energy Consumption for milk = Ratio for allocating actual energy consumption for milk * Total energy consumption
Similarly, both electrical and thermal actual energy consumption for other products were allocated. Thermal Energy Consumption data for the production of milk, curd, butter and ghee of a south Indian diary plant from August 2022 to July 2023 is shown in Table 11.

Exergy analysis can be obtained by using the Eqs. (13) and (14).
Step 1. General Equation for Specific Physical Exergy [21]
where, Exin: The exergy input
Q: Quantity of Heat transferred = Cp(TS − T0), Cp = Specific Heat at constant pressure
where, Exout: The exergy output, T0 = 277 K, P0 = 101.325 kPa, atmospheric pressure, P = System Pressure, v = Specific volume, for processing, P ≈ P0, so the pressure term ≈ 0 [21].
Only temperature rise contributes significantly.
Step 2. Properties [10–12] and Process Temperatures has been listed in Table 12 and the summary of the exergy analysis is shown in Table 13.


Summary of actual, theoretical energy consumption and exergy analysis for the production of milk, curd, butter and ghee are shown in Table 14.

The exergy efficiencies range between 54% and 56%, meaning that the irreversibility losses amount to nearly half of the consumed energy. Heat transfer irreversibilities are the main factor contributing to these losses [1–5,11].
The graphs [Fig. 2a–d] indicate that the actual energy usage (electrical and thermal) is always more than the theoretical ones in all the dairy products, meaning that there is inefficiency in the process due to heat losses, equipment inefficiency, and non-optimal process conditions. The energy needed to process milk and curd is less than that needed to process butter and ghee since the processing of milk and curd includes mild heating and fermentation, and processing butter and especially ghee includes intensive heating and evaporation resulting in increased thermal energy consumption. The exergy analysis shows that ghee is the best in exergy with large quantity of useful energy (high fat content) and the high level of heating process. Nevertheless, despite increased exergy, the total exergy efficiency is moderate (54%–56%), which demonstrates that a great part of input energy is wasted as waste heat. Calculated Electrical and Thermal Efficiency of processes used for producing the products are shown in Table 15.

Figure 2: (a) Actual vs. theoretical electrical energy consumption; (b) actual vs. theoretical thermal energy consumption; (c) comparison of exergy diary products; (d) comparison of exergy efficiency across diary products; (e) energy efficiency comparison of dairy products.

To calculate energy efficiency for each product, the formula used as shown in Eq. (15):
According to the findings observed in Table 15 and Fig. 2e, Electrical and thermal efficiencies in the processing of milk, curd, and butter & ghee are similar, with electrical efficiencies at about 41% and thermal efficiencies around 52%. Notably, butter and ghee show the highest thermal efficiency at 51.78%. Overall, energy efficiency is moderate, indicating potential for improvement through enhanced energy recovery and reduced losses.
Optimization of thermal and mechanical processes in dairy processing focuses on thermodynamic analysis, process integration, and control system refinement, primarily targeting the energy-intensive pasteurization and heating processes in dairy plants.
Plant data used to perform pinch analysis is given in Table 16:

Heat Capacity Flow Rate (C)
Hot and Cold Stream Adjusted Temperatures
To apply ΔTmin = 10°C, we shift the temperature scales:

To Determine the pinch temperature a simulation tool [22] is used and the pinch diagram obtained from the tool is shown in Fig. 3a.

Figure 3: (a) Pinch diagram obtained from simulation tool [22]; (b) single large plate HEN; (c) small plate heat exchanger network (alternative 2–case a & b); (d) plate type HEN for recovering heat (curd) alternative 1 and 2 (case a & b).
• The pinch point occurs when the adjusted hot and cold curves just touch (no overlap), the pinch temperature (real) = 67°C.
Pinch analysis suggests reducing the hot stream temperature to 14°C, but lowering the hot milk stream from 72°C to below 20°C is impractical due to minimal temperature difference between hot stream out and cold stream in temperatures. Therefore, it is proposed to lower the hot milk temperature to 20°C instead of 14°C.
3.4.2 Design of Single Large Plate Heat Exchanger Network (Alternative 1)
Presently, the plant does not recover any heat from the hot milk, prompting two alternative methods to recover heat using a plate type heat exchanger. Data used to design the plate heat exchanger is given in Table 17.

For the heat exchanger design, the standard heat transfer equations were applied involving energy balance, non-dimensional analysis based on Reynolds, Prandtl, and Nusselt numbers and empirical heat transfer coefficients [18,23]. Overall heat transfer coefficient was defined based on the consideration of convection, conduction, and fouling resistances.
The results of the large heat exchanger design is shown in Table 18 and Fig. 3b.

Single heat exchanger system requires more heat transfer area, which points towards lower efficiency as compared to multi-stage heat exchangers, owing to poor temperature matching.
3.4.3 Design of Two Small Plate Heat Exchanger Network (Alternative 2)
Case a: Data used to design first small plate heat exchanger is given in Table 19 and the results are shown in Table 20 and Fig. 3c.


Case b: Data used to design second small plate heat exchanger and the results are shown in Table 21 and Fig. 2c.

The comparison of two heat exchanger network (HEN) alternatives highlights their performance in heat recovery and efficiency. Alternative 1 features a single large HEN with a heat load of 0.68 MW, a heat transfer coefficient (U) of 3356 W/m2 °C, and a surface area of 12.71 m2, resulting in a moderate enhancement factor (E = 1.95). In contrast, Alternative 2 comprises two smaller HENs, each handling approximately 0.34 MW. The smaller units have higher U values (Case a: U = 5077 W/m2 °C, A = 4.19 m2; Case b: U = 4905 W/m2 °C, A = 4.34 m2) due to increased turbulence from high enhancement factor [19] (sharper chevron angles) (E ≈ 2.85, 2.95). This arrangement allows for improved heat transfer efficiency and a reduction in required surface area, resulting in less compact but more thermally efficient and maintainable units, achieving similar total heat recovery as the larger system.
3.4.4 Design of HEN for Recovering Heat from Pasteurized Milk Used for Making Curd-Alternative 1 & 2
The results of Design of Heat exchanger Network for recovering heat from pasteurized milk used for making Curd are given in Table 22 and Fig. 3d.

In the design of a Heat Exchanger Network (HEN) for recovering heat from pasteurized milk in curd manufacturing, Alternative 2 (two small HENs) is preferred over Alternative 1 (one large HEN) due to its superior performance. Alternative 1, with a heat load of 192 kW, an overall heat transfer coefficient (U) of 2668 W/m2 °C, and an area of 4.23 m2, has a lower enhancement factor (E = 1.55). In contrast, Alternative 2 offers improved flow dynamics and turbulence [19,20] with Case a showing a heat load of 96 kW, U of 3356 W/m2 °C, area of 1.68 m2, and E of 1.95, while Case b has slightly less favorable metrics (U = 3184 W/m2 °C, area = 1.77 m2, E = 1.85). Thus, Alternative 2 is more efficient, featuring better turbulence and thermal efficiency with reduced size and surface area compared to Alternative 1.
Thermal Energy Savings from HEN:
Thermal energy consumption data of the plant which is required to calculate thermal energy savings from plate heat exchanger network is shown in Table 23.

Step 1: Heat Duties from Calculations
Heat Duty (kW) for Proposed System Q = 3.34 × 3.93 × (72 − 20) = 682.56
Energy Saved = 682.56 kJ/s
Efuel = Q/boiler efficiency
Assume boiler efficiency = 90% → 0.9
Efuel,old = 682.56/0.9 = 758.4 kJ/s
Step 2: Equivalent Firewood Saved
Taking CV of Fire wood = 10,460 kJ/kg
Per second fuel saved: mfuel,saved = 758.4/10,460 = 0.0725 kg/s
Per hour: 0.0725 × 3600 = 261 kg/h
For 24 h/day, 365 days/year: 261 × 24 × 365 = 2,286,360 kg/year ≈ 2286 t/year
Step 3: Annual Fuel Cost Saving
Cost of fuel: ₹7/kg
Cost saved = 2,286,360 × ₹7 = ₹16,004,520 = ₹1.60 Crore/year
Data of Electrical Energy Consumption for the production of milk, curd, butter and ghee in a south Indian diary plant from September 2022 to August 2023 which is required to calculate electrical energy savings from plate heat exchanger network is shown in Table 24.

Amount paid/kWh = (Total kWh Charges + Total Fuel Adjustment Charges)/Total kWh Consumption ∗ Tax % = (49,656,806 + 5,436,048)/6,622,494 ∗ 1.07% = ₹ 8.90
Step 1: Reduction in Cooling Duty
Given:
• Mass flow rate (
• Specific heat (Cp) = 3.93 kJ/kg·K
• ΔT = 12°C
Qextra =
Step 2: Equivalent Electrical Power Saved (COP = 5)
Electrical saving = Qextra/COP = 682/5 = 136.4 kJ/s ≈ 136 kJ/s
Step 3: Annual Electrical Energy Saving
Assume operation = 24 h/day × 365 days = 8760 h/year
Energy Saved = 136 * 8760 = 1,191,360 kWh/year
Step 4: Annual Cost Saving
Electricity cost = ₹8.90 per kWh
Cost Saved = 1,191,360 × ₹ 8.90 = ₹10,603,104 ≈ ₹1.06 crore/year
Calculation of Implementation Cost:
Data required to calculate Heat exchanger implementation cost is summarized in Table 25.
Step 1:

Step 2: Implementation Cost Estimation
For stainless steel plate HENs (SS 304) used in dairies, cost typically scales as [16]:
where
• Cref ≈ ₹300,000 for 10 m2 (industry average) [16]
• Aref = 10 m2 [16]
• Exponent 0.8 reflects economy of scale.
The cost correlations and scaling laws employed in this study are derived from conventional chemical engineering design methodologies [17].
(a) Large HEN (A = 12.71 m2)
CL = 300,000 (12.71/10)0.8 = ₹363,444
(b) Two Small HENs (A1 = 4.19 m2, A2 = 4.34 m2)
CS1 = 300,000 (4.19/10)0.8 = ₹149,587
CS2 = 300,000 (4.34/10)0.8 = ₹153,855
CTotal,Small = 149,587 + 153,855 = ₹303,442
Annual Energy and Cost Savings and Final Results Summary with implementation cost and payback are shown in Tables 26 and 27, respectively.
Step 3:

Step 4:

The obtained economic results have revealed extremely low payback periods, hence confirming the feasibility and applicability of the system design to the industry.
The total energy costs for this plant is Rs. 12.17 Crores (56,576,160 + 65,197,619) and the recommendation of installing heat exchanger for heat recovery has a total cost savings of Rs. 3.41 crore which is around 28% of the total energy costs.
Increase in thermal and electrical efficiency of milk pasteurization process after heat recovery is shown in Table 28.

Heat energy recovered per kg of milk = 1 × 3.93 × (72 − 20) = 204.36 kJ/kg
Cooling load reduction per kg of milk = 1 × 3.93 × (72 − 20) = 204.36 kJ/kg
Electrical energy saved = 204.36/(5 × 3600) = 0.0114 kWh/kg
3.5 Simulation of Heat Exchanger Design
These heat exchanger data points shown in Table 29 were generated from heat exchanger design software [24] and were plotted to see the effect of factors like LMTD, (ΔT) on heat transfer area required and overall heat transfer coefficient and the inference from these graphs are discussed below.

Fig. 4a depicts the relationship between the overall heat transfer coefficient and heat transfer area, revealing that a smaller area results in a lower coefficient initially. Later an increased area leads to a higher coefficient, which later falls due to pressure drop, reduced turbulence, and larger temperature differences causing a lower logarithmic mean temperature difference (LMTD). Fig. 4b shows that a higher LMTD reduces the required heat transfer area. Fig. 4c indicates that as the temperature difference (ΔT) between hot stream entry and exit rises, the required area increases exponentially beyond ΔT of 40°C. Fig. 4d connects a higher LMTD with an improved heat transfer coefficient, though reduced heat transfer area at higher values decreases the overall coefficient. This data indicates that diminishing thermal gradients result in an exponential increase in required heat exchanger area, underscoring considerations for cost-effective design in counter flow heat exchangers.

Figure 4: (a) Plate heat exchanger area vs. heat transfer coefficient; (b) LMTD vs. heat exchanger area; (c) temperature difference vs. heat transfer area; (d) LMTD vs. heat exchanger area.
Thermal energy is dominating among different types of energy consumption in the case of ghee production, whereas the milk processing uses considerably smaller amounts. The inefficiency in milk production is mainly related to auxiliaries and is characterized by a considerable heat losses.
4.1 Energy Performance Evaluation and Compare with the Past Research
The one-year data on the operations in the dairy plant provide an analysis that indicates that the average electrical efficiency of the plant is 41% compared to theoretical power [1,5]. On the same note, it was established that the thermal energy efficiency was around 52% [1,5]. Nevertheless, the moderately reduced efficiencies of the current study could be explained by biomass-fired boilers [5,7], absence of systematic heat recovery, and constant multi-product functioning characteristic of the large Indian dairy plants. In contrast to the majority of the previous studies where the aggregate energy level of plants are reported [1–4], the current one offers product-level theoretical and real energy benchmarking, which helps to identify inefficiencies in individual processes more precisely. It is a huge step forward in terms of Indian studies, which do not tend to break energy consumption down by the type of product.
4.2 Exergy Analysis and Benchmarking
The obtained exergy efficiencies are 54%–56%, which is very close to the exergy efficiencies achieved in recent dairy exergy investigations [2,7]. The exergy efficiency of ghee processing was the greatest (56%) with high operating temperatures and energy density as it is consistent with the obtained results [4]. However, the outcomes show that almost half of the energy supplied is lost to irreversibilities [2,7] and is primarily caused by heating and cooling processes. The literature available concentrates on individual unit processes like pasteurization or spray drying or uses simulated data. However, unlike other research, the proposed study introduces the product-wise exergy analysis as based on real industrial data, which enhances the validity and usability of the results in the context of Indian dairy industry.
4.3 Pinch Analysis and Pinch Heat Recovery Potential
Pinch analysis found a pinch temperature of 67°C and minimum approach temperature (ΔTmin) of 10°C, and is comparable to the temperature found in food-processing industries [14,25]. Although earlier dairy research recognizes the potential of heat recovery, few studies bring pinch targets into concrete, realistically achievable network designs of heat exchanger. The suggested reclaims of 0.68 MW of thermal energy in pasteurized milk in this research is greater than the recovery rates of similar dairy regeneration investigations [1].
4.4 Performance of the Proposed Heat Exchanger Network
The network of the plate heat exchanger in two stages has shown to have a 48% greater overall heat transfer coefficient [14,15] and a 49% reduction in heat transfer area than a large single heat exchanger and these results have been confirmed by simulation. Experimental research on plate heat exchanger has demonstrated in the past that increased turbulence [18–20] in plate heat exchangers leads to improved heat transfer rates, although these experiments had not considered energy savings at a plant level or economic viability [15,18].
The savings made by the proposed system are 2929 t of biomass fuel [5,6] and 1.52 GWh of electrical energy per year, which results in an approximate savings of 3.41 crore rupees (around 28 percent of the total energy cost). These savings are better than what other optimization-based dairy studies have reported [5,6] and the payback period is very short under 10 days, by far better than the payback of capital-intensive devices like heat pumps.
In the case of energy input, one may note that exergy efficiency is considerably low [2,7], and is caused by high irreversibility losses. Irreversibility losses are the consequence of inefficient heat exchange in thermal processes. One can state that single heat exchanger consumes much more energy compared to multi-stage heat exchangers [17,18,20] owing to temperature differences.
This study evaluated the thermodynamic performance of a large-scale Indian dairy processing plant using integrated energy and exergy analysis combined with pinch-based heat recovery optimization. The major findings of the study are summarized as follows:
• The dairy plant operates with an average electrical efficiency of approximately 41% and thermal efficiency of about 52%, indicating considerable energy losses.
• Exergy analysis revealed overall system efficiencies between 54% and 56%, suggesting that nearly half of the supplied energy is destroyed due to thermodynamic irreversibilities.
• Pinch analysis identified a pinch temperature of 67°C and a minimum temperature difference of 10°C, highlighting significant potential for heat recovery in pasteurization processes.
• The proposed heat exchanger network can recover 0.812 MW of thermal energy, significantly reducing boiler fuel consumption.
• Implementation of the optimized two-stage heat exchanger network could save 2929 t of biomass fuel and 1.52 GWh of electricity annually.
• The total annual cost saving is estimated to be ₹3.41 crore, representing approximately 28% reduction in total energy costs.
• The proposed system increases thermal efficiency of milk pasteurization from 52% to 85% and electrical efficiency of cooling from 41% to 62%.
Overall, the study demonstrates that integrating thermodynamic analysis with heat exchanger network design provides a practical approach for improving energy efficiency in dairy processing industries. Future research can extend this approach to multi-plant studies and incorporate advanced optimization methods and renewable energy integration.
Acknowledgement: The authors would like to thank the management and technical staff of the dairy processing plant for providing operational data used in this study.
Funding Statement: The authors received no specific funding for this study.
Author Contributions: Conceptualization: Kiran A. S., Dayakar G. Devaru. Methodology: Kiran A. S. Data Analysis: Kiran A. S., Mohan N. Supervision: Dayakar G. Devaru, Bhaskaran Gopalakrishnan. Writing—Original Draft: Kiran A. S. Writing—Review & Editing: Kiran A. S., Dayakar G. Devaru, Mohan N., Bhaskaran Gopalakrishnan. All authors reviewed and approved the final version of the manuscript.
Availability of Data and Materials: The datasets used and analyzed during the current study are available from the corresponding author upon reasonable request.
Ethics Approval: Not applicable.
Conflicts of Interest: The authors declare no conflicts of interest.
Nomenclature
| Symbol | Description | Unit |
| Cp | Specific heat capacity | kJ/kg·K |
| Q | Heat transfer rate | kW |
| Mass flow rate | kg/s | |
| U | Overall heat transfer coefficient | W/m2 K |
| A | Heat transfer area | m2 |
| ΔT | Temperature difference | °C |
| LMTD | Log mean temperature difference | °C |
| COP | Coefficient of performance | – |
| Ex | Exergy | kJ/kg |
| ηex | Exergy efficiency | % |
| ηth | Thermal efficiency | % |
| T0 | Ambient temperature | K |
| Ts | Source temperature | K |
References
1. Friso D, Bortolini L, Tono F. Exergetic analysis and exergy loss reduction in the milk pasteurization for Italian cheese production. Energies. 2020;13(3):750. doi:10.3390/en13030750. [Google Scholar] [CrossRef]
2. Buhler F, Nguyen TV, Jensen JK, Holm FM, Elmegaard B. Energy, exergy and advanced exergy analysis of a milk processing factory. Energy. 2018;162(12):576–92. doi:10.1016/j.energy.2018.08.029. [Google Scholar] [CrossRef]
3. Singh G, Tyagi VV, Chopra K, Pandey AK, Sharma RK, Sari A. Energetic and exergetic assessment of two- and three-stage spray drying units for milk processing industry. J Braz Soc Mech Sci Eng. 2021;43(7):359. doi:10.1007/s40430-021-03015-3. [Google Scholar] [CrossRef]
4. Juneja AK, Barnwal P, Sharma AK, Naskar B, Ammu VK. Energy, exergy and exergoeconomic analyses of single stage spray drying plant in the northern region of India for skim milk powder production. J Therm Anal Calorim. 2023;148(20):11081–91. doi:10.1007/s10973-023-12402-y. [Google Scholar] [CrossRef]
5. Gorai B, Sahoo S, Gautam. Comparative exergy analysis and environmental impact of a dairy plant integrated with a transcritical heat pump system: a feasibility of throttle valve, expander, and an ejector as expansion devices. Arab J Sci Eng. 2023;48(3):3503–21. doi:10.1007/s13369-022-07147-z. [Google Scholar] [CrossRef]
6. Klemeš JJ, Varbanov PS, Walmsley TG, Jia X. New directions in the implementation of pinch methodology (PM). Renew Sustain Energy Rev. 2018;98:439–68. doi:10.1016/j.rser.2018.09.030. [Google Scholar] [CrossRef]
7. Aghbashlo M. Exergy-based sustainability analysis of food production systems. Planet Sust. 2023;1(1):19–44. doi:10.46754/ps.2023.07.003. [Google Scholar] [CrossRef]
8. Sing MAS, Beno MM. Energy consumption analysis and management strategies for the dairy farm in India towards sustainable development. IETE J Res. 2024;70(10):7911–21. doi:10.1080/03772063.2024.2359006. [Google Scholar] [CrossRef]
9. Rahman MS. Food properties handbook. 2nd ed. Boca Raton, FL, USA: CRC Press; 2009. [Google Scholar]
10. Choi Y, Okos MR. Effects of temperature and composition on the thermal properties of foods. In: Singh RP, Medina AG, editors. Food engineering and process applications. London, UK: Elsevier; 1986. p. 93–101. [Google Scholar]
11. Oztuna Taner O. Enhancement of the energy and exergy analysis capabilities of the yoghurt process: a case study of the dairy industry. Front Sustain Food Syst. 2024;8:1450653. doi:10.3389/fsufs.2024.1450653. [Google Scholar] [CrossRef]
12. Quijera JA, Labidi J. Pinch and exergy based thermosolar integration in a dairy process. Appl Therm Eng. 2013;50(1):464–74. doi:10.1016/j.applthermaleng.2012.06.044. [Google Scholar] [CrossRef]
13. Kaviani A, Aslani A, Zahedi R, Ahmadi H, Malekli MR. A new approach for energy optimization in dairy industry. Clean Eng Technol. 2022;8:100498. doi:10.1016/j.clet.20. [Google Scholar] [CrossRef]
14. Bergamini R, Moussavi A, Shahhosseini H. Energy integration opportunities in milk powder production plants. J Clean Prod. 2021;318:129190. [Google Scholar]
15. Walmsley TG, Lincoln BJ, Padullés R, Cleland DJ. Advancing industrial process electrification and heat pump integration with new exergy pinch analysis targeting techniques. Energies. 2024;17(12):2838. doi:10.3390/en17122838. [Google Scholar] [CrossRef]
16. Moran MJ, Shapiro HN, Boettner D, Bailey M. Fundamentals of engineering thermodynamics. Hoboken, NJ, USA: John Wiley & Sons, Inc.; 2018. [Google Scholar]
17. Towler G, Sinnott R. Chemical engineering design: principles, practice and economics of plant and process design. 3rd ed. Oxford, UK: Elsevier; 2022. [Google Scholar]
18. Wang L, Sunden B, Manglik RM. Plate heat exchangers: design, applications and performance. Southampton, UK: WIT Press; 2007. [Google Scholar]
19. Khan TS, Khan MS, Chyu MC, Ayub ZH. Experimental investigation of single phase convective heat transfer coefficient in a corrugated plate heat exchanger for multiple plate configurations. Appl Therm Eng. 2010;30(8–9):1058–65. doi:10.1016/j.applthermaleng.2010.01.021. [Google Scholar] [CrossRef]
20. Muley A, Manglik RM. Experimental study of turbulent flow heat transfer and pressure drop in a plate heat exchanger with chevron plates. J Heat Transf. 1999;121(1):110–7. doi:10.1115/1.2825923. [Google Scholar] [CrossRef]
21. Bejan A. Advanced engineering thermodynamics. Hoboken, NJ, USA: John Wiley & Sons, Inc.; 2016. [Google Scholar]
22. TLK Energy. Pinch analysis online tool. [cited 2025 Jan 1]. Available from: https://tlk-energy.de/. [Google Scholar]
23. Incropera FP, DeWitt DP, Bergman TL, Lavine AS. Fundamentals of heat and mass transfer. 8th ed. Hoboken, NJ, USA: John Wiley & Sons, Inc.; 1996. [Google Scholar]
24. Heat exchanger design software online tool. [cited 2026 Jan 1]. Available from: https://hskex-calsys.com/simulator/simulation. [Google Scholar]
25. Ibaaz K, Oudani M, Cherkaoui M, Harraki IE. Automated pinch-exergy analysis for industrial processes. Int J Supply Oper Manag. 2023;10(4):417–38. [Google Scholar]
Cite This Article
 Copyright © 2026 The Author(s). Published by Tech Science Press.
This work is licensed under a Creative Commons Attribution 4.0 International License , which permits unrestricted use, distribution, and reproduction in any medium, provided the original work is properly cited.
 Downloads
 Citation Tools
