
 Login
Login Register
 Submit a Paper
 Propose a Special lssue
 Open Access
REVIEW
Building Less to Achieve More: A Review of Service-Based Sufficiency Pathways in Global Net-Zero Transitions
1 School of Accounting and Finance, Xiamen University Tan Kah Kee College, Zhangzhou, China
2 School for Environment and Sustainability, University of Michigan, Ann Arbor, MI, USA
3 Institute of Ecology and Sustainable Development, Shanghai Academy of Social Sciences, Shanghai, China
* Corresponding Authors: Zewen Ge. Email: ; Mufan Zhuang. Email:
(This article belongs to the Special Issue: Toward Net-Zero Emission: Multidimensional Perspectives on Energy Transition)
Energy Engineering 2026, 123(8), 12 https://doi.org/10.32604/ee.2026.082217
Received 12 March 2026; Accepted 20 March 2026; Issue published 12 July 2026
 View Full Text
 Download PDF
Abstract
Limiting warming to the Paris temperature goals requires a rapid scale-up of low-carbon energy, yet recent experience suggests that deployment is increasingly shaped by delivery constraints rather than by technology cost trends alone. This review synthesizes peer-reviewed evidence on five constraints that repeatedly slow net-zero buildouts: lengthy approval and grid-connection processes; capital-intensive investment profiles that heighten sensitivity to the cost of capital and revenue risk; bottlenecks in critical minerals, processing, and manufacturing; social contestation and local governance that translate into siting exclusions, delays, and cancellations; and modeling traditions that can underrepresent these non-marginal frictions. Accordingly, we adopt an energy-services perspective to examine how demand-side strategies affect the scale and timing of the required buildout. We interpret degrowth as service-based sufficiency, rather than as a blanket reduction in welfare, and organize the evidence using the Avoid, Shift, Improve (ASI) sequence. Across sectors, the reviewed literature indicates that lowering baseline service demand and, in particular, peak requirements can reduce project counts and network upgrades, limit exposure to interconnection queues and permitting backlogs, ease upstream material pressures, and improve bankability under risk-averse finance. We conclude that net-zero pathways are more credible when service provision and demand-side design are treated as core planning variables alongside clean-energy supply expansion.Graphic Abstract
Keywords
Meeting the temperature objectives of the Paris Agreement requires an energy transition that is both rapid and deliverable. In this review, an energy transition is understood as a systemic redesign of the energy system around the services that societies choose to deliver and how those services are organized across space and time, while remaining buildable, operable, and socially legitimate at scale [1]. This definition matters because many influential pathways remain supply-centered. They pursue linear substitution through accelerated deployment of wind, solar, and new fuels, yet often understate the practical bounds that condition feasibility, including biophysical limits, network and temporal constraints, institutional and financial conditions, and social license [2].
Recent evidence is consistent with these bounds. Commissioning times for renewable projects have lengthened in a global sample covering more than twelve thousand projects across nearly fifty countries [3]. In the United States, grid interconnection requests accumulated to approximately 2.6 terawatts by the end of 2023 and queue durations continued to rise [4]. Models that incorporate empirically observed costs of capital show that higher financing costs materially increase mitigation costs [5]. Land-use governance has narrowed siting options through extensive local ordinances [6]. Therefore, these patterns suggest that feasibility becomes increasingly contingent when the transition is framed primarily as building more clean supply. A service-centered framing instead foregrounds whether energy services can be provided reliably at scales and speeds that the real world can credibly deliver.
This review advances a different organizing principle: degrowth, understood as service-based sufficiency, namely building less to achieve more [7]. The focus shifts from maximizing energy throughput to providing appropriate services with much lower energy and material intensity [8]. This framing aligns with demand-side management, post-growth scholarship, and circular-economy practice, and offers a coherent lens for feasibility when delivery constraints bind. Drawing on these bodies of work, we emphasize four points. First, we reframe the objective of net-zero transitions from aggregate energy consumption to quantified energy services, showing how sufficiency can be implemented through operational metrics rather than solely through normative claims. Second, we treat the sequencing of actions, Avoid, Shift, then Improve (ASI), as a design choice that can lower peaks, reduce project counts, and ease interconnection and permitting bottlenecks under binding delivery constraints. Third, we operationalize deliverability in planning and modeling using measurable quantities such as permitting and interconnection lead-time distributions, interconnection queue length and land assembly, manufacturing and supply-chain capacity, and financing conditions including the cost of capital, so models better align with what can be built and when. Fourth, we propose decision metrics that connect engineering with finance, focusing on guaranteed service floors, peak levels relative to service needs, service-indexed pricing, and debt-service coverage, to help translate policy into bankable projects with near-term deployment. Throughout, we also synthesize contested points and implementation limits to clarify where evidence is strong, where it is mixed, and what remains uncertain. The aim is not to prescribe austerity, but to examine how a smaller and more robust energy system could align political acceptability with engineering feasibility and thereby improve the credibility of net-zero pathways within the remaining time window.
The remainder of this review is organized as follows. Section 2 describes the review methods. Section 3 reviews the evidence on five binding constraints that shape the feasibility of energy transition buildout. Section 4 examines service-based sufficiency and demand-side management as an integrated demand-side framing for net-zero transitions. Section 5 develops implementation pathways and decision metrics that connect planning, modeling, and finance. Section 6 summarizes implications and draws the conclusion. Fig. 1 summarizes the overall research framework of the review, showing how the manuscript connects deliverability constraints, service-based sufficiency, the ASI sequencing logic, and implementation-oriented decision metrics into one analytical structure.

Figure 1: Research framework in this study.
2 Literature Search and Review Approach
This review synthesizes research on deliverable net-zero energy transitions, with particular attention to delivery constraints and demand-side approaches, including service-based sufficiency. The evidence base was assembled through structured database searches, complemented by backward reference checking and forward citation tracing [9]. We searched the Web of Science Core Collection and Scopus for English-language peer-reviewed journal articles and review papers published between 2014 and 2025 [10,11]. In addition, we used a limited set of targeted institutional reports from authoritative organizations (e.g., IEA, OECD, World Bank, FERC, European Commission, and REN21) to document recent developments in permitting, interconnection, finance, and critical-mineral governance that are not yet fully captured in the journal literature. These grey-literature sources were used for contextual and policy-updating purposes and were not included in the bibliometric counts reported below. Searches covered publications from 2014 to 2025 and were last updated on 11 November 2025. The initial search returned about 6000 records. After removing 1803 duplicate records, 4261 records remained and constituted the screened peer-reviewed evidence base for this review. Additional institutional reports were cited selectively for contextual updating only and were not counted in the bibliometric summaries. Searches were performed in titles, abstracts, and author keywords using three keyword groups aligned with the paper structure: (a) net-zero transitions and energy services; (b) service-based sufficiency, sufficiency, and demand-side management; and (c) delivery constraints relevant to real-world deployment. Keyword variants were included to reflect commonly used terminology across disciplines. The full list of keywords and variants is reported in Table 1.

We included studies that provide analytical content relevant to at least one of the following: evidence on delivery constraints; evidence on service-based sufficiency or sufficiency in relation to energy transitions; evidence on demand-side management and demand-side mitigation; or implementation mechanisms that connect planning and finance. We excluded papers in which relevant terms were used only rhetorically, without substantive analysis of energy transitions, or where findings could not be linked to feasibility constraints or to the provision of energy services.
Study selection proceeded in two stages. First, titles and abstracts were screened to remove clearly irrelevant records. Second, full texts were assessed against the inclusion criteria and then organized for synthesis in line with the paper structure. To reduce the risk of omitting influential work, we reviewed reference lists of key papers, screened studies that cited them, and conducted targeted searches when specific constraints or interventions required additional coverage. Fig. 2 presents the literature-review roadmap used in this study, linking the search strategy and screening process to the manuscript’s two main analytical components. This roadmap clarifies how the evidence base was organized from search and screening into the thematic synthesis developed in Sections 3–5.

Figure 2: Literature-review roadmap used in this study.
3 Five Binding Constraints to Deliverable Net-Zero Transitions
A common policy instinct is to expand low carbon supply rapidly and to internalize the emissions externality through price signals, allowing markets to complete fossil substitution at least cost. In practice, the energy system is bounded by a set of non-marginal constraints. These are not minor frictions but structural boundaries that determine what can be delivered and what cannot. As long as the objective remains “build more low-carbon energy,” these boundaries recur at the level of processes and assets. In what follows we examine five binding constraints: upstream rigidity in critical minerals and manufacturing; delivery time constants; finance as feasibility; social license and capability; and the limits of equilibrium modeling. Fig. 3 suggests that the current literature remains concentrated in Environmental Studies, while engineering and finance perspectives are comparatively underrepresented. The dominance of Environmental Studies in Fig. 3 may also help explain persistent blind spots in transition modeling, because the relative underrepresentation of engineering and finance perspectives can limit attention to construction timelines, interconnection processes, financing conditions, and bankability.

Figure 3: Publication (a) and top academic disciplines (b) of binding constraints from 2014 to 2025.
3.1 Mineral Constraints: From Fuel-Intensive to Material-Intensive Transition
Net-zero energy transitions are not merely a substitution of primary energy carriers; they also reallocate the binding constraints of the energy system from continuous fuel provision to the continuous delivery of materials and manufacturing capacity [12]. In this sense, the transition can be understood as a shift from a “fuel-intensive” regime to a markedly more material-intensive one: wind power, solar PV, electricity networks, batteries, and electric vehicles embed substantially higher quantities of minerals and metals per unit of installed capacity or delivered service than fossil-based pathways, exposing the clean energy supply chain to price volatility, geopolitical leverage, and disruption risks [13]. Evidence from material flow accounting reinforces the magnitude of this constraint. Using Total Material Requirement (TMR), Watari et al. (2019) show that meeting mid-century decarbonization targets could push upstream material extraction substantially above today’s levels, with pressures concentrated on key transition materials such as copper, nickel, lithium, cobalt, and bulk inputs including steel [14]. Importantly, “mineral scarcity” rarely manifests first as an absolute depletion of geological resources; rather, it tends to appear as deployment rate limits arising from the speed of capacity additions, declining ore quality, and tightening environmental and social constraints (i.e., “material bottlenecks” that bind earlier than physical exhaustion) [15].
First, the temporal mismatch between rapidly scaling clean energy demand will generate much slower expansion of mining and refining supply. The average lead times of mines are over 16 years from discovery to first production, including more than 12 years for exploration and feasibility and 4–5 years for construction. These long lead times make short-run supply highly inelastic; when multiple end-uses (EVs, storage, grids) expand concurrently, markets can shift into episodic tightness and price volatility rather than smooth adjustment. Second, geographic concentration and midstream bottlenecks exist. For many transition minerals, extraction is concentrated in a limited set of countries, and refining and materials processing are even more concentrated, amplifying “single-point-of-failure” vulnerabilities to trade restrictions, geopolitical events, and logistics shocks [16]. Under these conditions, the relevant constraint is not only “availability in the ground,” but processing capacity and the robustness of cross-border value chains. Third, an underestimated constraint arises from declining ore grades and rising energy intensity, an “energy-mineral nexus” in which lower quality deposits increase the energy required per unit of metal, raising costs, emissions, and waste volumes. The IEA highlights this dynamic for copper, and process-based analyses similarly document the long run sensitivity of energy demand to ore grade trends [12,15]. At the macro level, bottom-up assessment suggests the mining sector’s energy demand could increase materially under future demand growth and declining resource quality, creating an additional coupling between mineral supply expansion and decarbonization feasibility [17].
Circular economy strategies and recycling are necessary mitigations, but their near-term impact is bounded by stock dynamics (installed base formation, time-to-retirement, collection constraints) and by system frictions in sorting, disassembly, and process routes. For lithium-ion batteries specifically, Harper et al. (2019) detail persistent technical and infrastructural barriers that limit rapid scaling of high-quality secondary supply [18]. Consistent with this, World Bank analysis indicates that, even under improved recycling, primary production of several critical minerals still must rise sharply to meet a below −2°C pathway, underscoring that upstream mining and processing expansion remains a binding condition for the transition [19].
3.2 Deliverability Constraints: Time Constants from Permitting to Grid Connection
A central bottleneck in global net-zero transitions is increasingly not what to build, but whether projects can be permitted, connected, and commissioned within the shrinking time window. Recent global assessments converge on the same diagnosis: despite rapid growth in clean energy investment, delays in grid expansion, interconnection procedures, and administrative approvals are slowing the realized deployment of renewables, storage, and electrification. The IEA’s global stocktake of electricity grids identifies grid investment and connection processes as binding constraints that can slow the transition and increase emissions if reforms and build-out lag behind clean energy deployment [20]. Mitigation outcomes depend not only on techno-economic potential, but also on policy implementation capacity and governance that enable timely infrastructure delivery.
In practice, these delivery time constants are shaped mainly by two constraints: (i) permitting and siting timelines, and (ii) interconnection queues and network upgrade timelines. These delays are often labeled “soft costs,” yet the term is misleading; the binding feature is not their size but their institutional origin outside equipment procurement. Typical contributors include environmental assessment, litigation and appeals, interconnection studies, standards and data interfaces, and cross agency coordination. By lengthening the interval from project initiation to commercial operation, they raise schedule risk and uncertainty, which can translate into higher financing costs and, ultimately, higher delivered energy costs [21].
Permitting has shifted from a frictional delay to a structural constraint. In the EU, the Council’s emergency approach to “renewables go-to areas” introduced explicit time limits for permit-granting procedures (e.g., one year in designated areas and longer but bounded timelines outside), reflecting the view that administrative throughput and procedural complexity can determine delivery speed as much as construction duration [22]. The European Commission’s summary of the revised directive (EU/2023/2413) likewise highlights expedited transposition timelines for permitting-related provisions, reinforcing permitting reform as a primary institutional strategy to accelerate deployment [23]. These time constants are also strongly path dependent: they are rarely compressed through capital expenditure alone, and instead require redesign of procedures, staffing and institutional capacity, and coordination across levels of government.
Grid connection constraints often appear even more directly as queuing congestion. REN21 estimates that, as of 2023, around 3000 GW of renewable projects globally were awaiting grid connection (with roughly half in more advanced stages), indicating that plant-side additions are outpacing network-side readiness [24]. Under such conditions, deliverability is determined less by individual technology readiness and more by system absorbability, including interconnection capacity, upgrade planning, and queue governance. This has prompted regulatory intervention: Federal Energy Regulatory Commission reforms interconnection procedures to reduce backlogs and improve certainty (e.g., expanding the use of cluster studies and strengthening process discipline), explicitly framing queue congestion as a barrier to timely deployment of wind, solar, and storage [25]. Another analysis likewise characterizes bulk-power grid connection as a growing bottleneck for renewable and storage entry, consistent with the patterns observed in queue data [26]. This implies that cost competitiveness is not sufficient for on-time delivery. Even where clean technologies are economically attractive, transitions can fall behind schedule unless permitting and interconnection time constants are materially reduced through governance reform and coordinated grid expansion.
3.3 Financial Feasibility: The Cost of Capital, Revenue Risk, and Bankability
The transition toward a net-zero energy system often entails a structural shift in system economics from fuel-based, recurring operational expenditure (OPEX) toward investment-dominated capital expenditure (CAPEX) in wind and solar generation, grid expansion, storage, and electrification infrastructure. While this characterization is not equally binding across all sectors, it is highly representative for the asset classes that largely determine delivery pace and scale. For CAPEX-intensive assets, the binding question is frequently no longer which technology minimizes stylized costs, but whether projects can be capitalized on tolerable terms during construction and then secure operating cash flows that are sufficiently stable to service debt and recover equity. Because costs are strongly front loaded, renewables and network assets are unusually sensitive to financing conditions; similar technology costs can therefore translate into materially different levelized cost of energy (LCOE) outcomes and bankability profiles under different costs of capital [27]. Here, bankability refers to the extent to which a project is considered sufficiently predictable, financeable, and low-risk to attract investment on acceptable terms.
In this setting, two concepts that recur in energy finance are often simplified in energy system analysis. The first is the cost of capital (CoC), commonly operationalized as the weighted average cost of capital (WACC), which aggregates the price of debt, required equity returns, and capital structure into a binding constraint on financial ability. CoC varies systematically across countries and technologies; assuming uniform discount rates can therefore obscure real investment incentives and misstate deployment speed [28]. The second is policy risk. In infrastructure finance, policy risk is not a generic label for instability, but a cash flow risk channel: permitting and interconnection uncertainty, changes in support schemes and market design, and counterparty and contract enforceability risks alter expected revenues and are priced through higher risk premia and therefore higher CoC [29].
Financial feasibility depends not only on borrowing rates but also on revenue architecture. When projects lack long-duration revenue stabilizers such as power purchase agreements or contracts for difference and must sell electricity fully exposed to wholesale prices, the resulting income exposure is typically described as merchant risk [30]. The central issue is not volatility alone, but value compression as variable renewable penetration rises. Zero-marginal-cost generation concentrates output in correlated hours, depresses clearing prices, and reduces capture prices, producing the cannibalization effect [31]. Evidence from California documents statistically significant revenue declines for wind and solar as penetration increases, consistent with a mechanism that can tighten debt coverage, raise required equity returns, and increase WACC even when headline technology costs are already competitive [32].
Financial feasibility depends on who bears risk, how it is priced, and through which institutions it is absorbed. In political economies with stronger state coordination and deeper public balance sheets, governments can provide lower-cost capital, guarantees, and long-tenor finance, absorbing portions of development and market risk and strengthening mobilization capacity for capital-intensive build-out. Evidence on the composition of renewable energy financing shows that public actors can play an outsized role in riskier segments and earlier phases, effectively absorbing risks that private finance would otherwise price prohibitively [33]. Empirical work on state investment banks further shows how targeted instruments and market building functions can crowd in private capital by reducing perceived risk and improving bankability [34]. For China, firm level evidence links green credit and finance governance to renewable energy investment responses, consistent with the view that financial architecture shapes capital allocation beyond what technology costs alone would imply [35].
By contrast, in many regions the transition must mobilize substantial volumes of private institutional capital. Large infrastructure investments are exposed to multiple, partly correlated risks, including regulatory change, permitting and interconnection uncertainty, merchant revenue exposure (including capture-price decline), construction cost escalation and schedule slippage, foreign-exchange and convertibility risk, and counterparty credit risk. Investor-oriented syntheses conclude that policy stability, credible revenue arrangements, and financial-market structure jointly determine the cost of capital and the elasticity of capital supply, which in turn conditions whether infrastructure can be delivered on time [36].
These mechanisms generate pronounced global asymmetries in which many regions face a situation that is technically feasible but financially infeasible under prevailing risk premia. Multi-model analysis that incorporates empirically estimated, country-differentiated costs of capital finds that higher risk premia in developing economies can materially raise the financing cost of decarbonization and push deployment targets beyond feasible ranges, implying that reducing risk premia is a core lever for both mitigation effectiveness and equity. In response, the literature focusing on lower risk emphasizes policy and financial instruments such as guarantees and risk-sharing mechanisms as pathways to lower financing costs and expand the set of bankable projects where capital would otherwise be rationed by risk aversion [37].
3.4 Social License Constraints: From Acceptance to Deliverability
In renewable energy infrastructure buildouts, social license should not be treated as a simple matter of public attitudes, but as a bundle of conditions that directly enter the delivery critical path. Because projects are sited in lived landscapes and ecologically valued areas, deliverability hinges on whether procedural fairness and distributional fairness are institutionalized in permitting, compensation, and grievance mechanisms, and on whether local rules are stable and predictable enough to support investment and construction scheduling [38]. In polycentric governance settings, conflicts are frequently channeled into siting ordinances and litigation, which can translate social contestation into binding spatial exclusions and schedule risk. For the United States, Lopez et al. show that local setback and related siting rules, when extrapolated, can sharply contract developable resource potential for both wind and solar, implying that scenario pathways that abstract away from local regulatory constraints will systematically overstate deliverable capacity [6]. Project level evidence similarly indicates that apparent cost effectiveness does not automatically translate into real-world buildout: Susskind et al. document widespread delays and cancellations for utility scale renewable projects over 2008 to 2021, demonstrating that social license and regulatory process affect delivery through hard outcomes rather than only through shifts in political sentiment [39].
In more centralized governance, social license constraints may present less as adversarial litigation and more as information and capacity limits that still elongate lead times and reduce parallel build capability. Incomplete land tenure registries, weak ecological baseline data, and limited spatial-planning capacity raise early-stage uncertainty, increase transaction costs, and extend pre-construction development work, thereby tightening the effective delivery window even where central coordination is strong [40]. Rapid scale-up also increases demand for installation, construction, grid-connection, and operations roles, and shortages in skilled labor and critical trades can become binding bottlenecks for simultaneous project delivery. The IEA’s global energy employment assessment highlights skilled labor needs and shortages as a growing constraint for the buildout of energy infrastructure and notes headwinds for grids and storage linked to shortages of skilled workers [41]. Social license is therefore best treated as an upstream deliverability requirement: it depends on institutionalized procedures that are perceived as fair, distributional arrangements that are credible to host communities, and administrative systems that can process projects at the required tempo. It also depends on land and ecological data systems and training pipelines that match deployment trajectories, so that technically and economically feasible pathways do not fail at the point of execution. This framing is consistent with the long-established view that social acceptance is multidimensional and coupled across community, market, and socio-political domains, rather than substitutable by any single lever [42].
3.5 Model-Based Pathways: Feasibility, Assumptions, and Interpretation Limits
Integrated assessment models (IAMs), together with computable general equilibrium (CGE) models, provide internally consistent scenario frameworks across sectors, regions, and time horizons, allowing net-zero pathways to be compared on a common quantitative basis, including interactions among energy, land, macroeconomic activity, and climate outcomes [43,44]. A recurrent warning in the literature, however, is that IAM outputs are conditional on model scope and assumptions rather than practical situation, and that limited representation of real-world delivery processes can be mistaken for real-world implementation [45]. Recent comment further argues that relying on IAMs alone is insufficient under polycrisis conditions, where interacting social, ecological, and geopolitical stresses shape transition feasibility in ways only partly represented in standard mitigation pathway modeling [46].
Methodologically, the risk of over-reliance is often traced to equilibrium framings and growth-first baselines embedded in many mainstream IAM designs, where transitions are organized around intertemporal optimization and cost minimization, and where smooth adjustment is largely achieved through unified carbon pricing and marginal substitution across technologies [47,48]. Within these structures, energy service demand is frequently treated as exogenous or represented through stylized price and income responses, while delivery-relevant frictions such as permitting and grid-connection time constants, local governance conflict and litigation, skills and organizational capacity, supply chain and manufacturing lead times, and heterogeneity in financing conditions are more likely to enter as external constraints, scenario toggles, or ex post filters rather than as endogenous dynamics that co-evolve with policy and social response. One stream argues that feasibility should be treated as a coequal evaluative dimension alongside cost, with pathway interpretation organized around disaggregated enabling conditions rather than a single optimal solution, and with feasibility unpacked into assessable components that connect technical potential to initiative feasibility and behavioral plasticity [49]. A second stream calls for more systematic incorporation of social variables into IAM boundaries and core structures, emphasizing the need to ground modeling in social foundations so that governance, institutions, and social processes become central determinants of transition dynamics rather than residual factors appended to scenario narratives [50]. Fig. 4 synthesizes the five constraints discussed in Section 3 and highlights their cumulative relevance for deliverable net-zero transitions. Rather than operating as isolated frictions, these constraints jointly shape whether supply-centered pathways can be implemented on the required timescale. These constraints do not operate independently. In practice, they often reinforce one another and can become cumulatively binding. For example, permitting and interconnection delays extend development timelines, increase schedule uncertainty, and can raise financing costs through higher risk premia and costs of capital. In turn, higher financing costs can weaken bankability, delay investment decisions, and reduce the ability to absorb upstream and construction risks. Social license constraints can further intensify these dynamics by prolonging permitting, increasing litigation risk, and undermining policy predictability. The result is that deliverability is shaped not by any single bottleneck alone, but by the interaction of institutional, financial, material, and social constraints across the project cycle.

Figure 4: Explanation of constraints to deliverable net-zero transitions.
4 Demand-Side Framing for Deliverable Net-Zero Transitions
4.1 Ideological Contestation: Growth-First Substitution Versus Demand Formation
Demand-side mitigation has been repeatedly marginalized in net-zero transition debates not because it lacks mitigation potential, but because the dominant growth-first framing constrains what counts as a legitimate policy problem [51,52]. In mainstream climate economics, the transition is often posed as an efficiency problem in which an optimal carbon price internalizes the emissions externality while preserving an assumed output trajectory, with welfare approximated through aggregate consumption and its discounted intertemporal path [53]. This framing is embedded in widely used optimization-based IAM traditions, where mitigation is largely operationalized as marginal substitution under price signals and where institutional frictions are commonly treated as externalities to the core welfare problem rather than as co-evolving constraints on delivery [43,54]. As a result, permitting, interconnection, and coordination are frequently positioned outside the model core, even though they are central determinants of whether infrastructure can be built within the remaining time window.
A contrasting critical tradition, often articulated through Marxian political economy and environmental sociology, rejects the idea that demand is a neutral and exogenous preference set and instead treats demand as institutionally produced through accumulation dynamics [55]. In this view, the externalization of biophysical and social risks contributes to the lock-in of high-throughput infrastructures that can be rational under exchange value accounting but are not necessarily aligned with value provision or proportional welfare gains. Planned obsolescence and shortened product lifetimes are analyzed as deliberate strategies that sustain throughput and replacement demand, thereby maintaining material and energy flows even when basic needs are already met [56]. Complementary empirical syntheses in the affluence literature argue that consumption expansion driven by high income lifestyles and structural drivers can dominate aggregate impacts, which limits the extent to which supply-side decarbonization alone can deliver absolute reductions without addressing demand formation [57].
On this basis, the degrowth literature is operationalized here through the more policy-relevant concept of service-based sufficiency, rather than treated as a simple opposition to economic growth. The core proposition is that where exchange-value expansion diverges from use-value provision, policy should prioritize use value by redesigning service provision systems to meet needs with less energy and material throughput, while actively removing institutionally produced scarcity and waste [58]. This interpretation is consistent with evidence that demand-side strategies can achieve substantial mitigation while maintaining high levels of wellbeing when framed as avoid, shift, and improve at the level of services [59]. It is also aligned with assessment work emphasizing that demand, services, and social dimensions are integral to mitigation feasibility and should not be treated as secondary to technology substitution narratives. Fig. 5 shows that demand-side scholarship has grown substantially over the review period, although its disciplinary base remains concentrated in a limited set of fields. This trend indicates rising interest in service-based and sufficiency-oriented mitigation, while also suggesting that these approaches are still not fully integrated into mainstream engineering, finance, and transition-delivery debates. As shown in Fig. 5a, publication volume in demand-side studies increased markedly over the review period. The acceleration after major international events such as the Paris Agreement likely reflects growing policy and scholarly attention to mitigation pathways beyond technology substitution alone. More recent disruptions such as COVID-19 may also have reinforced interest in system resilience, implementation capacity, and the reorganization of demand, further broadening the discussion of service-based sufficiency.

Figure 5: Publication trends (a) and top 5 academic disciplines (b) of demand-side studies from 2014 to 2025.
4.2 Three Shifts: Operationalizing Demand-Side Action in Net-Zero Pathways
For demand-side action to become a viable and implementable option in net-zero transitions, it must be integrated at the core of pathway design. Demand-side measures can cut emissions while maintaining high levels of well-being. The IPCC assessment now recognizes demand, services, and social dynamics as central domains for mitigation. Scenario evidence highlights the practical implications of this shift. Lower service demand can reduce the scale of supply transformation that must be delivered within constrained time frames [60]. Recent syntheses reframe this agenda as “high with low,” making the logic of service design explicit [61].
The first shift is an objective function shift. This shift moves the unit of success from aggregate output and energy throughput to energy services. Energy services can be defined and tracked systematically through the energy service cascade [62]. Service outcomes can also be benchmarked quantitatively. Studies on decent living quantify the energy required to ensure basic service levels across countries [63]. Parallel literature shows that many aspects of a good life do not require proportional increases in resource throughput. It links this to pressures on planetary boundaries [64].
The second shift is a shift in the order of operations. Sequencing becomes a critical design choice. Avoid should be prioritized first. Shift should follow. Improve should come last. If electrification and efficiency are applied to a large baseline, capacity needs rise earlier, which increases the demands for networks and capital. Global modeling evidence shows that demand-side strategies can significantly reduce supply-side investment needs when they reduce baseline demand and peak levels [65]. The sequence also matters because rebound effects can erode expected savings. Reviews of the evidence document direct rebound effects and broader spillovers that can partially offset efficiency gains [66,67].
The third shift is a shift in the object and scale of analysis. This shift moves the focus from energy flows and prices to service provisioning systems delivered within institutional, network, and upstream boundaries. A flow-and-price framing tends to treat delivery frictions as marginal issues. However, a service-oriented framework makes the core question operational. It asks how the same service can be produced with less energy and material throughput. It compares provisioning configurations that differ in peak characteristics, network dependence, and upstream material burdens. This is how delivery constraints emerge as key differentiators in pathway comparisons, rather than as caveats to be included in the margins.
4.3 ASI as a Sequencing Framework for Demand-Side Mitigation
Avoid, Shift, Improve (ASI) was first formalized and operationalized in the transport sector. It emerged from the recognition that vehicle efficiency improvements alone cannot reliably offset growth in travel demand, modal lock-in, and the expanding infrastructure footprint associated with car-dependent mobility systems [68]. Empirical pathway work in transport has therefore used ASI as a practical structuring device, distinguishing measures that reduce activity levels, reallocate activity toward lower-energy modes, and improve technologies and fuels [69]. The framework has since been generalized beyond transport and adopted in mainstream climate governance and synthesis. Literature applies ASI across end-use sectors and links it explicitly to wellbeing, showing that demand-side options span behavioral, infrastructural, and technological domains and can deliver large emissions reductions relative to a supply-focused baseline while affecting welfare outcomes [52].
In net-zero pathway design, the main contribution of ASI is that it makes sequencing and system scale explicit. Avoid and Shift act on both baseline demand and peak loads; they change how much infrastructure must be built and connected. Improve then operates on a smaller and less demanding system. Quantitative energy-system analysis for passenger transport illustrates this logic. In a Germany case study, sufficiency oriented Avoid and Shift strategies delivered impacts comparable to propulsion technology improvement and reduced required generation capacity by roughly one quarter, indicating that demand reduction can directly relax upstream capacity buildout and integration burdens [70]. Multi-model evidence at the global scale likewise supports the importance of demand-side portfolios. Demand-side strategies in buildings and transport can enable rapid and deep emissions cuts to mid-century when combined with enabling policies and infrastructures, reinforcing that demand-oriented measures are not marginal add-ons but can reshape feasible transition trajectories [71].
ASI does not imply that demand-side measures are always cheaper or free of trade-offs. A recent study on Chinese residential buildings quantifies demand-side packages and finds that an optimistic cost-effective demand-side solution can cut cumulative emissions by 47 percent while also reducing net present value system costs by 16 percent, and it stresses that achieving carbon neutrality requires coordinated progress in upstream supply sectors rather than isolated end-use action [72]. Whole-life building strategy assessments in Europe likewise classify measures using ASI and show that decarbonization outcomes depend on where and when interventions occur across the life cycle, with diffusion potentials and impacts varying materially across member states [73]. The practical implication is that ASI functions best as a disciplined way to construct pathways. It reduces the risk that efficiency and electrification are asked to compensate for an oversized baseline, while keeping attention on timing, infrastructure constraints, and upstream material and power-system conditions that determine real-world deliverability.
4.4 How Demand-Side Strategies Ease Binding Constraints on Net-Zero Transitions
This section synthesizes evidence on how demand-side mitigation can relax five binding constraints on net-zero delivery by lowering baseline service demand and, especially, reducing peaks [74]. The recurring finding across the literature is that smaller and smoother demand profiles reduce the volume and simultaneity of supply-side buildout, which is where delays, risk premia, and bottlenecks most often become binding [8].
Mineral constraints increasingly bind through processing capacity, lead times, and upstream externalities, and demand-side strategies can reduce pressure by lowering material intensity and slowing required new stock additions [75]. Scenario and supply-chain indicator work frames concentration and expansion pace as feasibility limits, while major assessments map technology mineral dependencies and mineral-intensity trajectories under substitution and circularity [76]. Evidence on upstream social and environmental risk contexts explains why rapid extraction can trigger procedural and conflict costs [77]. Material-efficiency research provides the most direct demand-side lever set, with quantified packages for buildings and vehicles, stock-based modeling and prospective LCA, and synthesis showing that these strategies can reduce both mitigation task and material demand while requiring explicit trade-off assessment, including technology-chain tests for solar PV bottlenecks [78,79].
Observed delivery timelines indicate that time constraints are shaped by institutional throughput and network congestion, and demand-side measures can ease both by reducing the number of projects and peak-driven upgrades that must be processed. Commissioning times have lengthened across technologies and project sizes in a global sample, and interconnection evidence shows long lead times from request to operation for projects that do proceed, increasing the value of pathways that reduce the construction task. Evidence also shows that opposition can translate into procedural delay, that local siting ordinances can materially restrict developable resources [6], and that automated permitting can shorten timelines for standardized projects [80]. Reducing required buildout can therefore lower exposure to contested sites, while administrative reforms improve throughput at the margin. Demand-oriented scenarios explicitly link these constraints to the scale of supply expansion and show that downsizing the system transformation can improve feasibility.
Financial feasibility is repeatedly shown to depend on the cost of capital and revenue risk, and demand-side measures can improve bankability primarily by reducing peak capacity needs and limiting overbuild [81]. Scenario analysis shows that region-specific WACC assumptions reshape portfolios and deployment pace, and syntheses attribute high financing costs to priced risks such as macro conditions, currency and policy uncertainty, and execution structures, with empirical ranges documenting large cross-region differences. Investment tracking confirms persistent regional imbalance [82], while demand-side studies report comparable appraisal results in NPV terms and clarify how capture-price decline under high variable renewables penetration feeds into risk assessment and financing outcomes [32].
Social license research links acceptance to delivery outcomes through process, distribution, and siting rules, and demand-side mitigation eases these constraints mainly by reducing land and network pressure and lowering the rate of simultaneous project delivery [83]. The social acceptance triangle remains a core organizing framework, and meta-analysis identifies repeatable determinants such as trust, perceived benefits, and procedural factors [84]. Project-level datasets connect contestation to delay and cancellation outcomes. Spatial extrapolation shows that local ordinances can restrict developable resources; distributional design through ownership and community benefits matters for acceptance; critique highlights intra-community heterogeneity; and labor and skills shortages constrain parallel delivery capacity [85]. Smaller build requirements therefore reduce exposure to these binding channels.
Modeling debates show that feasibility cannot be inferred from cost-optimal trajectories alone when delivery processes and social dynamics are weakly represented, and demand-side work improves testability by representing services and lifestyles more explicitly. Reviews summarize persistent critiques of IAM assumptions and transparency, and energy-system modeling highlights gaps in resolution, openness, and representation of behavior and social risk. Demand-side approaches are increasingly operationalized through explicit lifestyle and service representation [86], feasibility frameworks that separate technical potential from initiative feasibility and behavioral plasticity, and scenario families that reduce reliance on large-scale carbon removal by shrinking the supply-side task, including service-based low-energy-demand pathways, service-based sufficiency consistent implementations in IAM settings [87], and multi-model benchmarks for buildings and transport.
Additionally, these constraints should not be understood as operating independently. In practice, they often reinforce one another. For example, permitting or interconnection delays can extend project timelines and increase perceived risk, which in turn raises financing costs through higher risk premia and weakens bankability. Likewise, material shortages, labor constraints, or local opposition can slow delivery, increase costs, and further intensify financing and implementation challenges. This does not imply, however, that smaller-scale or more distributed pathways are frictionless. Large numbers of distributed retrofits, rooftop PV systems, or other modular interventions may create their own administrative, coordination, permitting, and interconnection burdens. However, these challenges often differ in form and may be less systemically binding than those associated with fewer large utility-scale projects, particularly with respect to siting conflict, project-level risk concentration, long lead times, and major network expansion requirements.
5 Implementing Service-Based Sufficiency for Net-Zero Energy Transitions
This section translates the evidence reviewed in Sections 3 and 4 into practical steps for service-based sufficiency. Once net-zero is stated in terms of service outcomes, and Avoid, Shift, then Improve is treated as an ordering choice, the key question becomes how to make that ordering visible in decisions made before large investments are committed. In practice, this means specifying service targets and sequencing expectations in planning standards, permitting and siting procedures, grid interconnection processes, tariff design, procurement rules, and financing terms. The aim is pragmatic: to improve deliverability under the five constraints identified in Section 3 without assuming a wholesale redesign of the economic system.
A service-based transition also requires decision metrics that describe services, not only energy volumes. Aggregate installed capacity remains a useful system statistic but is insufficient as a decision criterion. Complementary indicators include hours of thermal comfort achieved under specified indoor conditions, door-to-door accessibility within travel-time thresholds, productive floor area per occupant under comfort constraints, durability and repairability scores for manufactured goods, and peak load per unit of service. Used consistently, these metrics enable like-for-like comparisons among designs that deliver the same or better services with lower energy and material intensity. They also clarify how projects should be evaluated and how revenue and appraisal frameworks can be aligned with the objective of a smaller system and lower peaks.
Across the reviewed studies, three types of measures are most often discussed for putting service metrics into practice. First, a minimum level of essential energy services can be guaranteed through universal service obligations delivered by regulated providers. In a globally just transition, such floors should be calibrated to secure essential services where basic needs remain unmet, especially in low- and middle-income settings. By contrast, in high-consumption contexts, service-based sufficiency is less about constraining basic provision than about reducing excessive or high-intensity demand above the guaranteed floor. The guarantee is defined in service terms, not commodity volumes, and typically covers thermal comfort under specified indoor conditions, clean cooking, essential door-to-door accessibility, and productive electricity. Above the floor, affordability and efficiency can be aligned through progressive, service-indexed blocks while maintaining market-based pricing [88]. In parallel, participatory planning can move service targets and siting rules earlier in the process through periodic, statutory regional and municipal procedures. When benefit-sharing arrangements and clear timelines for objections and decisions are specified in advance, social license is addressed before projects reach late-stage approval.
Second, peak governance can be strengthened by combining sequencing with organization and pricing. Where assets are modular and network effects matter, such as district-scale thermal networks, building-fabric retrofits, and high-frequency public and active mobility, many studies emphasize repeatable workflows and standardized components. In these contexts, a public option alongside regulated private delivery can shorten supply chains and support modular deployment. Pilots of staggered schedules with public employers and anchor firms, combined with service-based tariffs and district-level flexibility markets, can reduce synchronized peaks and lower network reinforcement needs before scaling Improve measures. Large-scale field evidence indicates that incentive-based demand response can reduce peak load while maintaining protections for vulnerable groups [89]. These measures shift effort from adding capacity toward managing demand and upgrading existing stocks. They also improve bankability by making investment needs more gradual and revenues easier to justify for projects close to where energy is used.
Third, delays and integration frictions can be reduced through better data, standards, and finance. Open spatial datasets for land tenure and ecological constraints, hosting capacity maps for distribution and transmission, and common technical standards for building-to-grid and district-to-grid operation can reduce search and compliance costs and make it easier to plan smaller projects near demand. Hosting capacity assessment is increasingly used as a decision-relevant planning tool [90]. On the end-use side, durability, repairability, and circularity standards for appliances and mobility devices, paired with spares availability, design-for-disassembly, and service-life extension in public procurement, can reduce material demand per unit of service and ease upstream rigidity without triggering new extractive surges [91]. Finance can reinforce these choices when it rewards outcomes that reduce delivery time and risk, not only low levelized cost. Development banks and green funds can evaluate proposals using services delivered per unit of energy and materials, alongside practical delivery measures such as expected peak reduction, expected interconnection lead time, and construction and integration risks. Instruments such as revenue floors indexed to service outcomes, standardized performance-based payments, and credit enhancement for portfolios of smaller projects can strengthen debt-service coverage and reduce risk premia, thereby improving the likelihood of closing financing.
Hence, these measures place service-based sufficiency within existing governance and market structures. Guaranteed service floors stabilize expectations and focus Avoid and Shift efforts above the floor. Peak-aware organization and service-indexed pricing reduce synchronized peaks and improve bankability. Open data, hosting capacity assessment, and common technical standards reduce siting and integration frictions. Durability and repair requirements reduce material pressure per unit of service. Finance that accounts for delivery time and risk helps direct capital toward smaller, repeatable projects close to demand. The resulting system is smaller and more bankable, with higher acceptance and greater decision relevance for modeling and planning, directly addressing the constraints that will determine whether net-zero can be delivered on time.
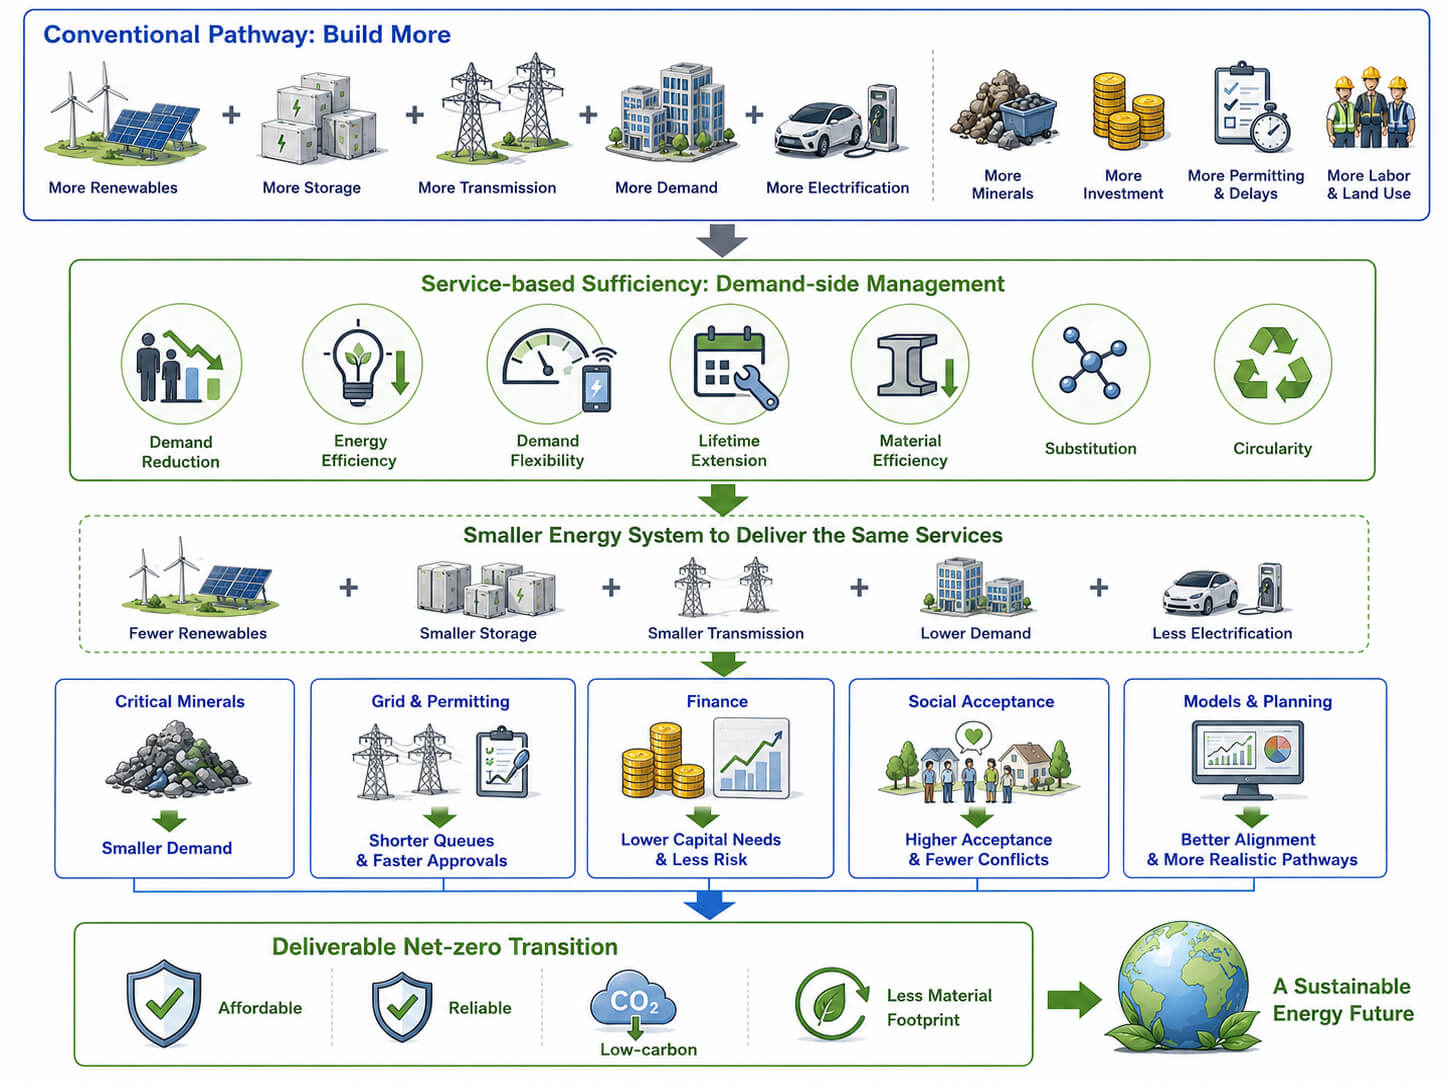
Fig. 6 summarizes this shift from supply-side expansion toward service-based sufficiency by showing how service-oriented planning, ASI sequencing, and delivery-aware finance and regulation can reduce project scale, ease system bottlenecks, and improve the real-world deliverability of net-zero transitions.

Figure 6: Shifting from supply-side expansion to service-based sufficiency.
This review examined what determines the deliverability of net-zero energy transitions under real institutional and biophysical limits. Section 3 synthesized evidence on five constraints that repeatedly shape buildout outcomes, namely permitting and interconnection lead times, finance as feasibility, upstream rigidity in critical minerals and manufacturing, social license, and model overreliance. Section 4 reviewed demand-side approaches in relation to supply-centered framings, clarified the shift from energy quantities to service outcomes, and organized the demand-side evidence using Avoid, Shift, then Improve, including how existing studies address each of the five constraints through demand-side strategies. Section 5 then translated these findings into implementation steps in planning, regulation, and finance.
Across the reviewed literature, the central message is concrete. Deployment outcomes are often determined by project timelines and queues, the cost and structure of capital, limits in manufacturing and material supply, and governance conditions that affect siting and acceptance. When strategies are assessed mainly in energy volumes or capacity additions, they can obscure how quickly services can be secured, how many projects must be permitted and connected, and how exposed the pathway is to financing and upstream constraints. Expressing objectives in service units and treating Avoid, Shift, then Improve as an ordering choice provides an operational way to lower peak demand and reduce the number and scale of projects that must be delivered. In practical terms, this reduces exposure to permitting bottlenecks, interconnection backlogs, debt and risk premia, and upstream supply limits.
The synthesis implies several changes in how decisions are prepared and evaluated. Planning and appraisal can compare portfolios on services delivered per unit of energy and materials and on peak requirements relative to service needs, rather than relying on capacity totals alone. Regulation and tariff design can specify minimum service outcomes and incentives that discourage synchronized peaks. Finance can evaluate proposals using delivery-relevant measures, including expected peak reduction, expected interconnection lead time, and construction and integration risks, alongside cost. Modeling regains decision relevance when it reports results in common service units, makes sequencing assumptions explicit, and represents permitting, interconnection, financing, and upstream limits as binding where warranted by empirical evidence.
Future work should strengthen the evidence base in at least nine areas. First, service-based metrics need clearer operational definitions, shared data standards, and validation across climates and settlement patterns, particularly for thermal comfort, accessibility, and productive electricity. Second, stronger empirical identification is needed on how Avoid and Shift interventions change peak demand, interconnection needs, and network reinforcement, including distributional impacts and possible rebound. Third, research on bankability should move beyond generalized cost curves to test revenue designs and credit structures for service-oriented interventions, including how debt-service coverage evolves when projects are smaller, modular, and closer to demand. Fourth, upstream impacts require more consistent quantification, including how durability, repairability, and circularity standards change material demand per unit of service and how these changes interact with manufacturing capacity. Fifth, social license needs measurement. Comparative studies should examine which procedural designs, benefit-sharing arrangements, and information practices reduce delays, litigation, and cancellation risk in siting and permitting. Sixth, more evidence is required from low- and middle-income settings, where service deficits, public finance capacity, and debt exposure differ materially from high-income contexts, and where sequencing Avoid, Shift, then Improve must distinguish basic service provision from high-intensity consumption. Seventh, innovation and employment implications remain under-specified. Empirical work should quantify how a shift toward retrofits, maintenance, repair, and system integration affects skill formation, job stability, and regional value creation relative to cyclical megaproject buildouts. Eighth, modeling research should systematically test outcomes under explicit ASI sequencing and under empirically grounded representations of institutional lags, interconnection queues, and financing conditions, rather than assuming improvements first. Ninth, future work should examine the political economy of ASI sequencing, including the governance models, coalition-building strategies, and institutional innovations needed to prioritize Avoid and Shift measures, which often face stronger resistance from incumbent actors than Improve-oriented or supply-side solutions.
This review has limitations. It relies primarily on English-language journal literature, and concepts and metrics are heterogeneous across disciplines. Even so, the reviewed evidence supports a consistent conclusion. Net-zero delivery is decided at the interface of projects, institutions, networks, and upstream constraints. A service-based framing, explicit sequencing, and delivery-aware decision metrics provide a practical basis for designing and evaluating pathways that can be financed, permitted, built, and socially accepted within the remaining time window.
Acknowledgement: This work was supported by the Qingqi Program of Shanghai Academy of Social Sciences and Zhangzhou Municipal Philosophy and Social Sciences Planning Project.
Funding Statement: This research was funded by the Qingqi Program of Shanghai Academy of Social Sciences and Zhangzhou Municipal Philosophy and Social Sciences Planning Project.
Author Contributions: Zewen Ge: Conceptualization, Formal analysis, Project administration, Writing—original draft, Writing—review & editing. Jihui Liu: Investigation, Writing—original draft, Visualization. Shuai Yuan: Visualization, Investigation, Software. Mufan Zhuang: Supervision, Language polish, Writing—review & editing, Funding acquisition. All authors reviewed and approved the final version of the manuscript.
Availability of Data and Materials: The authors declare that they have no known competing financial interests or personal relationships that could have appeared to influence the work reported in this paper.
Ethics Approval: Not applicable.
Conflicts of Interest: The authors declare no conflicts of interest.
Abbreviations
| ASI | Avoid, Shift, Improve |
| CAPEX | Capital Expenditure |
| CGE | Computable General Equilibrium |
| CoC | Cost of Capital |
| IAM | Integrated Assessment Model |
| LCOE | Levelized Cost of Energy |
| NPV | Net Present Value |
| OPEX | Operational Expenditure |
| PPA | Power Purchase Agreement |
| TMR | Total Material Requirement |
| WACC | Weighted Average Cost of Capital |
| BECCS | Bioenergy with Carbon Capture and Storage |
| CDR | Carbon Dioxide Removal |
| DAC | Direct Air Capture |
| LCA | Life Cycle Assessment |
| PV | Photovoltaic/Photovoltaics |
References
1. Intergovernmental Panel on Climate Change. Climate change 2022: mitigation of climate change (working group III contribution to the sixth assessment report). Cambridge, UK: Cambridge University Press. [cited 2026 Mar 1]. Available from: https://www.ipcc.ch/report/ar6/wg3/. [Google Scholar]
2. Gambhir A, Butnar I, Li PH, Smith P, Strachan N. A review of criticisms of integrated assessment models and proposed approaches to address these, through the lens of BECCS. Energies. 2019;12(9):1747. doi:10.3390/en12091747. [Google Scholar] [CrossRef]
3. Gumber A, Zana R, Steffen B. A global analysis of renewable energy project commissioning timelines. Appl Energy. 2024;358(7):122563. doi:10.1016/j.apenergy.2023.122563. [Google Scholar] [CrossRef]
4. Rand J, Manderlink N, Gorman W, Wiser RH, Seel J, Mulvaney Kemp J, et al. Queued up: 2024 edition—characteristics of power plants seeking transmission interconnection as of the end of 2023 (technical report). Berkeley, CA, USA: Lawrence Berkeley National Laboratory; [cited 2026 Mar 1]. Available from: https://emp.lbl.gov/publications/queued-2024-edition-characteristics. [Google Scholar]
5. Calcaterra M, Aleluia Reis L, Fragkos P, Briera T, de Boer HS, Egli F, et al. Reducing the cost of capital to finance the energy transition in developing countries. Nat Energy. 2024;9(10):1241–51. doi:10.1038/s41560-024-01606-7. [Google Scholar] [PubMed] [CrossRef]
6. Lopez A, Cole W, Sergi B, Levine A, Carey J, Mangan C, et al. Impact of siting ordinances on land availability for wind and solar development. Nat Energy. 2023;8(9):1034–43. doi:10.1038/s41560-023-01319-3. [Google Scholar] [CrossRef]
7. Keyßer LT, Lenzen M. 1.5°C degrowth scenarios suggest the need for new mitigation pathways. Nat Commun. 2021;12(1):2676. doi:10.1038/s41467-021-22884-9. [Google Scholar] [PubMed] [CrossRef]
8. Grubler A, Wilson C, Bento N, Boza-Kiss B, Krey V, McCollum DL, et al. A low energy demand scenario for meeting the 1.5°C target and sustainable development goals without negative emission technologies. Nat Energy. 2018;3(6):515–27. doi:10.1038/s41560-018-0172-6. [Google Scholar] [CrossRef]
9. Hirt J, Nordhausen T, Fuerst T, Ewald H, Appenzeller-Herzog C. Guidance on terminology, application, and reporting of citation searching: the TARCiS statement. BMJ. 2024;385:e078384. doi:10.1136/bmj-2023-078384. [Google Scholar] [PubMed] [CrossRef]
10. Mongeon P, Paul-Hus A. The journal coverage of web of science and Scopus: a comparative analysis. Scientometrics. 2016;106(1):213–28. doi:10.1007/s11192-015-1765-5. [Google Scholar] [CrossRef]
11. Martín-Martín A, Orduna-Malea E, Thelwall M, Delgado López-Cózar E. Google Scholar, Web of Science, and Scopus: a systematic comparison of citations in 252 subject categories. J Informetr. 2018;12(4):1160–77. doi:10.1016/j.joi.2018.09.002. [Google Scholar] [CrossRef]
12. International Energy Agency. The role of critical minerals in clean energy transitions. Paris, France: IEA; [cited 2026 Mar 1]. Available from: https://iea.blob.core.windows.net/assets/ffd2a83b-8c30-4e9d-980a-52b6d9a86fdc/TheRoleofCriticalMineralsinCleanEnergyTransitions.pdf. [Google Scholar]
13. Hund K, La Porta D, Fabregas TP, Laing T, Drexhage J. Minerals for climate action: the mineral intensity of the clean energy transition. Washington, DC, USA: World Bank; 2023. doi:10.1596/40002. [Google Scholar] [CrossRef]
14. Watari T, McLellan BC, Giurco D, Dominish E, Yamasue E, Nansai K. Total material requirement for the global energy transition to 2050: a focus on transport and electricity. Resour Conserv Recycl. 2019;148:91–103. doi:10.1016/j.resconrec.2019.05.015. [Google Scholar] [CrossRef]
15. Valero A, Valero A, Calvo G, Ortego A. Material bottlenecks in the future development of green technologies. Renew Sustain Energy Rev. 2018;93(2):178–200. doi:10.1016/j.rser.2018.05.041. [Google Scholar] [CrossRef]
16. Månberger A, Johansson B. The geopolitics of metals and metalloids used for the renewable energy transition. Energy Strategy Rev. 2019;26:100394. doi:10.1016/j.esr.2019.100394. [Google Scholar] [CrossRef]
17. Aramendia E, Brockway PE, Taylor PG, Norman J. Global energy consumption of the mineral mining industry: exploring the historical perspective and future pathways to 2060. Glob Environ Change. 2023;83(2):102745. doi:10.1016/j.gloenvcha.2023.102745. [Google Scholar] [CrossRef]
18. Harper G, Sommerville R, Kendrick E, Driscoll L, Slater P, Stolkin R, et al. Recycling lithium-ion batteries from electric vehicles. Nature. 2019;575(7781):75–86. doi:10.1038/s41586-019-1682-5. [Google Scholar] [PubMed] [CrossRef]
19. World Bank. The growing role of minerals and metals for a low carbon future. [cited 2026 Mar 1]. Available from: https://documents1.worldbank.org/curated/en/207371500386458722/pdf/117581-WP-P159838-PUBLIC-ClimateSmartMiningJuly.pdf. [Google Scholar]
20. International Energy Agency. Electricity grids and secure energy transitions. [cited 2026 Mar 1]. Available from: https://www.iea.org/reports/electricity-grids-and-secure-energy-transitions. [Google Scholar]
21. Organisation for Economic Co-operation and Development. Bridging the clean energy investment gap: cost of capital in the transition to net-zero emissions (OECD Environment Working Paper No. 245). [cited 2026 Mar 1]. Available from: https://one.oecd.org/document/ENV/WKP(2024)15/REV1/en/pdf. [Google Scholar]
22. Council of the European Union. Council regulation (EU) 2022/2577 of 22 December 2022 laying down a framework to accelerate the deployment of renewable energy (OJ L 335, 29.12.2022, pp. 36–44). EUR-Lex. [cited 2026 Mar 1]. Available from: https://eur-lex.europa.eu/eli/reg/2022/2577/oj/eng. [Google Scholar]
23. European Commission. Renewable energy directive: targets and rules (includes entry into force date for Directive EU/2023/2413 and transposition timelines, incl. July 2024 permitting-related provisions). [cited 2026 Mar 1]. Available from: https://energy.ec.europa.eu/topics/renewable-energy/renewable-energy-directive-targets-and-rules/renewable-energy-directive_en. [Google Scholar]
24. REN21. Renewables 2024 global status report: global overview. [cited 2026 Mar 1]. Available from: https://www.ren21.net/gsr-2024/modules/global_overview/. [Google Scholar]
25. Federal Energy Regulatory Commission. Improvements to generator interconnection procedures and agreements (Order No. 2023; Final rule published in the Federal Register, Sept. 6, 2023). [cited 2026 Mar 1]. Available from: https://www.govinfo.gov/content/pkg/FR-2023-09-06/pdf/2023-16628.pdf. [Google Scholar]
26. Gorman W, Kemp JM, Rand J, Seel J, Wiser R, Manderlink N, et al. Grid connection barriers to renewable energy deployment in the United States. Joule. 2025;9(2):101791. doi:10.1016/j.joule.2024.11.008. [Google Scholar] [CrossRef]
27. Vartiainen E, Masson G, Breyer C, Moser D, Román Medina E. Impact of weighted average cost of capital, capital expenditure, and other parameters on future utility-scale PV levelised cost of electricity. Prog Photovolt Res Appl. 2020;28(6):439–53. doi:10.1002/pip.3189. [Google Scholar] [CrossRef]
28. Steffen B. Estimating the cost of capital for renewable energy projects. Energy Econ. 2020;88:104783. doi:10.1016/j.eneco.2020.104783. [Google Scholar] [CrossRef]
29. Egli F. Renewable energy investment risk: an investigation of changes over time and the underlying drivers. Energy Policy. 2020;140(1):111428. doi:10.1016/j.enpol.2020.111428. [Google Scholar] [CrossRef]
30. Beiter P, Guillet J, Jansen M, Wilson E, Kitzing L. The enduring role of contracts for difference in risk management and market creation for renewables. Nat Energy. 2024;9(1):20–6. doi:10.1038/s41560-023-01401-w. [Google Scholar] [CrossRef]
31. Mills AD, Wiser RH. Strategies to mitigate declines in the economic value of wind and solar at high penetration in California. Appl Energy. 2015;147(3):269–78. doi:10.1016/j.apenergy.2015.03.014. [Google Scholar] [CrossRef]
32. López Prol J, Steininger KW, Zilberman D. The cannibalization effect of wind and solar in the California wholesale electricity market. Energy Econ. 2020;85(C):104552. doi:10.1016/j.eneco.2019.104552. [Google Scholar] [CrossRef]
33. Mazzucato M, Semieniuk G. Financing renewable energy: who is financing what and why it matters. Technol Forecast Soc Change. 2018;127(1):8–22. doi:10.1016/j.techfore.2017.05.021. [Google Scholar] [CrossRef]
34. Waidelich P, Steffen B. Renewable energy financing by state investment banks: evidence from OECD countries. Energy Econ. 2024;132(1):107455. doi:10.1016/j.eneco.2024.107455. [Google Scholar] [CrossRef]
35. Chang K, Zeng Y, Wang W, Wu X. The effects of credit policy and financial constraints on tangible and research & development investment: firm-level evidence from China’s renewable energy industry. Energy Policy. 2019;130(6):438–47. doi:10.1016/j.enpol.2019.04.005. [Google Scholar] [CrossRef]
36. Polzin F, Egli F, Steffen B, Schmidt TS. How do policies mobilize private finance for renewable energy?—a systematic review with an investor perspective. Appl Energy. 2019;236:1249–68. doi:10.1016/j.apenergy.2018.11.098. [Google Scholar] [CrossRef]
37. Matthäus D, Mehling M. De-risking renewable energy investments in developing countries: a multilateral guarantee mechanism. Joule. 2020;4(12):2627–45. doi:10.1016/j.joule.2020.10.011. [Google Scholar] [CrossRef]
38. O’Shaughnessy E, Wiser R, Hoen B, Rand J, Elmallah S. Drivers and energy justice implications of renewable energy project siting in the United States. J Environ Policy Plan. 2023;25(3):258–72. doi:10.1080/1523908x.2022.2099365. [Google Scholar] [CrossRef]
39. Susskind L, Chun J, Gant A, Hodgkins C, Cohen J, Lohmar S. Sources of opposition to renewable energy projects in the United States. Energy Policy. 2022;165(2):112922. doi:10.1016/j.enpol.2022.112922. [Google Scholar] [CrossRef]
40. Energy Sector Management Assistance Program (ESMAP). Key insights from social licensing to operate (SLO) in renewable energy projects: applying lessons to clean hydrogen development. [cited 2026 Mar 1]. Available from: https://documents1.worldbank.org/curated/en/099800109042522213/pdf/IDU-096306a8-77ca-4e71-ad5f-a330394a28ee.pdf. [Google Scholar]
41. International Energy Agency. World energy employment 2025. [cited 2026 Mar 1]. Available from: https://iea.blob.core.windows.net/assets/e5b9e908-26fe-4228-8978-e4ee36c555ed/WorldEnergyEmployment2025.pdf. [Google Scholar]
42. Perlaviciute G, Steg L. Contextual and psychological factors shaping evaluations and acceptability of energy alternatives: integrated review and research agenda. Renew Sustain Energy Rev. 2014;35(6):361–81. doi:10.1016/j.rser.2014.04.003. [Google Scholar] [CrossRef]
43. Weyant J. Some contributions of integrated assessment models of global climate change. Rev Environ Econ Policy. 2017;11(1):115–37. doi:10.1093/reep/rew018. [Google Scholar] [CrossRef]
44. Babatunde KA, Begum RA, Said FF. Application of computable general equilibrium (CGE) to climate change mitigation policy: a systematic review. Renew Sustain Energy Rev. 2017;78:61–71. doi:10.1016/j.rser.2017.04.064. [Google Scholar] [CrossRef]
45. Wilson C, Guivarch C, Kriegler E, van Ruijven B, van Vuuren DP, Krey V, et al. Evaluating process-based integrated assessment models of climate change mitigation. Clim Change. 2021;166(1):3. doi:10.1007/s10584-021-03099-9. [Google Scholar] [CrossRef]
46. Koasidis K, Nikas A, Doukas H. Modelling in climate mitigation: why we need to embrace polycrisis? One Earth. 2023;6(3):205–9. [Google Scholar]
47. Workman M, Darch G, Dooley K, Lomax G, Maltby J, Pollitt H. Climate policy decision making in contexts of deep uncertainty—from optimisation to robustness. Environ Sci Policy. 2021;120(5):127–37. doi:10.1016/j.envsci.2021.03.002. [Google Scholar] [CrossRef]
48. Mercure JF, Knobloch F, Pollitt H, Paroussos L, Scrieciu SS, Lewney R. Modelling innovation and the macroeconomics of low-carbon transitions: theory, perspectives and practical use. Clim Policy. 2019;19(8):1019–37. doi:10.1080/14693062.2019.1617665. [Google Scholar] [CrossRef]
49. Nielsen KS, Stern PC, Dietz T, Gilligan JM, van Vuuren DP, Figueroa MJ, et al. Improving climate change mitigation analysis: a framework for examining feasibility. One Earth. 2020;3(3):325–36. doi:10.1016/j.oneear.2020.08.007. [Google Scholar] [CrossRef]
50. Mathias JD, Debeljak M, Deffuant G, Diemer A, Dierickx F, Donges JF, et al. Grounding social foundations for integrated assessment models of climate change. Earth’s Future. 2020;8(7):e2020EF001573. doi:10.1029/2020ef001573. [Google Scholar] [CrossRef]
51. Creutzig F, Fernandez B, Haberl H, Khosla R, Mulugetta Y, Seto KC. Beyond technology: demand-side solutions for climate change mitigation. Annu Rev Environ Resour. 2016;41(1):173–98. doi:10.1146/annurev-environ-110615-085428. [Google Scholar] [PubMed] [CrossRef]
52. Creutzig F, Roy J, Lamb WF, Azevedo IML, Bruine de Bruin W, Dalkmann H, et al. Towards demand-side solutions for mitigating climate change. Nat Clim Change. 2018;8(4):260–3. doi:10.1038/s41558-018-0121-1. [Google Scholar] [CrossRef]
53. Nordhaus WD. Revisiting the social cost of carbon. Proc Natl Acad Sci U S A. 2017;114(7):1518–23. doi:10.1073/pnas.1609244114. [Google Scholar] [PubMed] [CrossRef]
54. Scott K, Smith CJ, Lowe JA, Garcia-Carreras L. Demand vs. supply-side approaches to mitigation: what final energy demand assumptions are made to meet 1.5 and 2°C targets? Glob Environ Change. 2022;72:102448. doi:10.1016/j.gloenvcha.2021.102448. [Google Scholar] [CrossRef]
55. Hickel J, Kallis G. Is green growth possible? New Polit Econ. 2020;25(4):469–86. doi:10.1080/13563467.2019.1598964. [Google Scholar] [CrossRef]
56. Rivera JL, Lallmahomed A. Environmental implications of planned obsolescence and product lifetime: a literature review. Int J Sustain Eng. 2016;9(2):119–29. doi:10.1080/19397038.2015.1099757. [Google Scholar] [CrossRef]
57. Wiedmann T, Lenzen M, Keyßer LT, Steinberger JK. Scientists’ warning on affluence. Nat Commun. 2020;11(1):3107. doi:10.1038/s41467-020-16941-y. [Google Scholar] [PubMed] [CrossRef]
58. Kallis G, Kostakis V, Lange S, Muraca B, Paulson S, Schmelzer M. Research on degrowth. Annu Rev Environ Resour. 2018;43(1):291–316. doi:10.1146/annurev-environ-102017-025941. [Google Scholar] [PubMed] [CrossRef]
59. Creutzig F, Niamir L, Bai X, Callaghan M, Cullen J, Díaz-José J, et al. Demand-side solutions to climate change mitigation consistent with high levels of well-being. Nat Clim Change. 2022;12(1):36–46. doi:10.1038/s41558-021-01219-y. [Google Scholar] [CrossRef]
60. Wiese F, Taillard N, Balembois E, Best B, Bourgeois S, Campos J, et al. The key role of sufficiency for low demand-based carbon neutrality and energy security across Europe. Nat Commun. 2024;15(1):9043. doi:10.1038/s41467-024-53393-0. [Google Scholar] [PubMed] [CrossRef]
61. Sugiyama M, Wilson C, Wiedenhofer D, Boza-Kiss B, Cao T, Chatterjee JS, et al. High with low: harnessing the power of demand-side solutions for high wellbeing with low energy and material demand. Joule. 2024;8(1):1–6. doi:10.1016/j.joule.2023.12.014. [Google Scholar] [CrossRef]
62. Kalt G, Wiedenhofer D, Görg C, Haberl H. Conceptualizing energy services: a review of energy and well-being along the Energy Service Cascade. Energy Res Soc Sci. 2019;53:47–58. doi:10.1016/j.erss.2019.02.026. [Google Scholar] [CrossRef]
63. Millward-Hopkins J, Steinberger JK, Rao ND, Oswald Y. Providing decent living with minimum energy: a global scenario. Glob Environ Change. 2020;65(12):102168. doi:10.1016/j.gloenvcha.2020.102168. [Google Scholar] [CrossRef]
64. O’Neill DW, Fanning AL, Lamb WF, Steinberger JK. A good life for all within planetary boundaries. Nat Sustain. 2018;1(2):88–95. doi:10.1038/s41893-018-0021-4. [Google Scholar] [CrossRef]
65. International Energy Agency. The value of demand flexibility. [cited 2026 Mar 1]. Available from: https://www.iea.org/reports/the-value-of-demand-flexibility. [Google Scholar]
66. Gillingham K, Rapson D, Wagner G. The rebound effect and energy efficiency policy. Rev Environ Econ Policy. 2016;10(1):68–88. doi:10.1093/reep/rev017. [Google Scholar] [CrossRef]
67. Brockway PE, Sorrell S, Semieniuk G, Heun MK, Court V. Energy efficiency and economy-wide rebound effects: a review of the evidence and its implications. Renew Sustain Energy Rev. 2021;141(1):110781. doi:10.1016/j.rser.2021.110781. [Google Scholar] [CrossRef]
68. Bakker S, Zuidgeest M, de Coninck H, Huizenga C. Transport, development and climate change mitigation: towards an integrated approach. Transp Rev. 2014;34(3):335–55. doi:10.1080/01441647.2014.903531. [Google Scholar] [CrossRef]
69. Zhang R, Hanaoka T. Cross-cutting scenarios and strategies for designing decarbonization pathways in the transport sector toward carbon neutrality. Nat Commun. 2022;13(1):3629. doi:10.1038/s41467-022-31354-9. [Google Scholar] [PubMed] [CrossRef]
70. Arnz M, Göke L, Thema J, Wiese F, Wulff N, Kendziorski M, et al. Avoid, shift or improve passenger transport? Impacts on the energy system. Energy Strategy Rev. 2024;52(6):101302. doi:10.1016/j.esr.2024.101302. [Google Scholar] [CrossRef]
71. van Heerden R, Edelenbosch OY, Daioglou V, Le Gallic T, Baptista LB, Di Bella A, et al. Demand-side strategies enable rapid and deep cuts in buildings and transport emissions to 2050. Nat Energy. 2025;10(3):380–94. doi:10.1038/s41560-025-01703-1. [Google Scholar] [CrossRef]
72. You K, Li Y, Cai W, Zhang L, Liu Z, Feng W, et al. Mitigating emissions and costs through demand-side solutions in Chinese residential buildings. Nat Commun. 2025;16(1):7358. doi:10.1038/s41467-025-62675-0. [Google Scholar] [PubMed] [CrossRef]
73. Alaux N, Marton C, Steinmann J, Maierhofer D, Mastrucci A, Petrou D, et al. Whole-life greenhouse gas emission reduction and removal strategies for buildings: impacts and diffusion potentials across EU Member States. J Environ Manag. 2024;370:122915. doi:10.1016/j.jenvman.2024.122915. [Google Scholar] [PubMed] [CrossRef]
74. Creutzig F, Simoes SG, Leipold S, Berrill P, Azevedo I, Edelenbosch O, et al. Demand-side strategies key for mitigating material impacts of energy transitions. Nat Clim Change. 2024;14(6):561–72. doi:10.1038/s41558-024-02016-z. [Google Scholar] [CrossRef]
75. International Energy Agency. Global critical minerals outlook 2024. [cited 2026 Mar 1]. Available from: https://www.iea.org/reports/global-critical-minerals-outlook-2024. [Google Scholar]
76. International Energy Agency. Solar PV global supply chains. [cited 2026 Mar 1]. Available from: https://www.iea.org/reports/solar-pv-global-supply-chains. [Google Scholar]
77. Lèbre É, Stringer M, Svobodova K, Owen JR, Kemp D, Côte C, et al. The social and environmental complexities of extracting energy transition metals. Nat Commun. 2020;11(1):4823. doi:10.1038/s41467-020-18661-9. [Google Scholar] [PubMed] [CrossRef]
78. Hertwich EG, Ali S, Ciacci L, Fishman T, Heeren N, Masanet E, et al. Material efficiency strategies to reducing greenhouse gas emissions associated with buildings, vehicles, and electronics—a review. Environ Res Lett. 2019;14(4):043004. doi:10.1088/1748-9326/ab0fe3. [Google Scholar] [CrossRef]
79. Pauliuk S, Heeren N, Berrill P, Fishman T, Nistad A, Tu Q, et al. Global scenarios of resource and emission savings from material efficiency in residential buildings and cars. Nat Commun. 2021;12(1):5097. doi:10.1038/s41467-021-25300-4. [Google Scholar] [PubMed] [CrossRef]
80. Williams J, Cook JJ, Cruce JR, Xu K, Crew S, Qasim M, et al. SolarAPP+ pilot analysis: performance and impact of instant, online solar permitting. Golden (CO). Golden, CO, USA: National Renewable Energy Laboratory; 2022. Report No.: NREL/TP-6A20-81603. [cited 2026 Mar 1]. Available from: https://www.nrel.gov/docs/fy22osti/81603.pdf. [Google Scholar]
81. IRENA. The cost of financing for renewable power, International Renewable Energy Agency, Abu Dhabi. [cited 2026 Mar 1]. Available from: https://www.irena.org/-/media/Files/IRENA/Agency/Publication/2023/May/IRENA_The_cost_of_financing_renewable_power_2023.pdf. [Google Scholar]
82. International Energy Agency. World energy investment 2024. [cited 2026 Mar 1]. Available from: https://www.iea.org/reports/world-energy-investment-2024. [Google Scholar]
83. Batel S. Research on the social acceptance of renewable energy technologies: past, present and future. Energy Res Soc Sci. 2020;68(5):101544. doi:10.1016/j.erss.2020.101544. [Google Scholar] [CrossRef]
84. Milani A, Dessi F, Bonaiuto M. A meta-analysis on the drivers and barriers to the social acceptance of renewable and sustainable energy technologies. Energy Res Soc Sci. 2024;114:103624. doi:10.1016/j.erss.2024.103624. [Google Scholar] [CrossRef]
85. International Energy Agency. World energy employment 2024. [cited 2026 Mar 1]. Available from: https://www.iea.org/reports/world-energy-employment-2024. [Google Scholar]
86. Scherer L, van Sluisveld MAE, van den Berg NJ, Cap S, Fuortes A, de Jager L, et al. Lifestyle change modelling for climate change mitigation: complementary strengths, policy support, and research avenues. Environ Sci Policy. 2025;173(2):104256. doi:10.1016/j.envsci.2025.104256. [Google Scholar] [CrossRef]
87. Kikstra JS, Li M, Brockway PE, Hickel J, Keysser L, Malik A, et al. Downscaling down under: towards degrowth in integrated assessment models. Econ Syst Res. 2024;36(4):576–606. doi:10.1080/09535314.2023.2301443. [Google Scholar] [CrossRef]
88. Sampedro J. Accounting for access and inequality. Nat Energy. 2021;6(8):773–4. doi:10.1038/s41560-021-00872-z. [Google Scholar] [CrossRef]
89. Wang Z, Lu B, Wang B, Qiu YL, Shi H, Zhang B, et al. Incentive based emergency demand response effectively reduces peak load during heatwave without harm to vulnerable groups. Nat Commun. 2023;14(1):6202. doi:10.1038/s41467-023-41970-8. [Google Scholar] [PubMed] [CrossRef]
90. Ismael SM, Abdel Aleem SHE, Abdelaziz AY, Zobaa AF. State-of-the-art of hosting capacity in modern power systems with distributed generation. Renew Energy. 2019;130(6):1002–20. doi:10.1016/j.renene.2018.07.008. [Google Scholar] [CrossRef]
91. Vidal F, van der Marel ER, Kerr RWF, McElroy C, Schroeder N, Mitchell C, et al. Designing a circular carbon and plastics economy for a sustainable future. Nature. 2024;626(7997):45–57. doi:10.1038/s41586-023-06939-z. [Google Scholar] [PubMed] [CrossRef]
Cite This Article
 Copyright © 2026 The Author(s). Published by Tech Science Press.
This work is licensed under a Creative Commons Attribution 4.0 International License , which permits unrestricted use, distribution, and reproduction in any medium, provided the original work is properly cited.
 Downloads
 Citation Tools
