
 Submit a Paper
 Propose a Special lssue
 Open Access
ARTICLE
Laser Additive Manufacturing of 316L Stainless Steel Thin-wall Ring Parts
1 School of Mechanical and Electrical Engineering, Shandong Jianzhu University, Jinan, 250101, China
2 Hangzhou Optimax Tech Co., Ltd., Hangzhou, Zhejiang, 310052, China
3 Shandong Research Institute of Industrial Technology Additive Manufacturing Collaborative Innovation Center, Jinan, 250101, China
* Corresponding Author: Yanhua Zhao. Email:
Fluid Dynamics & Materials Processing 2023, 19(2), 451-470. https://doi.org/10.32604/fdmp.2022.021035
Received 24 December 2021; Accepted 03 March 2022; Issue published 29 August 2022
 View Full Text
 Download PDF
Abstract
The process parameters of laser additive manufacturing have an important influence on the forming quality of the produced items or parts. In the present work, a finite element model for simulating transient heat transfer in such processes has been implemented using the ANSYS software, and the temperature and stress distributions related to 316L stainless steel thin-walled ring parts have been simulated and analyzed. The effect of the laser power, scanning speed, and scanning mode on temperature distribution, molten pool structure, deformation, and stress field has been studied. The simulation results show that the peak temperature, weld pool size, deformation, and residual stress increase with an increase in laser power and a decrease in the scanning speed. The scanning mode has no obvious effect on temperature distribution, deformation, and residual stress. In addition, a forming experiment was carried out. The experimental results show that the samples prepared by laser power P = 800 W, V = 6 mm/s, and the normal scanning method display good quality, whereas the samples prepared under other parameters have obvious defects. The experimental findings are consistent with the simulation results.Keywords
Laser additive manufacturing (LAM) is one of the current hot advanced manufacturing technologies [1–5], which has received great attention and rapid development worldwide [6] and has broad application prospects in aerospace, medical, automobile, electronics, military, and other fields [7,8]. Iron-based alloys are widely used materials with good comprehensive properties in today’s engineering technology, because of its relatively low price of raw materials and high hardness, additive manufacturing can form a good metallurgical bond with the substrate [9], and has good toughness and wear resistance [10,11], has been widely concerned by scholars. Among them, the research of 316L stainless steel occupies a large proportion, which is closely related to its strong corrosion resistance, good work hardening, easy forming, and low cost [12–14].
At present, regarding the LAM of 316L stainless steel, scholars have carried out a large number of studies [15,16]. In terms of mechanical properties, Meier et al. [17] tested the density of 316L stainless steel forming samples under different process parameters, and found that when the laser power was 90 W, the density of the product was up to 99%, which was close to the fully dense state. Montuori et al. [18] determined the optimum parameters for the Selective Laser Melting additive manufacturing process of 316L steel to obtain high-density parts. Kim [19] prepared austenitic 316L stainless steel plate and box specimens using conventional machining processes and two additive manufacturing processes, direct metal laser sintering and direct metal machining, for tensile tests, Vickers hardness tests, and microstructures. In the test, by comparing the tensile strength and elongation of the conventional processing technology, it is found that the additive manufacturing process has better mechanical properties. Bevan et al. [20] researched the mechanical performance of AM austenitic stainless steel 316L under different strain rates. Gençoğlu et al. [21] studied the effects of SLM process parameters on the microstructure, mechanical properties, and wear properties of 316L stainless steel. As a result, it was determined that the manufacturing parameters/strategies used in the SLM method have a significant effect on the mechanical properties and wear performance of 316L stainless steel. The lowest wear rate was obtained for the sample produced with 70% hatch spacing and 0° build orientation. This sample also represented the parameter in which the highest microhardness and density ratio was obtained. Evans et al. [22] prepared 316L stainless steel rods by laser additive manufacturing technology and discussed the microstructural and mechanical changes.
In terms of forming quality, Badrossamay et al. [23] researched the relationship between scanning speed and forming quality of 316L stainless steel powder in the SLM forming process, and found that with the increase of laser scanning speed, the quality of formed parts also increased within a certain range. In order to study the effects of laser power, powder feeding rate, and scanning speed on the macroscopic quality of the clad layer, Yang et al. [24] conducted a single-layer single-pass forming test using the orthogonal test for laser melting deposition and selected the best combination of process parameters laser power 1000 W, powder feeding rate 0.7 g/min and scanning speed 600 mm/min, and subsequently prepared thin-walled parts of 316L stainless steel using the best parameters. The stress distribution of the specimen was measured by XRD: tensile stress at the top and bottom, and compressive stress at the middle part. Pragana et al. [25] investigated the effect of processing parameters on the density of 316L stainless steel parts produced by laser powder bed fusion. Liu [15] studied the effect of different process parameters on the LPBF of 316L stainless steel alloy. The influence of each process parameter on the porosity from large to small is as follows: scanning speed, layer thickness, laser power, and hatch space. The influence of each process parameter on the surface roughness is in descending order: hatch space, layer thickness, laser power, and scanning speed. Larimian et al. [26] studied the effect of laser energy density on the density of 316L samples prepared by selective laser melting and found that as the scanning speed increased, the energy density decreased, and the sample density gradually decreased.
In terms of residual stress, Liu et al. [27] analyzed the residual stress of 316L stainless steel formed by selective laser melting using the X-ray diffraction method, discussed the influence of process parameters on the distribution of transverse and longitudinal residual stress, and found that the thermal cycle affected the distribution and evolution of residual stress in the height direction. In the horizontal direction, higher energy input and longer forming length produced larger residual stress; the stress parallel to the scanning direction was much larger than that perpendicular to the scanning direction, and the peak of residual stress always appeared at the initial stage of scanning. Portella et al. [28] carried out surface mechanical wear treatment on 316L stainless steel parts and studied the residual stress. Deng et al. [29] used different process parameters for laser cladding of 316L stainless steel on Q235 substrates and investigated the effects of laser power, scanning speed, and powder feeding rate on the stresses in the clad layer. It is found that the clad layer was mainly tensile, and the residual stresses parallel to the scanning direction were greater than those perpendicular to the scanning direction. The residual stress at the location of the molten layer was around 230 MPa. The higher the laser power and the smaller the scanning speed, the higher the residual stress. Fergani et al. [30] proposed an analytical model for evaluating residual stress in additive manufacturing made of metallic materials and studied the residual stress of selective laser melting of 316L stainless steel to verify the reliability of the model.
At present, research on LAM of 316L stainless steel mostly blocks solid parts, there are few studies on the process simulation and its influence on 316L stainless steel thin-walled parts. Therefore, the temperature field and stress field were investigated using finite element simulation firstly in this paper. Then experimental studies were conducted to analyze the macroscopic morphology and microstructure. Through the combination of simulation and experiment, the key process of LAM of 316L stainless steel thin-walled ring parts was studied.
2 Finite Element Model and Simulation Scheme
2.1 Establishment of Geometric Model and Meshing
The external 3D software is used to draw the geometric model and import it into Ansys. The Transient Thermal and Static Structural modules in Ansys software are used for Thermal indirect coupling analysis. The substrate size is 45 mm × 45 mm × 5 mm, and the material is 45# steel. The inner diameter of thin-walled ring parts is 18 mm, the outer diameter is 20 mm, the height is 6 mm, each layer is 1 mm, the material is 316L stainless steel. The fine degree of mesh division will directly affect the calculation accuracy of simulation analysis. To improve the calculation efficiency under the premise of ensuring the accuracy of the calculation results [31], the mesh in the forming layer area is refined, while the mesh in the substrate area is sparse. The grid division is shown in Fig. 1.
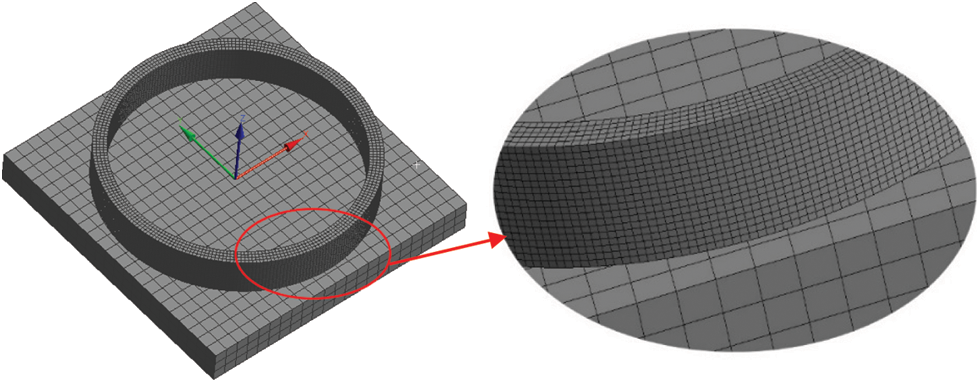
Figure 1: Meshing of finite element model
2.2 Initial and Boundary Conditions
Finite Element Simulation is one of the most accurate and popular techniques [32], the initial conditions and boundary conditions of the simulation process need to be set according to the actual working conditions. The boundary conditions of this simulation are set as follows:
(1) Initial conditions
During the laser additive manufacturing process, the initial temperature of the metal powder and substrate is assumed to be 22°C, and the ambient air temperature is also assumed to be 22°C.
(2) Boundary conditions
The heat exchange in the laser additive process is mainly based on thermal convection and thermal radiation. Therefore, the thermal boundary conditions in the calculation process are the third type of boundary conditions. When the boundary conditions are set, the effect of thermal radiation is small, so it can be ignored. The air convection coefficient in the laser additive manufacturing process is selected according to the empirical value, h = 10 W/(m2⋅°C).
LAM is a transient thermal analysis process that includes a complex series of changes in rapid melting, phase change, cooling, and solidification, and the model can become extremely complex if all these factors are taken into account. To simplify the operation, the following assumptions are made for the model [33]:
1. The influence of liquid flow on temperature field and stress field distribution in the molten pool is ignored.
2. The substrate is isotropic with the powder material, and the density of the material does not change with temperature.
3. The external environment temperature of the workpiece is 22°C, and the heat transfer coefficient of the outer surface of the cladding layer is always constant.
4. When the calculation step length time difference is small, it is considered that the physical parameters change linearly within a small step length.
5. The yield of material obeys Von Mises’s yield criterion.
In this paper, a Gaussian heat source is used to simulate laser forming. The equation is as follows [34,35]:
where
In this paper, the thermal coupling method is used to solve the temperature field and stress field, and the APDL language is used to realize the loading of the continuous Gaussian distribution heat source. Then, according to the results of the temperature field, the node temperature is applied as the ‘body force’ load in the subsequent stress analysis to realize the thermal coupling.
2.5 Thermophysical Parameters of 316L Stainless Steel
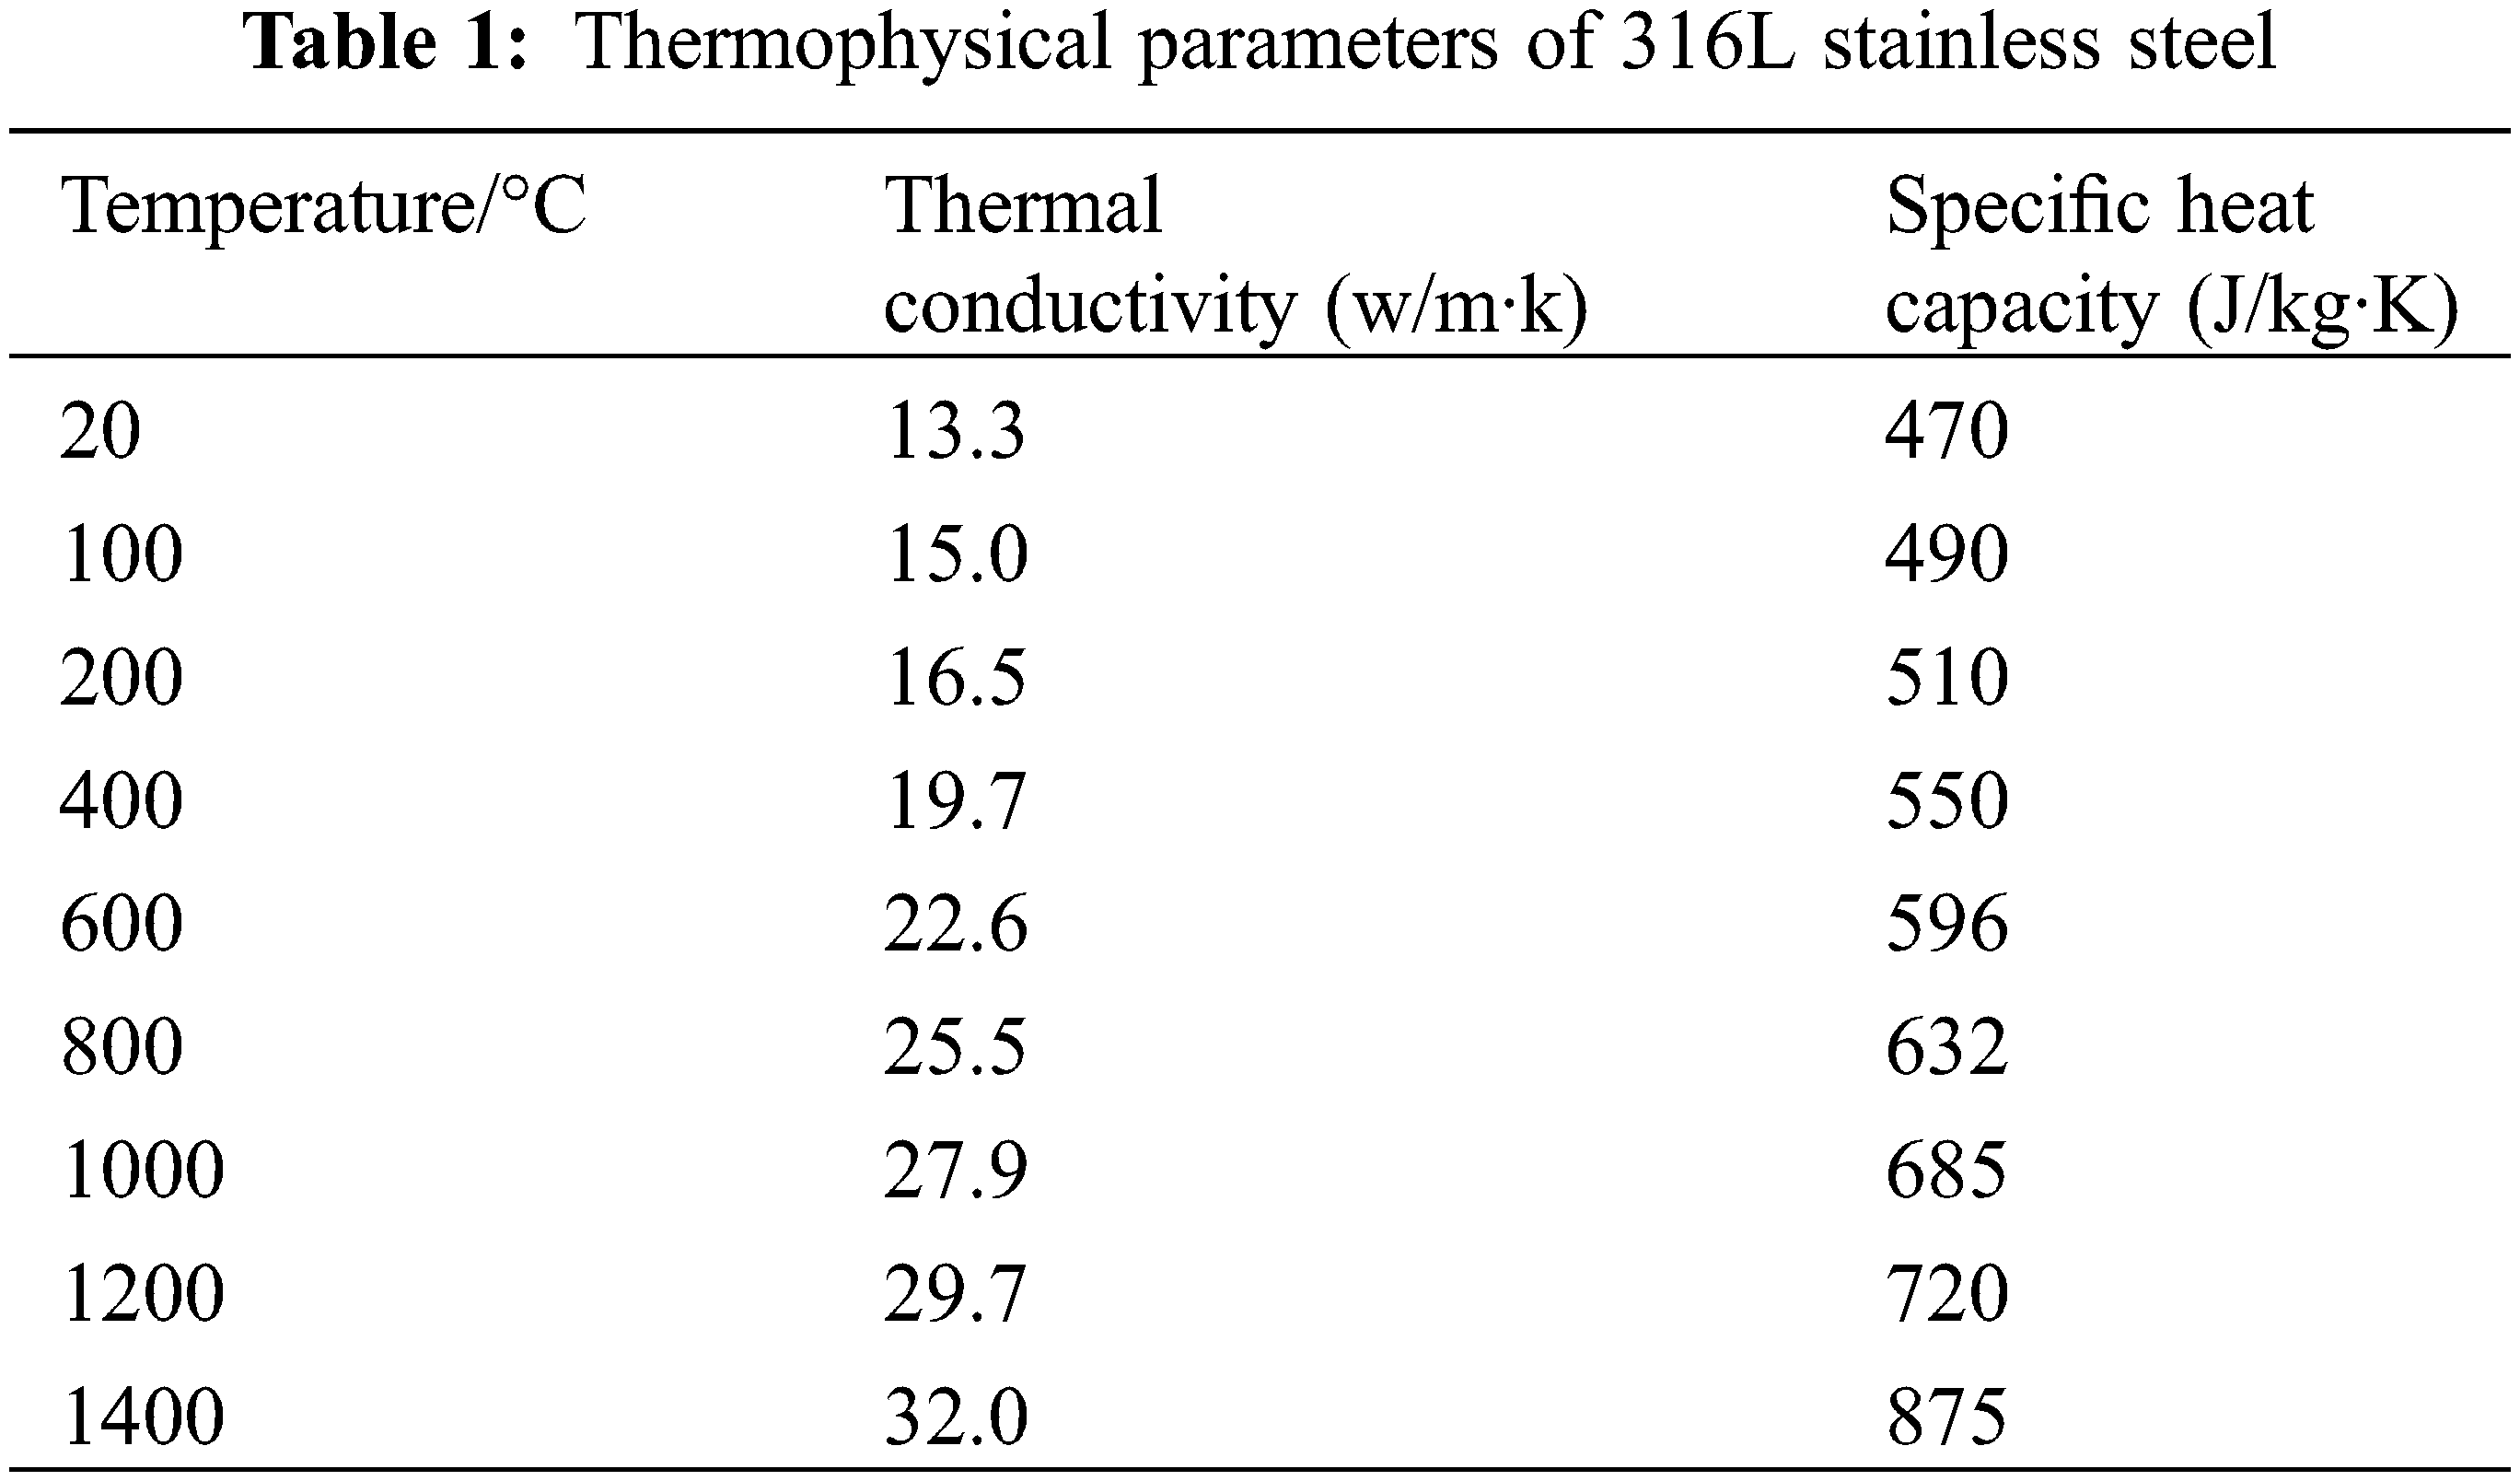
In the process of material processing, the physical parameters of the powder and the forming entity differ greatly, and in the process of conducting simulation calculations, the parameters need to be set according to the actual change of material physical quantities with temperature. The metal powder used in this paper is 316L stainless steel, and its thermal physical parameters are shown in Table 1 [36].
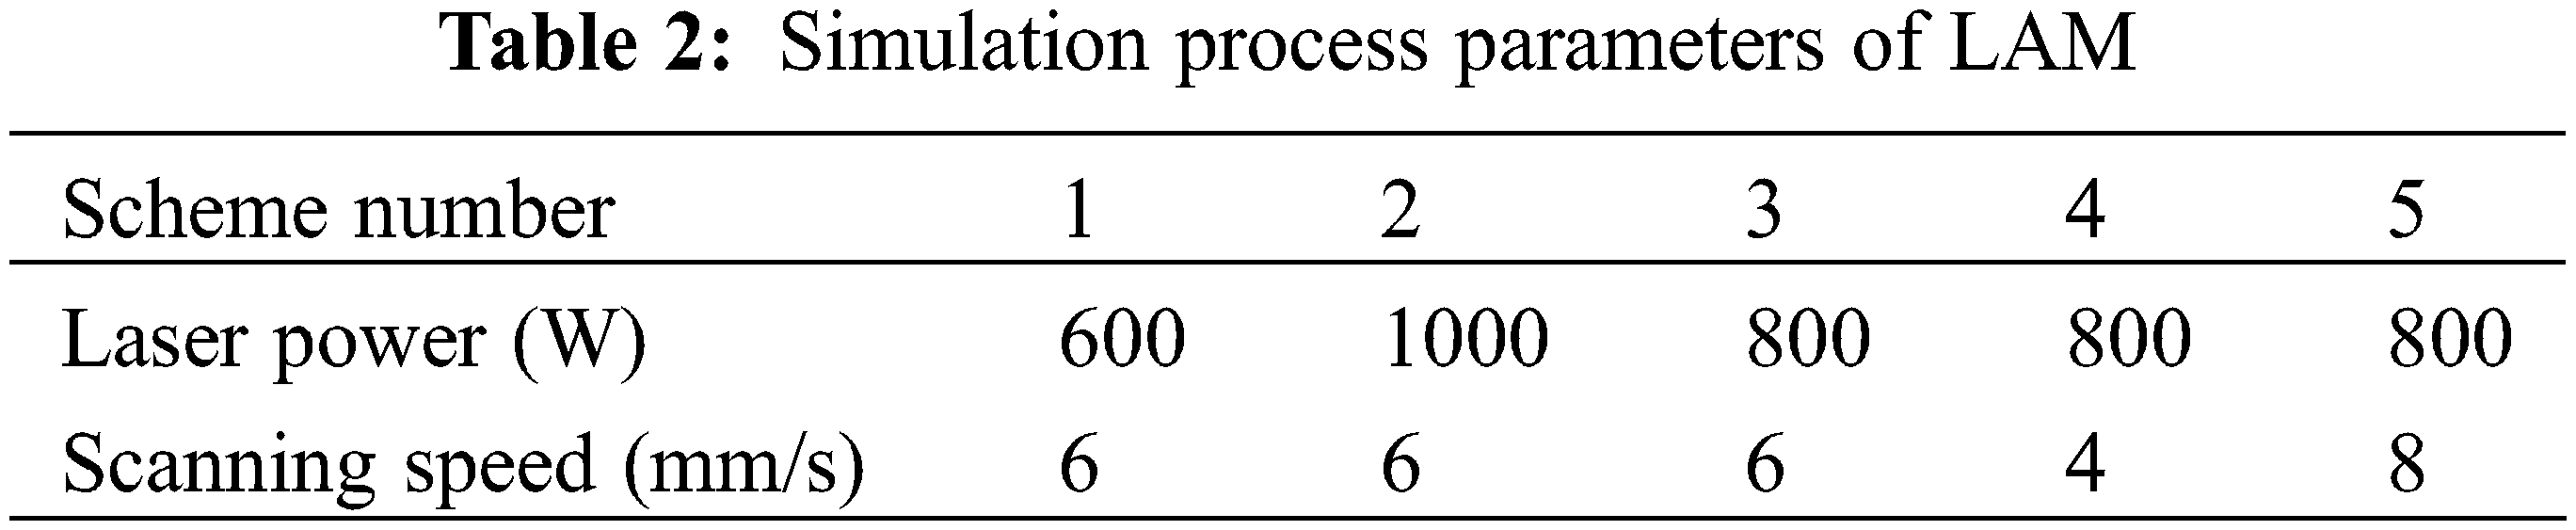
Meier et al. [17,18,21,29] studied 316L stainless steel with different process parameters. To systematically study the influence of different process parameters on the forming of thin-walled ring parts, combined with the existing research results of many scholars, the following simulation scheme is designed: The scheme is shown in Table 2, and the influence of process parameters on temperature field and stress field is observed by controlling a single variable. In the LAM simulation experiment, the laser power, scanning speed, and scanning mode are selected for the simulation experiment. Other parameters such as the spot diameter is 2 mm, the laser absorption rate is 0.35.
Scheme 2 is to fix the laser power P = 800 W and the scanning speed V = 6 mm/s. The effects of different scanning methods on the temperature field and stress field of 316L stainless steel thin-walled ring parts fabricated by LAM were studied by three different scanning methods. The scanning mode is shown in Fig. 2. The first scanning method is shown in Fig. 2a, starting from point A, forming a circle counterclockwise, and returning to point A, and the subsequent forming layers are scanned in this way, hereinafter referred to as normal scanning. The second scanning method is shown in Fig. 2b, starting from B, forming a circle in a counterclockwise direction and returning to point B, when the next layer is still starting from point B, forming a circle in a clockwise direction and returning to point B, the cycle repeats, the following is called alternate scanning. The third scanning method is shown in Fig. 2c, starting from C, forming a circle in a counterclockwise direction and returning to point C, and starting from D for the next layer, forming a circle in a counterclockwise direction and returning to point D point, and then the next layer takes E as the starting point, and so on, every 4 layers have a cycle, hereinafter referred to as periodic scanning.
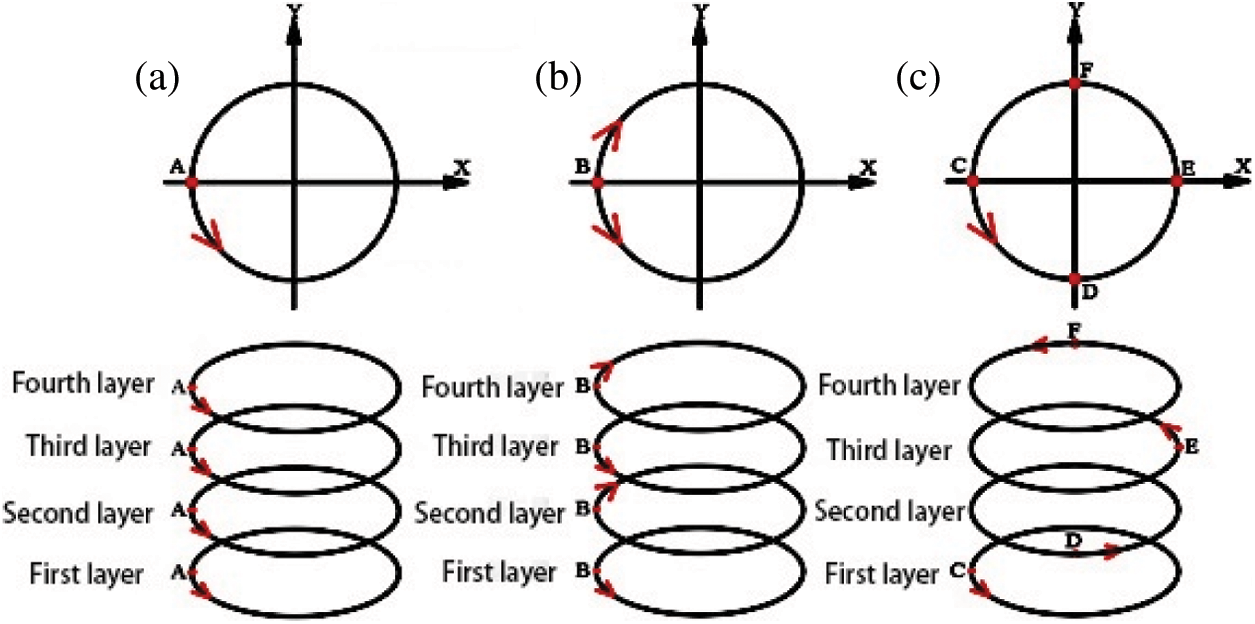
Figure 2: Three scanning modes: (a) normal scanning; (b) alternating scanning; (c) periodic scanning
Experiments were conducted to verify the effectiveness of the model. The surface temperature was recorded by a handheld infrared thermal imager in the process of LAM and compared with the simulation results. The experimental parameters are laser power 800 W, scanning speed 6 mm/s, spot diameter 2 mm. By comparison, it is found that the surface temperature of the actual machining process is very similar to the simulation temperature results, and from Fig. 3a, it can be seen that the peak temperature is 1774.4°C, and the peak temperature of Fig. 3b simulation is 1758.6°C. Within the allowable error range, it is proved that the simulation model in this paper is accurate and effective to a certain extent, and can be used for the analysis of LAM thin-walled ring parts.
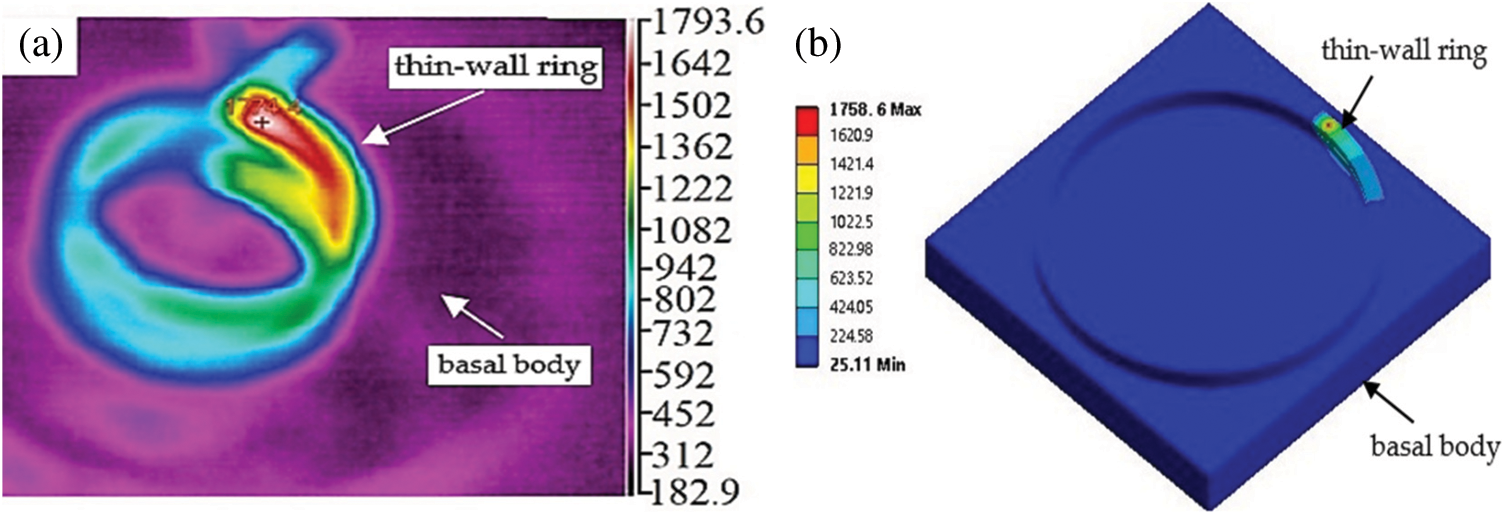
Figure 3: Comparison of experimental and simulation results: (a) experimental results; (b) simulation results
3 Analysis of Simulation Results
3.1 Effect of Laser Power, Scanning Speed, and Scanning Mode on Temperature Field
Fig. 4 shows the peak temperature of samples 1, 2, and 3 in the simulation process under the condition of changing laser power. As the laser power increases, the peak temperature increases. This is due to the increase of laser power, the energy density increases, the powder, and the matrix absorb more heat. So the temperature is higher, the cooling is slower, and the temperature peak becomes larger. Similarly, with the increase of scanning speed, the peak temperature in the simulation process shows a downward trend. Due to the increase of scanning speed, the residence time of high energy laser beam in unit length decreases, the contact time between powder and matrix and laser becomes shorter, and insufficient heat is absorbed so that the peak temperature decreases. By comparing the influence of the two on the temperature rise rate, it can be seen that the influence of laser power on the temperature peak in the simulation is much greater than that of the scanning speed.
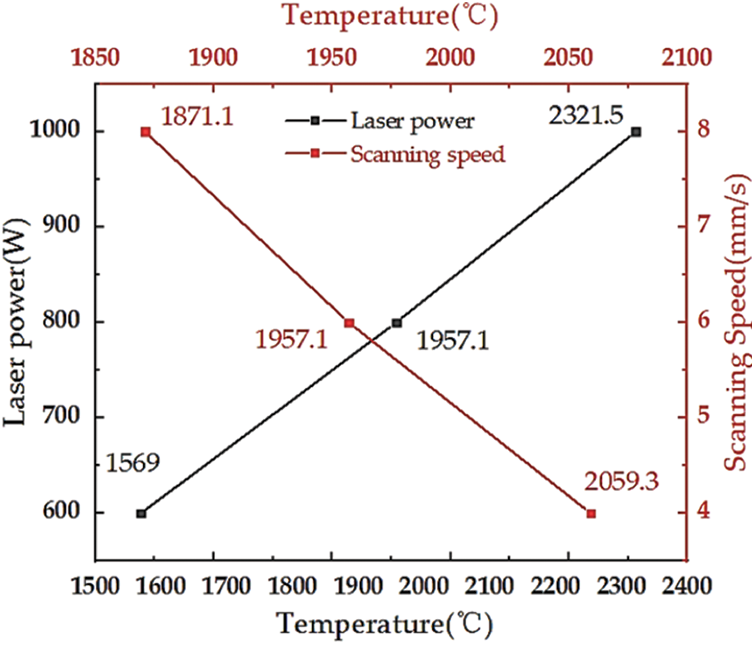
Figure 4: Peak temperature at different laser power and scanning speed
Fig. 5 shows the temperature-time curves of specimens 1, 2, and 3 under different laser power conditions. Fig. 6 shows the change of temperature-load step of samples 3, 4, and 5 under the condition of changing scanning speed. In the heating process, the overall temperature of each temperature curve rises in the sixth layer of the forming process, reaching the highest temperature in the forming process. While the temperature distribution of the first five layers is relatively similar. The possible reason is that as the LAM process progresses, the previously heated forming layer will have a preheating effect on the subsequent forming layer. The formation of the first five layers brings a large amount of heat input, resulting in a continuous accumulation of temperature. In the sixth layer, the temperature rise rate is faster, resulting in a large in the layer. Comparing Figs. 4–6, it can also be deduced that the influence of laser power on temperature distribution and its peak is much greater than that of scanning speed.
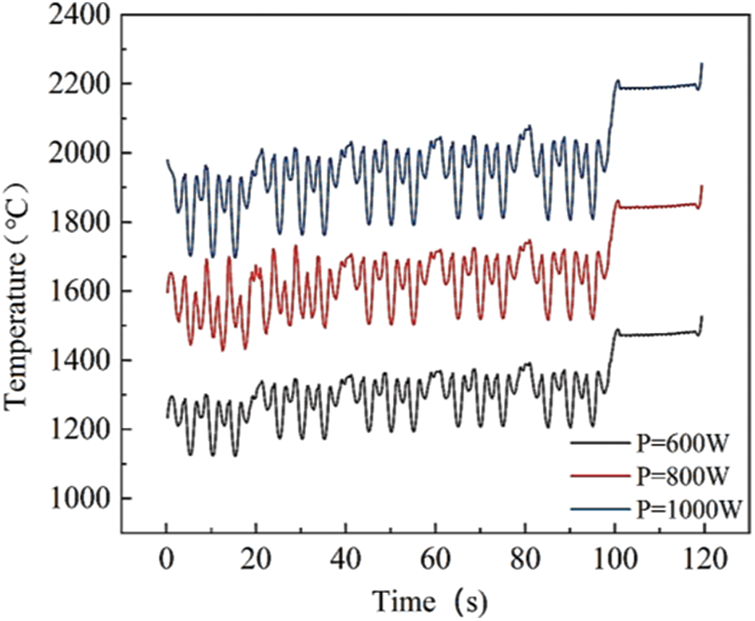
Figure 5: The temperature of samples 1, 2, 3 varies with time
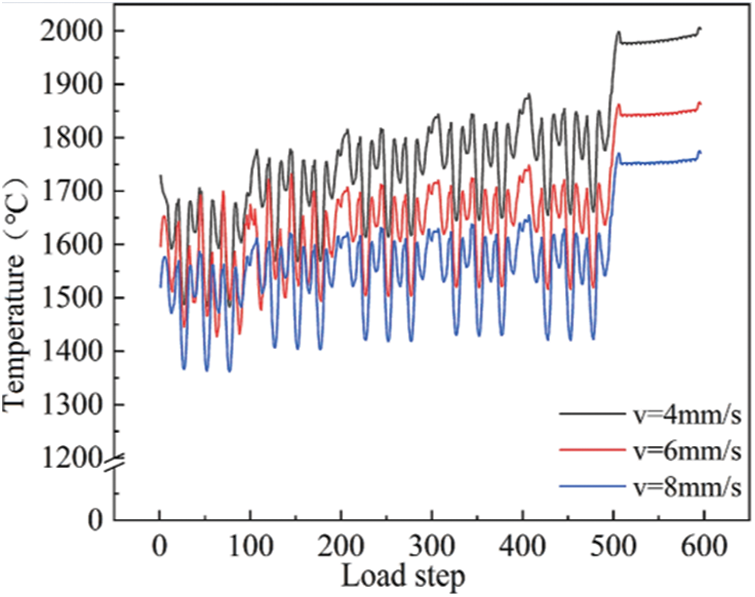
Figure 6: Temperature changes of specimens 3, 4, 5 with load step
Fig. 7 shows the peak temperature of three different scanning modes under the condition of fixed laser power 800 W and scanning speed 6 mm/s. It is found that the change of scanning mode has no obvious effect on the temperature change because the laser power and scanning speed directly affect the laser energy density, and the heat input is also affected by the laser energy density. The laser power and scanning speed of this group of parameters are fixed, and the heat input is unchanged, so the overall temperature changes little, and the effect of changing the scanning mode on the overall temperature is not obvious.
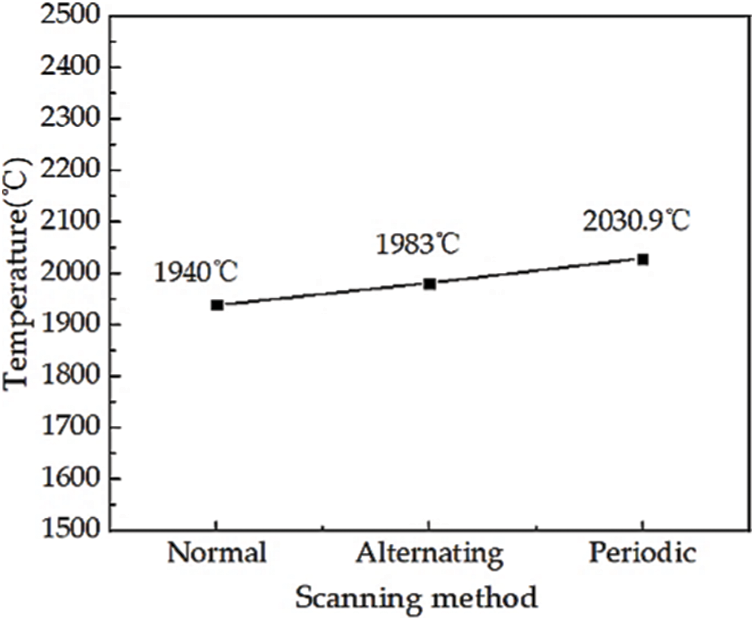
Figure 7: Peak temperature of different scanning modes
3.2 Effect of Laser Power and Scanning Speed on Molten Pool
Fig. 8 shows the weld pool sizes of specimens 1, 2, and 3 at 9.948 s with only increasing laser power. The weld pool size increases with the increase of laser power. This is because the increase in laser power leads to an increase in heat input and heat input. The more fully the powder is melted, the larger the weld pool structure will be.
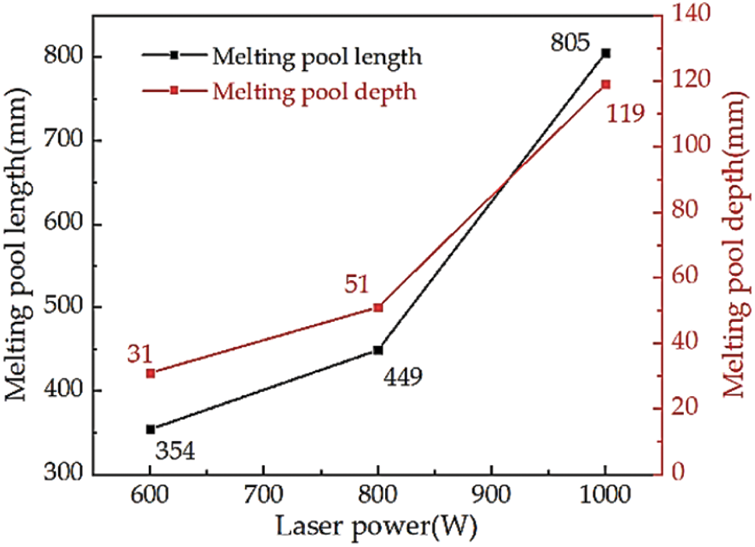
Figure 8: Pool size of different laser power
Under the condition of changing scanning velocity, the weld pool sizes of specimens 3, 4, and 5 are shown in Fig. 9. It can be seen that the size of the molten pool is largest when the scanning speed is 4 mm/s. under the condition of constant laser power, the decrease of scanning speed makes the forming layer have more time to contact the laser heat source and obtain a large amount of heat input, thereby increasing the peak temperature of the molten pool and causing the size of the molten pool to increase.
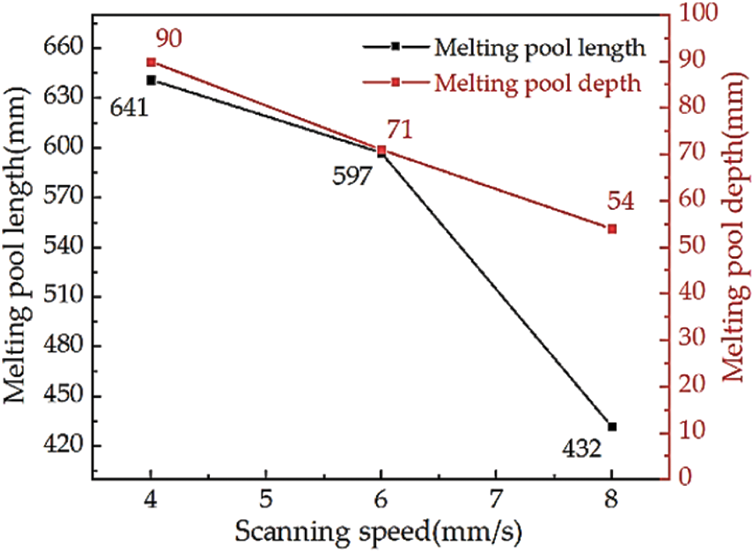
Figure 9: Pool size of different scanning methods
Through the above analysis, the larger the laser power, the larger the weld pool size and temperature peak, and the laser power have a greater influence on the weld pool structure than the scanning speed.
3.3 Effect of Laser Power, Scanning Speed, and Scanning Mode on Deformation
Fig. 10 is the deformation under different laser power. With the increase of laser power, the deformation increases first and then decreases. This is because when the laser power increases from 600 W to 800 W, the processing temperature is increased, resulting in the thermal expansion of the material. Then the stress generated during this process will be compressed during cooling, so the residual stress becomes larger and the deformation becomes larger and larger. When the laser power increases from 800 W to 1000 W, due to the increase of laser power, the laser energy is not all used to melt the powder, and part of the energy is transferred to heat, which reduces the temperature gradient so that the residual stress becomes smaller and the deformation is reduced.
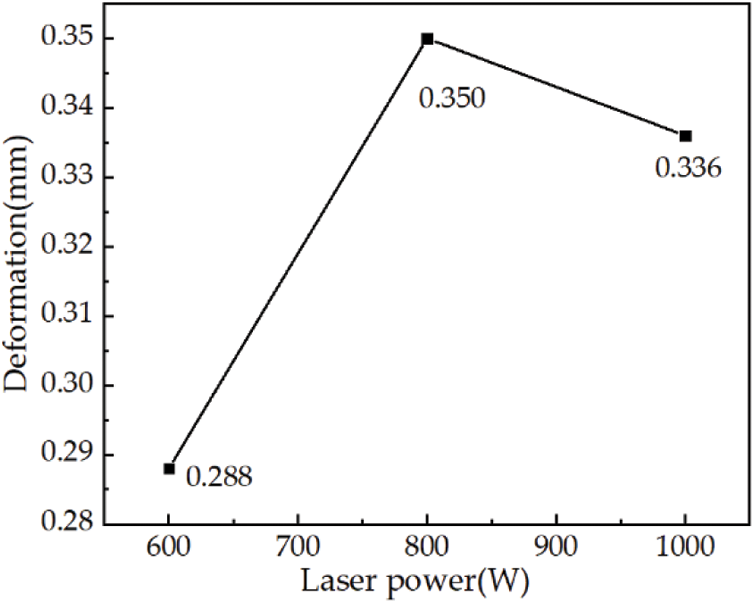
Figure 10: Deformation of different laser powers
Fig. 11 is the deformation under different scanning speeds. With the increase of scanning speed, the deformation decreases gradually. Due to the decrease of scanning speed, the time of additive manufacturing is prolonged, and the contact time between the high-energy laser beam and the powder and substrate is increased, that is, the utilization rate of laser energy is increased, the heat input is increased, and the deformation is increased.
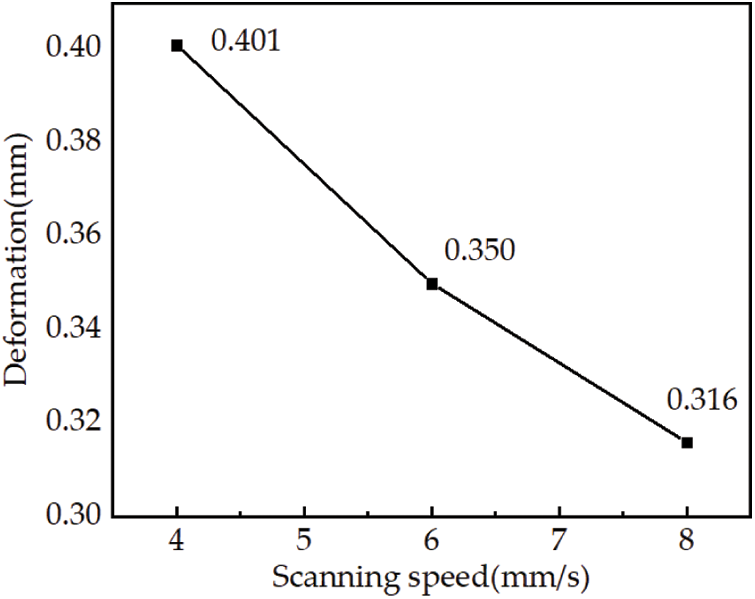
Figure 11: Deformation at different scanning speeds
Fig. 12 shows the maximum deformation position and the maximum deformation angle. Fig. 13 shows the maximum deformation angle under different laser power and scanning speed. With the increase of laser power from 600 W to 1000 W, the deformation trend of the forming layer to the center of the ring also gradually increases. With the decrease of scanning speed, the deformation trend of forming layer to the center gradually increases. The stress distribution is dominated by Y direction, the outside is tensile stress, and the inside is compressive stress, which can cause the trend of centripetal deformation.
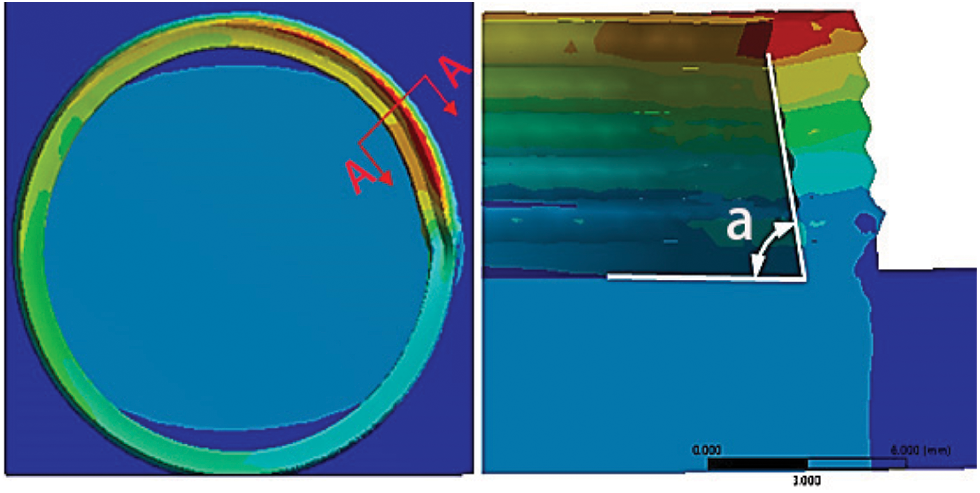
Figure 12: Maximum deformation position and deformation angle position
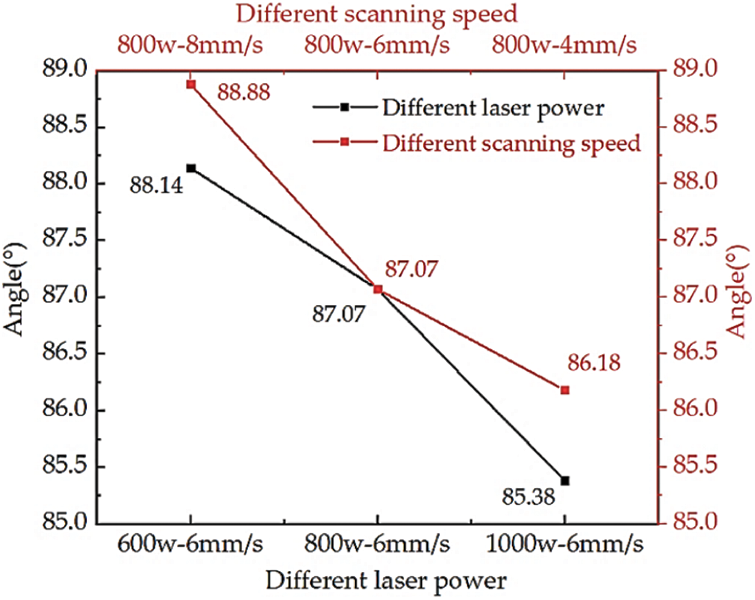
Figure 13: Angle of maximum deformation
Fig. 14 shows the deformation cloud map of different scanning methods. When the laser power and scanning speed are fixed, the deformation increases or decreases with different scanning methods. The minimum deformation is 0.141 mm with normal scanning, and the maximum deformation is located at the bottom of the ring. When alternating scanning is adopted, the deformation increases to 0.212 mm, and the maximum deformation is located at the bottom of the ring. However, the deformation decreases to 0.176 mm when periodic scanning is adopted, and the maximum deformation is located at the top of the ring. Therefore, it is better to choose the normal scanning method from the perspective of deformation.
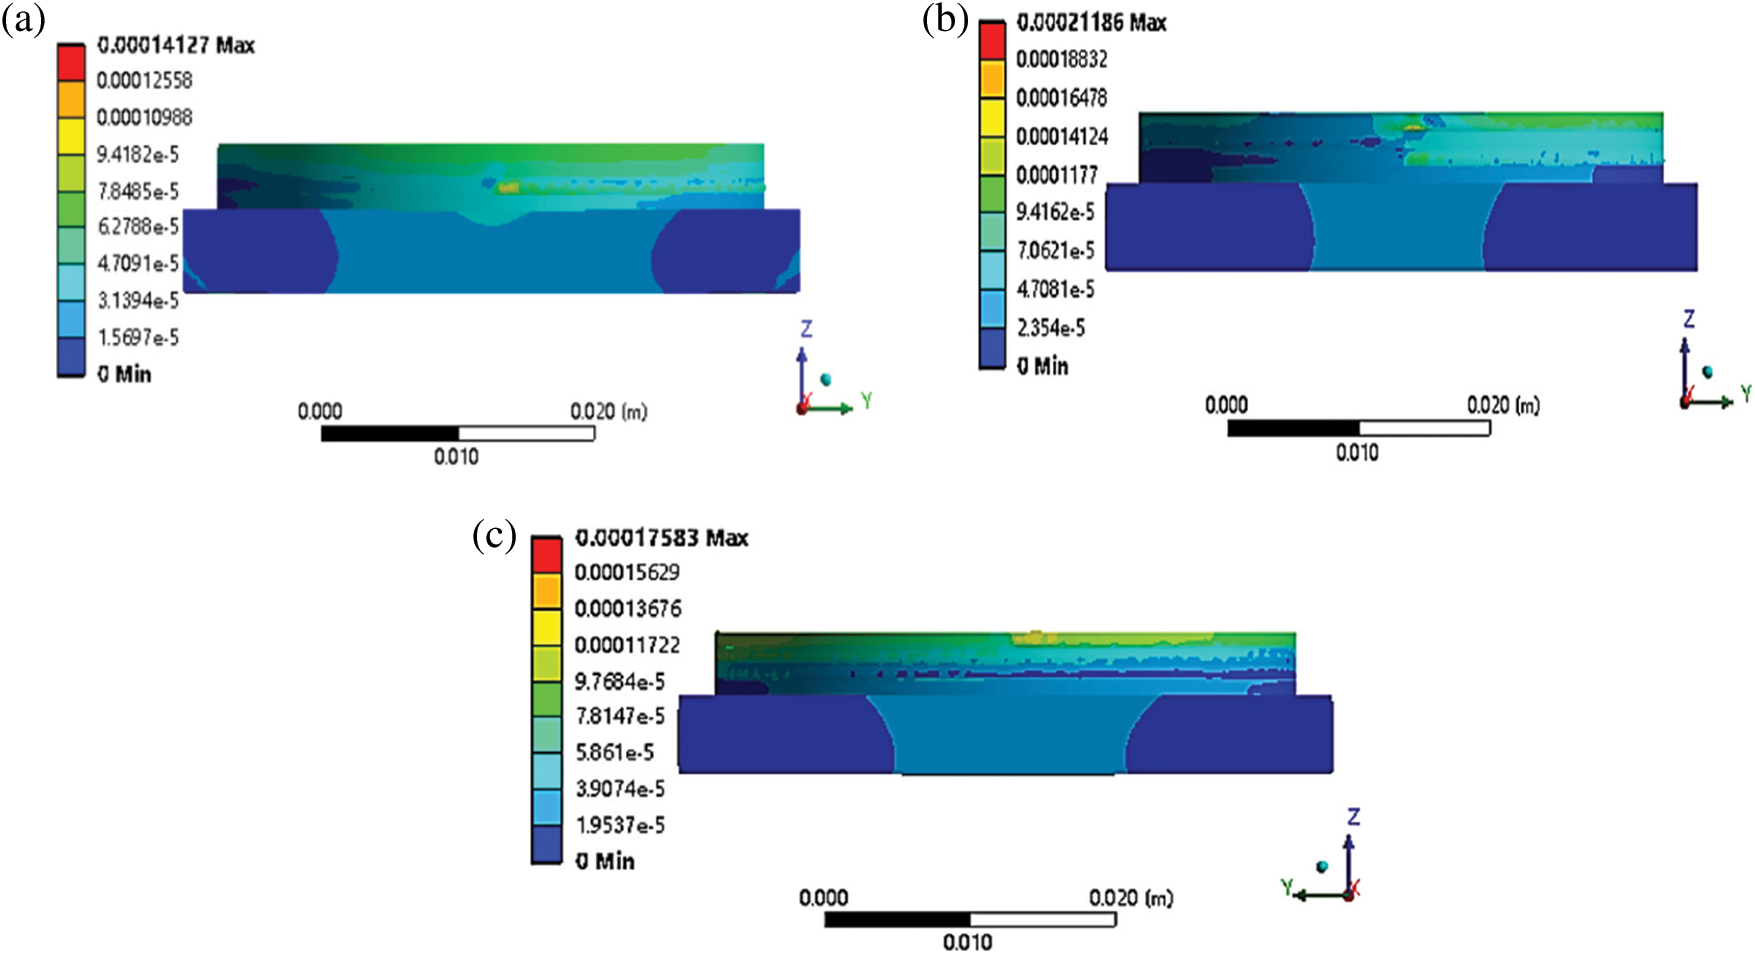
Figure 14: Deformation cloud map of different scanning methods: (a) normal scanning; (b) alternating scanning; (c) periodic scanning
Through the above analysis, no matter increasing the laser power, reducing the scanning speed, or changing the scanning mode, the maximum deformation of the specimen is located near the overlap position of the starting point and the endpoint of the forming. This is because when the specimen is initially formed, the scanning speed gradually increases from 0 to the set parameter so that the height of the forming layer near the starting point is relatively high. As the forming process proceeds, each layer is affected by the starting position of the first layer, so the maximum deformation is located near the overlap position of the starting point and the endpoint.
3.4 Effect of Laser Power, Scanning Speed, and Scanning Mode on Residual Stress
Fig. 15a shows the variation of residual stress with time under the condition of changing the laser power when the scanning speed is fixed at V = 6 mm/s. The residual stress curves of laser power P = 600 W, 800 W, and 1000 W have the same distribution trend, showing a trend of increasing at the initial stage, then decreasing, and finally tending to be stable at the cooling stage. Fig. 15b shows the residual stresses of the samples at t = 0 s~120 s under different laser powers. It can be seen from the figure that the residual stresses of the six forming layers change obviously. When the laser power P = 1000 W, the stress increases significantly in the second band, and the distribution trends of the stress bands are roughly the same.
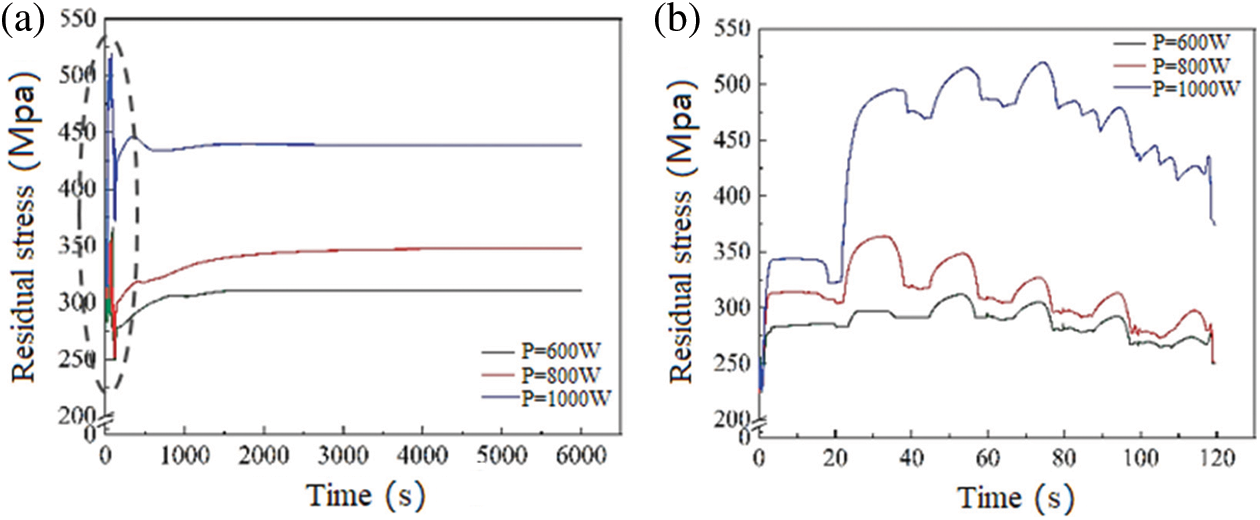
Figure 15: Changes of residual stresses with time under different laser powers: (a) residual stress change after cooling; (b) residual stress variation in the first 120 s
Fig. 16a shows the residual stress curve at the midpoint of the formed third layer with time for different laser powers. It is observed that when cooling to room temperature, the laser power P = 800 W has the highest stress, followed by P = 600 W and P = 1000 W has the lowest stress. This is because the increase of laser power will lead to the increase of heat input per unit time, making the temperature peak larger, but the relative temperature gradient will become smaller, and the stress will become smaller accordingly. In the band t = 50 s~70 s, the residual stress at laser power P = 1000 W is much larger than the remaining two.
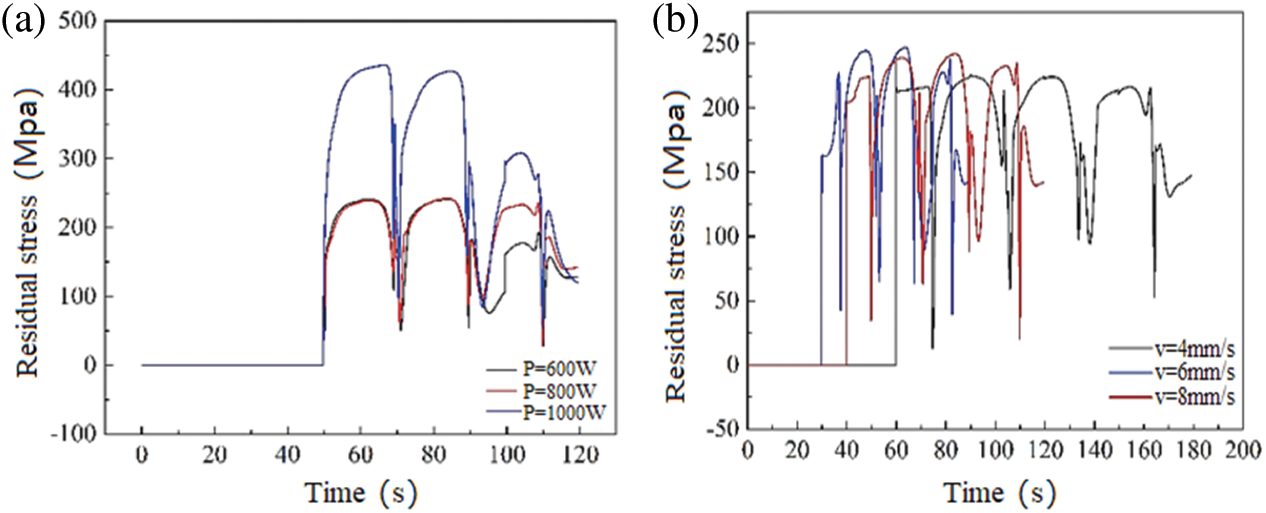
Figure 16: Changes of residual stress with time in the first 120 s: (a) Different laser power residual stress changes; (b) Residual stress changes at different scanning speeds
To investigate the correlation between the scanning speed and the residual stress, the variation of the residual stress at the midpoint of the formed third layer was obtained for scanning speeds of 4 mm/s, 6 mm/s, and 8 mm/s, respectively, as shown in Fig. 16b. Although the scanning speeds were different, the stress curve distribution trends were the same. The overall residual stress decreases with increasing scan speed. As the scanning speed increases, the laser beam action time becomes shorter, the overall heat absorbed by the substrate decreases, and the temperature decreases, resulting in a decrease in the final temperature difference, so the residual stress decreases with the increase in the scanning speed.
Fig. 17 shows the stress of the middle node of the second layer in three different scanning methods: normal scanning, alternate scanning, and periodic scanning. It can be seen from Fig. 17a that after cooling to room temperature, the periodic scanning method has the minimum stress, and the normal scanning method has the maximum stress. According to Fig. 17b, it can be seen that the stress distribution of the specimens prepared by three different scanning methods is completely different at this node, and the stress distribution of alternating scanning and periodic scanning is relatively flat and uniform of normal scanning.
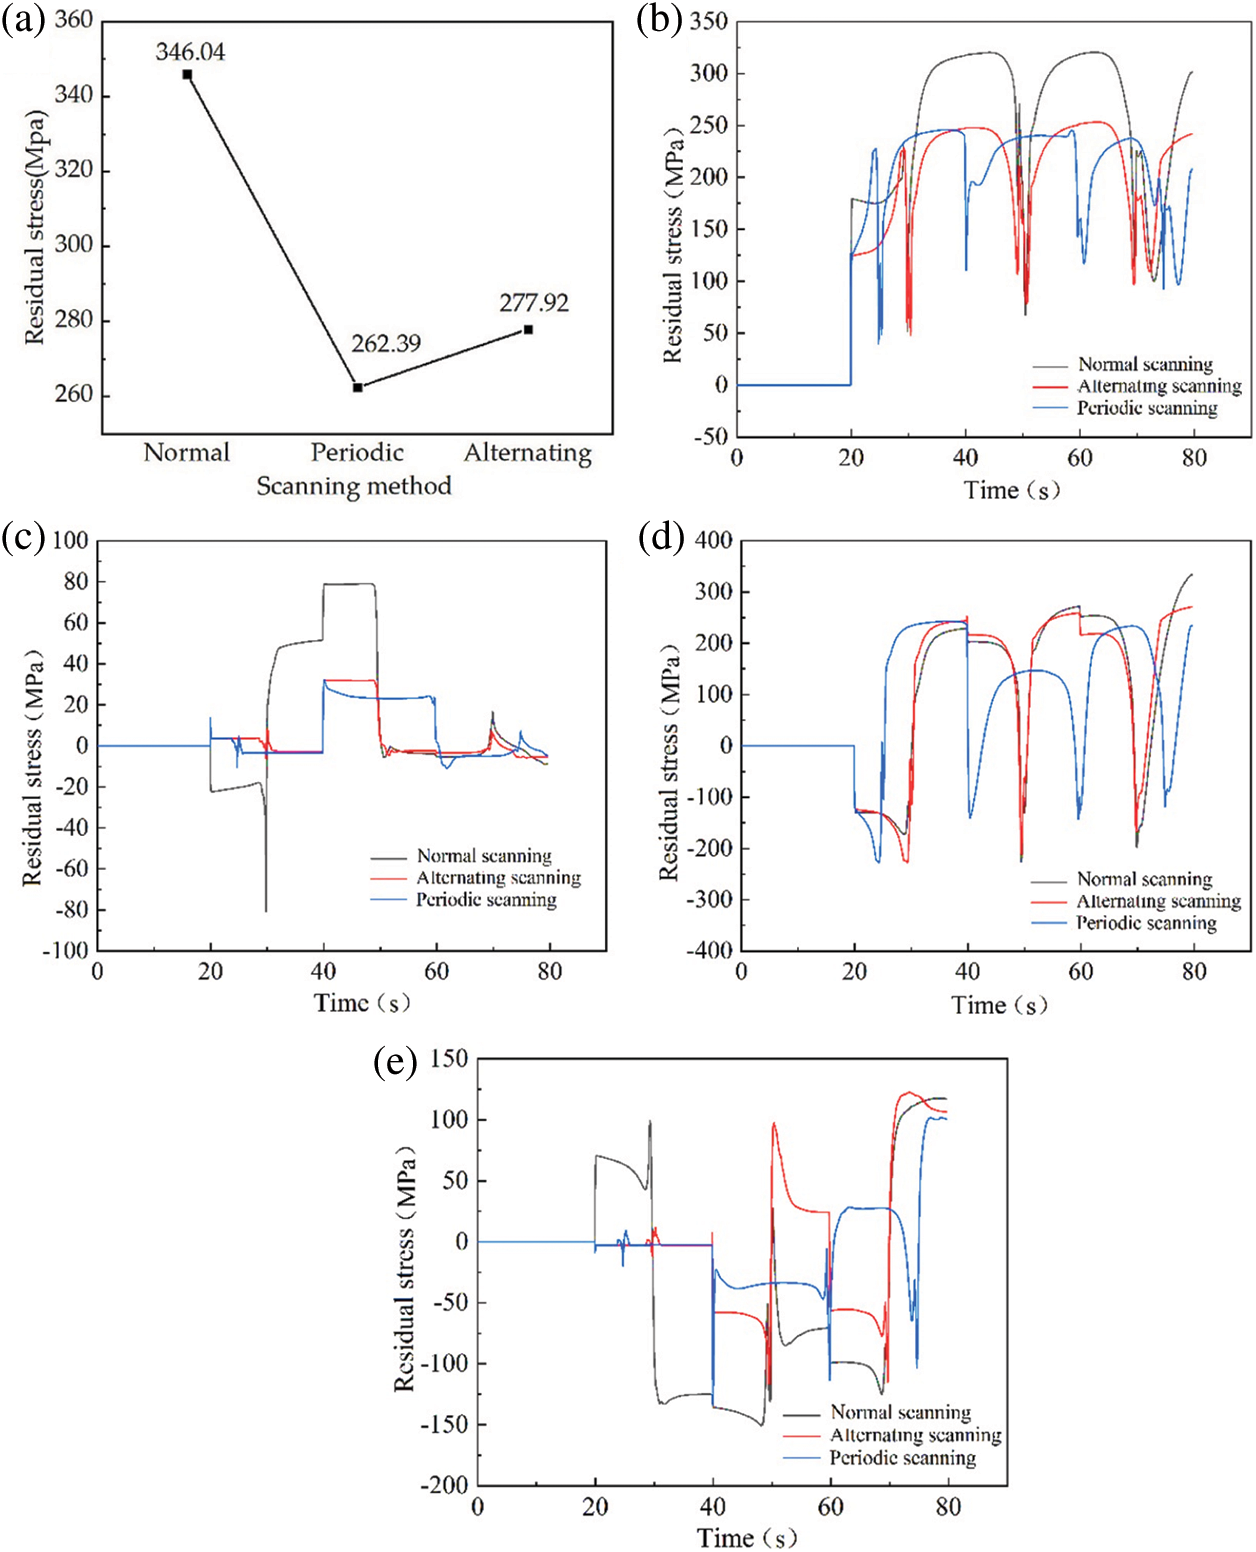
Figure 17: Change of residual stress with time in different scanning modes: (a) maximum residual stress; (b) residual stress changes in the first 120 s; (c) stress in the X direction; (d) stress in Y direction; (e) stress in the Z direction
Figs. 17c–17e show the stress changes in the X, Y, and Z directions with different scanning methods. It can be seen from the figure that the stress in the X direction, the normal scan is much higher than the other two scan methods. Fig. 17d shows that the stress distribution trends of these three different scanning methods in the Y direction are very similar, and there is no significant difference in the peak value.
In the Z direction, as shown in Fig. 17e, the stress fluctuations of the three are large, but the peak difference is not large. This is because compared with alternate scanning and periodic scanning, the end-point and starting point of normal scanning are separated by a long time, the temperature gradient is large, and the material shrinkage is greatly inhibited increasing residual stress.
4 Experimental Scheme and Analysis of Results
The influence mechanism of key parameters has been obtained through the above simulation research: the influence of laser power on the temperature distribution and the size of the molten pool is much greater than that of scanning speed and scanning mode. The peak temperature, the size of the molten pool, deformation, and residual stress increase with the increase of laser power, and increase with the decrease of scanning speed. The scanning mode has no obvious effect on temperature distribution, deformation, and residual stress. To verify the correctness of the simulation and the selection of the optimal parameters, it is necessary to compare the simulation results with the experimental data, so the thin-walled ring parts forming experiment is carried out.
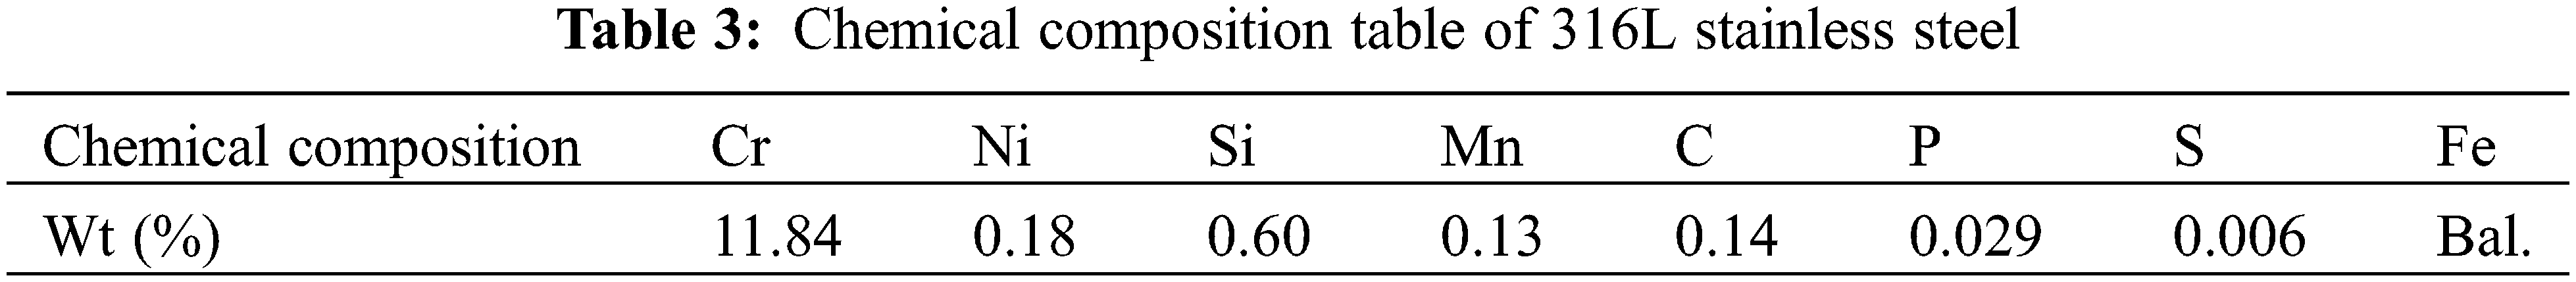
The chemical composition of 316L stainless steel powder is shown in Table 3.
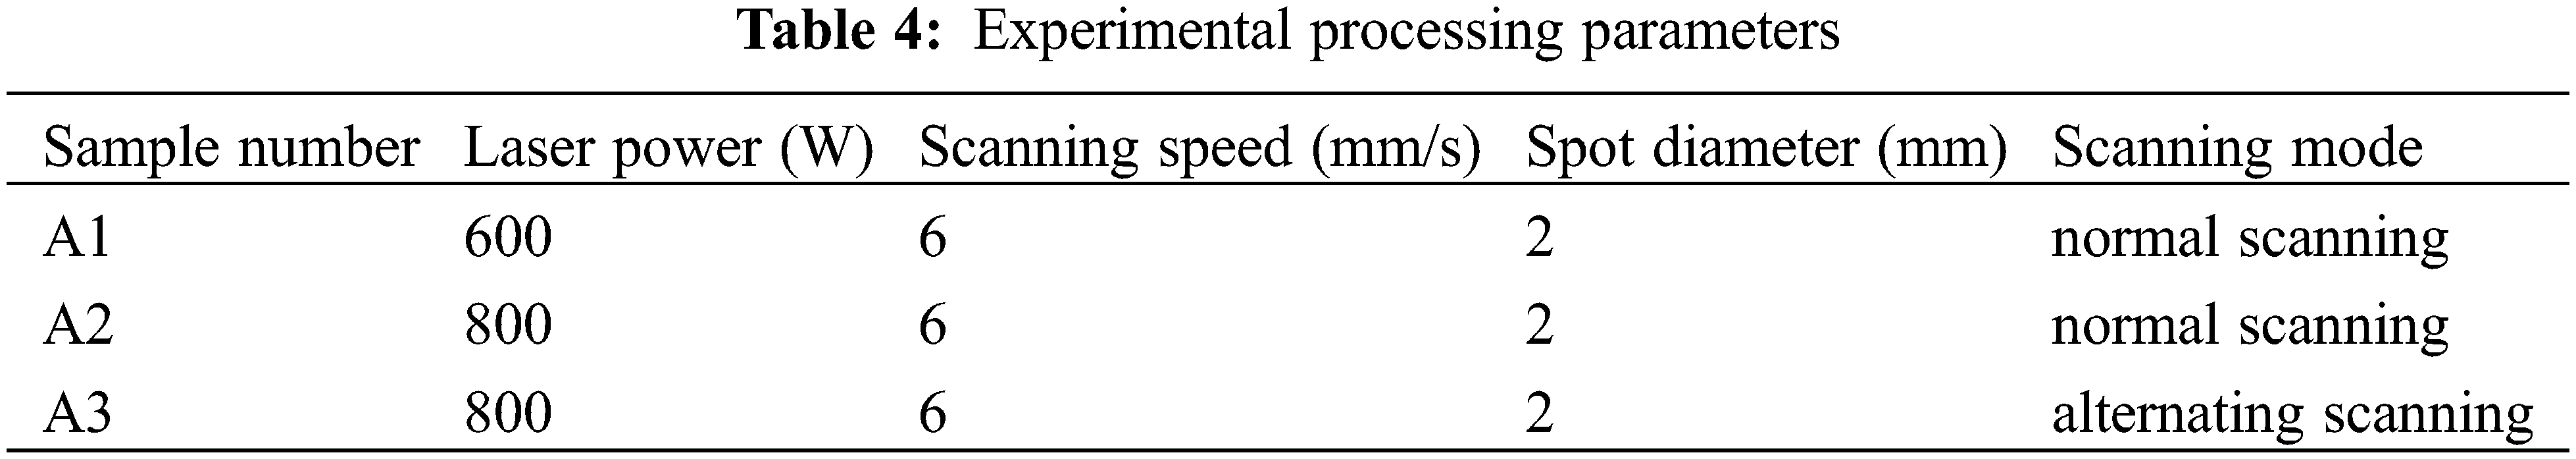
The experiments of cycle scan were abandoned because of their poor forming quality during the preparation of cycle scan specimens. The processing experiments were carried out according to some of the process parameters used in the simulation and the optimized parameters, which are shown in Table 4, and the prepared specimens were analyzed for macroscopic morphology and metallographic organization.
4.2 Macroscopic Morphological Analysis
Fig. 18a for laser power P = 600 W, scanning speed V = 6 mm/s, sample A1 prepared by normal scanning method, can be seen that the edge is uneven, there are some deformations, and the outer wall of the sample has more tumor. Fig. 18b shows sample A2 prepared by normal scanning method with laser power P = 800 W and v = 6 mm/s. The edge of sample A2 is relatively smooth and neat, and the boundary between layers is clear. The thickness of the layer is almost the same, and there is no obvious defect. Fig. 18c shows the sample A3 prepared by the alternate scanning method with laser power P = 800 W and V = 6 mm/s. It can be seen that the edge is smooth and flat, but the boundary between layers is not clear and the thickness of layers is different.
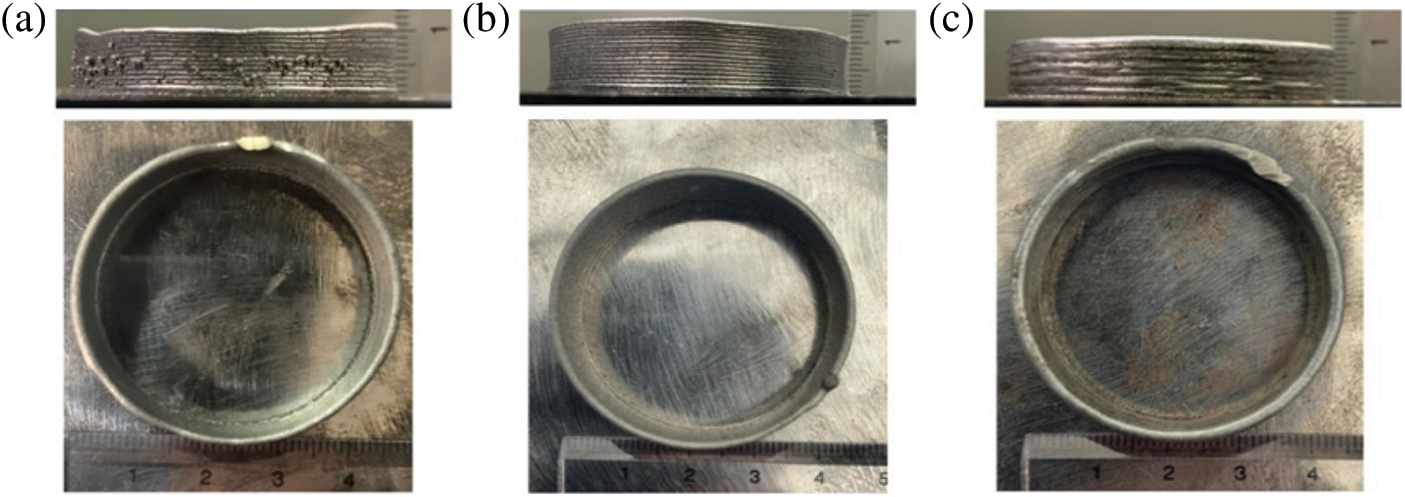
Figure 18: Experimental results of specimens A1, A2, and A3: (a) macroscopic shape of A1; (b) macroscopic shape of A2; (c) macroscopic shape of A3
4.2.1 Analysis of the Phenomenon of “Sticky Powder Spheroidization”
As shown in Fig. 19a, sample A1 has the phenomenon of “sticking powder spheroidization”. This is because the laser power used for preparing this sample is P = 600 W, and the low power makes the heat input of the forming layer low, resulting in insufficient melting of the powder in the process of LAM thin-walled ring parts. Insufficient melting will lead to the adhesion of the powder. As the forming process proceeds, the more unmelted powder is. Similarly, the lower laser energy utilization rate of powder leads to the higher utilization rate of the substrate and the formed thin-walled structure. The temperature of the thin-walled structure increases gradually, and the powder adhesion becomes more serious, thus reducing the surface roughness and forming accuracy of the thin-walled ring parts.
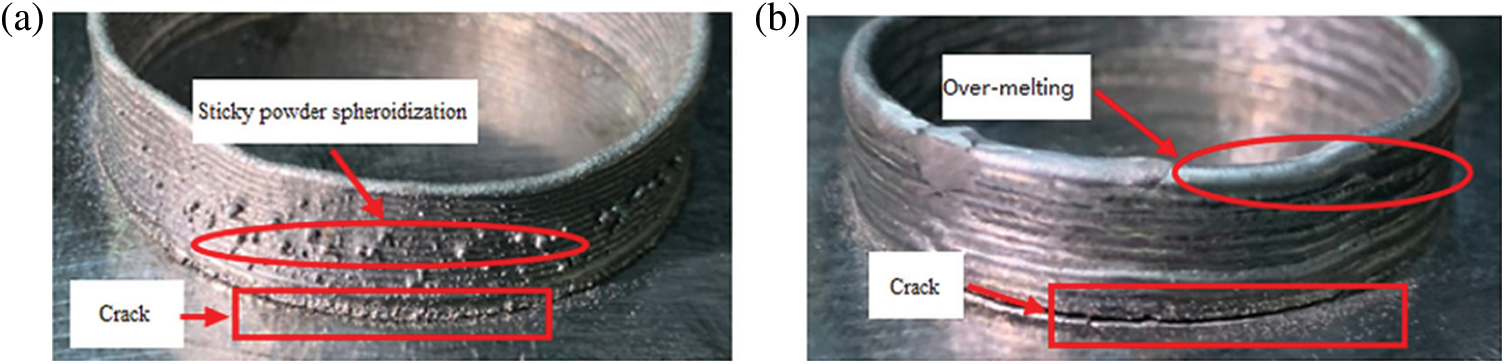
Figure 19: Forming defects of thin-walled ring parts: (a) sample A1 defects; (b) sample A3 defects
4.2.2 Over-Melting, Cracking Defect Analysis
Fig. 19b shows the over-melting and crack defects of sample A3 after static cooling to room temperature. This is because when the scanning mode is set to alternate scanning, the high-energy laser beam scans in the opposite direction at the end of the former layer. The former layer has just been formed and the heat has not been completely dispersed. Then the end of the former layer is the starting point of the latter layer for scanning. The upper part of the former layer is again irradiated by the high-energy laser beam. The heat input increases and the temperature rises sharply, which greatly exceeds the melting point of the powder material, making the over-melting phenomenon occur in the former layer and the latter layer.
4.3 Analysis of Metallographic Results
The cross-section of thin-walled ring parts is shown in Fig. 19. It can be seen from the figure that the clear boundary between the forming layer and the layer is closely combined. In Fig. 20a, it can be seen that there are obvious cracks at the junction of the forming layer and the substrate, and the upper layer is accompanied by the tumor. In Fig. 20b, the sample is prepared by using the optimized process parameters. It can be seen that the forming layer is closely combined with the substrate, without obvious defects, and the thickness and width of the layer are uniforms. Fig. 20c is a cross-sectional view of sample A3, which is prepared by alternate scanning with laser power P = 800 W, V = 6 mm/s, and the thickness and width of the layer were not uniform.
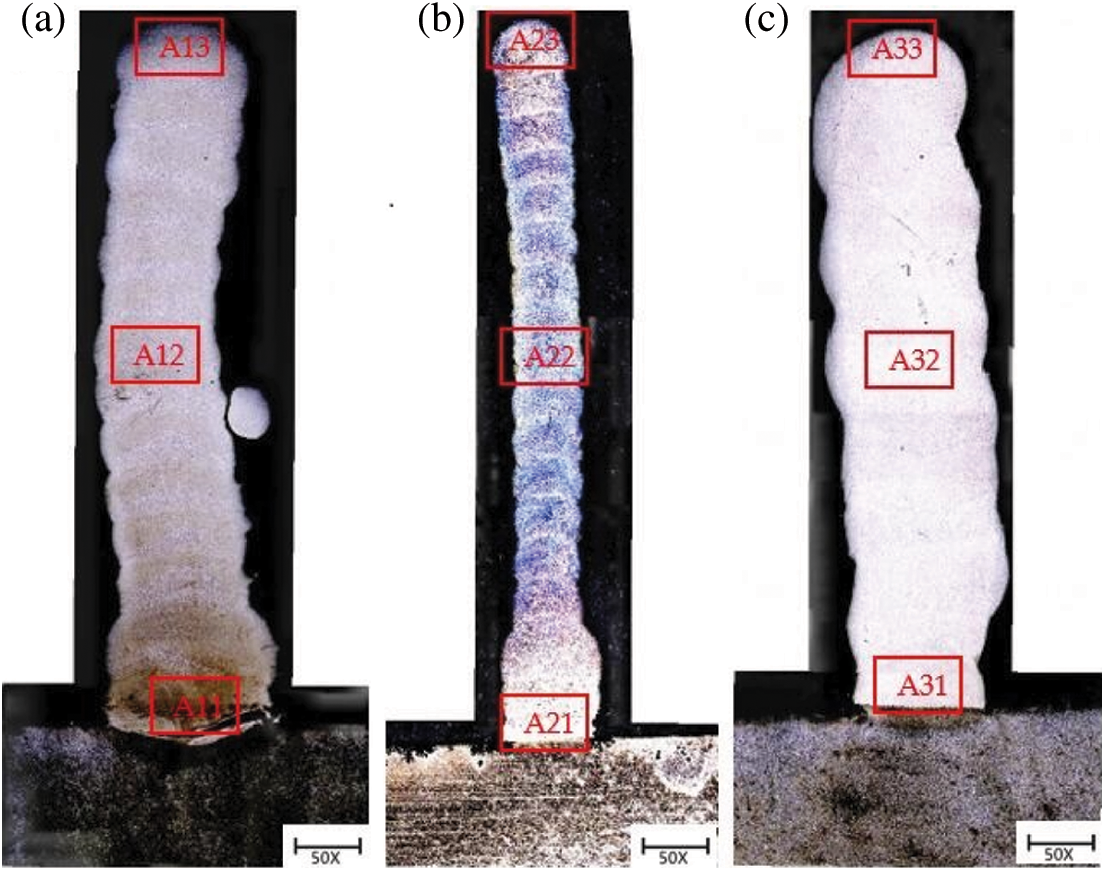
Figure 20: Cross-section of thin-walled ring parts: (a) sample A1; (b) sample A2; (c) sample A3
From Fig. 20, it can also be found that (a), (b) the width of the forming layer near the substrate is larger, and the width of the upper layer is smaller and relatively uniform, while (c) the sample is opposite, showing the bottom layer width is small, and the upper layer width is large and uniform. This is because (a), (b) sample in the initial processing, the scanning speed is gradually increased from 0 mm/s to 6 mm/s, the initial stage of scanning speed is slow, resulting in powder and laser at the bottom of the combination more, layer width becomes larger, then the scanning speed to maintain 6 mm/s uniform speed, layer width becomes smaller, the overall forming layer becomes uniform. Fig. 20c shows the opposite situation because when using alternate scanning mode, the starting point of the latter layer is close to the end of the previous layer, the overall temperature is high, the temperature gradient is large, and the over-melting phenomenon occurs, which makes the upper layer width larger.
The SEM images of the joint between the forming layer and the substrate of three samples with different parameters are shown in Fig. 21. This area formed by the fusion and diffusion between the powder material and the substrate, and the following is mostly planar crystal. This is mainly because the temperature of the substrate is almost the same as the ambient temperature in the initial stage of forming thin-walled circular parts, while the temperature of the molten pool is relatively high. A large temperature gradient is formed between the substrate and the molten pool, and it is not easy to appear a constitutional supercooling zone, which is conducive to the growth of planar crystals. Most of the above are epitaxially grown columnar crystals, and there are cellular crystals around them. This is because the thin-walled ring parts are stacked layer by layer from the bottom during the forming process. The closer to the high-energy laser beam, the higher the temperature, that is, the temperature gradient in the Z direction is the largest. Therefore, the grain growth rate in the Z direction is greater than that in other directions. Therefore, the columnar crystal exhibits epitaxial growth, which has obvious directivity and decreases along the direction of the temperature gradient. The lower columnar crystals are relatively coarse, while the upper columnar crystals are relatively small, mainly because the bottom is continuously heated, and the energy accumulated during the forming process promotes grain growth, resulting in coarse columnar crystals [37].
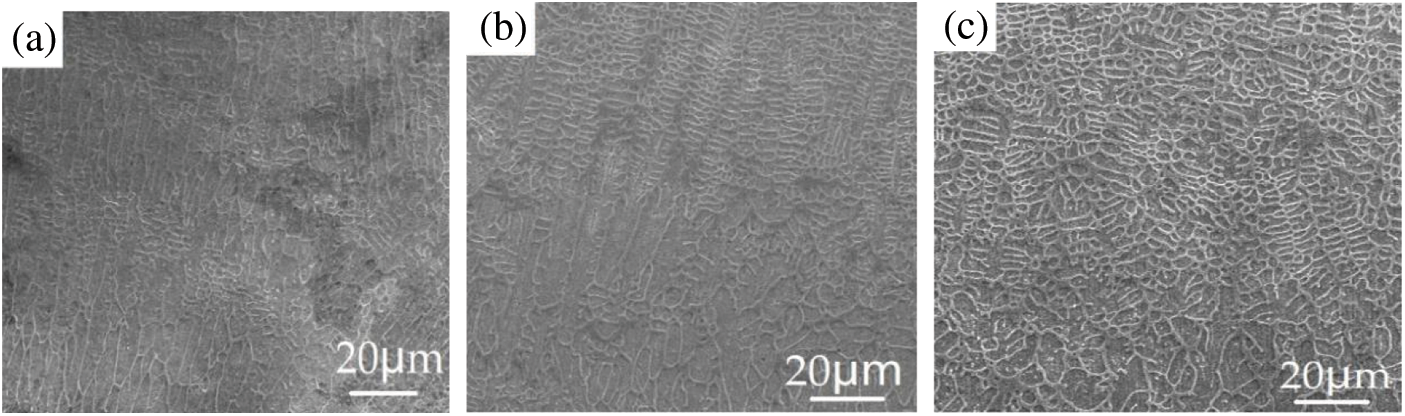
Figure 21: SEM chart of joint between forming layer and base material of thin-wall ring part: (a) sample A1; (b) sample A2; (c) sample A3
The thin-walled ring part layer structure SEM diagram is shown in Fig. 22. The microstructure of the junction between the layer and the interlayer is dense, and the grains are uniform and fine. The interlayer structure is filled with columnar crystals and cellular crystals. Since the heat dissipation is fast and the temperature gradient is large perpendicular to the substrate direction, the grains grown perpendicular to the substrate direction grow preferentially, and the growth direction is shown in Fig. 22.
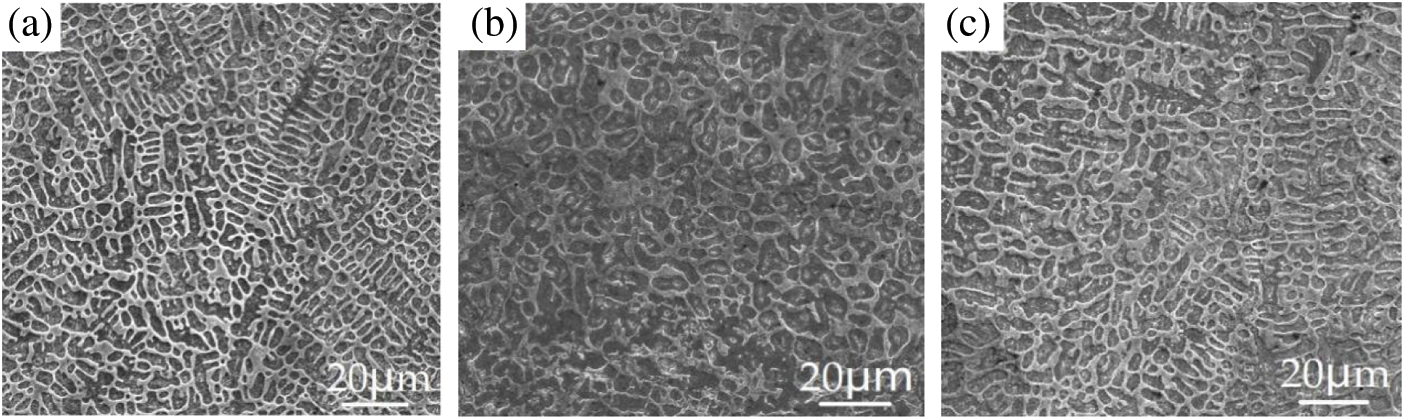
Figure 22: SEM chart of thin-walled ring parts interlayer: (a) sample A1; (b) sample A2; (c) sample A3
The top SEM image of the thin-walled ring parts is shown in Fig. 23. The middle area still has columnar crystals and cellular crystals coexisting, and the area near the top layer is equiaxed crystals. This is because the LAM process is very cold and hot, and the area near the top layer dissipates heat and cools quickly. The finer the equiaxed crystal structure, the better the mechanical properties of thin-walled parts.
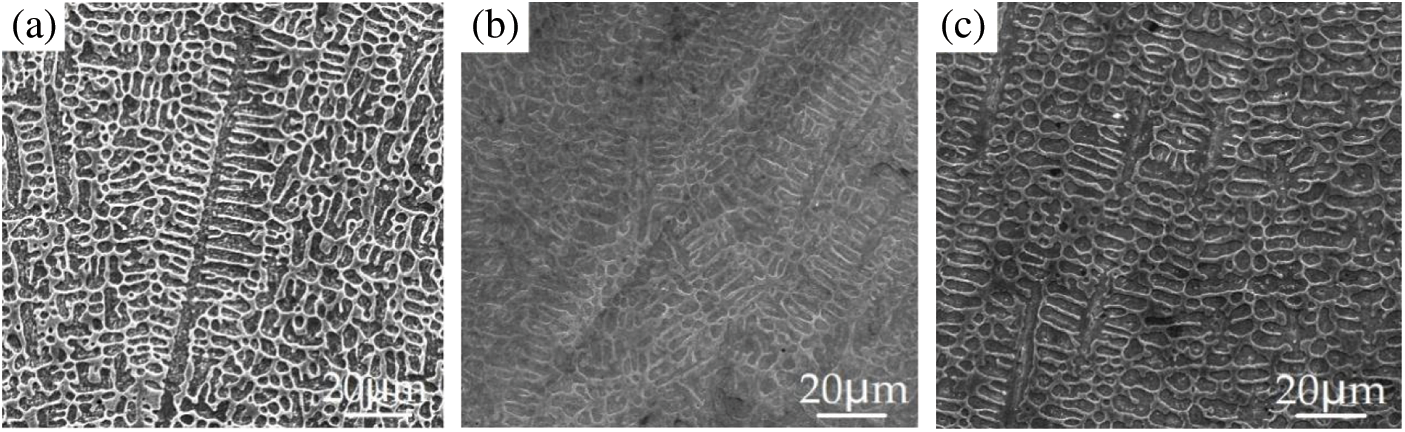
Figure 23: SEM chart of thin-walled ring parts top: (a) sample A1; (b) sample A2; (c) sample A3
4.4 Selection of Optimal Process Parameters
In the process of thin-walled ring parts forming, according to the simulation analysis results and experimental results, the defects such as over-melting and crack appeared in the sample with alternate scanning, while the sample prepared by normal scanning had good forming quality and no obvious defects. Combined with finite element simulation analysis, the optimal parameters were obtained as follows: laser power P = 800 W, scanning speed V = 6 mm/s, and scanning mode was normal scanning.
In this paper, the LAM process of thin-walled circular parts of 316L stainless steel was simulated, and the effects of different process parameters on the temperature field and stress field were analyzed. The 316L stainless steel thin-walled ring parts were prepared through experiments, and their macro morphology and microstructure were observed. The optimal process parameters were selected according to the simulation results. The main conclusions are as follows:
1. With increasing laser power, the temperature peak and melt pool size become larger. And with decreasing scanning speed, the melt pool temperature peak and size also become larger, but changing the scanning mode has little effect on its temperature distribution. During the simulation of the stress field, the maximum residual stress and deformation of forming layer increase with the increase of laser power only when the laser power is changed; when the laser power is kept constant, the decrease of scanning speed also leads to the increase of maximum residual stress and deformation. The maximum residual stress and the maximum deformation with the three different scanning methods are not very different. The residual stress is the largest during normal scanning, and the residual stress is the largest during periodic scanning; the deformation is the largest during alternating scanning, and the deformation is the smallest during normal scanning.
2. 316L stainless steel thin-walled ring parts were prepared by three different parameters, and their macroscopic morphology and microstructure were observed. When the laser power P = 600W, scanning speed V = 6 mm/s, the outer wall surface of the sample appears “sticky powder spheroidization” of the tumor, and cracks appear at the junction of the forming layer and the substrate. Laser power P = 800 W, scanning speed V = 6 mm/s, the sample prepared by normal scanning method has a smooth surface, a clear boundary between layer and layer, smooth and no obvious defects; laser power P = 800 W, scanning speed V = 6 mm/s, the sample prepared by alternate scanning method appeared over-melting and cracks. The microstructure of the sample is mainly columnar crystals growing along the direction of the temperature gradient, surrounded by cellular crystals, columnar crystals are coarse near the substrate. Combined with the analysis of simulation and experimental results, the optimal process parameters are determined as laser power P = 800 W, scanning speed V = 6 mm/s, and scanning mode is normal scanning.
Acknowledgement: We thank the editors for their rigorous and efficient work, and we also thank the referees for their helpful comments.
Funding Statement: This research was funded by the National Natural Science Foundation of China (Grant Nos. 51975339 and 51605262); China Postdoctoral Science Foundation (Grant Nos. 2019T120602 and 2017M610439); Youth Innovation and Technology Support Program for University in Shandong Province (Grant No. 2019KJB003).
Conflicts of Interest: The authors declare that they have no conflicts of interest to report regarding the present study.
References
1. Lin, H. X., Wang, K., Ding, D. H., Liu, J., Yang, J. W. et al. (2020). Research progress on high entropy alloys by selective laser melting. Journal of Iron and Steel Research, 32(6), 437–451. DOI 10.13228/j.boyuan.issn1001-0963.20190276. [Google Scholar] [CrossRef]
2. Weng, F., Gao, S. M., Jiang, J. C., Wang, J. J., Guo, P. (2019). A novel strategy to fabricate thin 316L stainless steel rods by continuous directed energy deposition in Z direction. Additive, 27, 478–481. DOI 10.1016/j.addma.2019.03.024. [Google Scholar] [CrossRef]
3. Jiang, J. C., Weng, F., Gao, S. M., Stringer, J., Xu, X. et al. (2019). A support interface method for easy part removal in directed energy deposition. Manufacturing, 20, 30–33. DOI 10.1016/j.mfglet.2019.04.002. [Google Scholar] [CrossRef]
4. Azakli, Z., Gumruk, R. (2021). Particle erosion performance of additive manufactured 316L stainless steel materials. Tribology Letters, 69(4), 130. DOI 10.1007/s11249-021-01503-0. [Google Scholar] [CrossRef]
5. Lee, H., Lim, C. H. J., Low, M. J., Tham, N., Murukeshan, V. M. et al. (2017). Lasers in additive manufacturing: A review. International Journal of Precision Engineering and Manufacturing-Green Technology, 4(3), 307–322. DOI 10.1007/s40684-017-0037-7. [Google Scholar] [CrossRef]
6. Duan, C. H., Hao, X. J., Luo, X. P. (2018). Study on temperature field of selective laser melting 316L. Applied Laser, 38(5), 748–753. DOI 10.14128/j.cnki.al.20183805.748. [Google Scholar] [CrossRef]
7. Pham, M. S., Dovgyy, B., Hooper, P. A. (2017). Twinning induced plasticity in austenitic stainless steel 316L made by additive manufacturing. Materials Science and Engineering: A, 704, 102–111. DOI 10.1016/j.msea.2017.07.082. [Google Scholar] [CrossRef]
8. Obeidi, M. A., McCarthy, E., O’Connell, B., Ul Ahad, I., Brabazon, D. (2019). Laser polishing of additive manufactured 316L stainless steel synthesized by selective laser melting. Materials, 12(6), 991. DOI 10.3390/ma12060991. [Google Scholar] [CrossRef]
9. Guo, J., Wen, X. S., Zhao, Y. P., Xu, J., Zou, H. Z. (2014). The current status and forecast of Chinese ferroalloy industry technology. Ferro-Alloys, 45(2), 57–64. DOI 10.3969/j.issn.1001-1943.2014.02.013. [Google Scholar] [CrossRef]
10. Cui, G. D. (2018). Preparation and properties of micro-nano porous iron alloys (Master Thesis). Chengdu: Southwest Jiaotong University. [Google Scholar]
11. Shu, Z. F., Huang, C. P., Lin, X., Liu, F. C. (2019). Research progress and prospect of laser additive manufacturing of steel. Journal of Netshape Forming Engineering, 11(4), 81–88. DOI 10.3969/j.issn.1674-6457.2019.04.011. [Google Scholar] [CrossRef]
12. Moyle, M., Ledermueller, C., Zou, Z., Primig, S., Haghdadi, N. (2022). Multi-scale characterisation of microstructure and texture of 316L stainless steel manufactured by laser powder bed fusion. Materials Characterization, 184, 111663. DOI 10.1016/j.matchar.2021.111663. [Google Scholar] [CrossRef]
13. Gray, G. T.III, Livescu, V., Rigg, P. A., Trujillo, C. P., Cady, C. M. (2017). Structure/property (constitutive and spallation response) of additively manufactured 316L stainless steel. Acta Materialia, 138(42), 140–149. DOI 10.1016/j.actamat.2017.07.045. [Google Scholar] [CrossRef]
14. Afkhami, S., Dabiri, M., Piili, H., Bjork, T. (2021). Effects of manufacturing parameters and mechanical post-processing on stainless steel 316L processed by laser powder bed fusion. Materials Science and Engineering: A, 802, 140660. DOI 10.1016/j.msea.2020.140660. [Google Scholar] [CrossRef]
15. Liu, C. (2021). Mesoscopic-scale numerical investigation including the influence of process parameters on LPBF multi-layer multi-path formation. Computer Modeling in Engineering & Sciences, 126(1), 5–23. DOI 10.32604/cmes.2021.014693. [Google Scholar] [CrossRef]
16. Kluczyński, J., Śnieżek, L., Grzelak, K., Torzewski, J., Szachogluchowicz, I. et al. (2020). Crack growth behavior of additively manufactured 316L steel—influence of build orientation and heat treatment. Materials, 13(15), 3259. DOI 10.3390/ma13153259. [Google Scholar] [CrossRef]
17. Meier, H., Haberland, C. (2008). Experimental studies on selective laser melting of metallic parts. Materialwissenschaft und Werkstofftechnik, 39(9), 665–670. DOI 10.1002/mawe.200800327. [Google Scholar] [CrossRef]
18. Montuori, R. A. M., Figueira, G., Cataldi, T. P., Alcântara, N. G., Bolfarini, C. et al. (2020). Additive manufacturing of 316L stainless steel by selective laser melting. Soldagem & Inspecao, 25(4), e2530. DOI 10.1590/0104-9224/si25.30. [Google Scholar] [CrossRef]
19. Kim, K. T. (2022). Mechanical performance of additively manufactured austenitic 316L stainless steel. Nuclear Engineering and Technology, 54(1), 244–254. DOI 10.1016/j.net.2021.07.041. [Google Scholar] [CrossRef]
20. Bevan, M. A., Ameri, A. A. H., East, D., Austin, D. C., Brown, A. D. et al. (2017). Mechanical properties and behavior of additive manufactured stainless steel 316L. Characterization of Minerals, Metals and Materials, 2017, 577–583. DOI 10.1007/978-3-319-51382-9. [Google Scholar] [CrossRef]
21. Gençoğlu, U., Kaya, G., Ergüder, T. O., Hacisalihoglu, I., Yildiz, F. (2022). Investigation of the structural and tribological properties of 316L stainless steel manufactured using variable production parameters by selective laser melting. Journal of Materials Engineering and Performance, 56(1), 1–16. DOI 10.1007/s11665-021-06507-4. [Google Scholar] [CrossRef]
22. Evans, J. A., Anderson, S. A., Faierson, E. J., Perez-Nunez, D., McDeavitt, S. M. (2019). Anisotropic radiation-induced changes in Type 316L stainless steel rods built by laser additive manufacturing. Nuclear Technology, 205(4), 563–581. DOI 10.1080/00295450.2018.1502001. [Google Scholar] [CrossRef]
23. Badrossamay, M., Childs, T. H. C. (2007). Further studies in selective laser melting of stainless and tool steel powders. International Journal of Machine Tools and Manufacture, 47(5), 779–784. DOI 10.1016/j.ijmachtools.2006.09.013. [Google Scholar] [CrossRef]
24. Yang, Y. Y., Gong, Y. D., Qu, S. S., Cai, M. (2020). Experiment on the macro-morphology and residual stress of 316L by hybrid additive and subtractive manufacturing. Journal of Northeastern University (Natural Science), 41(3), 380–386. DOI 10.12068/j.issn.1005-3026.2020.03.014. [Google Scholar] [CrossRef]
25. Pragana, J. P. M., Pombinha, P., Duarte, V. R., Rodrigues, T. A., Oliveira, J. P. et al. (2020). Influence of processing parameters on the density of 316L stainless steel parts manufactured through laser powder bed fusion. Proceedings of the Institution of Mechanical Engineers, Part B: Journal of Engineering Manufacture, 234(9), 1246–1257. DOI 10.1177/0954405420911768. [Google Scholar] [CrossRef]
26. Larimian, T., Kannan, M., Grzesiak, D., AlMangour, B., Borkar, T. (2020). Effect of energy density and scanning strategy on densification, microstructure and mechanical properties of 316L stainless steel processed via selective laser melting. Materials Science & Engineering A, 770(5–8), 138455. DOI 10.1016/j.msea.2019.138455. [Google Scholar] [CrossRef]
27. Liu, Y., Yang, Y., Wang, D. (2016). A study on the residual stress during selective laser melting (SLM) of metallic powder. International Journal of Advanced Manufacturing Technology, 87(1), 647–656. DOI 10.1007/s00170-016-8466-y. [Google Scholar] [CrossRef]
28. Portella, Q., Chemkhi, M., Retraint, D. (2020). Influence of surface mechanical attrition treatment (SMAT) post-treatment on microstructural, mechanical and tensile behaviour of additive manufactured AISI 316L. Materials Characterization, 167(5), 110463. DOI 10.1016/j.matchar.2020.110463. [Google Scholar] [CrossRef]
29. Deng, D. W., Chang, Z. D., Ma, Y. B., Sun, Q., Ma, Y. S. et al. (2021). Influence of process parameters on microstructure and residual stress of 316L laser cladding layer. Applied Laser, 41(1), 83–88. DOI 10.14128/j.cnki.al.20214101.083. [Google Scholar] [CrossRef]
30. Fergani, O., Berto, F., Welo, T., Liang, S. Y. (2017). Analytical modelling of residual stress in additive manufacturing. Fatigue & Fracture of Engineering Materials & Structures, 40(6), 971–978. DOI 10.1111/ffe.12560. [Google Scholar] [CrossRef]
31. Ren, Z. H., Liu, Z., Zhou, S. H., Duan, J. X. (2020). Temperature field and stress field simulation of titanium alloy laser fuse additive manufacturing. Journal of Northeastern University (Natural Science), 41(4), 551–556. DOI 10.12068/j.issn.1005-3026.2020.04.017. [Google Scholar] [CrossRef]
32. Sun, B. Y., Zhang, Y. T., Huang, C. G. (2020). Machine learning-based seismic fragility analysis of large-scale steel buckling restrained brace frames. Computer Modeling in Engineering & Sciences, 125(2), 755–776. DOI 10.32604/cmes.2020.09632. [Google Scholar] [CrossRef]
33. Liu, D. S., Lü, Y. M., Zhou, W. J., Yang, H., Wang, K. (2019). Numerical simulation of temperature field in TIG Arc-additive manufacturing based on ANSYS. Laser & Optoelectronics Progress, 56(24), 181–187. DOI 10.3788/LOP56.241405. [Google Scholar] [CrossRef]
34. Deng, D., Murakawa, H. (2013). Influence of transformation-induced plasticity on simulated results of welding residual stress in low-temperature transformation steel. Computational Materials Science, 78(2), 55–62. DOI 10.1016/j.commatsci.2013.05.023. [Google Scholar] [CrossRef]
35. Zhong, R., Guo, S. Q., Zhang, W. Y., Li, B. H., Zhao, Z. J. et al. (2021). Numerical simulation of thermal-mechanical development in laser additive manufacturing of GH4169 alloy. Welding & Joining, 2021(3), 13–21+61–62. DOI 10.12073/j.hj.20201112001. [Google Scholar] [CrossRef]
36. Gong, C., Wang, L. F., Zhu, G. X., Song, T. L. (2018). Numerical simulation of residual stress in 316L stainless steel cladding layer by laser additive manufacturing. Applied Laser, 38(3), 402–408. DOI 10.14128/j.cnki.al.20183803.402. [Google Scholar] [CrossRef]
37. Zhang, K., Wang, S. J., Liu, W. J., Shang, X. F. (2014). Characterization of stainless steel parts by laser metal deposition shaping. Materials & Design, 55(2–3), 104–119. DOI 10.1016/j.matdes.2013.09.006. [Google Scholar] [CrossRef]
Cite This Article
 Copyright © 2023 The Author(s). Published by Tech Science Press.
This work is licensed under a Creative Commons Attribution 4.0 International License , which permits unrestricted use, distribution, and reproduction in any medium, provided the original work is properly cited.
 Downloads
 Citation Tools