
 Submit a Paper
 Propose a Special lssue
 Open Access
ARTICLE
Determination of the Postmortem Interval Using Fiber Bragg Grating Sensors
1 Radiation Physics Laboratory, Department of Physics, Faculty of Sciences, Badji Mokhtar University, Annaba, Algeria
2 Univesity of Picardie Jules Verne, LTI Laboratory, Aimens, France
* Corresponding Author: H. Derbal Habak. Email:
(This article belongs to the Special Issue: Materials and Energy an Updated Image for 2021)
Fluid Dynamics & Materials Processing 2023, 19(3), 831-844. https://doi.org/10.32604/fdmp.2022.022162
Received 23 February 2022; Accepted 24 April 2022; Issue published 29 September 2022
 View Full Text
 Download PDF
Abstract
Fiber Bragg grating (FBG) sensors are often used in monitoring activities and to ensure that environmental parameters satisfy industrial requirements. They offer crucial safety measures in the early detection of hazards due to their greatly reduced size, low weight, flexibility, and immunity to electromagnetic interference. These characteristics make FBGs suitable also for use in relation to the human body for in vivo measurements and long-term monitoring. In this study, recent developments are presented with regard to the utilization of these sensors to measure the so-called post-mortem interval (PMI). Such developments rely on numerical simulations based on the Matlab software and monitoring of the rectal temperature, which is one of the main parameters for estimating the PMI. First, the Matlab software is used to solve the Henssge equation for different ambient temperatures and for different body masses; then a Bragg grating sensors is used for post-mortem dating. The results and their accuracy are discussed.Keywords
The advent of fiber-optic communication has revolutionized nearly all aspects of communication technology, it is meant that there is a periodic change in the core’s refractive index. was noticed in germanium-doped fibers by Hill et al. [1]. However, a renewed interest has risen with the demonstration of the side writing technique by Meltz et al. [2] almost ten years later; optical fibers can change property when they are exposed to intense optical interferences patterns. This photosensitive effect can be used to induce periodic modulation in the refractive index along the fiber length. This periodicity produces an intra-core in the fiber Bragg grating (FBG). It is relevant to mention that the principal property of FBG is that they reflect light in a narrow bandwidth that is centered about the Bragg wavelength popularly known as photonic band gap (PBG). This property makes them the device of choice for various applications both in optical telecommunications networks and in the biomedical field [3–5].
In the last decade, Fiber Bragg Gratings (FBGs) have shown a great potential for applications in the field of medicine [6–10] due to their prominent advantages such as their small size, biocompatibility, chemical inertness, immunity to electromagnetic interference (EMI) and multiplexing capability [6]. These characteristics make them suitable for human body uses that adapt to the sensor material so that they can be used for in vivo measurement and can be left for long-term monitoring [6]. Grating based sensors are well known technology for structural health monitoring (SHM) in the area of civil and aerospace [11–15]; however, investigations for their use in the field of medicine are fairly recent. Presently, FBGs sensors are widely used for detecting various parameters such as strain, pressure, temperature, vibration, curvature and refractive index of the surrounding material even in high magnetic and electric field environments. They can serve as diagnostic purposes in diverse areas of health care such as biomechanics, cardiology, gynecology, very low temperature monitoring and immunosensing to name a few [6,7,9,16,17].
They also offer high-performance, in comparison to standard technologies like electrical strain gauge (ESG), piezoelectric, resistive or other solid-state sensing, either for measuring physical parameters or for performing high-sensitivity biochemical analysis. In view of these aspects, it can be predicted that this rapidly evolving technology can provide much better and effective solutions for various biomedical applications and be an integral part of the futuristic health care system. In this work, we present a study for post-mortem dating using a fiber Bragg grating sensors. Our method is based on a numerical simulation using the Matlab software, of the evolution of rectal temperature, which is one of the main parameters for estimating the post-mortem interval (PMI). It is interesting to note that the objective is the exact determination of the body temperature, which informs us about the time of death.
Determining the exact time of death is complex in that the process must take account many environmental, physical and biochemical factors that affect the body immediately after death. Various methods are used to estimate the time since death such as the entomological method [18–21] and thermometric method.
This latter dating method back to the mid-19th century, but the most important result of research in this area took place in the 20th century, when a nomogram reading the time of death was developed by Henssge in 1988 [21].
The Nomogram Method (Fig. 1) is based on a single measurement of the rectal temperature, but subject substantial errors that may result from individual characteristics, daytime temperature fluctuations, ambient conditions or differences in the depth at which the temperature is taken [22–24].
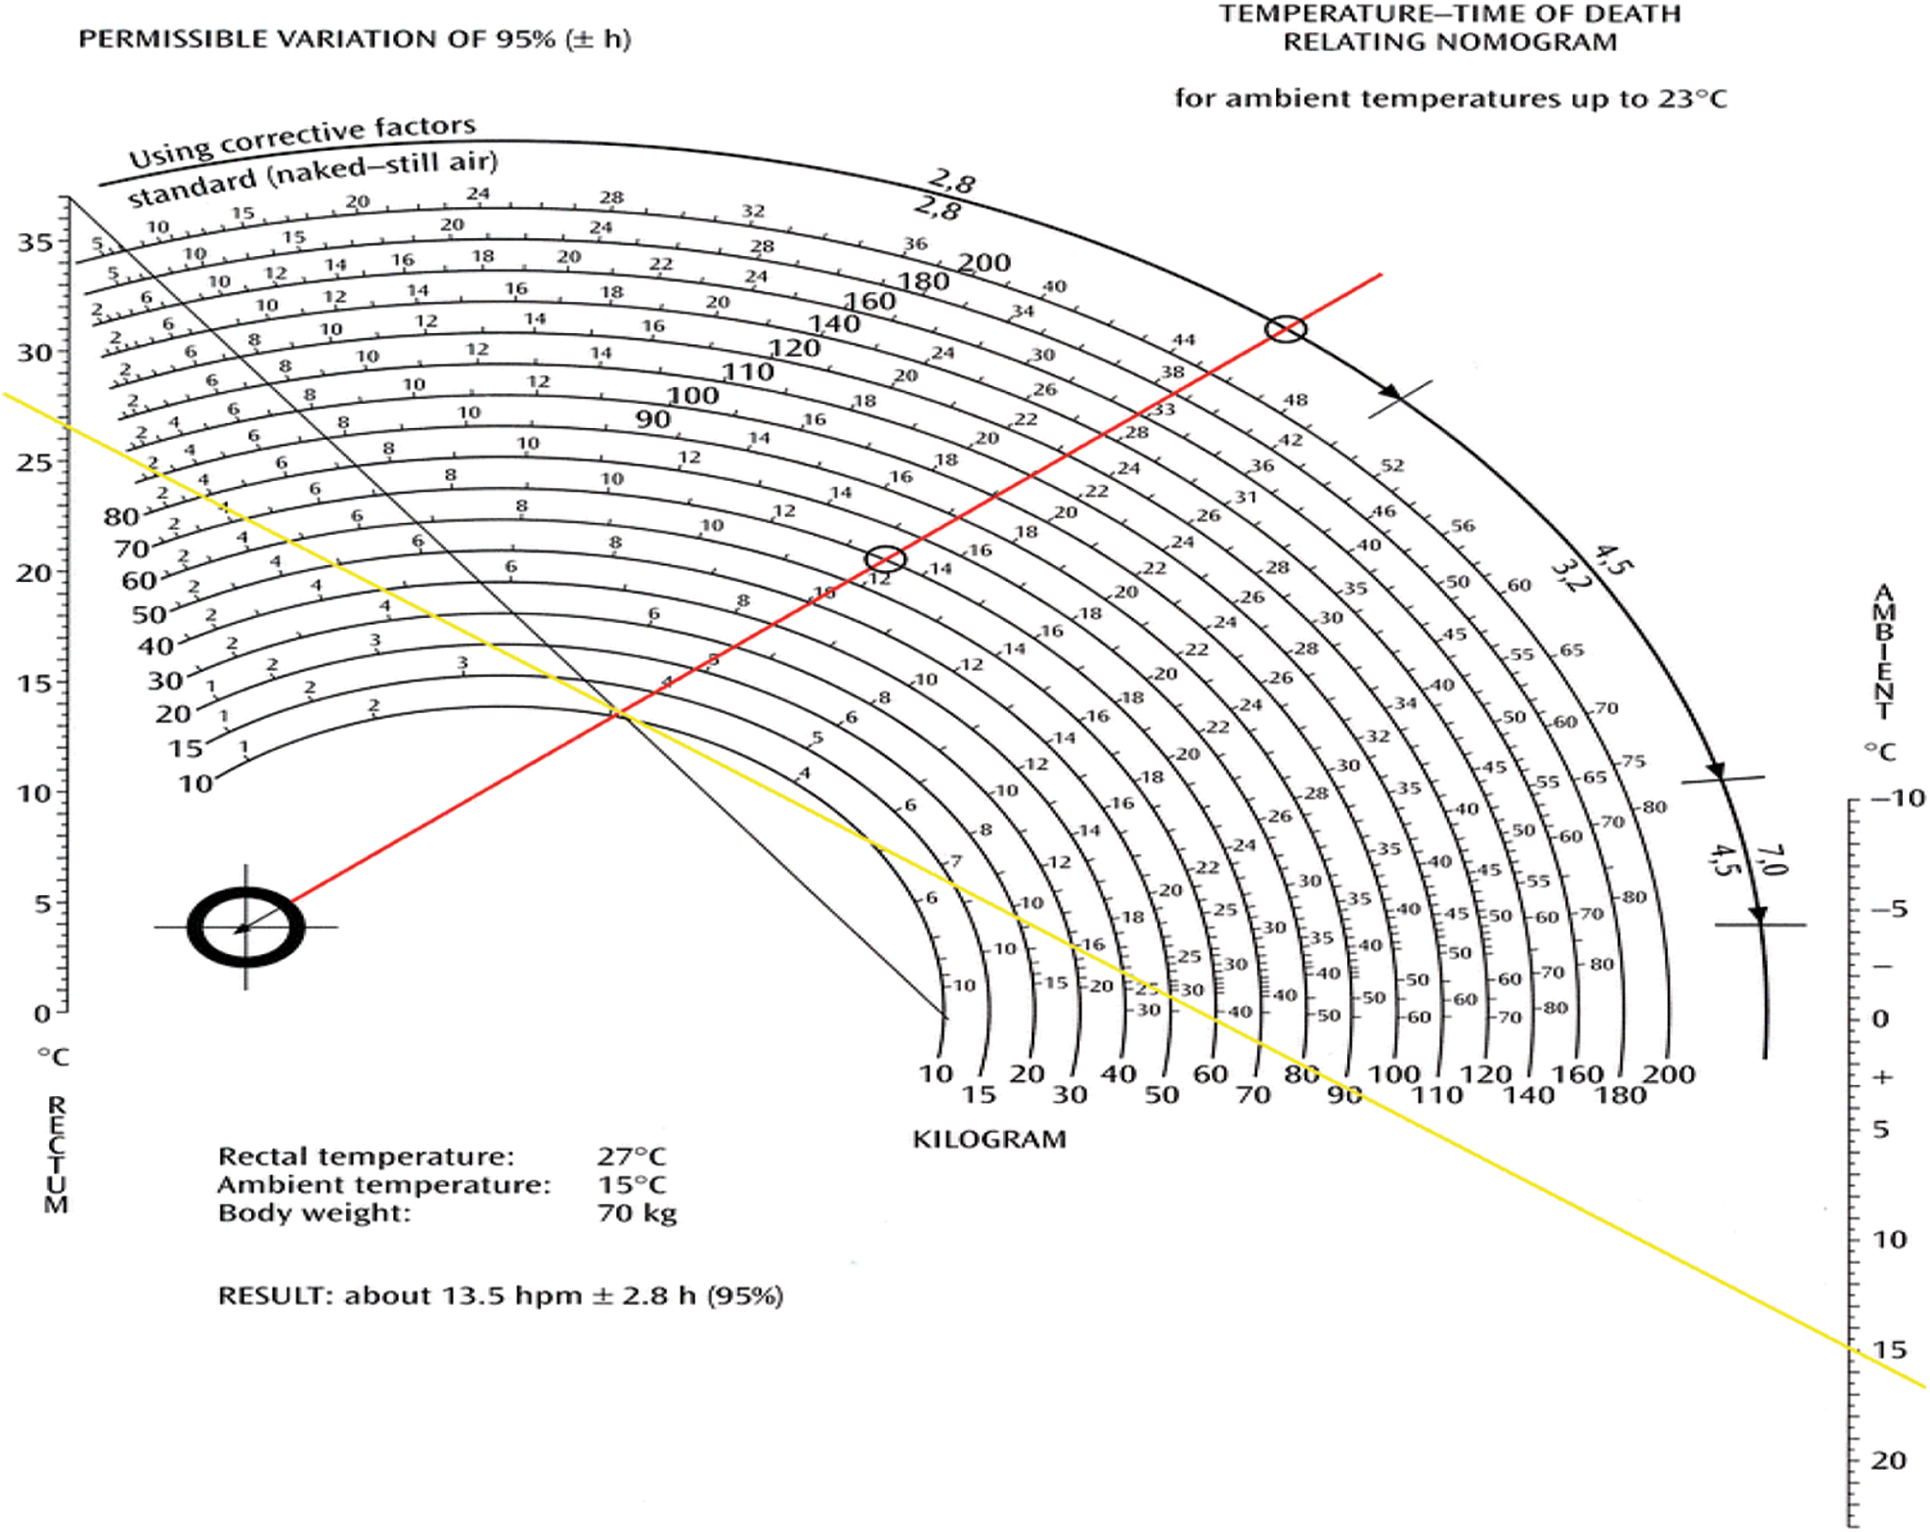
Figure 1: Application of the Nomogram-Method [22]
In response to these shortcomings, a model based on a heat flow modeling (principle of the elements finished) was proposed by Mall et al. [25,26], however, the level of accuracy of the model requires a perfect description of the environment of the body, especially regarding transfers energy by radiation, very difficult to obtain inconvenient.
Recently new promising approaches have been tested [19,27] although these methods are employed to delimitate the PMI in everyday forensic work, there are still great inaccuracies and limitations in many cases. Therefore, novel methods for time of death estimation that comply with the requirements of practice are still of high demand.
2.1 Theory of Post-Mortem Dating
In a significant work, Henssge [21] modeled a bi-exponential function, which varies according to the weight of the individual as Eq. (1)
where t represents the time of death and k is a parameter dependent on the individual’s M mass (kg) given by Eq. (2)
Claus Henssge has created an abacus system to determine, based on body temperature, ambient temperature and individual mass, the likely time of death [28].
2.2 Temperature Sensitivity of Fiber Bragg Grating
As well known, the Bragg wavelength,
For a temperature change of ΔT, the corresponding wavelength shift
The changes in the grating spacing and the index of refraction caused by thermal expansion result in a shift in the Bragg wavelength. This fractional wavelength shift for a temperature change ΔT may be written as [29]
where
We note that for the case of a silica fiber, the wavelength–temperature sensitivities of 800 and 1.55 nm FBGs have been measured with values of 6.8 pm/°C and 13 pm/°C, respectively [30].
From Eq. (5), we can find that there exists a linear relationship between
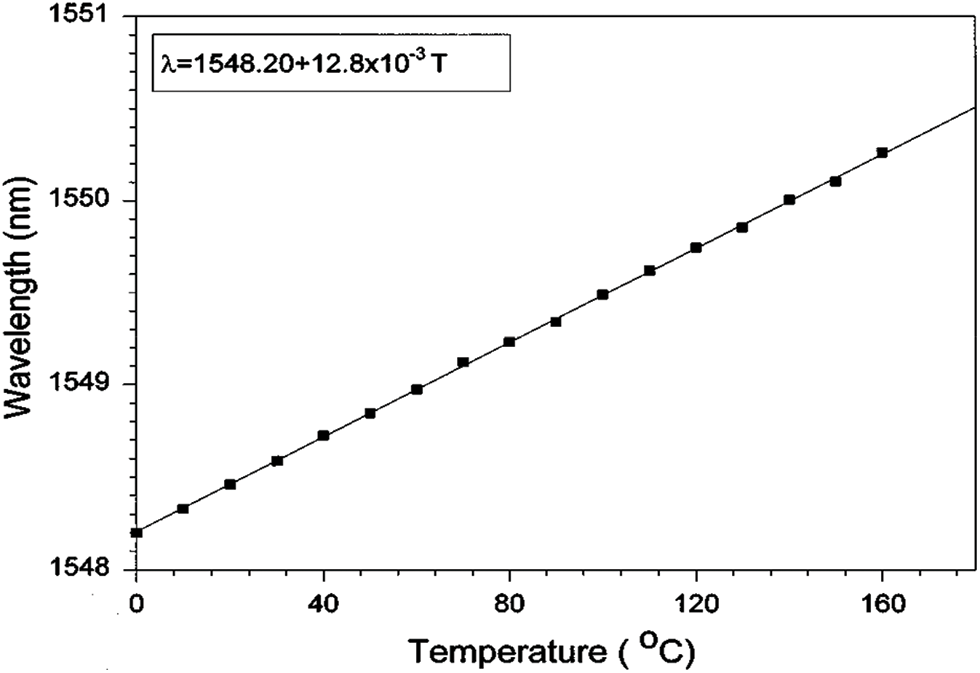
Figure 2: Bragg grating wavelength as a function of temperature change for a 1548.2 nm grating
2.3 Post-Mortem Dating Using Fiber Bragg Grating Sensors
The sensitivity of the FBG sensor to temperature results in a shift in Bragg’s wavelength given by the following equation [29]:
Replacing the Eq. (1) in the Eq. (5) or
The time shifting of variation Bragg’s wavelength become as the following equation:
Usually, the human body always tries to keep its internal temperature at 37.2 degrees Celsius compared to ambient temperature. But when the person dies, the body loses this property and becomes inactive; it begins to be affected by the ambient temperature. Figs. 3–6 present various death-timeprofiles when Eq. (1) are simulated numerically by the Matlab software, and the result are verified by Henssge’s nomogram for different ambient temperatures and for known body mass.
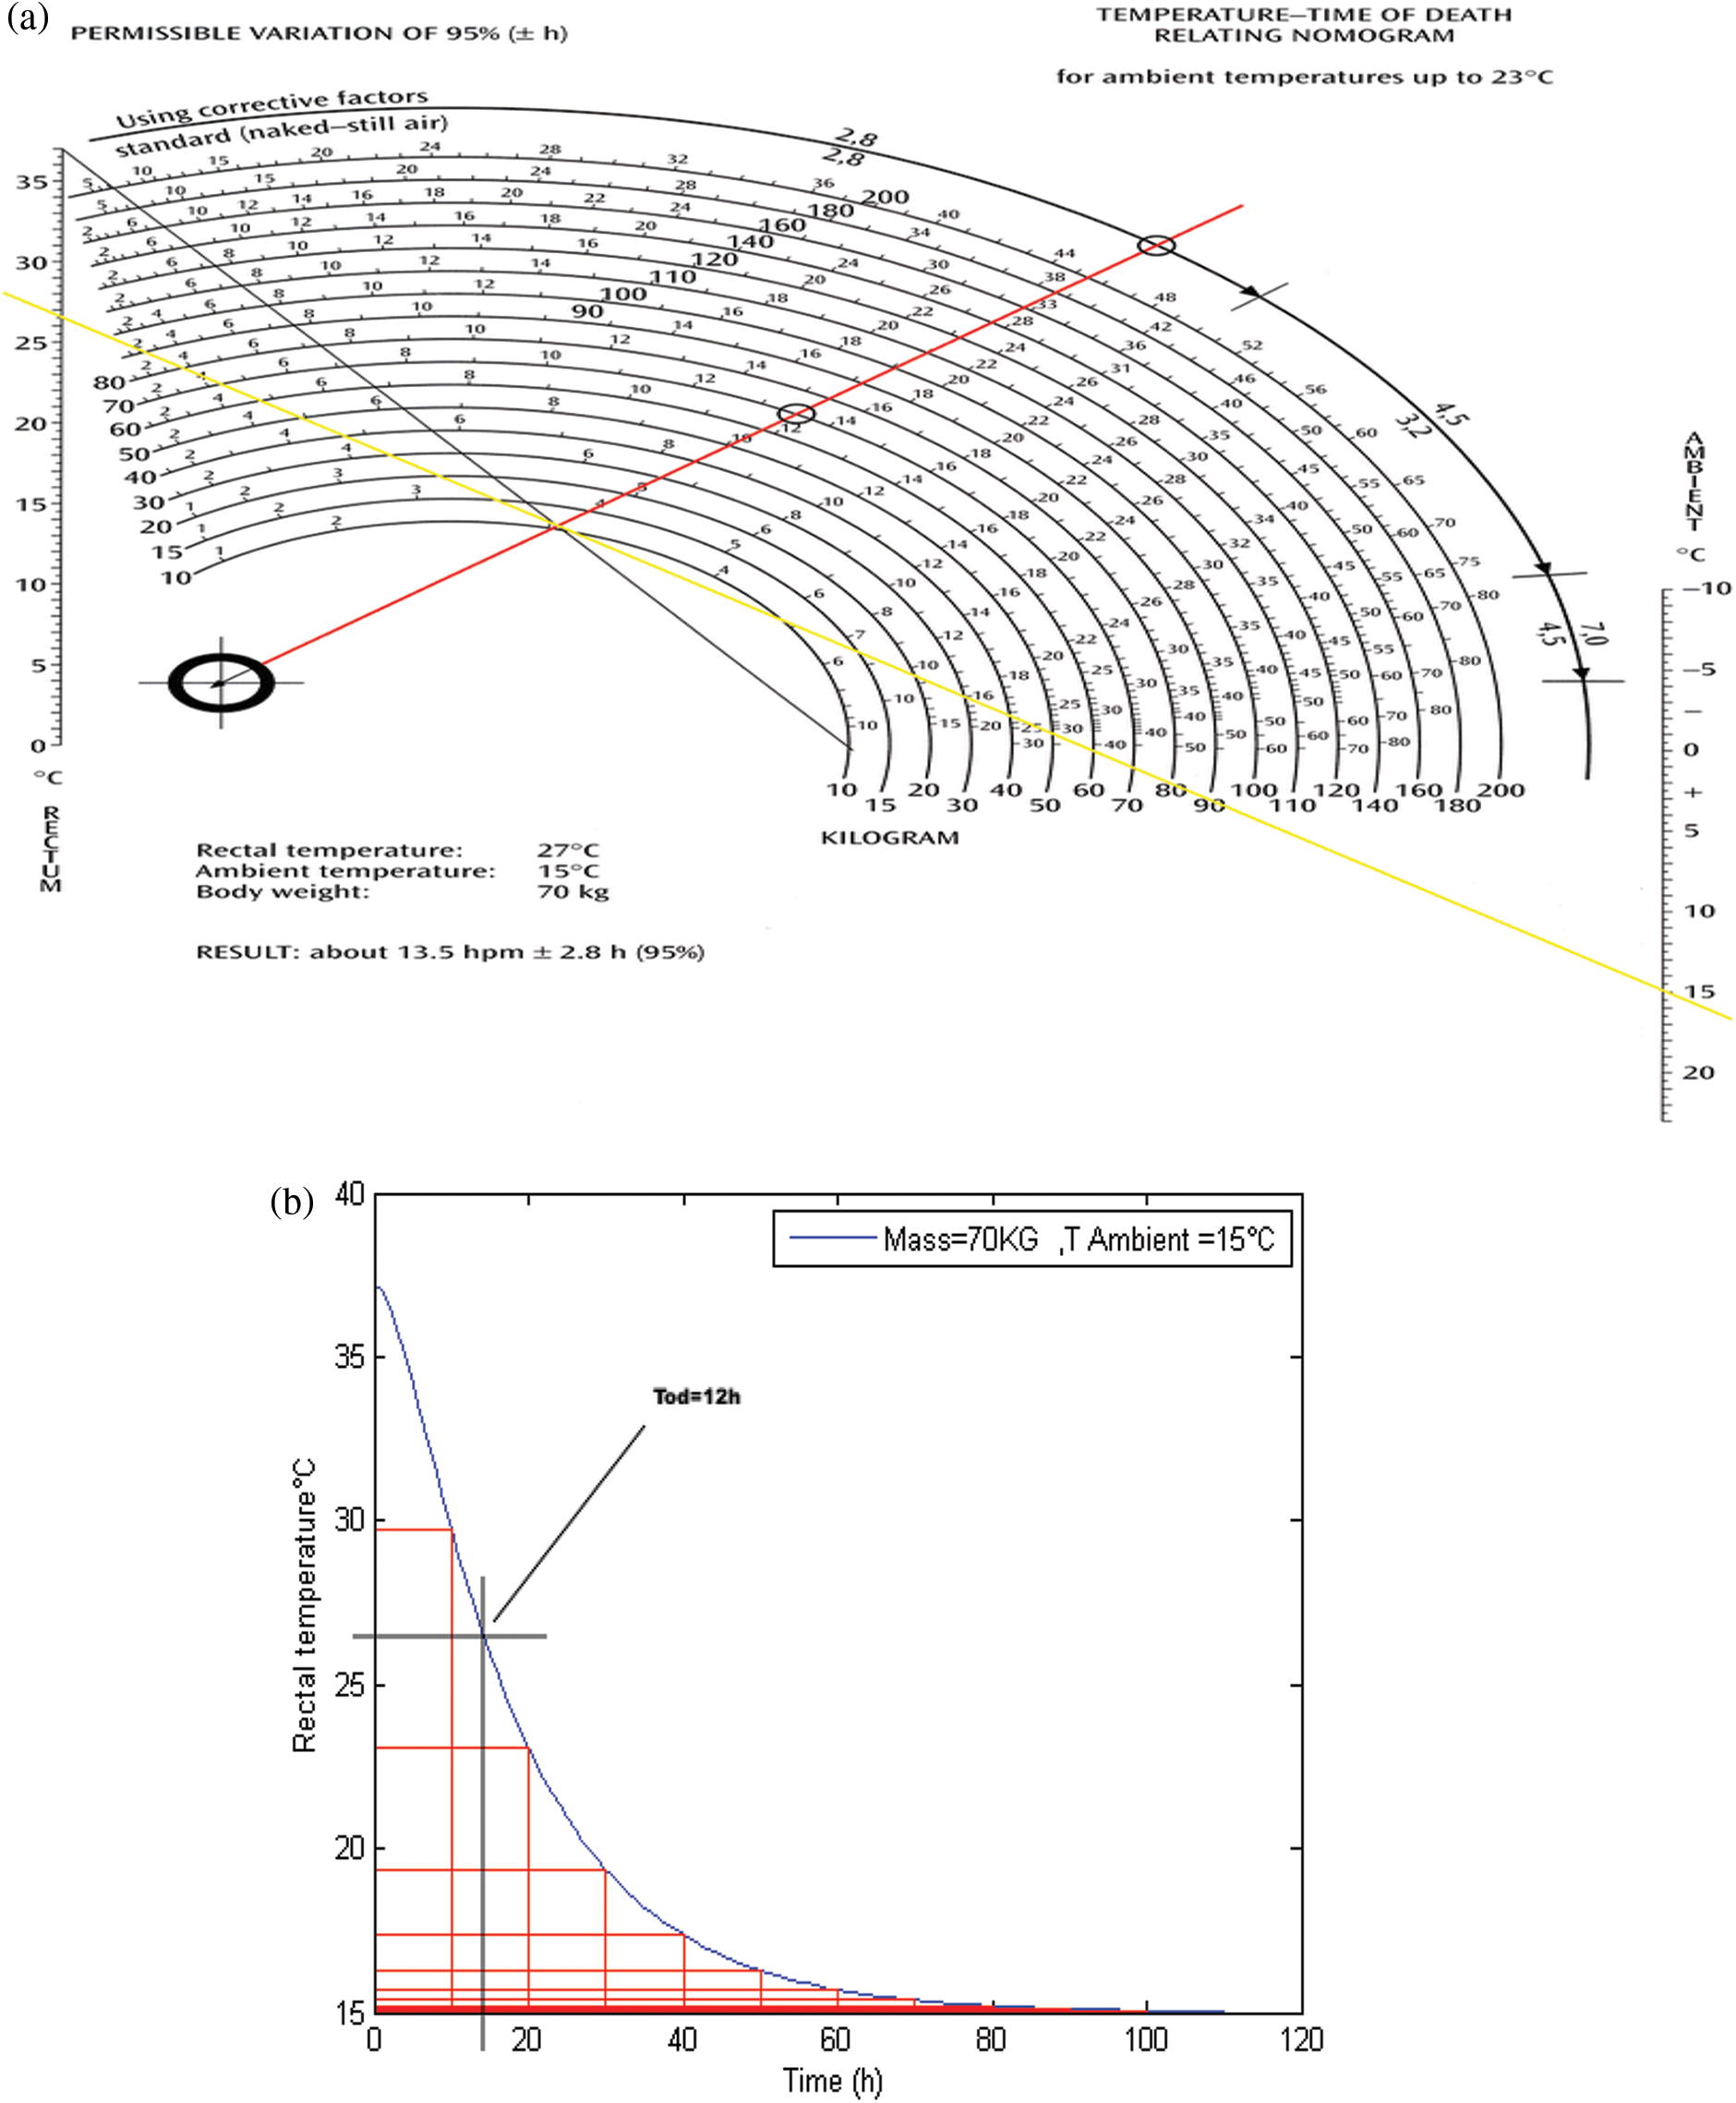
Figure 3: Schematic presentation of death-time (a) By using Henssg’s nomogram (b) Simulated datation
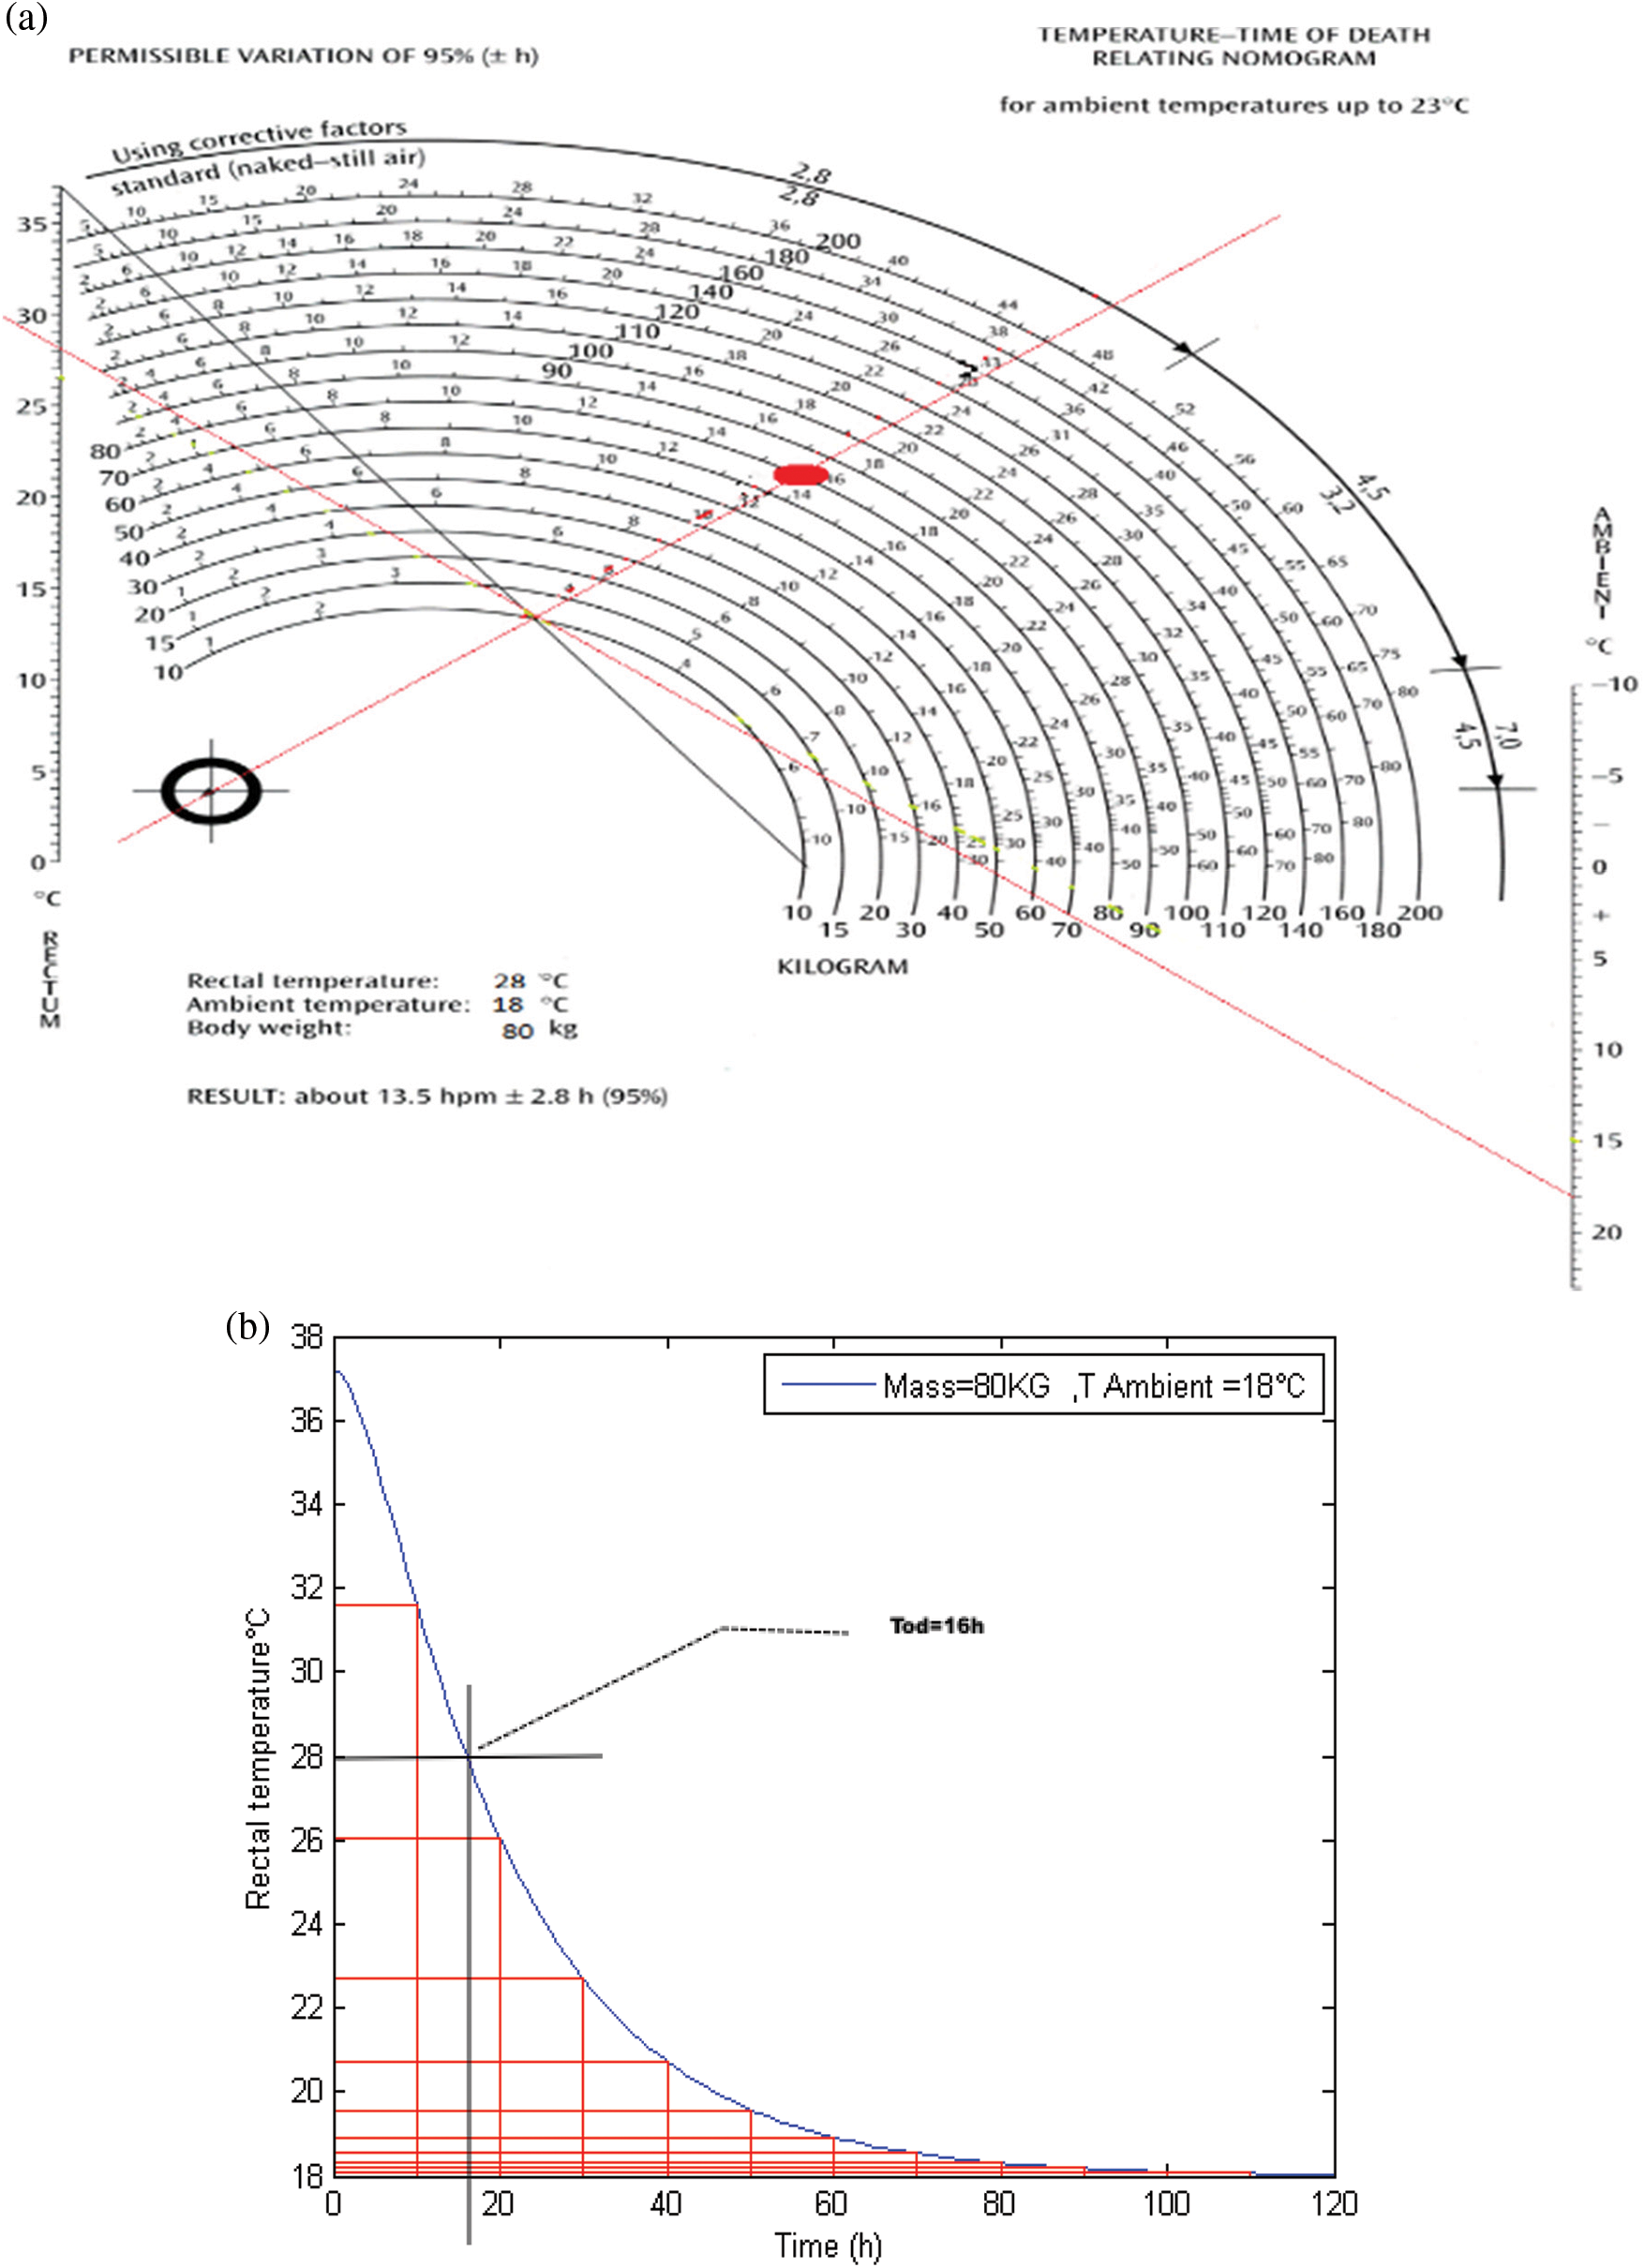
Figure 4: Schematic presentation of death-time (a) By using Henssg’s nomogram (b) Simulated datation
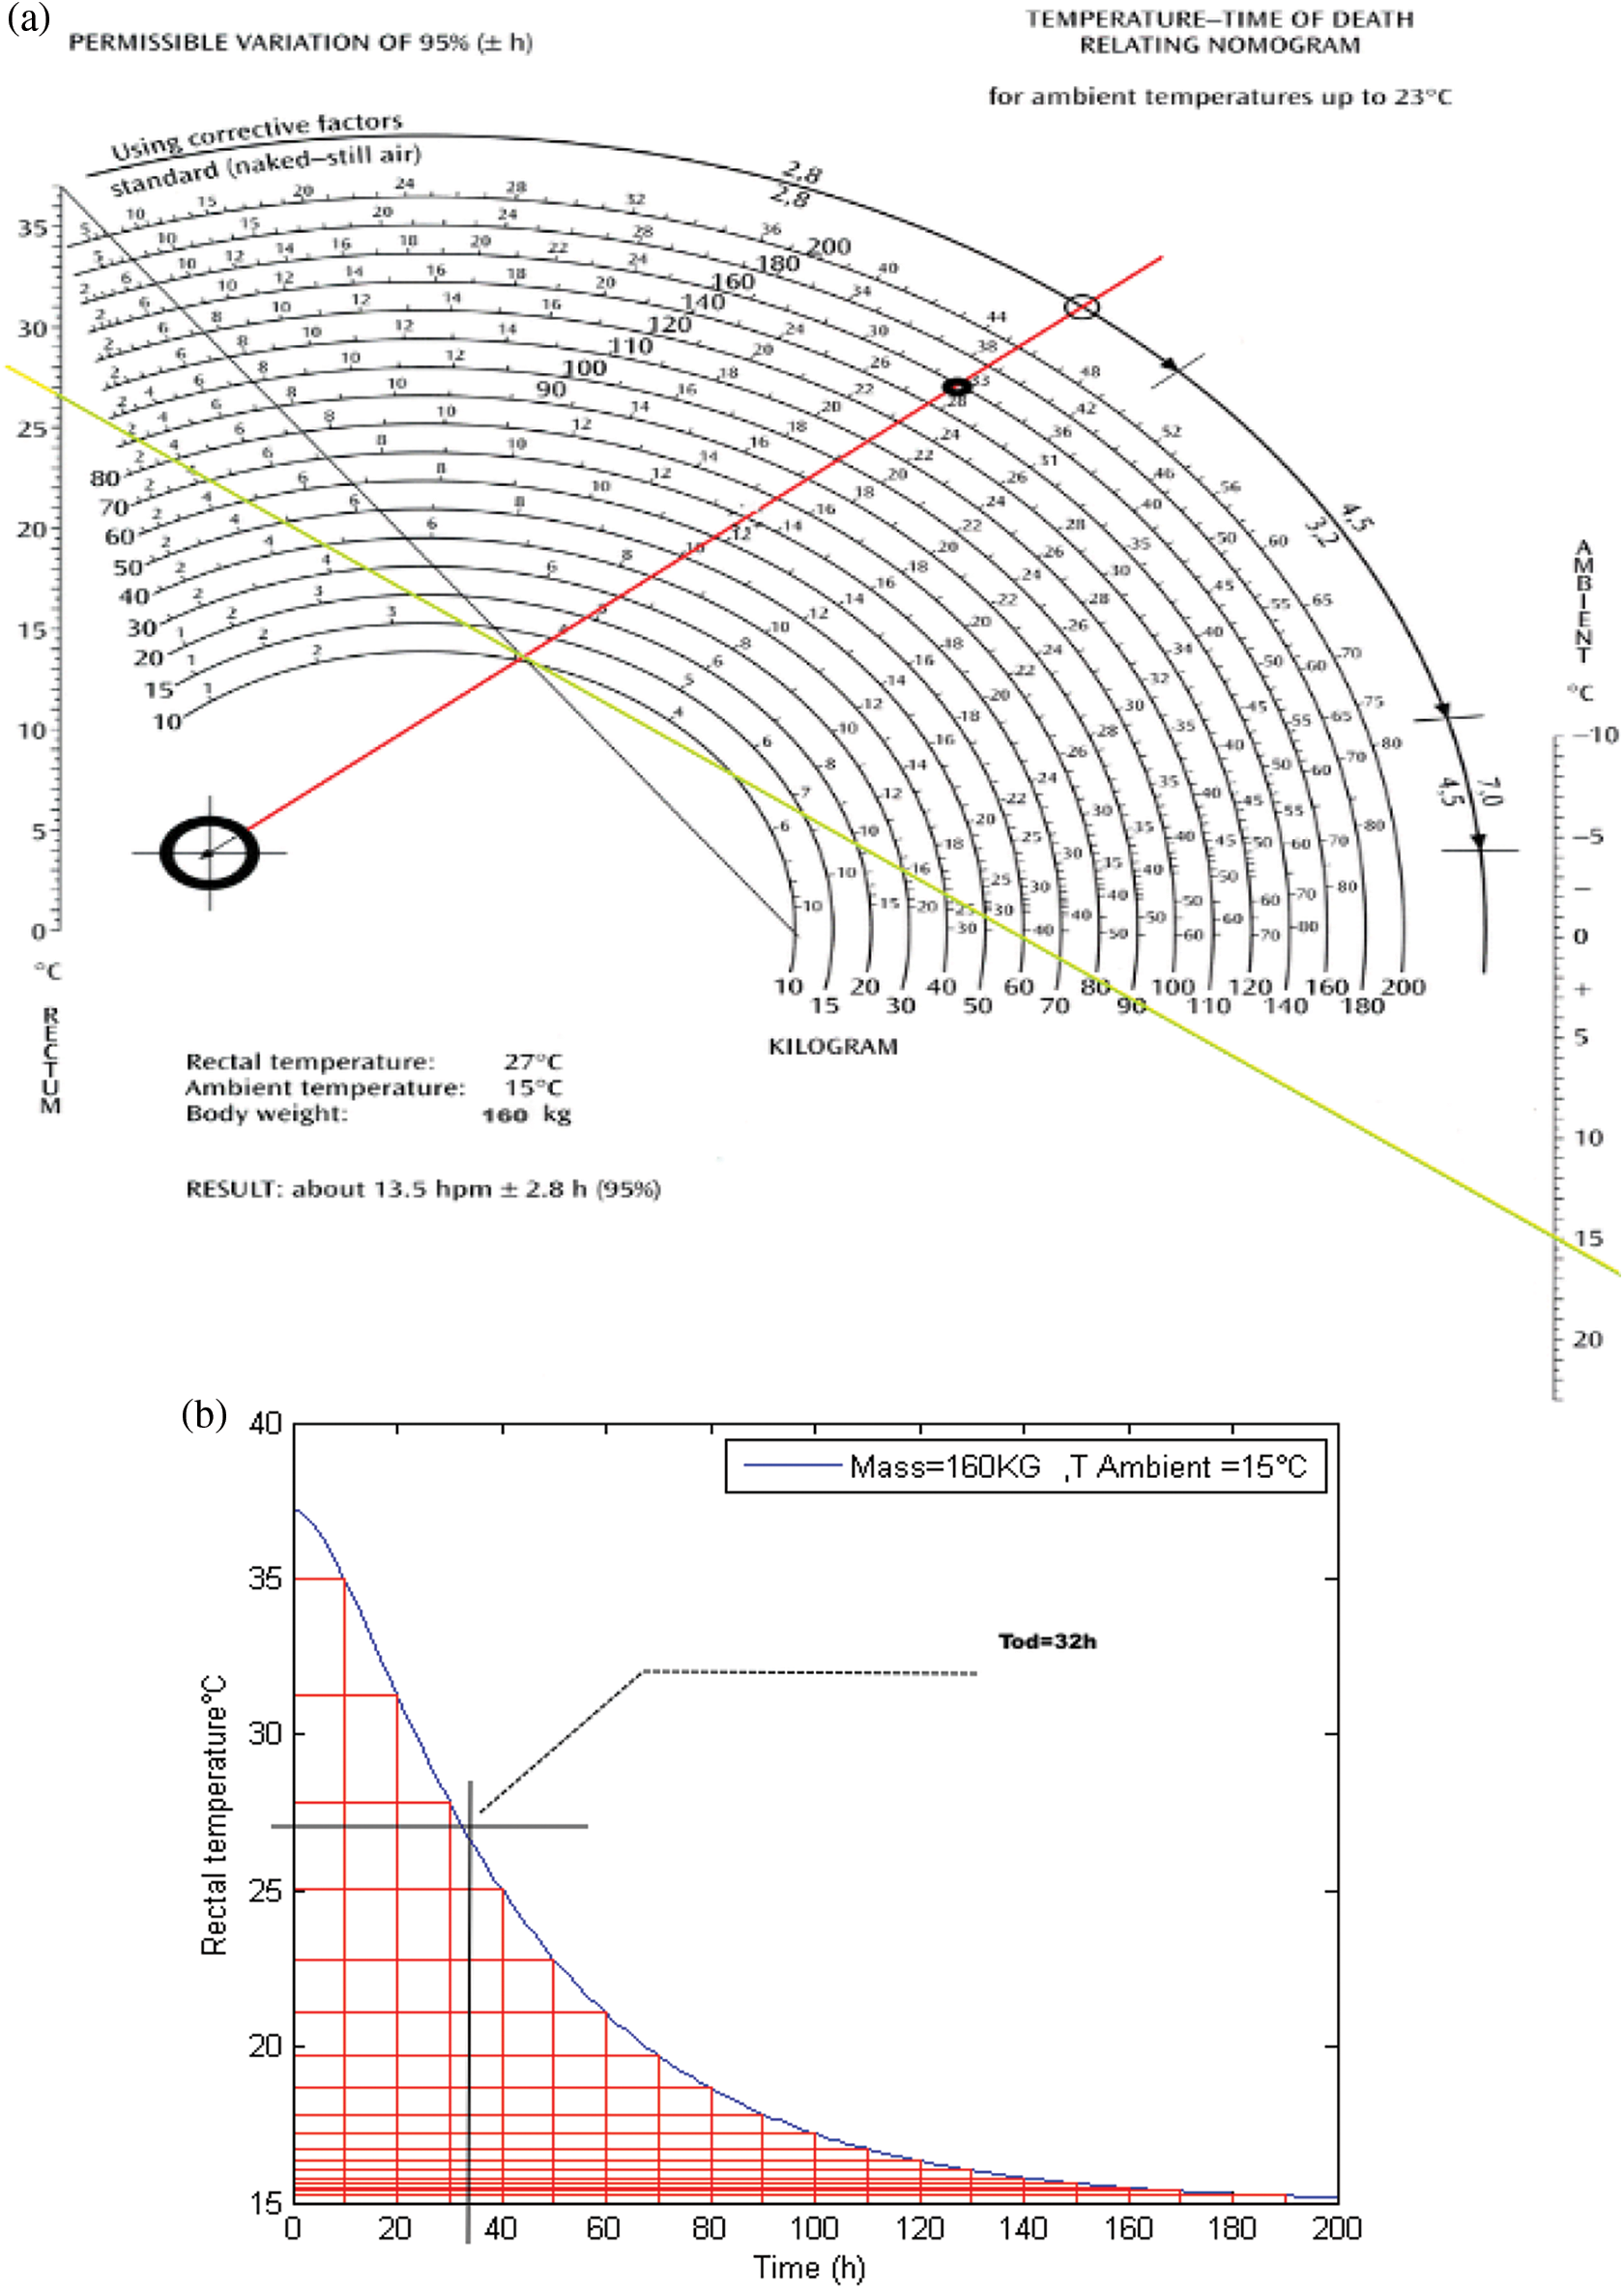
Figure 5: Schematic presentation of death-time (a) By using Henssg’s nomogram (b) Simulated datation
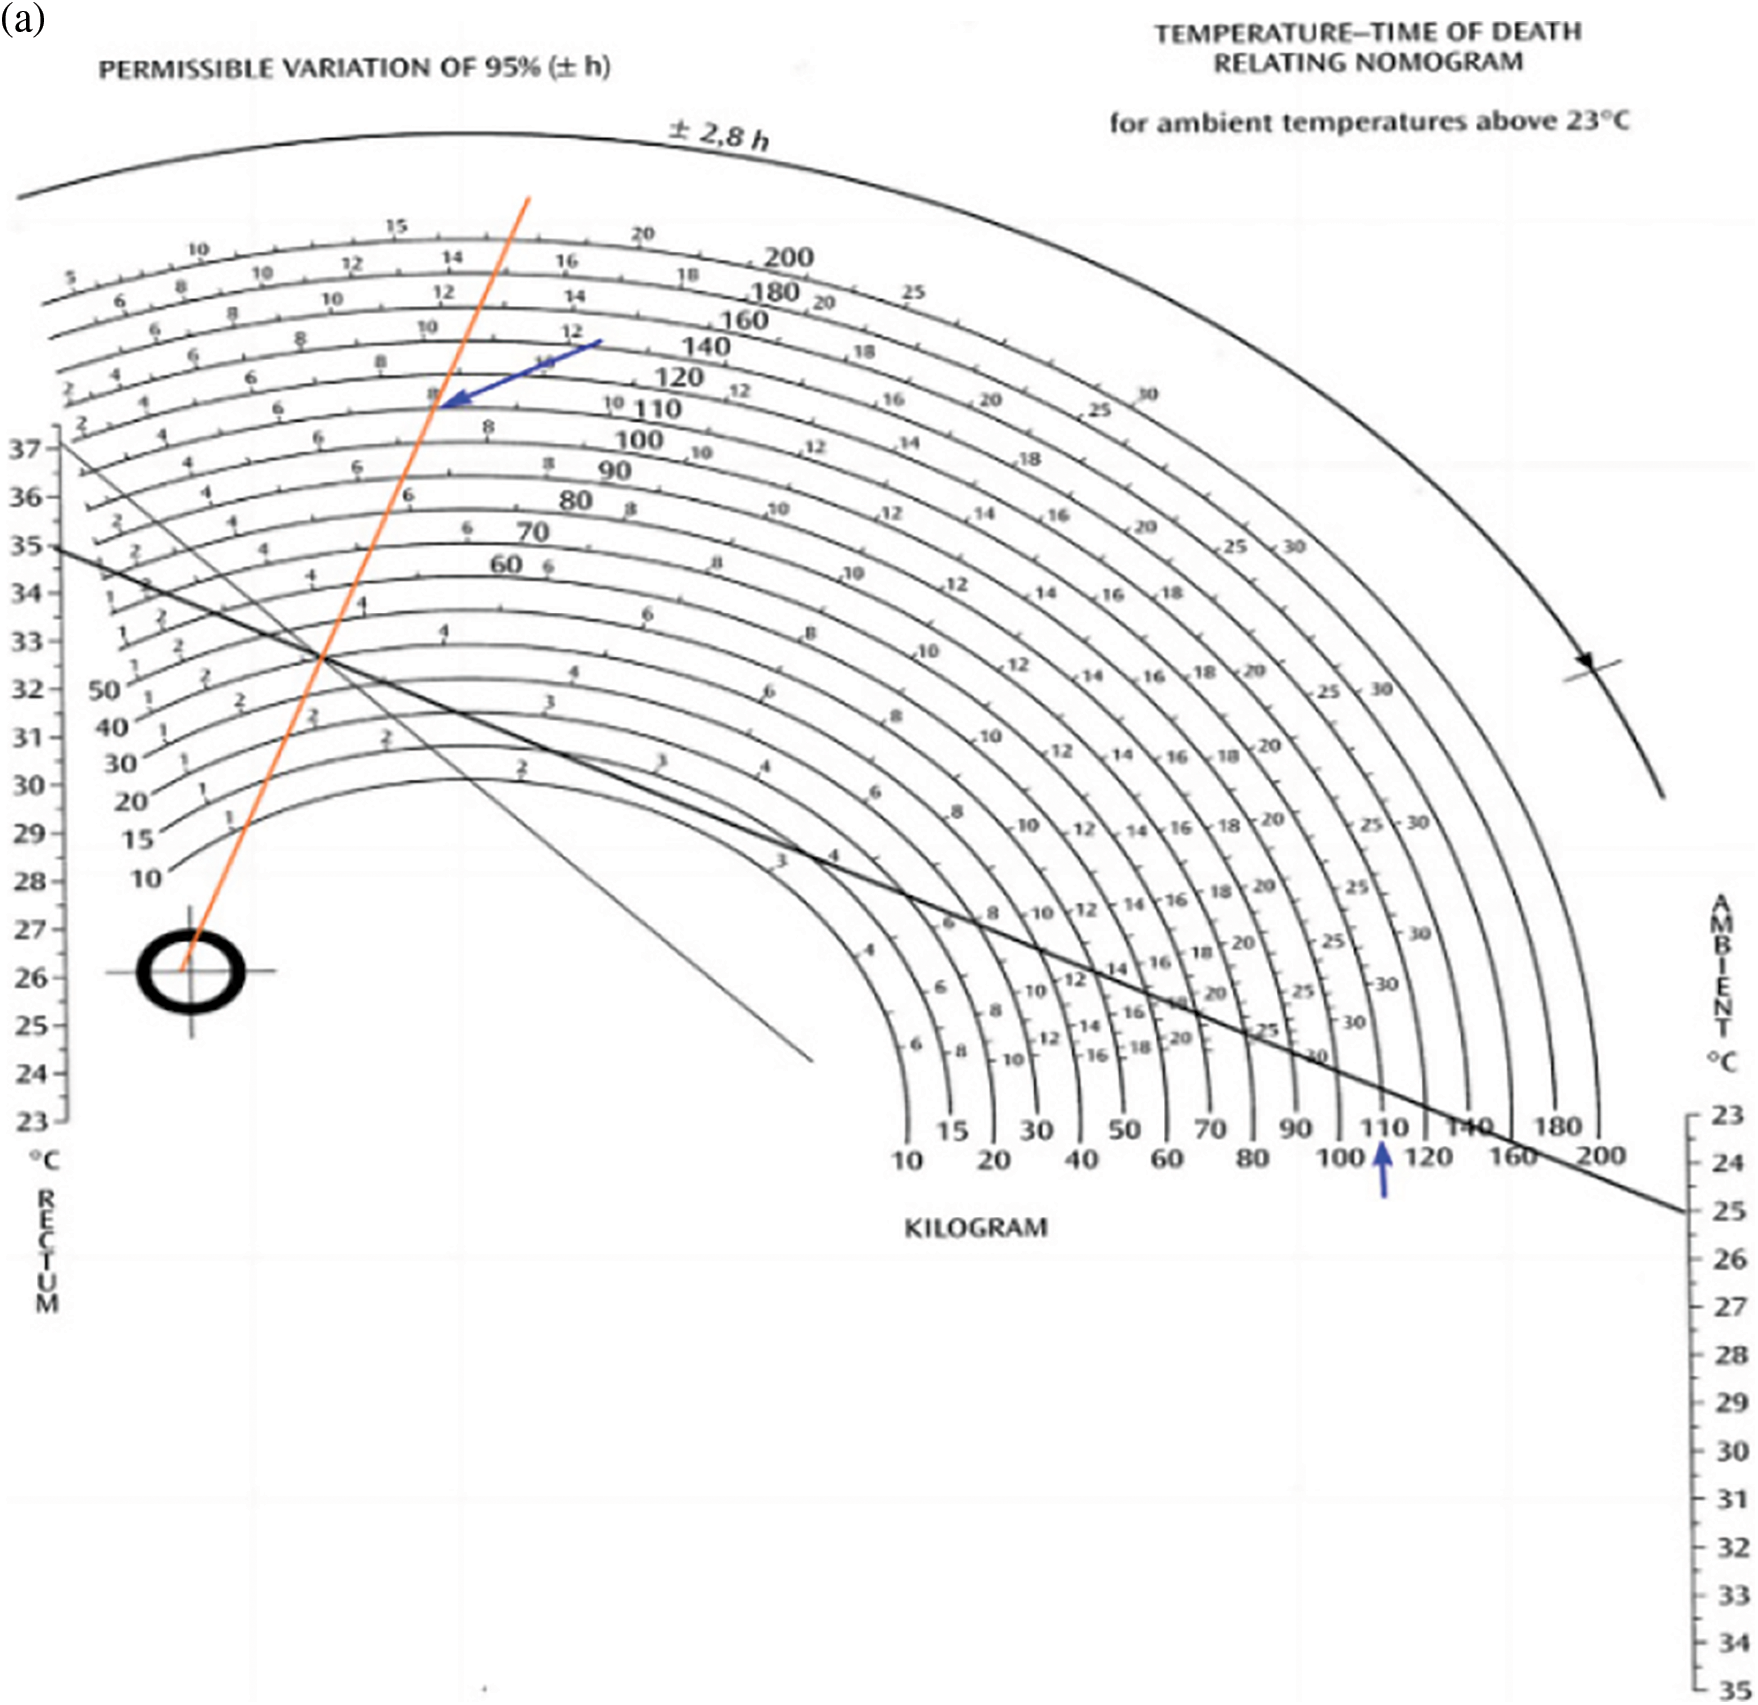
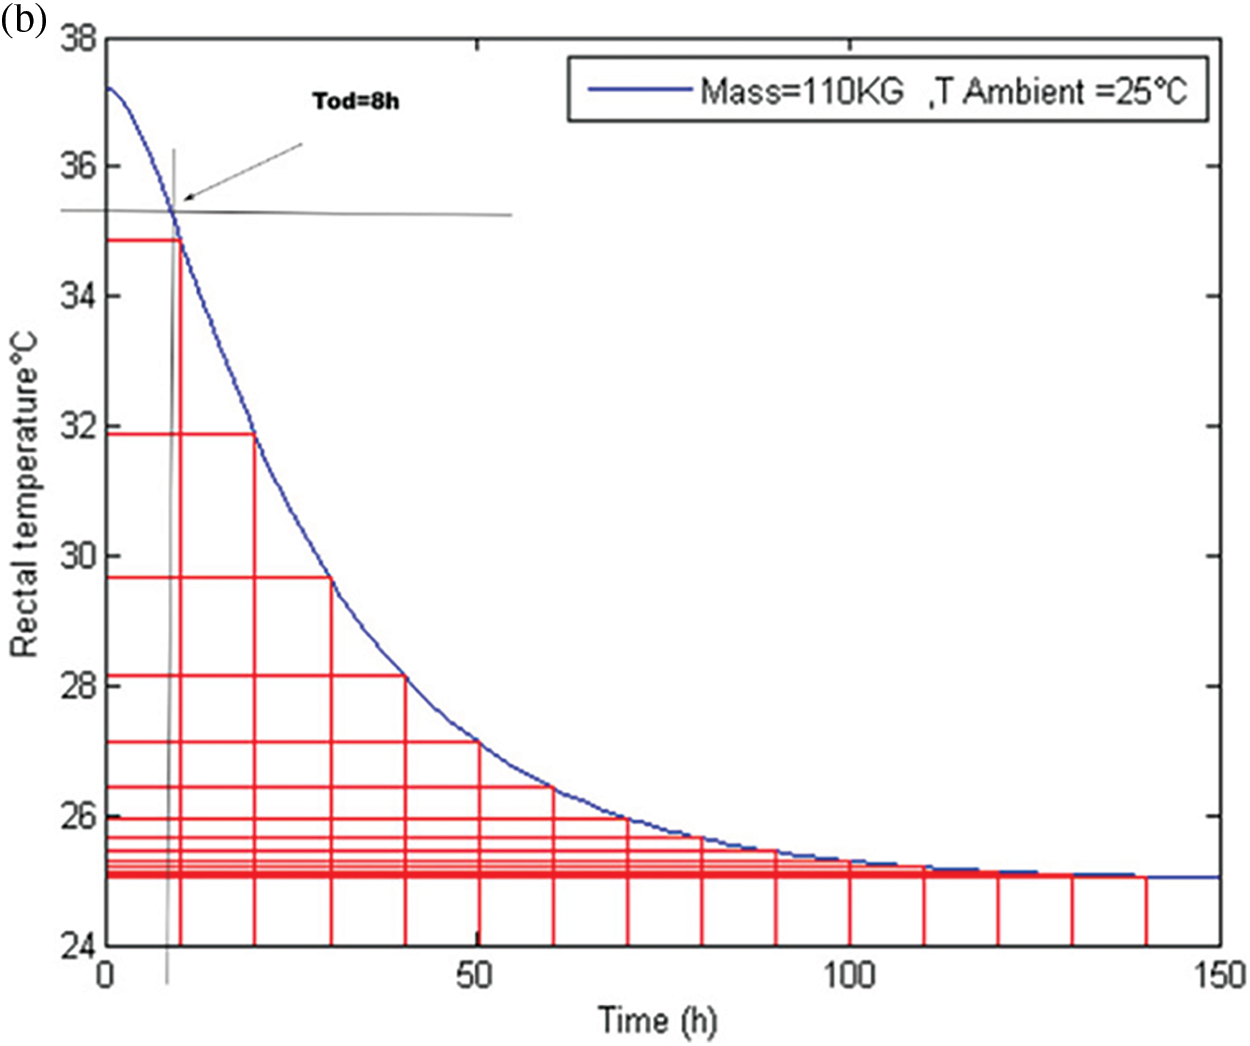
Figure 6: Schematic presentation of death-time (a) By Henssg’s nomogram (b) Simulated datation
Table 1 summarizes the values of time of death (Tod) obtained of each profile of datation.

According to these figures, our results obtained by Matlab software are similar with those given by the Hengsse nomogram.
The Figs. 3b, 4b, 5b and 6b show 03 distinct phases: a phase called the initial thermal plateau (duration of 0.5 to 3 h) or during this period, the body temperature decreases very little. An intermediate phase of rapid semi-linear decay and a terminal phase of slow decay where the body temperature is eventually very gradually equalized with that of the surrounding environment
3.2 Evolution of Internal Temperature according Time Death for Different Ambient Temperatures
Figs. 7 and 8 show the datation profile vs. different ambient temperatures.
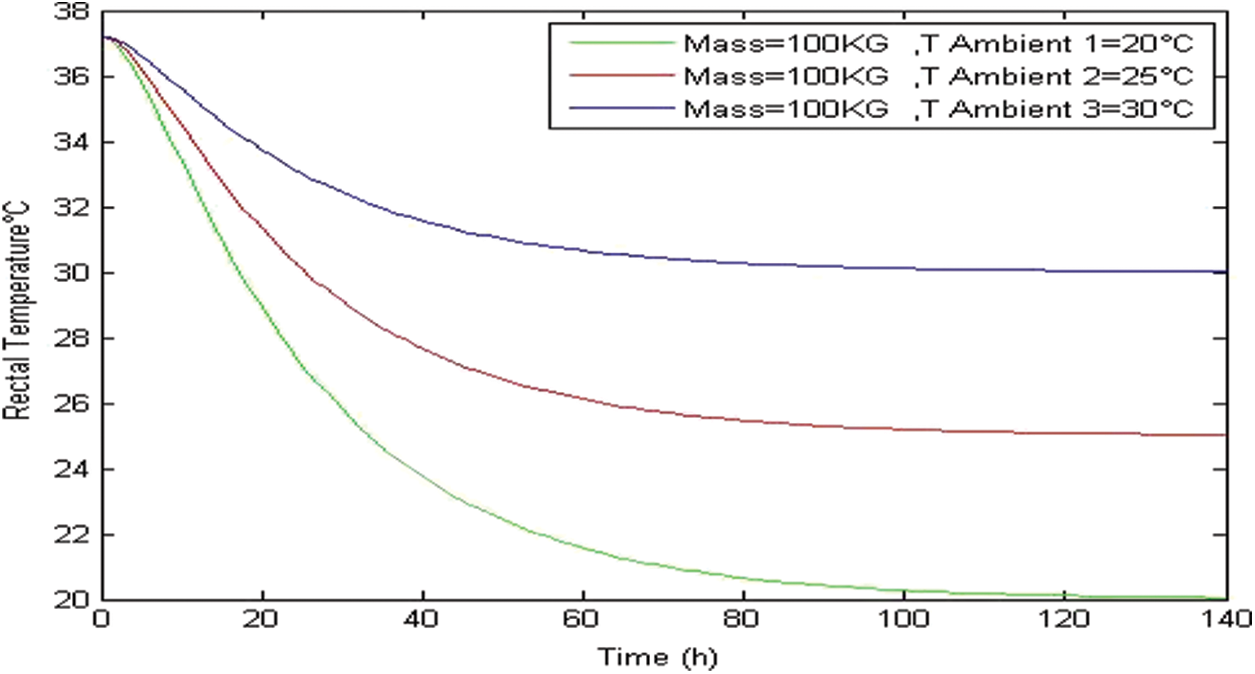
Figure 7: Internal temperature vs. ambient temperature case of Tambient < 37.2°C
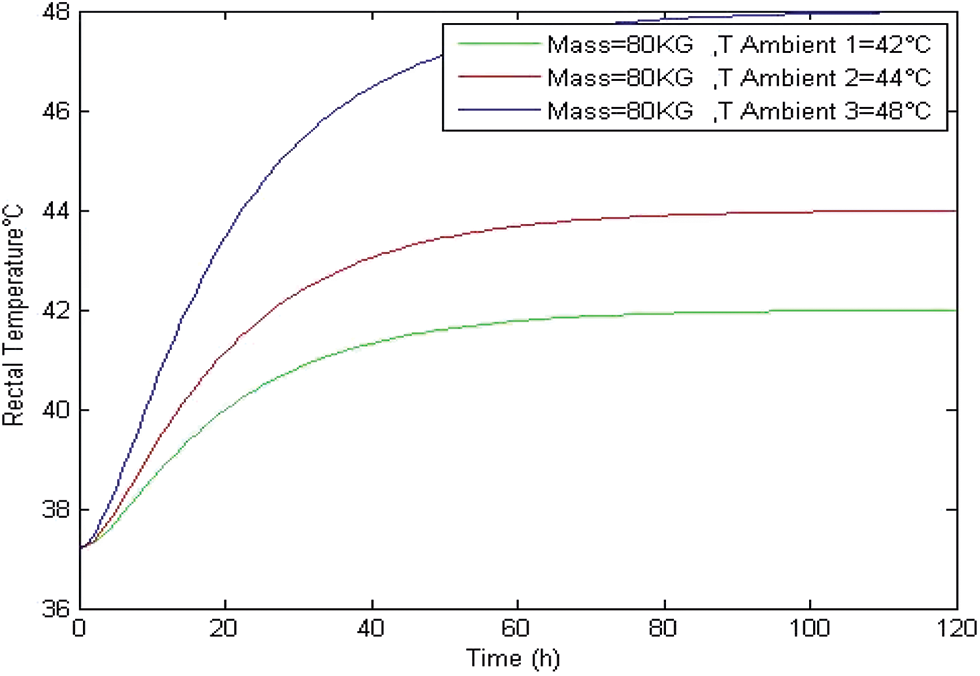
Figure 8: Internal temperature vs. ambient temperature case of TAmbient > 37.2°C
From Fig. 7, we can see that in the case when TAmbient < TRectal, the internal temperature decreases until getting value of ambient temperature for all profiles.
In the case when TAmbient > TRectal, the internal temperature increases until getting value of ambient temperature for all profile which is shown in Fig. 8.
3.3 Post-Mortem Dating Using FBG Temperature Sensors
Fig. 9 presents the time shifting of variation Bragg’s wavelength given by Eq. (7).
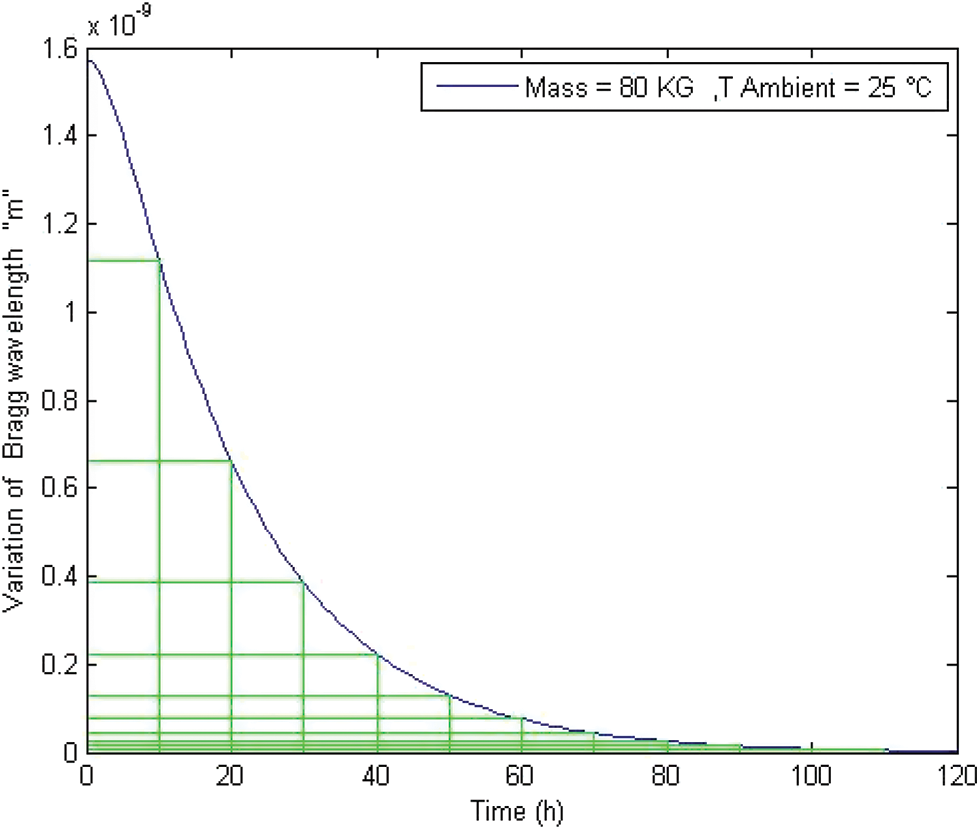
Figure 9: Evolution of Bragg wavelength variation according to time
We noticed that the profile curve of Fig. 9 is comparable to Henssge’s equation given by Fig. 3 simulated by MATLAB.
Fig. 10 depicts the Bragg wavelength for different values of the body mass at the same ambient temperature.
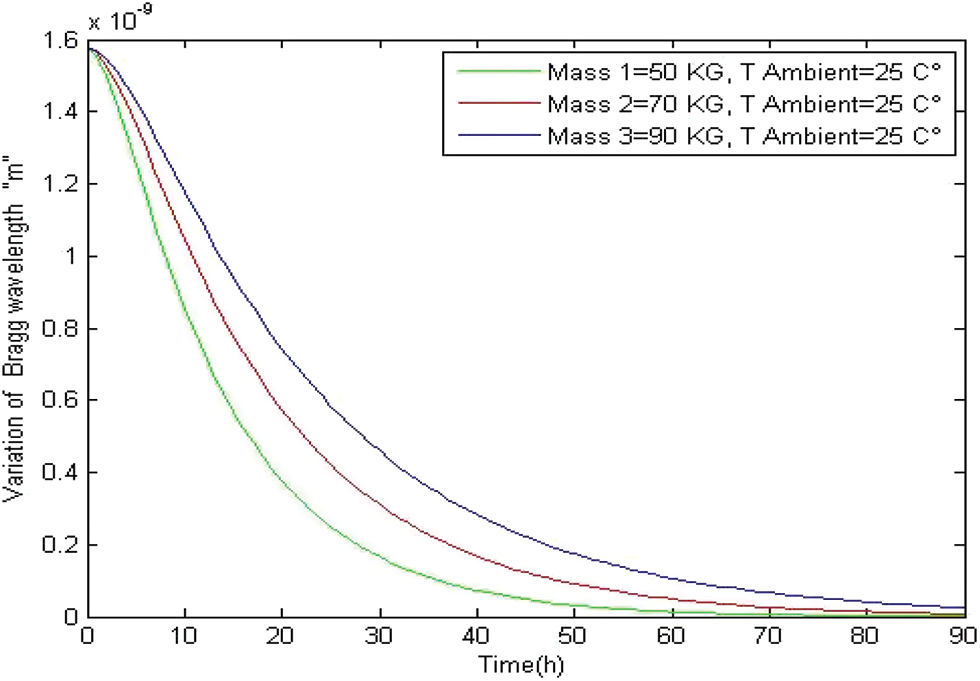
Figure 10: Evolution of Bragg wavelength variation according to time
From this figure, we can see that the heaviest body cools more slowly. Before arriving at a conclusion, let us analyze the results obtained using the FBG temperature sensors.
Fig. 11 presents a comparison between two dating methods, that are based on the use of the FBG temperature sensors and that related to the use of the simulated henssge’s equation in the case of TAmbient > 37.2°C. We clearly see that the two curves present the same profile and the result obtained by the two methods are comparable and presented in Table 2.
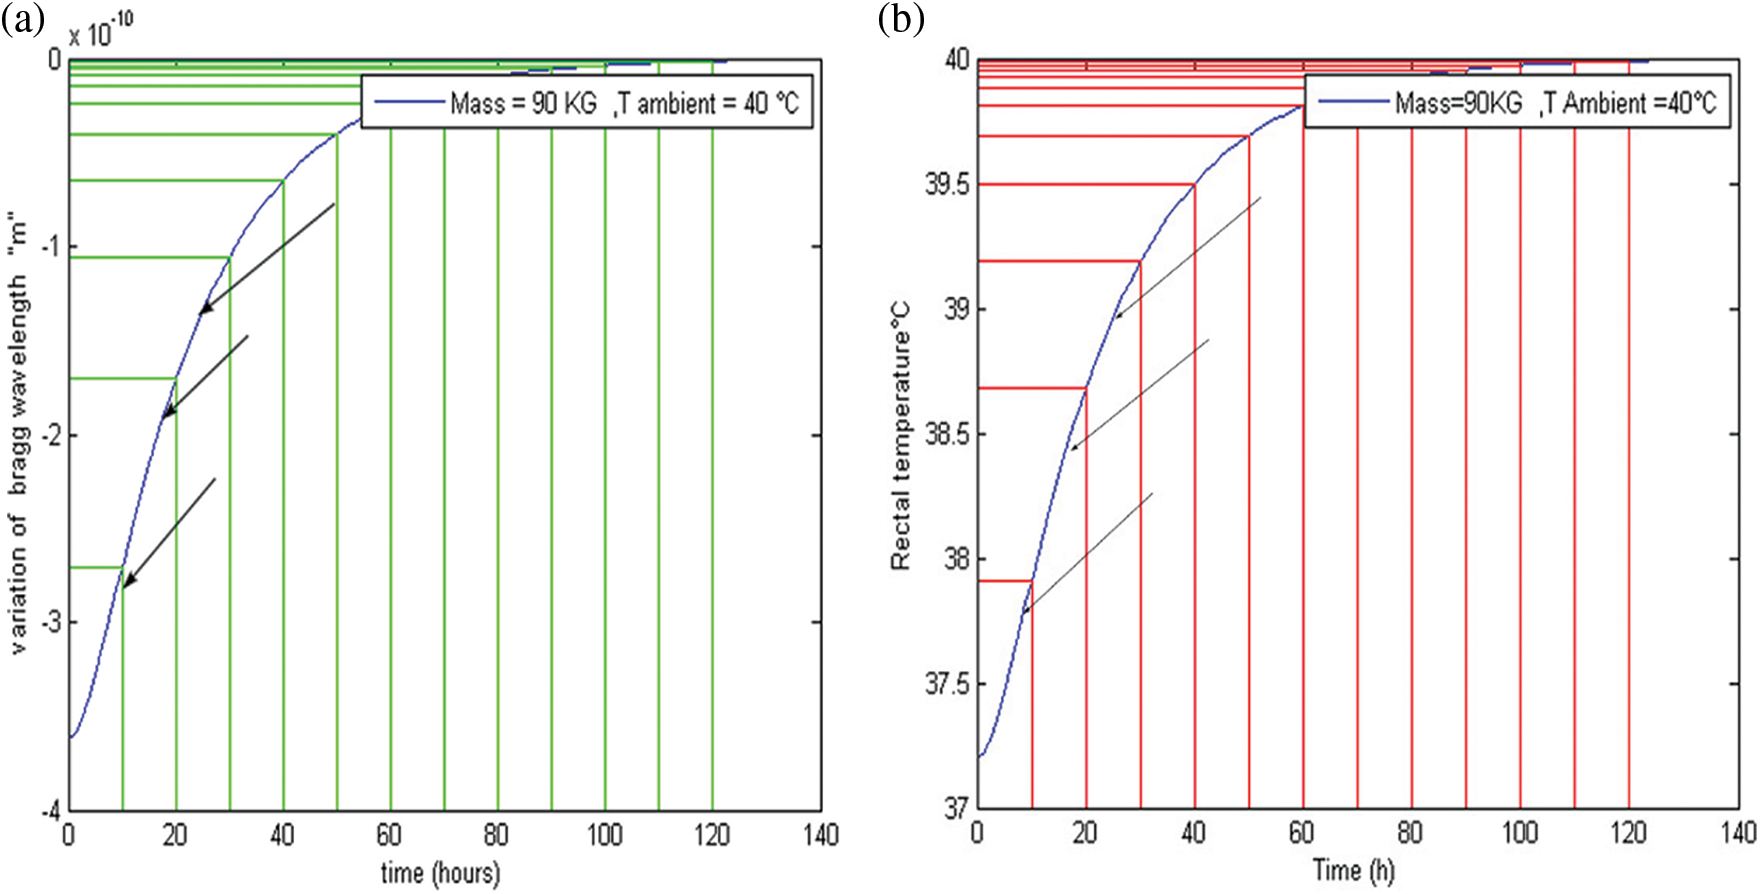
Figure 11: (a) Dating using Fiber Bragg Grating temperature sensors (b) Dating using equation of Henssge

According to the Figs. 11a and 11b and Table 2, we have found that are three cases:
Case 1: When the rectal temperature is 37.5°C and ambient temperature 40°C, the body warms up quickly so the time to death is 6 h.
Case 2: When the temperature of the rectum is 38.5°C therefore close to the ambient temperature 40°C, the body warms up slowly, which is the slow phase. In this phase, we find that the exact time of death is 18 h.
Case 3: When the body temperature is 39°C very close to the ambient temperature 40°C, a difference of 0.5 degree compared to the second case makes the difference of 8 h so we get 26 h.
In conclusion, we have introduced a novel method for measuring the post-mortem interval (PMI) using Fiber Bragg grating temperature sensors. One should note that the Fiber Bragg Grating sensors have attracted considerable attention for measurement applications due to their greatly reduced size, low weight, flexibility, and immunity to electromagnetic interference in comparison with traditional sensing methods. The principal advantage of the Fiber Bragg Grating system chosen in this study is that the measured signal has the Bragg’s wavelength. We note that modeling by using fiber Bragg grating sensors makes it possible to reproduce the thermal behavior of body. FBG sensors has shown its performance given the accuracy of results, which allows to be exploited for post-mortem dating at different ambient temperatures. One of the main advantages of this method is its use at high temperatures go up to 48°C (desert cases), which simulates the change in temperature of a body located outside. This work also provides a numerical simulation tool much easier to use than the use of field experiments on animal models, or human models. Finally, unlike other existing methods, it is simple to use and free to access, and does not require extremely detailed data to perform simulations. After comparison with the Henssged²nomogram, the predictions of this model have been used to test the validity of the Henssge nomogram in the case of a body subjected to high ambient temperature. The results indicate that the Henssge method cannot be used in the case of bodies found in an environment with high temperature. In view of these aspects of FBG sensing, it can be predicted that this rapidly evolving technology can provide much better and effective solutions for various biomedical applications and be an integral part of the futuristic healthcare system.
Funding Statement: The authors received no specific funding for this study.
Conflicts of Interest: The authors declare that they have no conflicts of interest to report regarding the present study.
References
1. Hill, K. O., Malo, B., Bilodeau, F., Johnson, D. C., Albert, J. (1978). Photosensitivity on optical fiber waveguides: Application to reflection filter fabrication. Applied Physics Letters, 32(10), 747–749. DOI 10.1063/1.89881. [Google Scholar] [CrossRef]
2. Meltz, G., Morey, W. W., Glenn, W. H. (1989). Formation of bragg gratings in optical fiber by a transverse holographic method. Optics Letters, 14(15), 823–825. DOI 10.1364/OL.14.000823. [Google Scholar] [CrossRef]
3. Othonos, A., Kalli, K. (1999). Fiber bragg gratings: Fundamentals and applications in telecommunications and sensing. Artech House, Inc. [Google Scholar]
4. Kashyap, R. (1999). Fiber bragg grating. San Diego: Academic Press. [Google Scholar]
5. Katzir, A. (1989). Optical fibers in medicine. Scientific American, 260(5), 120–125. [Google Scholar]
6. Mishra, V., Singh, N., Tiwari, U., Kapur, P. (2011). Fiber grating sensors in medicine: Current and emerging applications. Sensors and Actuators A: Physical, 167(2), 279–290. DOI 10.1016/j.sna.2011.02.045. [Google Scholar] [CrossRef]
7. Rao, Y. J. (1998). Optical in-fiber bragg grating sensor systems for medical applications. Journal of Biomedical Optics, 3(1), 38–44. DOI 10.1117/1.429860. [Google Scholar] [CrossRef]
8. Mishra, V., Singh, N., Kapur, P. (2009). Fiber optic sensors technology in medicine. In: Rai, D. V., Bahadur, R. (Eds.Trends in medical physics and bio medical instrumentation, pp. 225–242. India: New Era International Imprint. [Google Scholar]
9. Al-Fakih, E., Osman, N. A. A., Adikan, F. R. M. (2012). The use of fiber bragg grating sensors in biomechanics and rehabilitation applications: The state-of-the-art and ongoing research topics. Sensors, 12(10), 12890–12926. DOI 10.3390/s121012890. [Google Scholar] [CrossRef]
10. Correia, R. J., Lee, S. S. W., Morgan, S. P., Korposh, S. (2018). Biomedical application of optical fiber sensors. Journal of Optics, 20(7), 73003. DOI 10.1088/2040-8986/aac68d. [Google Scholar] [CrossRef]
11. Kashyap, R. (2009). Fiber bragg gratings, vol. 5, 2nd edition. London: Academic Press. [Google Scholar]
12. Othonos, A., Kalli, K. (1999). Fiber bragg gratings: Fundamentals and applications in telecommunications and sensing. London: Artech House. [Google Scholar]
13. Rao, Y. J. (1997). In-fiber bragg grating sensors. Measurement Science and Technology, 8(4), 355–375. DOI 10.1088/0957-0233/8/4/002. [Google Scholar] [CrossRef]
14. Majumder, M., Gangopadhyay, T. K., Chakraborty, A. K., Dasgupta, K., Bhattacharya, D. K. (2008). Fiber bragg gratings in structural health monitoring–Present status and applications. Sensors and Actuators A: Physical, 147(1), 150–164. DOI 10.1016/j.sna.2008.04.008. [Google Scholar] [CrossRef]
15. Tiwari, U., Mishra, V., Poddar, G. C., Kesavan, K., Jain, S. C. et al. (2009). Health monitoring of steel and concrete structures using fiber bragg grating sensors. Current Science, 97(11), 1539–1542. [Google Scholar]
16. Bakaic, M., Hanna, M., Hnatovsky, C., Grobnic, D., Mihailov, S. et al. (2020). Fiber-optic bragg gratings for temperature and pressure measurements in isotope production targets for nuclear medicine. Applied Sciences, 10(13), 4610. DOI 10.3390/app10134610. [Google Scholar] [CrossRef]
17. Presti, D. L. O., Massaroni, C., Leitao, J. C. S., Domingues, M. D. F., Sypabekova, M. et al. (2020). Fiber bragg gratings for medical applications and future challenges: A review. IEEE Access, 8, 156863–156888. DOI 10.1109/ACCESS.2020.3019138. [Google Scholar] [CrossRef]
18. Charabidze, D. (2012). La biologie des insectes nécrophages et leur utilisation pour dater le décès en entomologie médico-légale. Annales de la Société Entomologique de France, 48(3–4), 239–252. DOI 10.1080/00379271.2012.10697773. [Google Scholar] [CrossRef]
19. Sterzik, V., Holz, F., Ohlwärther, T. E. N., Thali, M., Birngruber, C. G. (2018). Estimating the postmortem interval of human skeletal remains by analyzing their fluorescence at 365 and 490 nm. International Journal of Legal Medicine, 132(3), 933–938. DOI 10.1007/s00414-017-1759-3. [Google Scholar] [CrossRef]
20. Sterzik, V., Jung, T., Jellingha, K., Bohnert, M. (2016). Estimating the postmortem interval of human skeletal remains by analyzing their optical behavior. International Journal of Legal Medicine, 130(6), 1557–1566. DOI 10.1007/s00414-016-1395-3. [Google Scholar] [CrossRef]
21. Henssge, C. (1988). Death time estimation in case work. I. The rectal temperature time of death nomogram. Forensic Science International, 38(3–4), 125–133. DOI 10.1016/0379-0738(88)90168-5. [Google Scholar] [CrossRef]
22. Henssge, C., Madea, B. (2004). Estimation of the time since heath in the early post-mortem period. Forensic Science International, 144, 123–133. [Google Scholar]
23. Śliwka, K., Miścicka, Ś. D. (1985). The examinations on body cooling with regard to the estimation of the time of death. I. Post-mortem temperature drop in rectum. Archiwum Medycyny Sądowej i Kryminologii, 35, 1–6. [Google Scholar]
24. Charabidze, D., Veremmeb, A., Morvanb, G., Hedouina, V., Gosseta, D. (2010). Modélisation température rectale post-mortem en environnement thermique variable. The Forensic Journal, 1(2), 61–65. DOI 10.1016/j.medleg.2010.07.002. [Google Scholar] [CrossRef]
25. Mall, G., Eisenmenger, W. (2005). Estimation of time since death by heat-flow finite-element model. Part I: Method, model, calibration and validation. Legal Medicine, 7(1), 1–14. DOI 10.1016/j.legalmed.2004.06.006. [Google Scholar] [CrossRef]
26. Mall, G., Eisenmenger, W. (2005). Estimation of time since death by heat-flow finite-element model. Part II: Application to non-standard cooling conditions and preliminary results in practical casework. Legal Medicine, 7(2), 69–80. DOI 10.1016/j.legalmed.2004.06.007. [Google Scholar] [CrossRef]
27. Sapienza, D., Asmundo, A., Silipigni, S., Barbaro, U., Cinquegrani, A. et al. (2020). Feasibility study of MRI muscles molecular imaging inevaluation of early post-mortem interval. Scientific Reports, 10(1), 392. DOI 10.1038/s41598-019-57357-z. [Google Scholar] [CrossRef]
28. Henssge, C., Knight, B., Krompecher, T., Madea, B., Nokes, L. et al. (1995). The estimation of the time since death in the early postmortem period, vol. 144, pp. 167–175. London: Edward Arnold. [Google Scholar]
29. Morey, W. W., Meltz, G., Glenn, W. H. (1990). Fiber optic bragg grating sensors. Proceedings of SPIE - The International Society for Optical. DOI 10.1117/12.963022. [Google Scholar] [CrossRef]
30. Rao, Y. J. (1997). In-fibre Bragg grating sensors. Measurement Science and Technology, 8(4), 355–375. DOI 10.1088/0957-0233/8/4/002. [Google Scholar] [CrossRef]
Cite This Article
 Copyright © 2023 The Author(s). Published by Tech Science Press.
This work is licensed under a Creative Commons Attribution 4.0 International License , which permits unrestricted use, distribution, and reproduction in any medium, provided the original work is properly cited.
 Downloads
 Citation Tools