
 Submit a Paper
 Propose a Special lssue
 Open Access
ARTICLE

Performance Analysis of a Solar Continuous Adsorption Refrigeration System
1 Lorraine University, Nancy, France
2 Gabes University, Gabes, Tunisia
3 Sfax University, Sfax, Tunisia
4 Lorraine University, Longwy, France
* Corresponding Author: Kolthoum Missaoui. Email:
(This article belongs to the Special Issue: Materials and Energy an Updated Image for 2021)
Fluid Dynamics & Materials Processing 2023, 19(4), 1067-1081. https://doi.org/10.32604/fdmp.2022.021969
Received 16 February 2022; Accepted 25 May 2022; Issue published 02 November 2022
 View Full Text
 Download PDF
Abstract
A study is conducted on the performances of a solar powered continuous-adsorption refrigerator considering two particular days as references cases, namely, the summer solstice (June 21st) and the autumn equinox (September 21st). The cooling capacity, system performance coefficient and the daily rate of available cooling energy are assessed. The main goal is to compare the performances of a solar adsorption chiller equipped with a hot water tank (HWT) with an equivalent system relying on solar collectors with no heat storage module. The daily cooling rates for the solar refrigerator are found to be 102.4 kWh and 74.3 kWh, respectively, on June 21st and on September 21st, using a total collector’s area of 43.47 m2. The corresponding values for the adsorption chiller equipped with a hot water tank of 2 m3 (and using a total collector’s area of 72.45 m2), are 127.1 kWh and 106.13 kWh, respectively.Keywords
Abbreviations
| CPC | Compound Parabolic Concentrator |
| CONF | Configuration |
| HWT | Hot water tank |
| List of Symbols | |
| A | Area, m2 |
| Cp | Specific heat, kJ/kg |
| DCE | Daily cooling energy, kWh |
| I | Solar radiation intensity, Wm−2 |
| Hads | Isosteric heat of adsorption, J/kg |
| Ks | The effective mass transfer coefficient inside the pores, s–1) |
| Lv | Latent heat of vaporization, J/kg |
| M | Mass, kg |
| ma | Adsorbent mass, kg |
| | Mass flow rate, kg/s |
| Qgen | The required heat, W |
| Qev | Cooling capacity of the evaporator, W |
| T | Temperature, K |
| t | Time, s |
| U | Overall heat transfer coefficient, Wm−2K−1 |
| q | Instantaneous uptake, kg/kga |
| q* | Equilibrium uptake, kg/kga |
| Greek Symbols | |
| ηCr | Collector efficiency |
| α, β, φ | logical parameters |
| Subscript | |
| a | Adsorbent |
| ad | Adsorber |
| am | Ambient |
| CA | Cycle Average |
| cd | Condenser |
| chw | Chilled water |
| cw | Cooling water to condenser |
| des | Desorber |
| ev | Evaporator |
| f | Heating/Cooling fluid to desorber/adsorber |
| gen | Generation |
| hw | Hot water |
| in | Inlet |
| out | Outlet |
| r | Refrigerant |
| v | Vapor |
| Cr | Collector |
| suit | Suitable |
Refrigeration is recognized as a key tool for the successful marketing of agricultural products. However, refrigeration systems are unavailable or non-existent among small scale farmers in rural arid areas due to financial constraints and the lack of electricity supply. Tons of products are wasted every year.
Furthermore, classical electrical technologies use non-ecological refrigerants, which have negative impacts on the environment.
In this context, using solar sorption refrigeration systems and especially adsorption refrigeration system, which has simple construction, uses low-grade and variable heat sources, and uses environmentally friendly refrigerants has attracted attention on agricultural products preservation and building air conditioning.
A cold storage room of 109 m3 operating with an absorption refrigeration machine of 8 kW was proposed by Hmida et al. [1]. This room is located in the south of Tunisia and it is used to store date from March to October after the end of the harvest season. A numerical simulation has been elaborated to determine the absorption cycle performances and the effect of the low pressure and the condensation temperature on the cycle COP. Ntsoane et al. [2] showed experimentally the ability of a discontinuous single bed silica gel adsorption chiller, working in optimum operating conditions, to store fresh mangoes during 21 days at an average indoor air temperature of 15°C and a relative humidity of 90%. A maximum average cooling power of 19.8 W was obtained at the end of the desorption cycle for a 120 min cycle time duration and a hot water temperature of 80°C. The possibility of using solar adsorption air-conditioning chiller directly driven by enhanced compound parabolic collectors (CPC) during summer and direct heating during winter has been investigated on the climate conditions of Orly, France by Clausse et al. [3]. The activated carbon has been used as an adsorbent and methanol as a refrigerant. Results of this work showed the possibility to keep the indoor temperature below 23°C during summer and that the use of this solar installation for air-conditioning and direct heating around the year, is economically attractive.
However, most of the researchers have considered constant driven heat source which, in the case of solar energy, implies adding an auxiliary non solar boiler which add to the cost of the system.
Many researchers pointed out the fact that the adsorption chiller, can be driven by variable heat sources with a wide temperature range [4,5], which constitutes an essential advantage of such chiller.
Therefore, this work focused on predicting the most suitable configuration of a solar adsorption refrigerator to be used to generate low air temperature in a cold storage room used for indigenous fruits and vegetables preservation in rural arid areas. A variable heat source, which depends to the evolution of solar radiation during the day and the chosen configuration, is used to drive the refrigeration system. The use of a heat storage system is considered and analyzed and performances comparisons of two configurations are made.
A solar adsorption refrigeration system is simulated on a dynamic basis using Matlab/Simulink R2017b software. This system is designed to produce cold for a storage room of 231 m3 used to store some kinds of indigenous fruits and vegetables in hot months.
The considered adsorption refrigerator for the present study is a single-stage 2-bed silica gel/water adsorption chiller. The simplicity of this technology, its feasibility in low heat temperature and its adaptable cold production to different refrigeration needs including the studied system have been proven in several studies [6–9].
Fig. 1 presents a schematic diagram of the solar adsorption refrigeration system. A two-bed adsorption chiller consists of an evaporator, a condenser, an expansion device, and two adsorption beds that can either be adsorber or desorber depending on their operating mode. A detailed operating process description of the two-bed adsorption refrigerator was presented in a previous study [10].
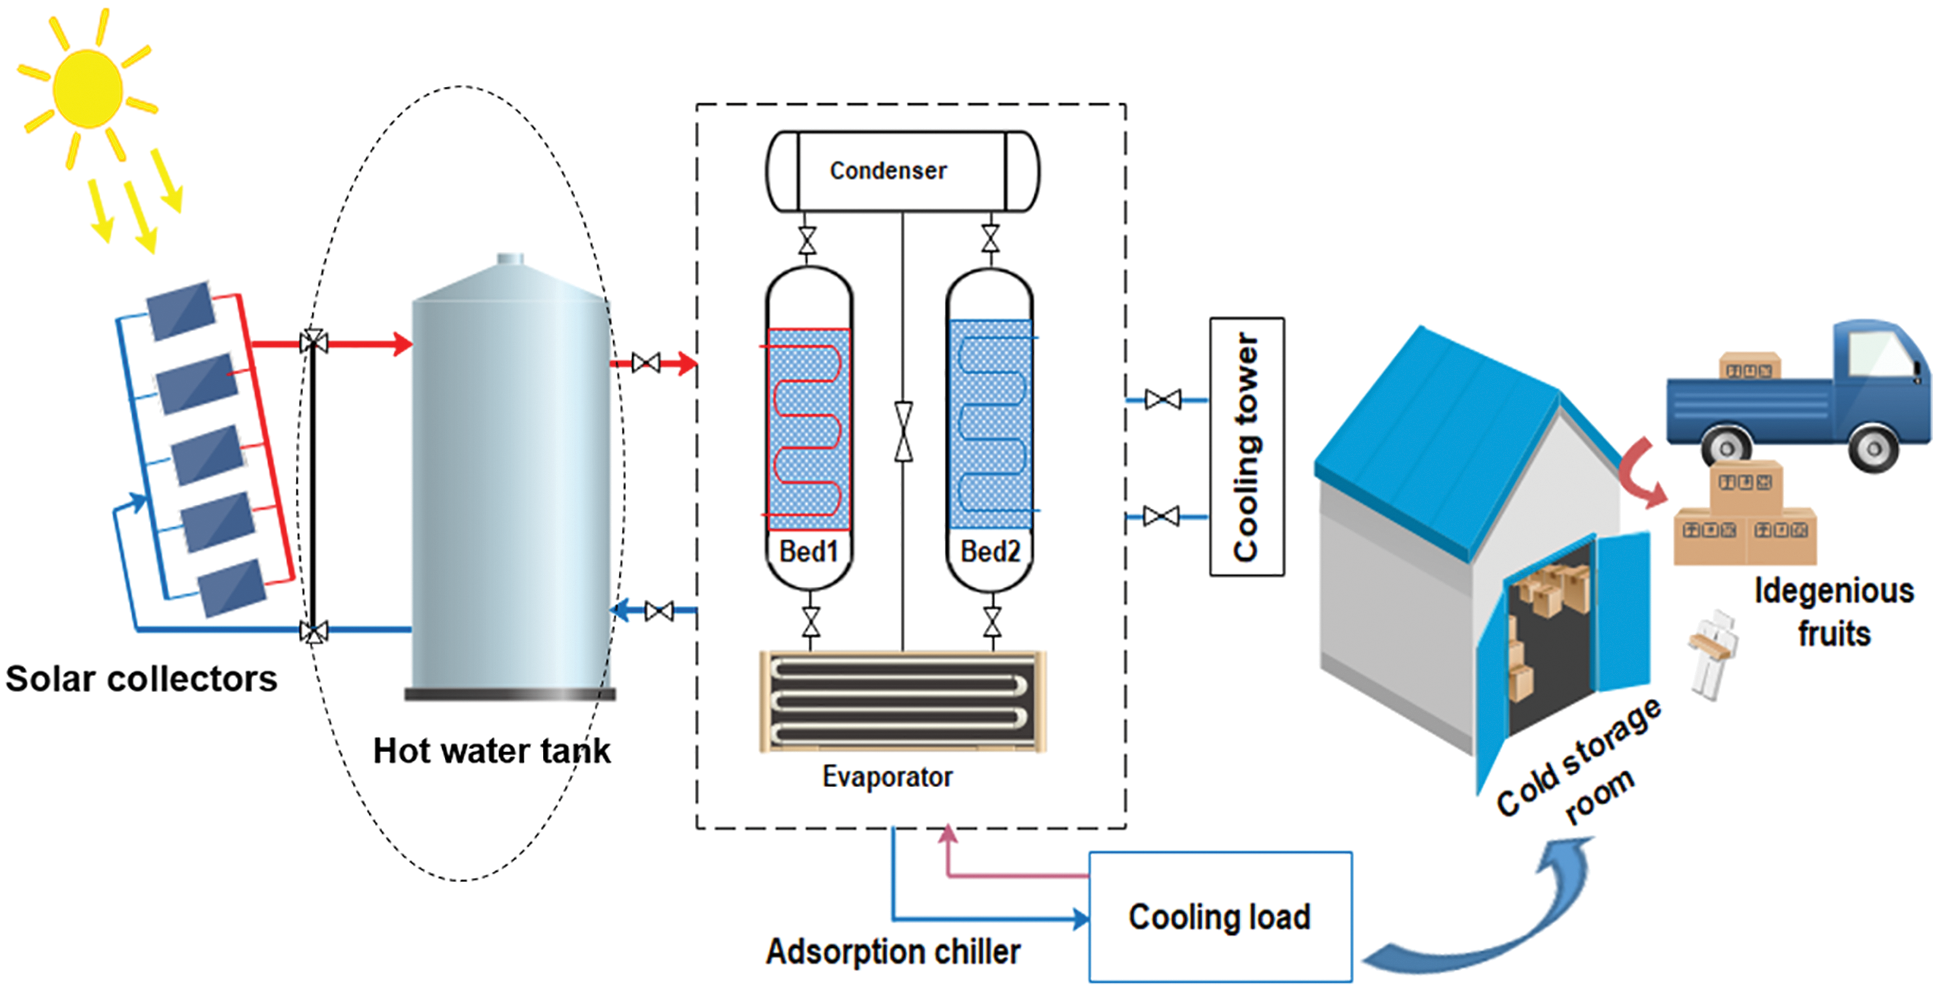
Figure 1: Schematic diagram of the studied 2-bed solar adsorption refrigeration system
Solar radiation is the source of heat, which is harvested by Compound parabolic collectors (CPC) and then transferred to the adsorption refrigeration system.
Silica gel/water adsorption refrigeration systems require a heat driving temperature in a range of 55°C to 95°C [9,11].
Two configurations are studied; the first one (CONF1) consists of a two-bed adsorption refrigerator directly driven by solar collectors. In this configuration, the outlet heating fluid from the solar collector is directly connected to the chiller to heat up the desorber as the system heating source.
The second configuration (CONF2) is equipped with a hot water tank. In this configuration, the heated fluid from the solar collector heats up the hot water tank which is used as the refrigeration system heating source. In this case a regulation system is used to ensure that the heat removal process from the HWT to the adsorption chiller for heating up the desorber intervenes only when the value of the suitable driving source temperature (Tsuit = 55°C) is reached in the HWT. Heat supply to the refrigeration system continue on demand as long as the temperature of the HWT is higher than Tsuit.
At the beginning of each day heat transfer fluid heats up in the solar collectors until it reaches Tsuit, and then the controlled tree way valve permits this fluid to go to the HWT. In the present study, the HWT is assumed to be isolated and perfectly mixed with a homogenous temperature, so there is no temperature stratification effect on it.
An arid rural region in the south of Tunisia (34°76’N, 10°43’E) is selected for the case study.
For climatic data to be used in simulation, two typical days are considered: the summer solstice day June 21st and the autumn equinoxes’ day, September 21st. In fact, these two days are typical of the period when the need for refrigeration is important.
Fig. 2 presents the simulated daily evolution of the ambient temperature and solar radiation over these days. As shown the radiation intensity increases very quickly during the day and it is above 400 W/m2 in the large part of the daytime. This leads to high ambient air temperatures, hence a greater need for
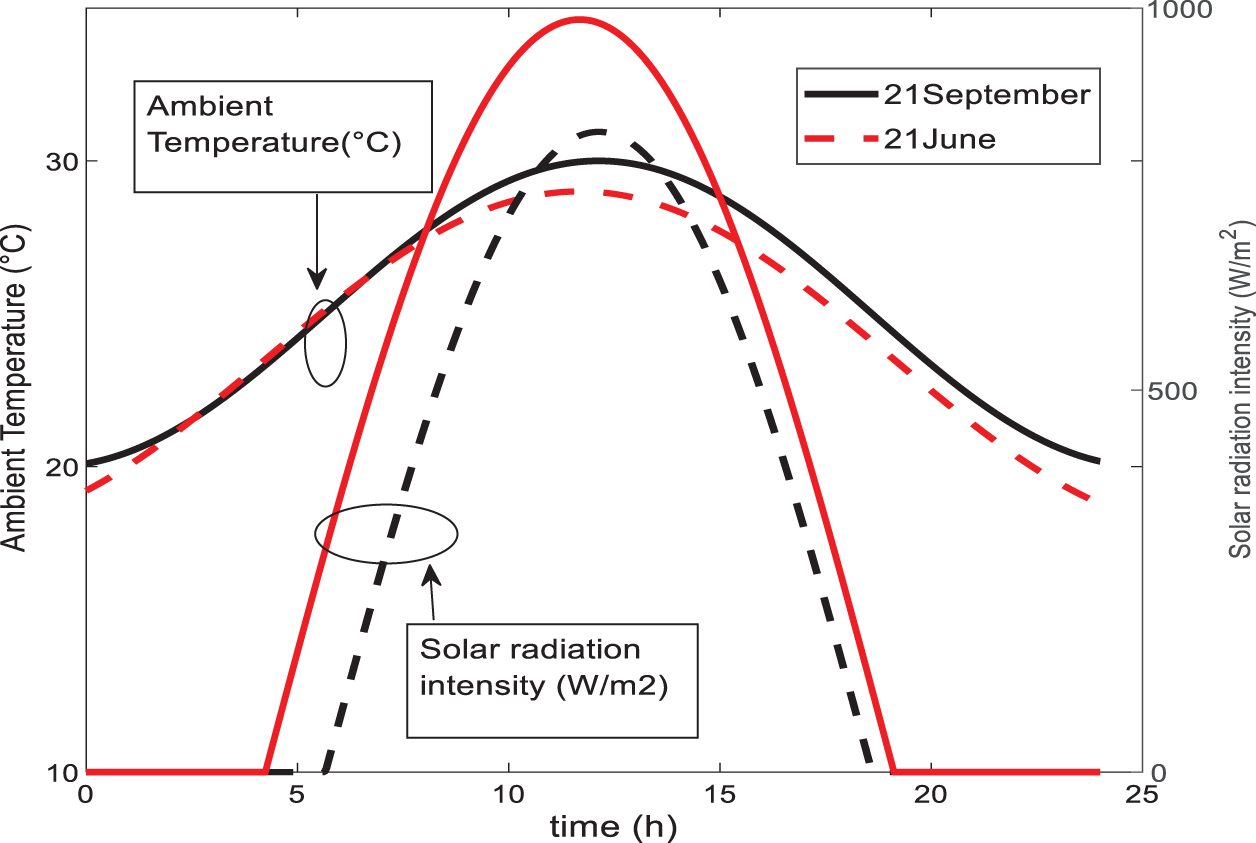
Figure 2: Evolution of the climatic data over the 2 referential days
cooling. The maximal solar flux density received by the CPC solar collector field on June 21st and on September 21st are 985 and 838 (W/m2) respectively.
LMTD method is used to estimate heat transfer to the solar collector, desorber/adsorber beds, evaporator, and condenser whereas the Linear Driving Force (LDF) model is used to describe the adsorption/desorption kinetics are modelled using the Linear Driving Force (LDF) model set up by Chihara et al. [12–14].
The Linear Driving Force (LDF) equation is used to estimate the adsorption isotherms of the silica gel/water pair:
The modified Freundlich equation is used to calculate the equilibrium adsorbed amount ( q* ) [14].
4.2 Energy and Mass Balance Equations for the Refrigeration System
The different equipment of the refrigerator energy balances are given by the following equations:
Adsorption bed energy balance
α is equal to 1 during isobaric adsorption/desorption process and 0 during the switching mode.
β is equal to 0 or 1 during desorption process or adsorption process, respectively.
Condenser energy balance
The energy balance equation for the condenser is described using the following equation:
Evaporator energy balance
The balance equation for the evaporator is given by the following equation:
Mass balance
The water mass balance equation in the evaporator is the following, neglecting the gas phase:
4.3 Energy Balance for the Hot Water Tank
The energy balance equation in the HWT is written as follows:
A series of enhanced compound parabolic concentrator (CPC) developed by Solarfocus-GmbH company with a unit area of 2.415 m2. These solar collectors were arranged in parallel.
The energy balance for each solar collector is given by the following equation:
• Without hot water tank:
φ is 1 during daytime and 0 at nighttime.
• With hot water tank
where the collector efficiency is calculated as a function of the collector inlet temperature, ambient temperature and solar radiation [3,15]:
In this study, the assessment parameters of the energetic performance are the cyclic averaged cooling capacity (CACC), the solar coefficient of performance (CACOPsol) and the thermal performance coefficient CACOPth. The daily performance indicator is the daily cooling energy production (DCE).
These parameters are evaluated using Eqs. (13)–(16):
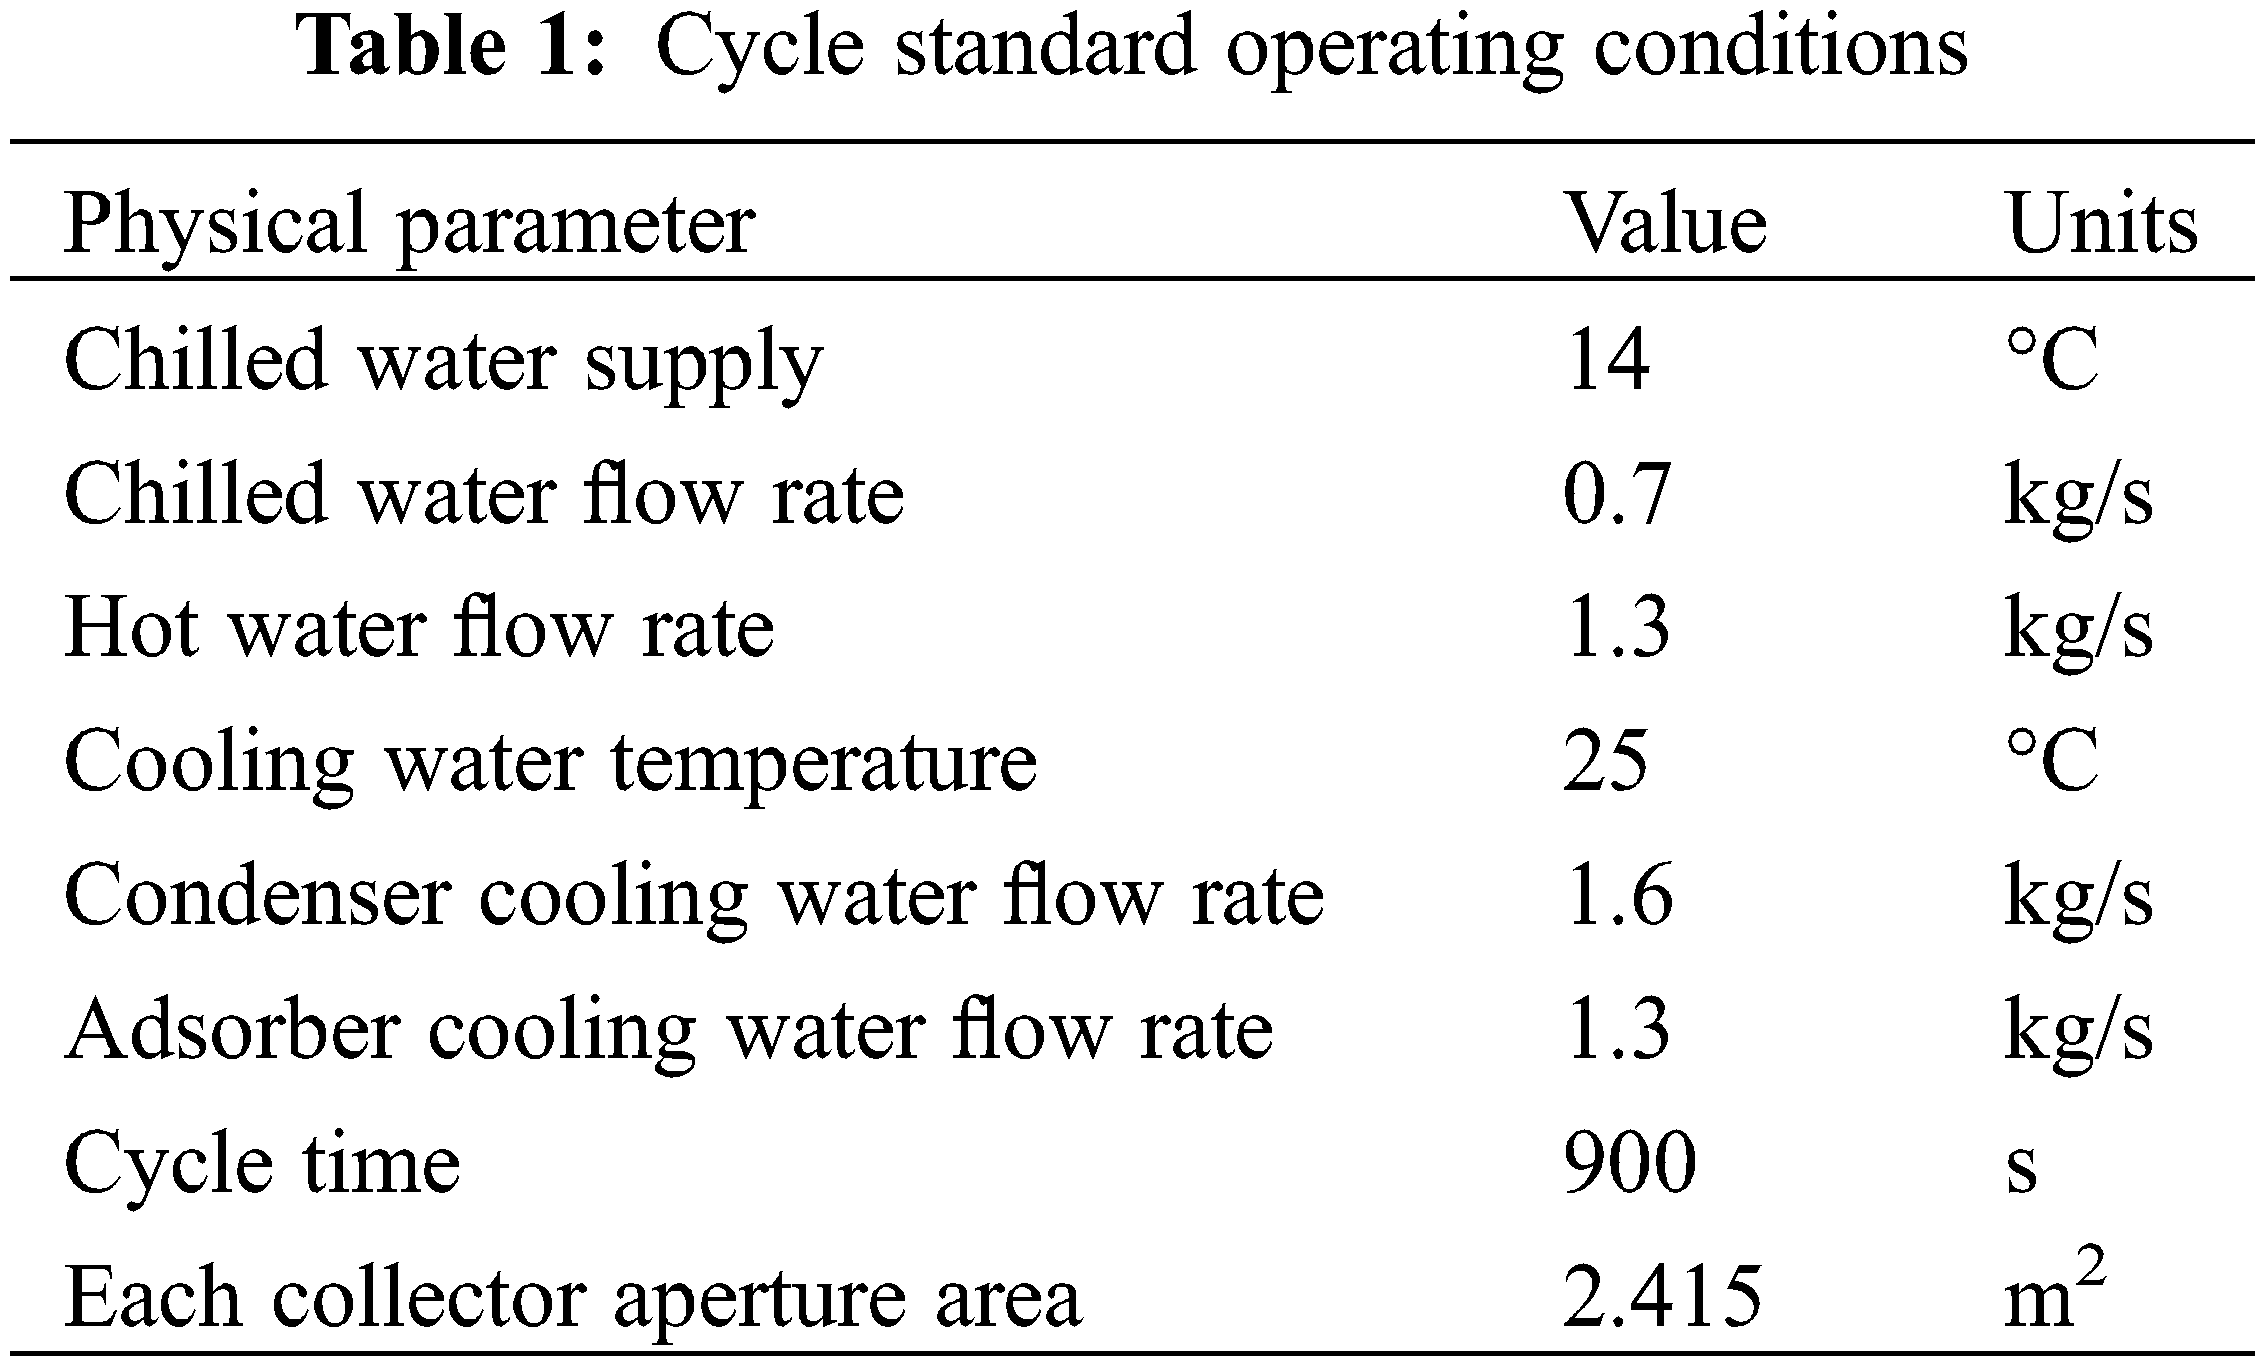
The standard operating conditions of the system are furnished in Table 1.
The proposed mathematical model was firstly validated using experimental data from the literature for a two-bed adsorption chiller operating with a constant heat source temperature [16]. As reported in the previous study [10], good agreement was found between experimental and simulation results.
Fig. 3 shows the temperature profiles of the hot water at the outlet of the CPC collectors obtained by CONF1 on the two typical days. The driving heat source flows from 18 CPC collectors (each 2.415 m2) offering a total area of 43.47 m2. It is observed that, the temporal profiles of hot water temperature at the outlet of solar collectors (desorption bed inlet) have a cyclical appearance because it is directly connected to the refrigerator. It reaches maximum values at peak hours near to 82°C at 12:15 and 73°C at 12:45 in 21st June and 21st September, respectively.
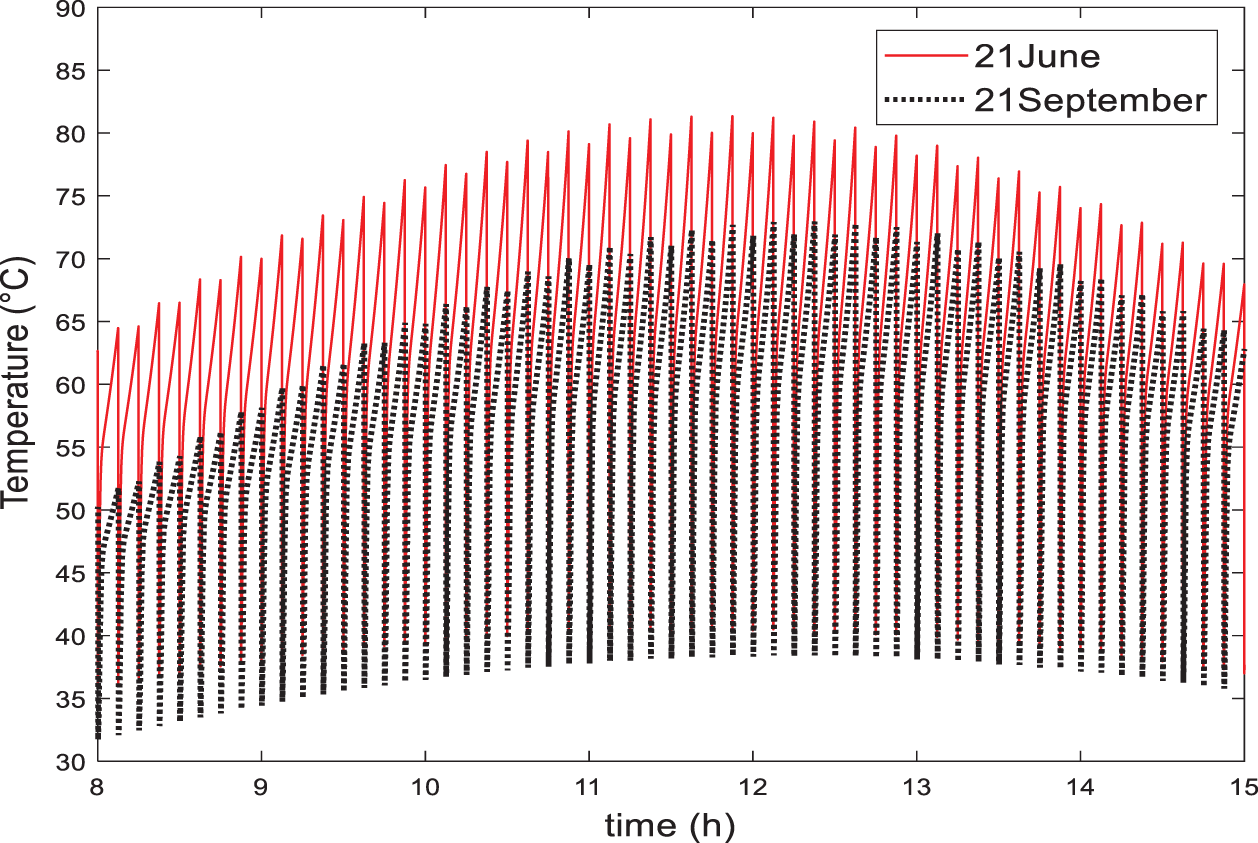
Figure 3: Temporal histories of hot water temperature at the outlet of CPC collectors without HWT for the 2 referential days
The thermodynamic performances of the adsorption system (CONF1) are reported in Fig. 4. The inlet hot water temperature varies as solar radiation intensity varies from morning to the evening. It is important to investigate the effect of the inlet hot water temperature on the performance of solar adsorption systems. As shown, the system performances increase with increase in the hot water inlet temperature to the desorber causing the bed to desorb more which increases its potential to adsorb. The cyclic averaged cooling capacity, peaks at 11.73 and 9, 94 kW, a maximum average cyclic coefficient of performance of 0.43 and 0.425 and maximum CACOPsol of 0.276 and 0.275 are obtained at 12:15 and 12:45 respectively for 21st June and 21st September.
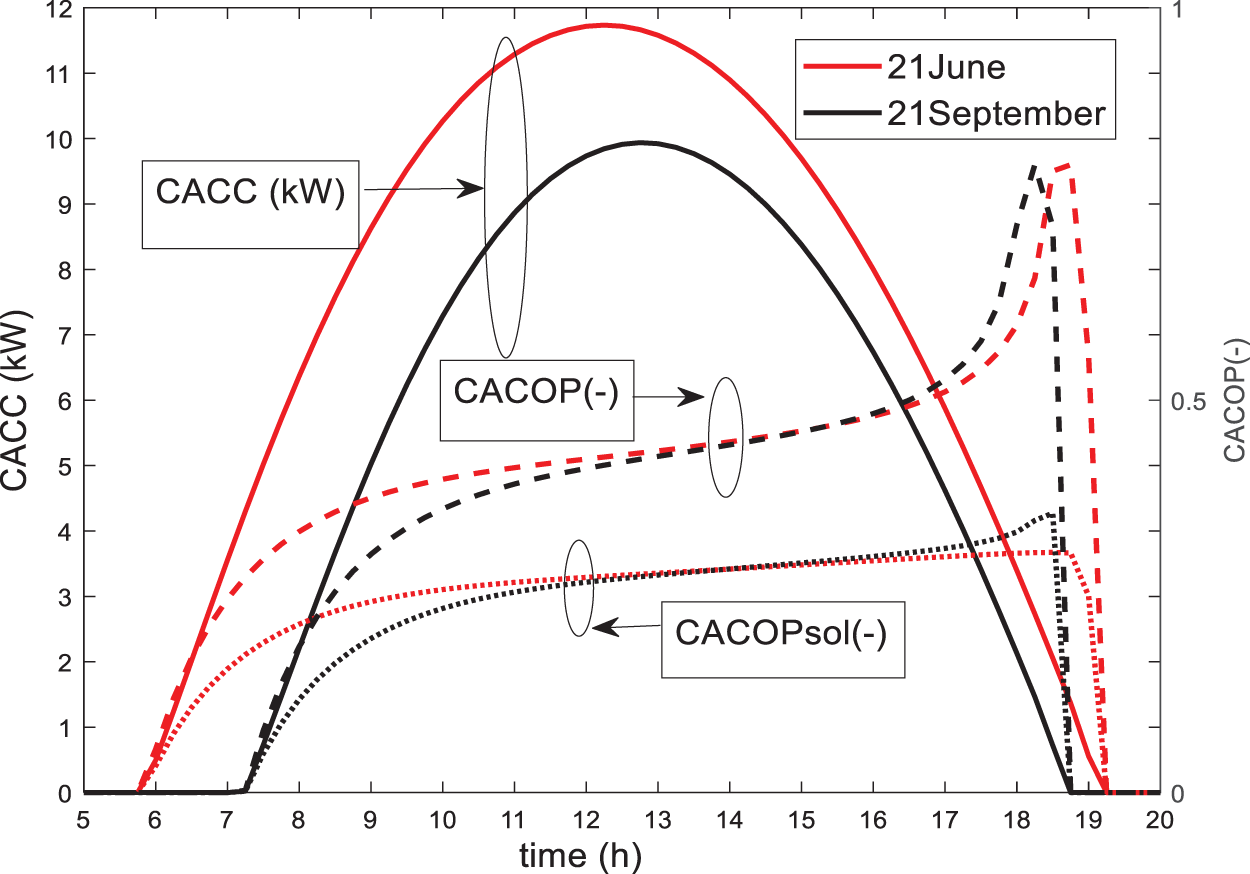
Figure 4: Time variation of the performance of Silica gel/water adsorption system directly driven by 18 CPC collectors
It has to be noticed that, thanks to the direct coupling with CPC collectors, the system produces cooling for most of the daytime, the adsorption refrigerator cooling capacity reaches 2 kW as early as 6:30 and 8:00 for 21st June and 21st September respectively.
The solar refrigerator with CONF1 can provide cooling from 5:45 to 19:15 on 21st June and from 7:15 to 18:45 on 21st September.
Without HWT and by using a total collector’s area of 43.38 m2, the solar adsorption refrigerator produces daily cooling energies of 102.4 and 74.3 kWh respectively on 21 June and 21 September.
When a hot water tank of 1 m3 is coupled with the solar refrigeration system (CONF2), as shown in Fig. 5, the temperature profiles of hot water at the outlet of the hot water tank (desorption bed inlet) present near uniform curves.
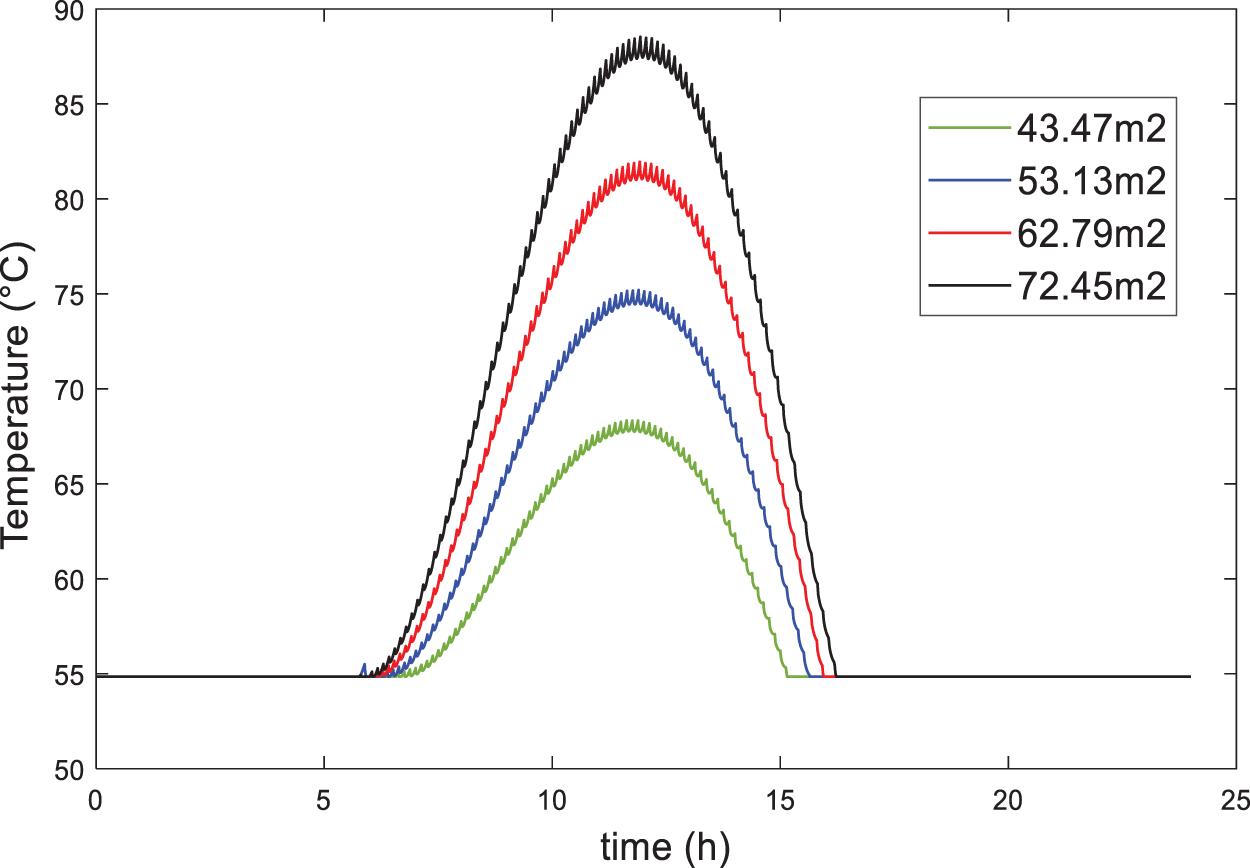
Figure 5: Temperature profile of the hot water tank on 21st June for different solar collector area
As depicted in this figure, in the case of using the same total area of solar collectors as used in CONF 1 (43.47 m2), the HWT temperature (desorption bed inlet temperature) values range between 55°C and 68°C during the system operation, which are lower than the CPC outlet temperature in CONF1.
As a result, with the same collector area, the cooling capacity produced by the solar refrigerator equipped with HWT on 21st June (Fig. 6) is lower than the CACC produced by CONF1 on the same day.
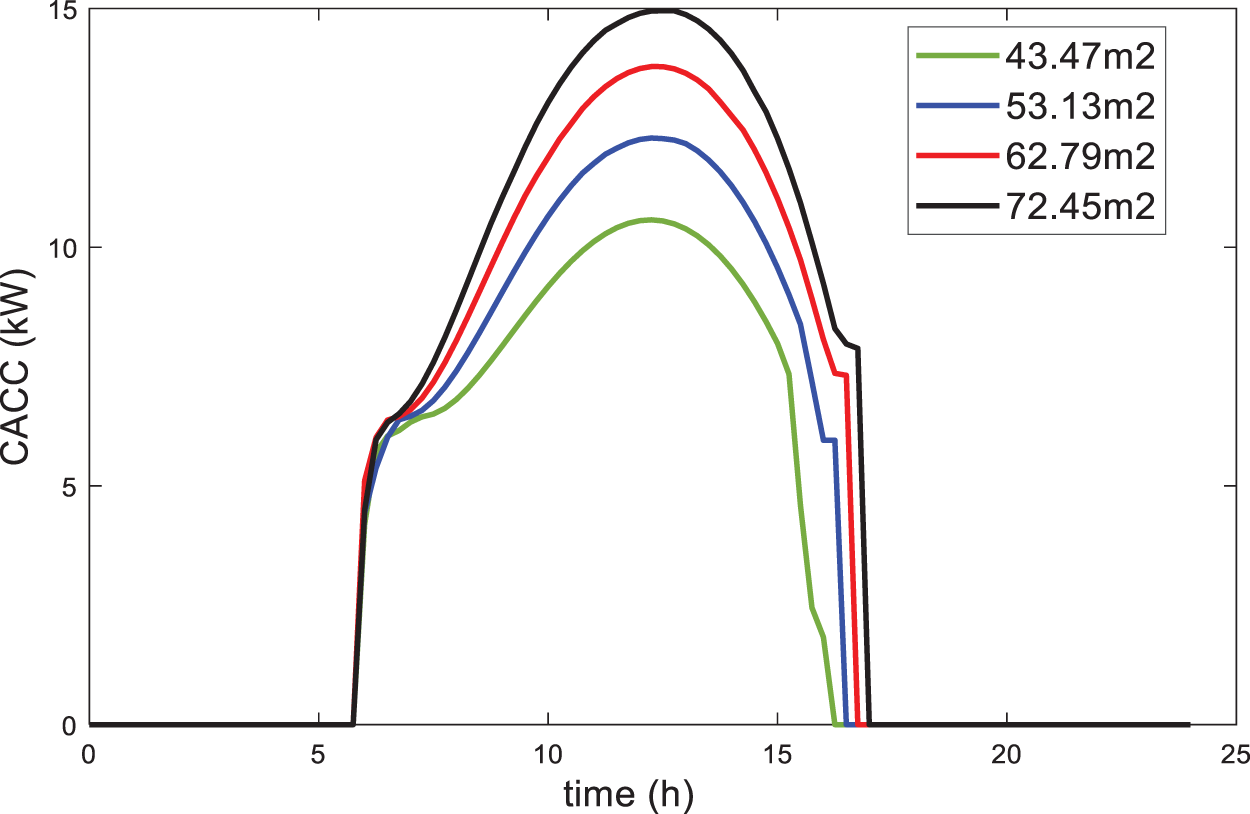
Figure 6: Time variation of the system CACC with different total solar collector area
5.1 Influence of Solar Collector Area Variation
Figs. 6 and 7 describe the CACC and DCE obtained for four collector areas of 43.47, 53.13, 62.79 and 72.45 m2 on 21st June.
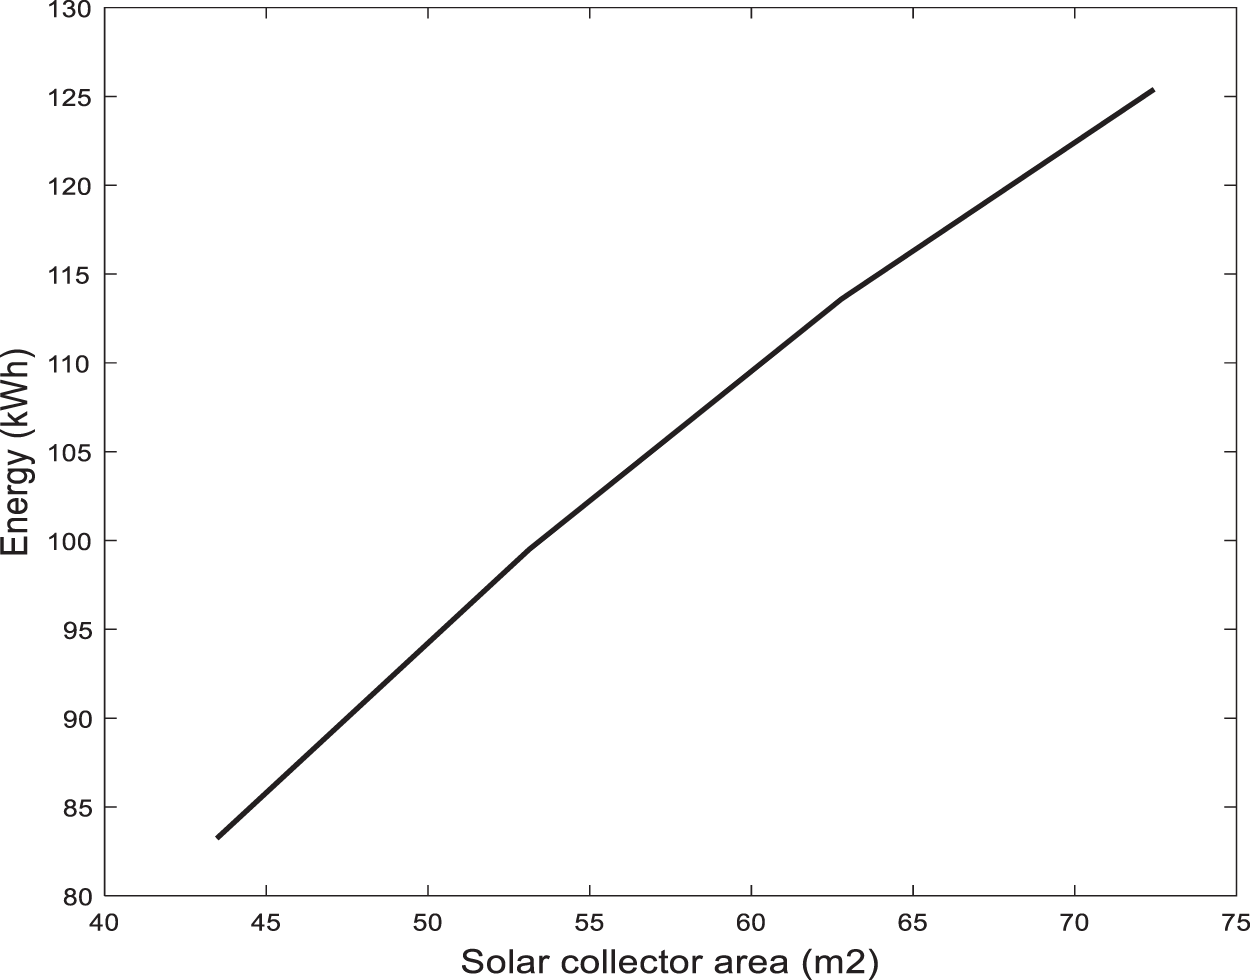
Figure 7: Effect of the total collector area variation on the daily cooling energy production for the considered refrigeration system with a HTW of 1 m3
As the total solar collector area increases; HWT temperature and the duration of cold production (system operation) increase which results in the increase of the cooling capacity and the daily cooling energy production.
With total collector area of 72.45 m2, a maximum CACC of 14.95 kW is reached at 12:15 and a maximum daily cooling energy of 125.5 kWh is produced.
5.2 Effects of Hot Water Tank Capacity
The simulation is hereafter conducted based on a total collector area of 72.45 m2 and using the climatic conditions of 21st June.
The hot water tank volume is a very important factor in optimizing the system performances.
The effect of tank volume on the evolution of the HWT temperature and the averaged cooling capacity throughout the day are illustrated in Figs. 8 and 9. As expected, the hot water temperature decreases as the HWT volume increases which results in the decrease of the CACC. However, the duration of system operation increases with the increase of the HWT capacity. The average refrigerating capacity reaches its maximum value with the hot water tank capacity of 0.5 m3 and the longest cold production period is over 13 h with 3 m3 HWT.
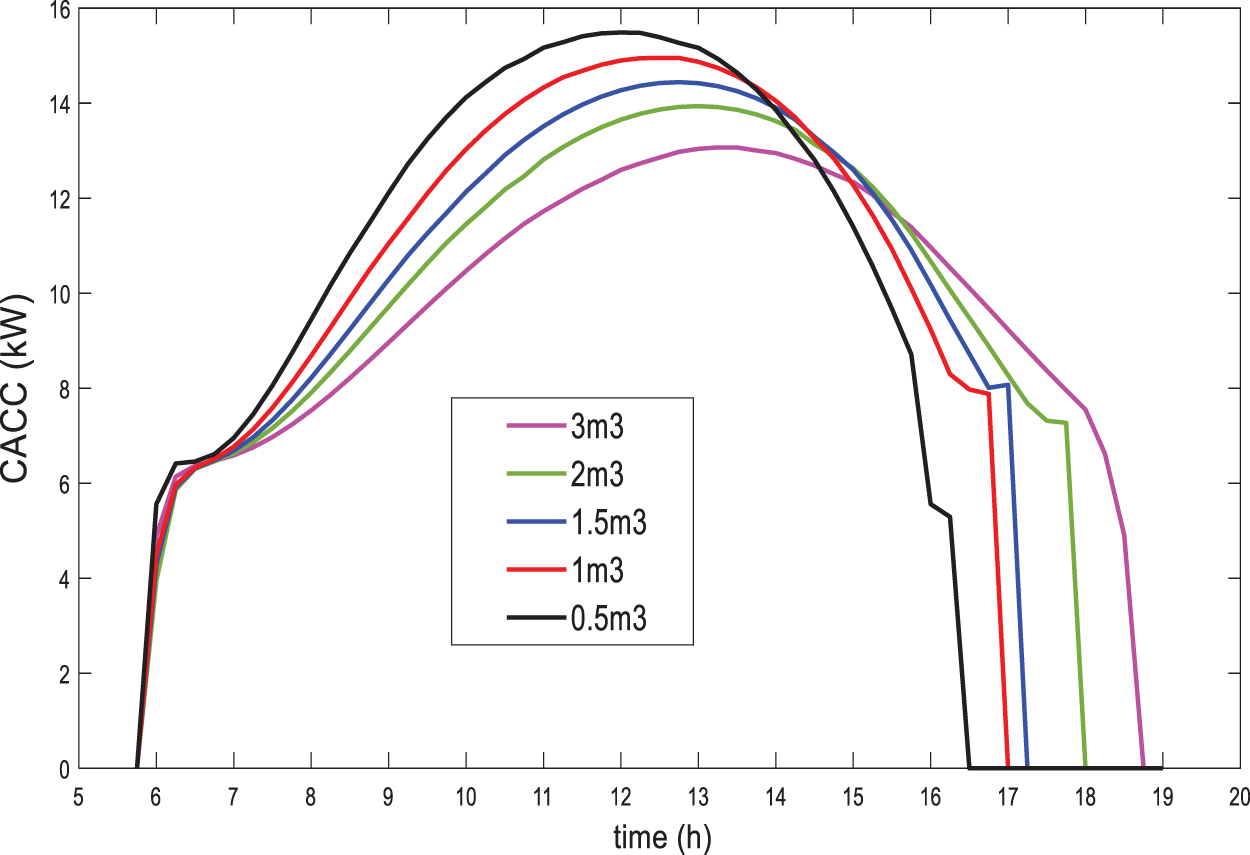
Figure 8: The average cooling capacity on 21st June with different HWT volume. Collector area = 72.45 m2
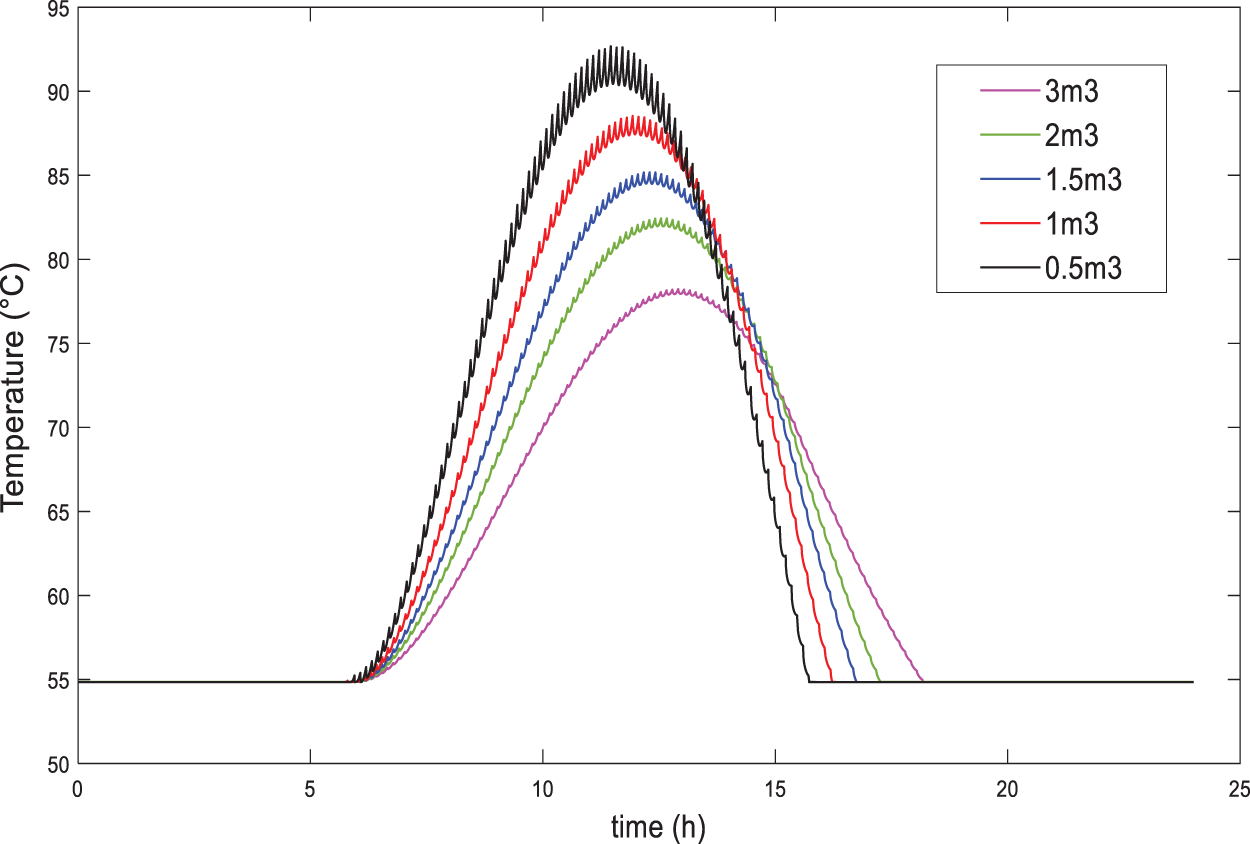
Figure 9: Time variation of the HWT temperature with HWT capacity. Collector area = 72.45 m2, 21st June
Fig. 10 presents the cooling energy produced on 21st June with the different HWT volumes which increases from 123.38 kWh by using 0.5 m3 HWT volume to 127.6 kWh with 3 m3 HWT.
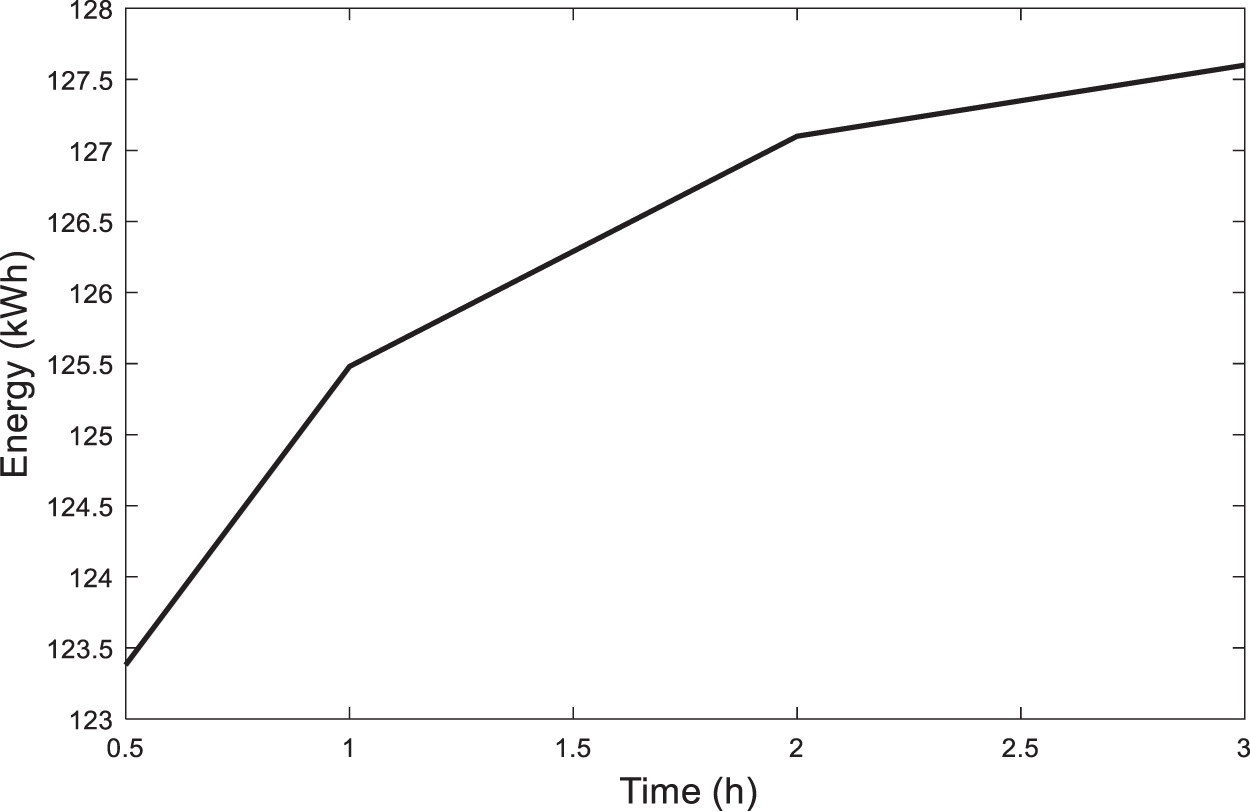
Figure 10: Effect of hot water tank capacity on the daily cooling energy production
The effect of the hot water tank capacity on the DCE production decreases when the tank volume increases from 2 m3 HWT to 3 m3 HWT and a near constant DCE is observed. As a result, a HWT of 2 m3 is chosen in the CONF2.
Moreover, the hot water produced with 2 m3 HWT and 72.45 m2 total solar collector area has the same range as the averaged hot water temperature used to drive the refrigerator in CONF1 with a maximum hot water temperature to the desober over 82°C. As a result, this HWT volume and this total collector area are chosen in CONF2.
Figs. 11 and 12 present the performance of CONF2 on the two typical days; 21st June and 21st September.
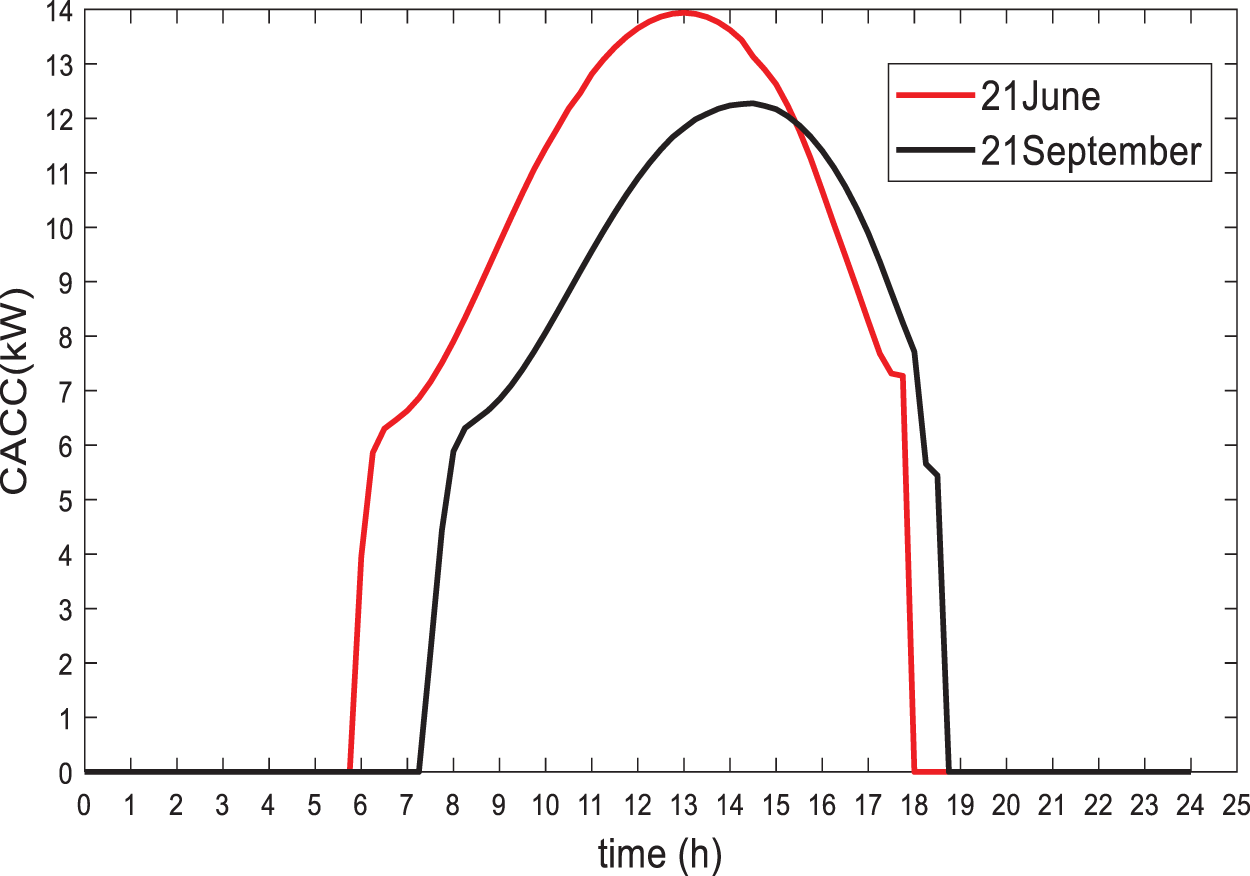
Figure 11: Time variation of the system average cooling capacity on 21st June and 21st September (hot water tank capacity: 2 m3 and solar collector area: 72.45 m2)
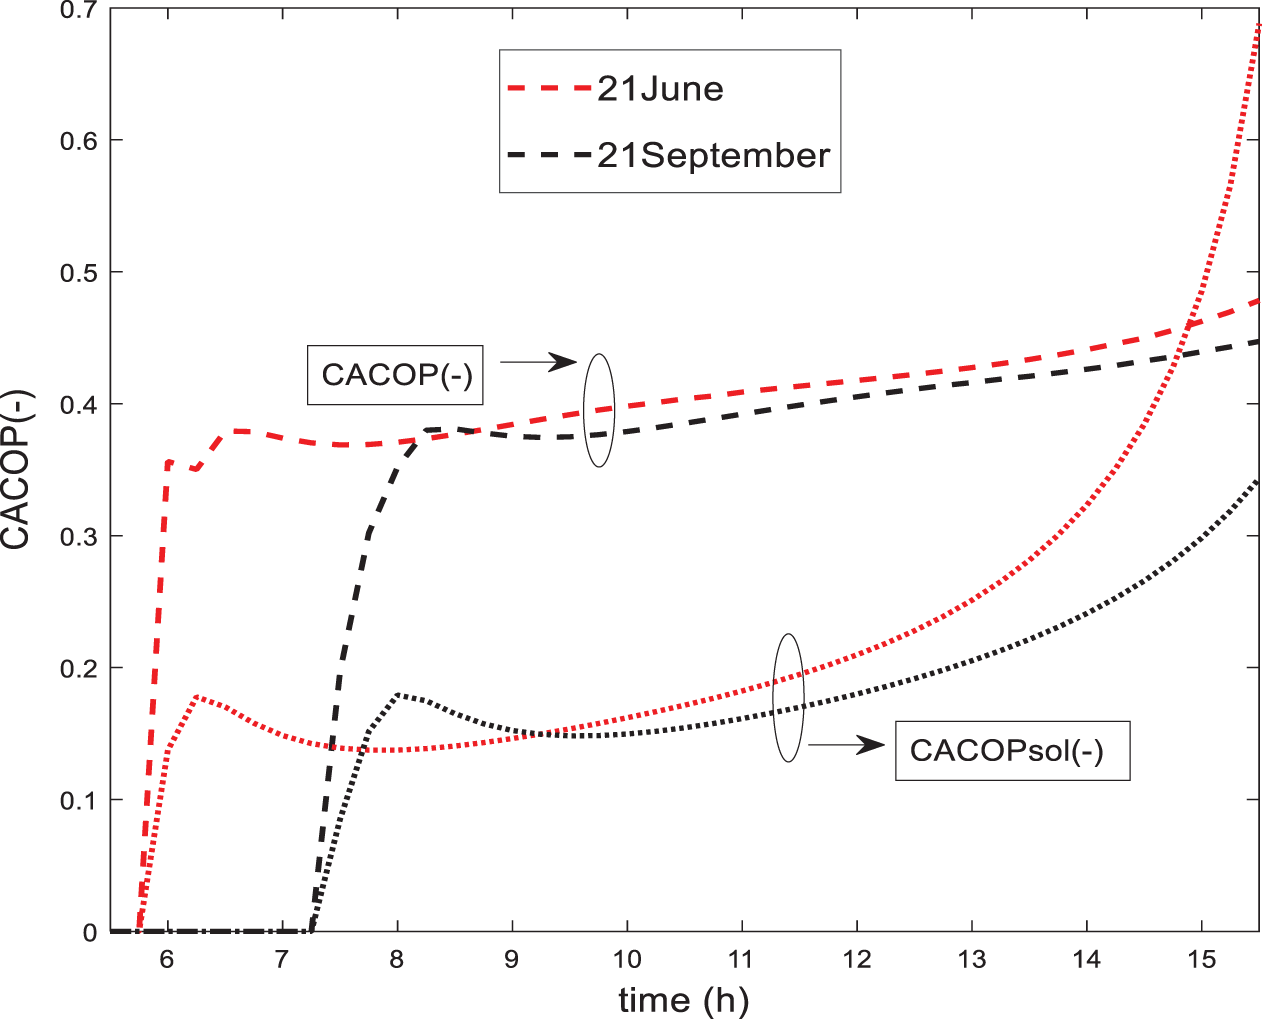
Figure 12: Time variation of the system average COP on 21st June and 21st September (hot water tank capacity: 2 m3 and solar collector area: 72.45 m2)
A maximum CACC of 13.92 kW and 12.28 kW, a maximum cyclic average coefficient of performance of 0.43 and 0.432 and maximum CACOPsol of 0.265 and 0.266 are obtained at 13:15 and 14:30 respectively for 21st June and 21st September.
It must be noticed that even when the system is equipped with the HWT, the refrigerator can provide cooling for most of the daytime (from 5:45 to 18:00 on 21st June and from 7:15 to 18:45 on 21st September).
5.3 Comparative Energy Analysis
The corresponding daily cooling energy of the analyzed systems on the two typical days are presented and compared respectively in Fig. 13.
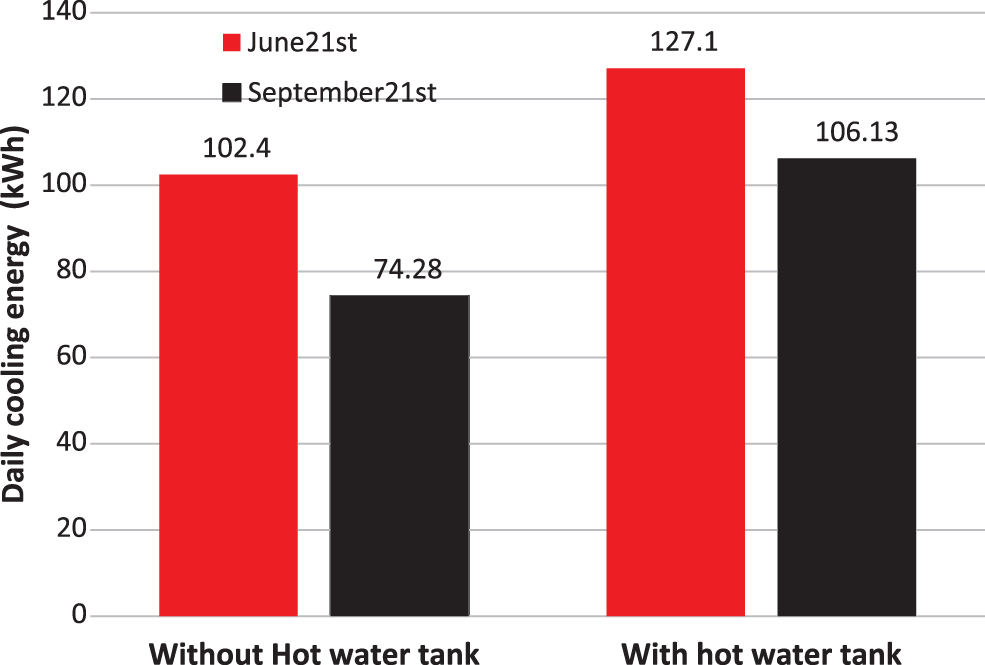
Figure 13: Daily cooling energy comparison of system with HWT and system without HWT
The DCE produced by CONF2 in 21st June and 21st September is higher than DCE produced by the system directly driven by CPC collectors on the same days.
In CONF1 102.4 and 74.3 kWh of daily cooling energy are produced respectively on 21 June and 21 September using a total collector’s area of 43.47 m2. While 127.1 and 106.13 kWh are produced respectively for the two typical days, by the adsorption chiller equipped with a hot water tank of 2 m3 and using a total collector’s area of 72.45 m2.
The dynamic performances of two configurations of solar adsorption refrigeration system were studied; when the chiller is directly driven by CPC collectors and when it is equipped with a hot water tank.
Based on the analysis of the simulated results, the conclusions could be drawn as follows:
(1) When the chiller was driven by a near uniform heat source (CONF2), the best performance was achieved.
(2) The system equipped with HWT is more effective than the direct solar coupling; however, it requires more collectors depending on the size of the hot water tank.
(3) A daily cooling energy of 102.4 and 74.3 kWh are produced respectively on 21 June and 21 September by the directly solar driven CPC refrigerator using a total collector’s area of 43.38 m2. While 127.1 and 106.13 kWh are produced respectively for the two typical days, by the adsorption chiller equipped with a hot water tank of 2 m3 and using a total collector’s area of 72.45 m2.
(4) A maximum CACC of 13.92 and 12.28 kW, a maximum CACOPth of 0.43 and 0.432 and maximum CACOPsol of 0.265 and 0.266 were obtained at 13:15 and 14:30 respectively for 21st June and 21st September, with a HWT of 2 m3 and using a total collector’s area of 72.45 m2.
(5) Driven by either a direct solar collectors without HWT or coupling the system with a hot water tank, the chiller can provide cooling for most of the daytime.
(6) As the hot water tank volume increases the duration of cold production increases.
Funding Statement: This research was supported by Campus France in the frame of the PHC-Maghreb 19Mag29 Project. We would like to thank also our Ministries and research units.
Conflicts of Interest: The authors declare that they have no conflicts of interest to report regarding the present study.
References
1. Hmida, A., Chekir, N., Laafer, A., Slimani, M. E. A., Ben Brahim, A. (2019). Modeling of cold room driven by an absorption refrigerator in the south of Tunisia: A detailed energy and thermodynamic analysis. Journal of Cleaner Production, 211, 1239–1249. DOI 10.1016/j.jclepro.2018.11.219. [Google Scholar] [CrossRef]
2. Ntsoane, M. L., Jalali, A., Römer, J., Duewel, K., Göller, C. et al. (2019). Performance evaluation of silica gel-water adsorption based cooling system for mango fruit storage in Sub-Saharan Africa. Postharvest Biology & Technology, 149, 195–199. DOI 10.1016/j.postharvbio.2018.12.004. [Google Scholar] [CrossRef]
3. Clausse, M., Alam, K. C. A., Meunier, F. (2008). Residential air conditioning and heating by means of enhanced solar collectors coupled to an adsorption system. Solar Energy, 82, 885–892. DOI 10.1016/j.solener.2008.04.001. [Google Scholar] [CrossRef]
4. Chua, H. T., Ng, K. C., Malek, A., Kashiwagi, T., Akisawa, A. et al. (2001). Multi-bed regenerative adsorption chiller - improving the utilization of waste heat and reducing the chilled water outlet temperature fluctuation. International Journal of Refrigeration, 24, 2–14. DOI 10.1016/S0140-7007(99)00078-X. [Google Scholar] [CrossRef]
5. Rezk, A., Rezk, M. (2012). Theoretical and experimental investigation of silica gel/water adsorption refrigeration systems (Ph.D. Thesis). University of Birmingham, UK. [Google Scholar]
6. Zhang, X., Dincer, I. (2017). Energy solutions to combat global warming, 33. [Google Scholar]
7. Pan, Q., Peng, J., Wang, R. (2021). Application analysis of adsorption refrigeration system for solar and data center waste heat utilization. Energy Conversion and Management, 228, 113564. DOI 10.1016/j.enconman.2020.113564. [Google Scholar] [CrossRef]
8. Ng, K. C., Thu, K., Chakraborty, A., Saha, B. B., Chun, W. G. (2009). Solar-assisted dual-effect adsorption cycle for the production of cooling effect and potable water. International Journal of Low-Carbon Technologies, 4(2), 61–67. DOI 10.1093/ijlct/ctp008. [Google Scholar] [CrossRef]
9. Alahmer, A., Ajib, S. (2020). Solar cooling technologies: State of art and perspectives. Energy Conversion and Management, 214, 112896. DOI 10.1016/j.enconman.2020.112896. [Google Scholar] [CrossRef]
10. Missaoui, K., Gabsi, S., Frikha, N., Kheiri, A., El Ganaoui, M. (2021). Indigenous fruits and vegetables storage using continuous adsorption refrigeration: A system modelling. AIP Conference Proceedings, 330, 01024. DOI 10.1063/5.0049427. [Google Scholar] [CrossRef]
11. Leveni, M., Manfrida, G., Cozzolino, R., Mendecka, B. (2019). Energy and exergy analysis of cold and power production from the geothermal reservoir of Torre Alfina. Energy, 180, 807–818. DOI 10.1016/j.energy.2019.05.102. [Google Scholar] [CrossRef]
12. Chua, H. T., Ng, K. C., Malek, A., Kashiwagi, T., Akisawa, A. et al. (1999). Modeling the performance of two-bed silica gel-water adsorption chillers. International Journal of Refrigeration, 22(3), 194–204. DOI 10.1016/S0140-7007(98)00063-2. [Google Scholar] [CrossRef]
13. Chihara, K., Suzuki, M. (1983). Air drying by pressure swing adsorption. Journal of Chemical Engineering of Japan, 16(4), 293–299. DOI 10.1252/jcej.16.293. [Google Scholar] [CrossRef]
14. Saha, B. B., Akisawa, A., Kashiwagi, T. (2001). Solar/waste heat driven two-stage adsorption chiller: The prototype. Renewable Energy, 23(1), 93–101. DOI 10.1016/S0960-1481(00)00107-5. [Google Scholar] [CrossRef]
15. Alam, K. C. A., Baran, B., Akisawa, A. (2011). Adsorption cooling driven by solar collector: A case study for Tokyo solar data. Applied Thermal Engineering, 50(2), 1603–1609. DOI 10.1016/j.applthermaleng.2011.09.028. [Google Scholar] [CrossRef]
16. Ghilen, N., Gabsi, S., Messai, S., Benelmir, R., El Ganaoui, M. (2016). Performance of silica gel-water solar adsorption cooling system. Case Studies in Thermal Engineering, 8, 337–345. DOI 10.1016/j.csite.2016.07.002. [Google Scholar] [CrossRef]
Cite This Article
 Copyright © 2023 The Author(s). Published by Tech Science Press.
This work is licensed under a Creative Commons Attribution 4.0 International License , which permits unrestricted use, distribution, and reproduction in any medium, provided the original work is properly cited.
 Downloads
 Citation Tools