
 Submit a Paper
 Propose a Special lssue
 Open Access
ARTICLE

Experimental and Numerical Analysis of Particle Migration and Patterning Behavior in a Gravel Pack
1 Exploration and Development Research Institute, Zhongyuan Oilfield Company, SINOPEC, Puyang, China
2 The University of Manchester, Manchester, UK
3 College of Petroleum Engineering, China University of Petroleum (East China), Qingdao, China
* Corresponding Author: Bobo Luo. Email:
Fluid Dynamics & Materials Processing 2023, 19(4), 911-928. https://doi.org/10.32604/fdmp.2022.022761
Received 24 March 2022; Accepted 13 July 2022; Issue published 02 November 2022
 View Full Text
 Download PDF
Abstract
Due to its long lifespan and high sand-removal efficiency, gravel packing is one of the most applied sand control methods during the recovery of reservoirs with sanding problems. The blockage and retention of injected sand in a gravel pack is a complex process affected by multiple mechanisms. The majority of existing studies based on the phenomenological deep bed filtration (DBF) theory focused on the gravel pack’s overall permeability damage and failed to obtain the inner-pore particle distribution pattern. In this work, experiments and simulations were carried out to reveal the particle distribution in a gravel pack during flooding. In particular, through real-time monitoring of particle migration, the penetration depth and distribution pattern of invaded particles with different gravel-sand particle ratios, fluid viscosities and injection rates could be determined. By simplifying each unit bed element (UBE) into a pore-throat structure with four tunnels (two horizontals for discharge and two verticals for sedimentation), a new network simulation method, which combines deep bed filtration with a particle trajectory model, was implemented. Cross comparison of experimental and numerical results demonstrates the validity and accuracy of the model.Keywords
During the development of reservoirs with high sand production rate and silt content such as heavy oil, hydrate and unconsolidated sandstone reservoirs, sanding is a severe issue that restrict efficient development. Gravel packing completion technique has been widely applied to solve this problem because of its high sand control efficiency and long validity period [1]. For wells with gravel packing operation, the pore blocking caused by particle migration and deposition is a crucial factor affecting well productivity [2,3]. Therefore, it is of considerable significance to clarify particle-plugging mechanism in the porous medium to optimize the gravel-packing design and predict the well productivity.
It is inadequate and inaccurate to describe the physical process of particle transportation in granular media by only applying theoretical and numerical methods considering the non-negligible heterogeneity of pore throat distribution and particle grain size. Therefore, experimental research is indispensable in this study. Previous researchers have studied the plugging and deposition pattern of particles in the granular medium through a laboratory test. Based on these experimental results, the prediction model of the retained particle concentration was established, and a series of empirical coefficients for characterizing the particles plugging in the pore space has been obtained [4–6]. Bigno et al. [7] proposed five fundamental pore-blocking mechanisms and obtained the trends of gravel pack reduction by flooding test. Bedrikovetsky et al. [8,9] conducted laboratory pressure drop measurements and proposed a data processing method for the simultaneous determination of the filtration and formation damage coefficients. Liu et al. [10] conducted a two-dimensional sandbox experiment to quantify the effects of particle and grain sizes on the deposition, and they obtained the result that different diameter ratios may lead to different deposit formation. In addition to the above, many other scholars have characterized the deposition and plugging mechanism of particles in porous media through laboratory experiments.
Nevertheless, the traditional approach is the lack of intuitiveness. Most of the sand-filling pipe or sandbox used in traditional flooding experiments is invisible, and the simulation materials of particles and the porous medium have no color difference. The particle penetration front in the gravel pack cannot be monitored during the experiment. It is hard to separate retained particles from gravels after the experiment as well. Thus, the current study using traditional approach failed to obtain particle distribution in the gravel pack.
The predecessors mainly used the simulation method base on the phenomenological model and trajectory analysis model to study particle transportation characteristics in gravel pack numerically [11]. The phenomenological model describes the macroscopic filtration process by establishing the particle conservation equation and introducing a series of empirical coefficients, which need to be determined experimentally. It is a one-dimensional model based on the average particle concentration in porous media, which requires many experimental parameters and cannot characterize the spatial distribution of particles in the porous medium. The phenomenological model is the most used numerical simulation method presently. Many scholars have proposed the numerical solution of the phenomenological model and the determination method of capture coefficients under various mechanisms [12–18]. Particle trajectory model is also called unit bed elements (UBE) model and was firstly proposed by Payatakes et al. [19–22]. They assume that isotropic arranged porous media can be regarded as a set of interconnected UBE. By determining the geometrical structure of the filtration bed and the flow field characteristics inside the porous media, one can obtain the particle capture efficiency of each UBE. Thus, the filter capture efficiency can be obtained by integration. Although the particle trajectory model takes actual forces that are acting on particles into consideration, the flow complexity of inside the porous media model restricts its application facing large-scale problems [11].
In this study, visual experiments were carried out to study the dynamic distribution of intrusive particles in the gravel pack. Based on the improved particle trajectory model and stochastic algorithm, self-compiled numerical simulation software was developed to simulate the dynamic particle blockage of the gravel bed. In view of the experiments and numerical simulation results, a more intuitive and accurate method for studying dynamic blockage law of gravel-bed was proposed.
2 Visual Experiment of Particle Transportation in the Gravel Pack
As mentioned in the previous section, one of the main reasons why visualization of traditional gravel displacement experiment cannot be realized is that there is no visible color difference between porous medium and particles. To meet the experimental requirements of visible and measurable, the grain size of porous medium and particles in the prototype are enlarged in this experiment. Glass beads are packed in the sand packing tube instead of gravel to form a transparent granular media as well. A particular criterion should be established in the process of hydrodynamic experiment design to ensure a similar flow and particle motion state between the model and the prototype. Therefore, a fixed proportional relationship of physical quantities such as geometrical, kinematical and dynamical quantities is required. For solid-liquid two-phase flow, flow and particle Reynolds criterion, Stokes criterion and Freud criterion are the four dominant similarity criteria in designing experiments.
where, subscript p represents prototype and subscript m represents model; Re and Res are the flow and particle Reynolds number, dimensionless; Stk is the Stokes number, dimensionless; Fr is the particle Freud number, dimensionless; l is the geometric characteristic length, m; ds is the particle diameter, m; ρ and ρs are the fluid and particle density, kg/m3; u and ur are the fluid velocity and relative velocity between solid and liquid phases, m/s; μ is the fluid viscosity, N⋅s/m2.
Because it is impossible to satisfy all the criteria simultaneously during the design of hydromechanics experiment, secondary factors that have less influence on similarity should be neglected [23]. The similarity issue of Reynolds number (Re) can be ignored because the Reynolds number of prototype and model is in the same self-modelling region (Re < 2000). The Froude number (Fr) indicates the ratio of inertia force to the gravity of particles. However, due to the height limitation of the sand-packing tube, the vertical distance that gravity acts on is short, and its similarity can be ignored as well. Therefore, the two criteria that the prototype and model should obey are the particle Reynolds and Stokes criteria.
where, λl is the length similarity coefficient which equals to lp/lm; λv is the velocity similarity coefficient which equals to up/um; λt is the time similarity coefficient which equals to tp/tm.
Fig. 1 shows the set-up of the visual experiment. A peristaltic pump with a flow range of 1–1300 ml/min was used for displacement. The measuring container placing at the outlet collect both the outflow liquid and the produced particles. A clear cylindrical PMMA pipe packed with scale-up glass beads and quartz sand were selected to achieve the visualization of particle migration and blockage in the gravel pack. To ensure the similarity of particle motion between the experiment and real situation during the flooding, the injection rate should determine by the hydrodynamic similarity criterion (seeing Chapter 2.1). The particle penetration depth within the simulated gravel pack was photographed and recorded every 10 min once the flooding began. Once the particle penetration depth is stabilized, open the sand-pack tube from the outlet side and extract the packed gravel and sand particles in sequence. By weighing the mass of glass beads and quartz sand in each section, the distribution of the retained sand mass in the simulated gravel pack can be obtained.
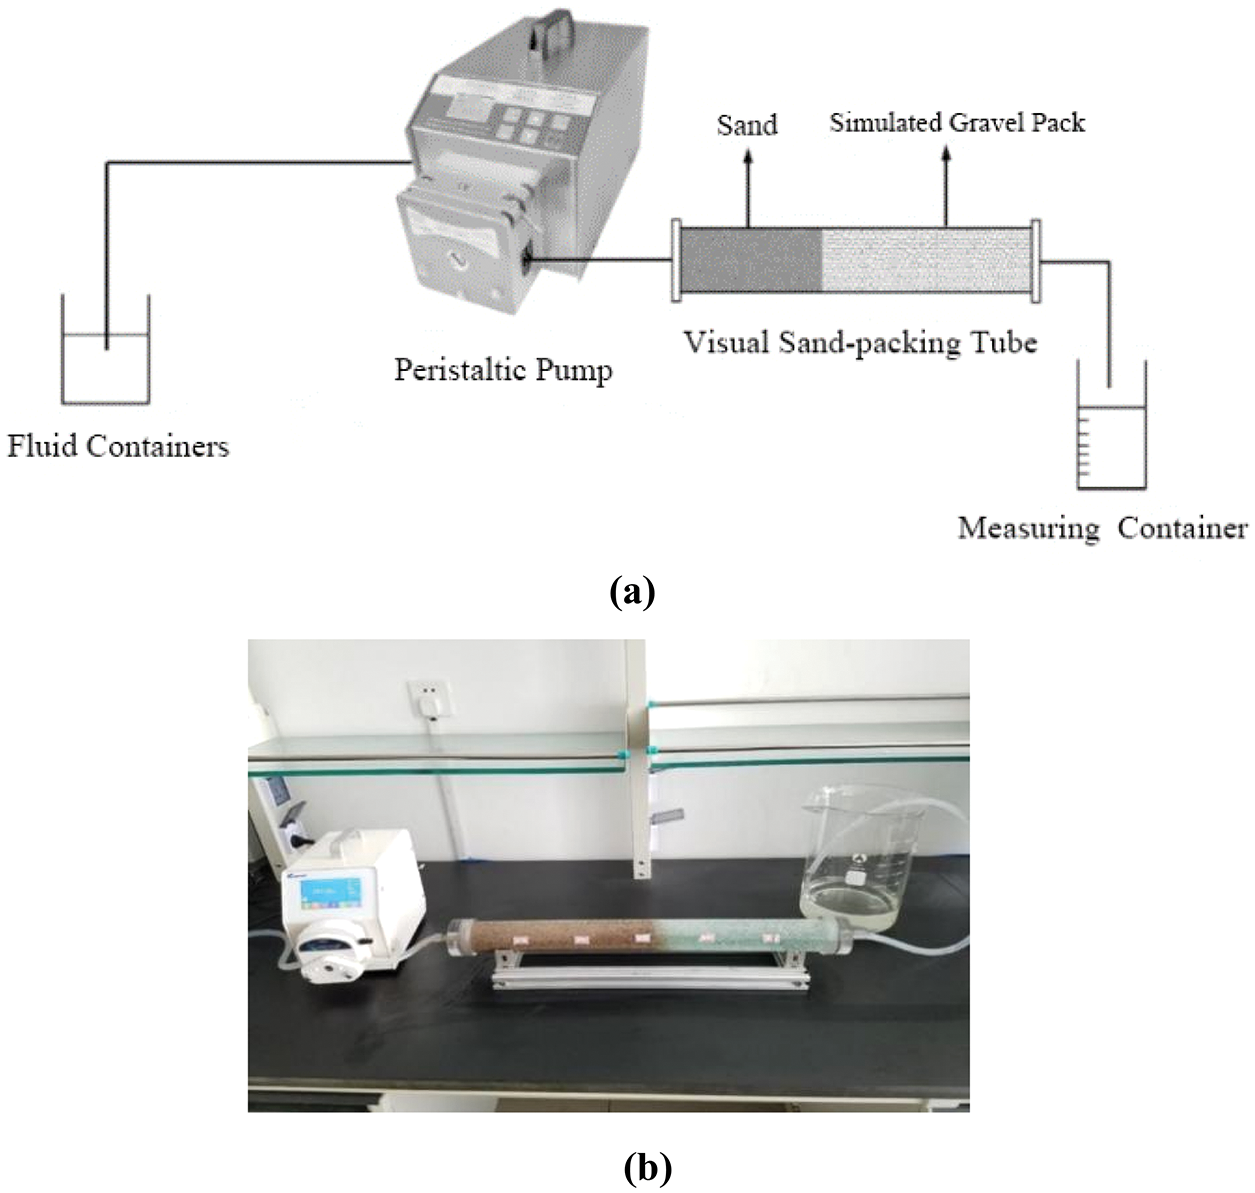
Figure 1: The flowchart and set-up of experimental device
According to the selected similarity criterion, the geometric magnification of the experiment was determined to be ten times. Take sand with 0.1 mm median grain size as an example, the quartz sand with ten times enlarged median grain size was selected to simulate the intrusive sand in a real reservoir, which is 1 mm. The glass beads with specific particle size were selected to simulate gravel packs to ensure the visibility and measurability of intrusive particles. The particle size distribution of the experimental sand sample is demonstrated in Fig. 2. The flooding fluid was polyacrylamide solution, and the viscosity adjustment was achieved by configuring different solutions with various polyacrylamide concentrations.
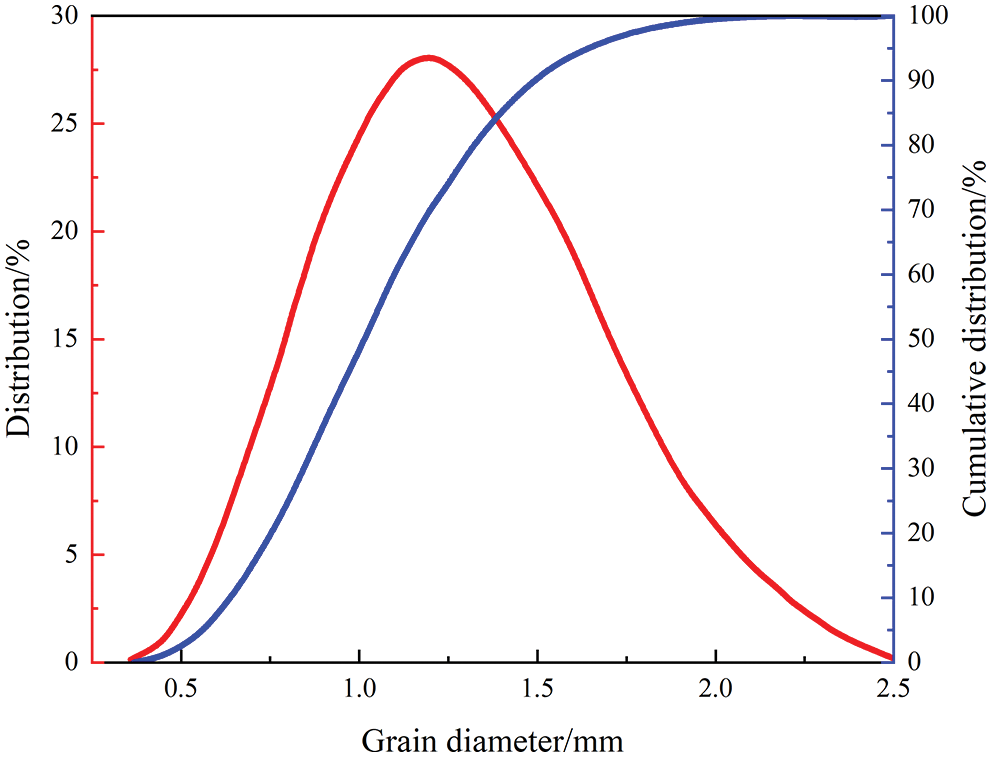
Figure 2: Particle size distribution of the experimental sand sample
The experimental scheme was designed as shown in Table 1.
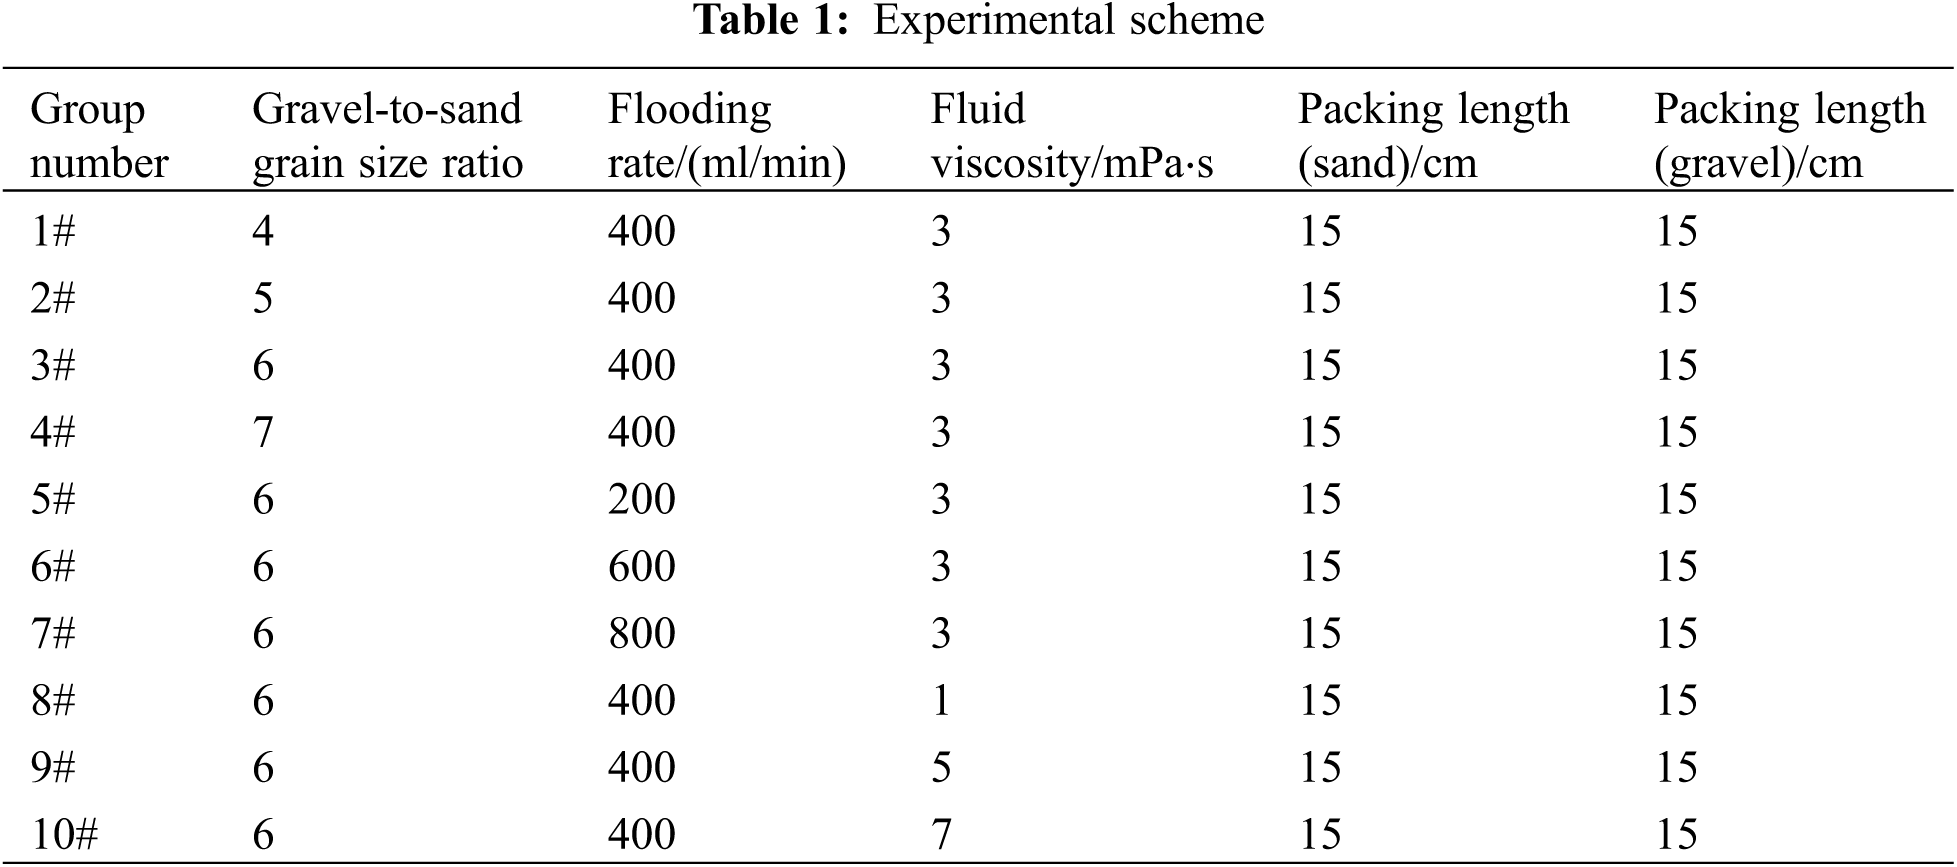
The gravel-to-sand grain size design adopts in this paper mainly refers to the study carried out by Saucier [24]. Taking both conductivity and sand retention rate into account, he proposed that the average grain size of packed gravel used for sand control operation should be 5–6 times of that of the intrusive sand. The design of the injection rate and fluid viscosity refers to the experimental data of Li et al. [5] in the conventional gravel packing displacement experiments.
3 Experiment Results and Analysis
During the experiment, the transportation and distribution of particles in the granular medium were continuously monitored. Take the experimental groups 1 to 4# in Table 1 as an example: the distribution characteristics of particles during the flooding process with different gravel-to-sand grain size ratio are shown in Fig. 3. As the flooding proceed, particles intruding into gravel beds were not evenly distributed. Instead, an oblique front of intrusive sand was observed.
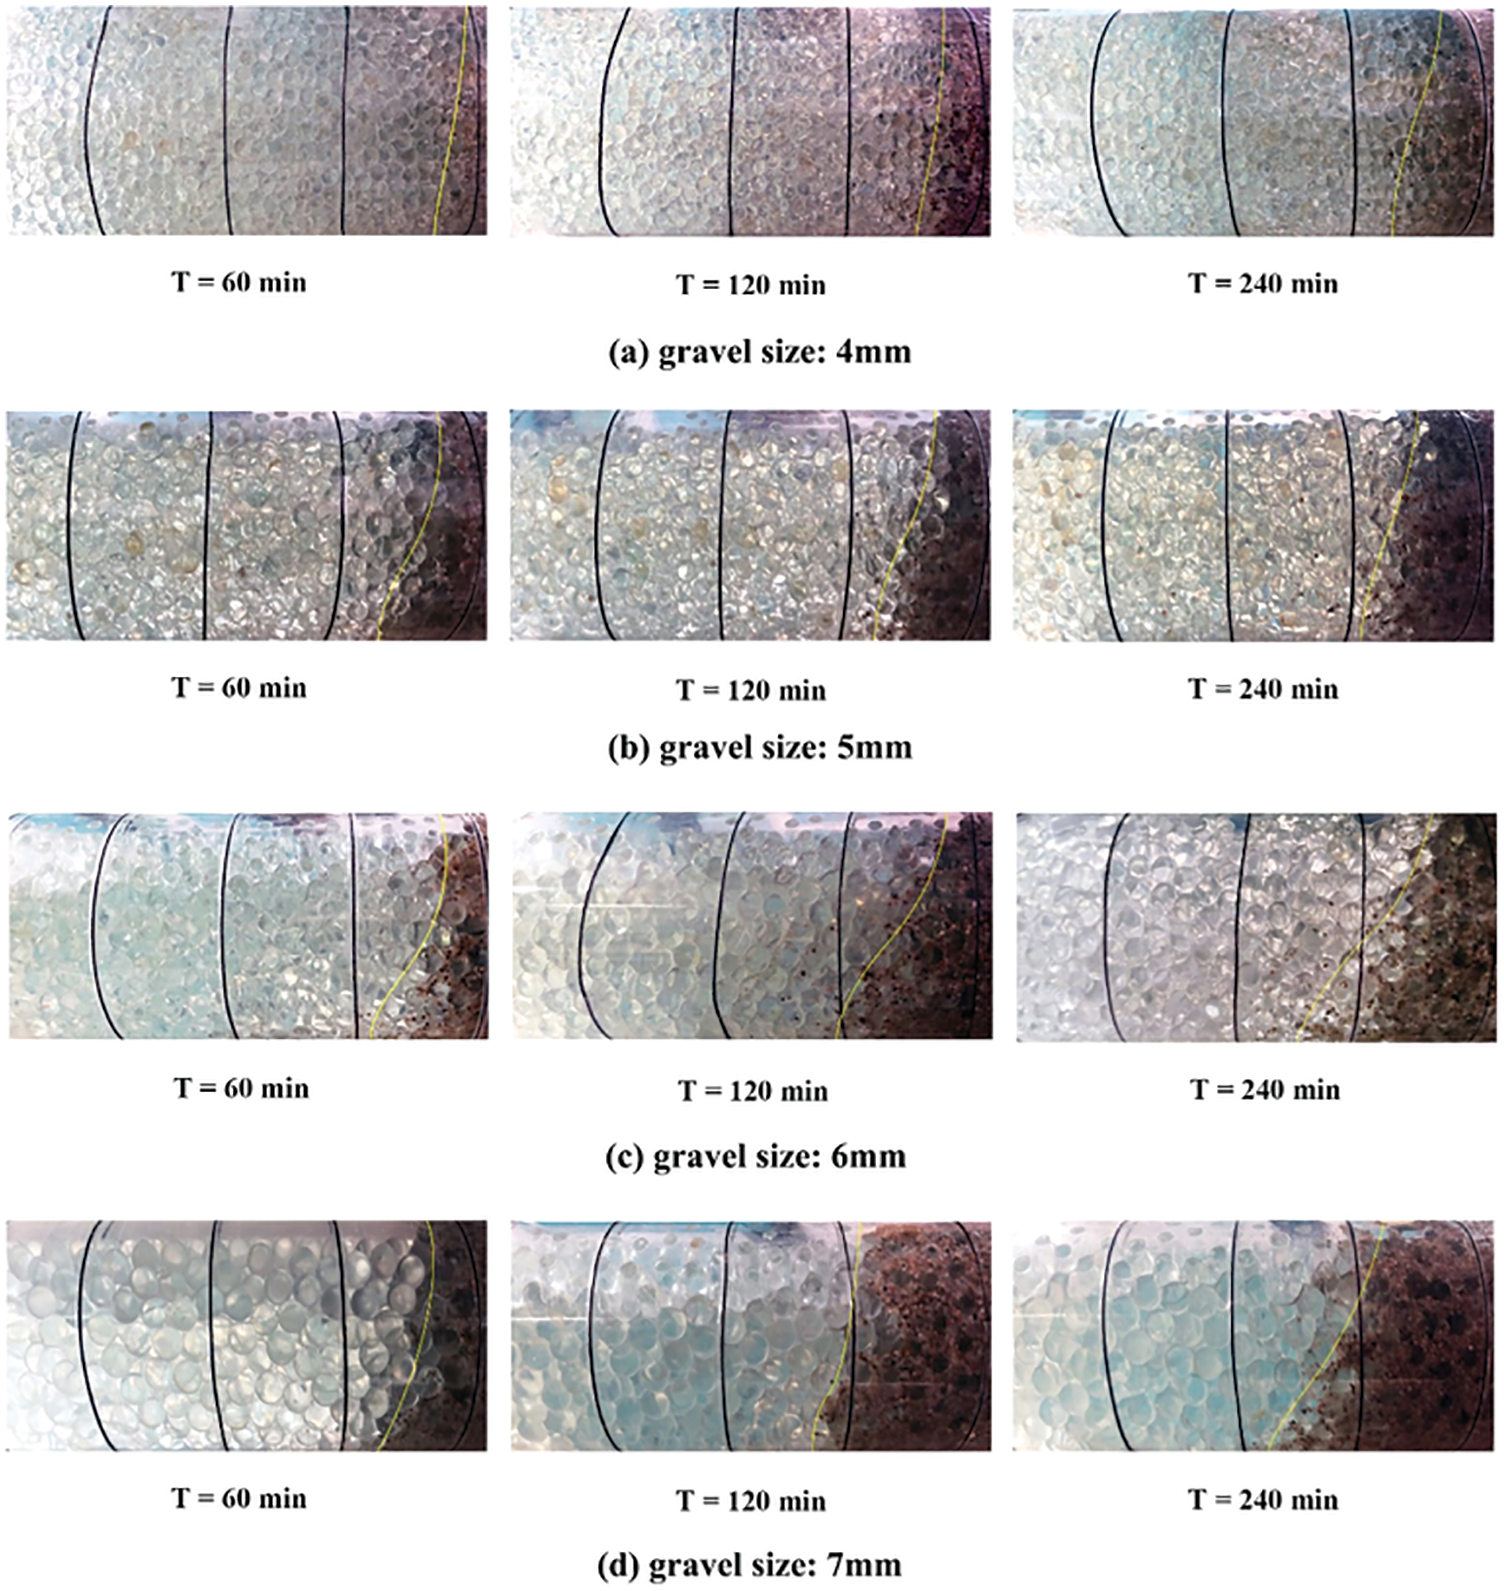
Figure 3: Dynamical monitoring figures of sand distribution in gravel packs affected by G-S ratio
According to the experiment results, which were dynamic particle penetration depth and the mess of the retained particles in the granular medium, the sensitivity analysis of three factors that affect, i.e., gravel particle size ratio, displacement velocity and liquid viscosity, was carried out.
3.1 Influence of Gravel-to-Sand Grain Size Ratio
Gradation design of the packing gravel is one of the most critical parts for the gravel packing operation. The gravel pack should have adequate sand control ability to avoid extensive sand production. Meanwhile, the gravel pack’s conductivity has a significant influence on productivity and should be considered, as well. Four groups of experiments were designed to study the influence of the gravel-to-sand grain size ratio (G-S ratio) on particle penetration depth and retained sand mass, see groups 1–4#.
The trend of particle penetration depth for the four groups with different G-S ratios shown in Fig. 4a. The ratio of particle penetration depth (Lpd) and gravel packing length (Lpack, which equals 15 cm) was utilized to non-dimensionalize the experimental data. The group 1# with a G-S ratio of four exhibits excellent sand control performance. The penetration depth of particles was only 1.7 cm, and it reached a stable state within 150 min. Group 2# with a G-S ratio of five had a faster growth rate in particle penetration depth in the early stage of flooding, but also reach stability quickly with a depth of 2.6 cm. For groups with a G-S ratio of six and seven, the velocity and depth of particle penetration front increase. This phenomenon explains that with the enlargement of pore space, the formation of the sand bridge at the gravel-sand interface became slower. More particles intruded into the gravel pack without the restrain by a stable sand bridge, resulting in severe pore blockage.
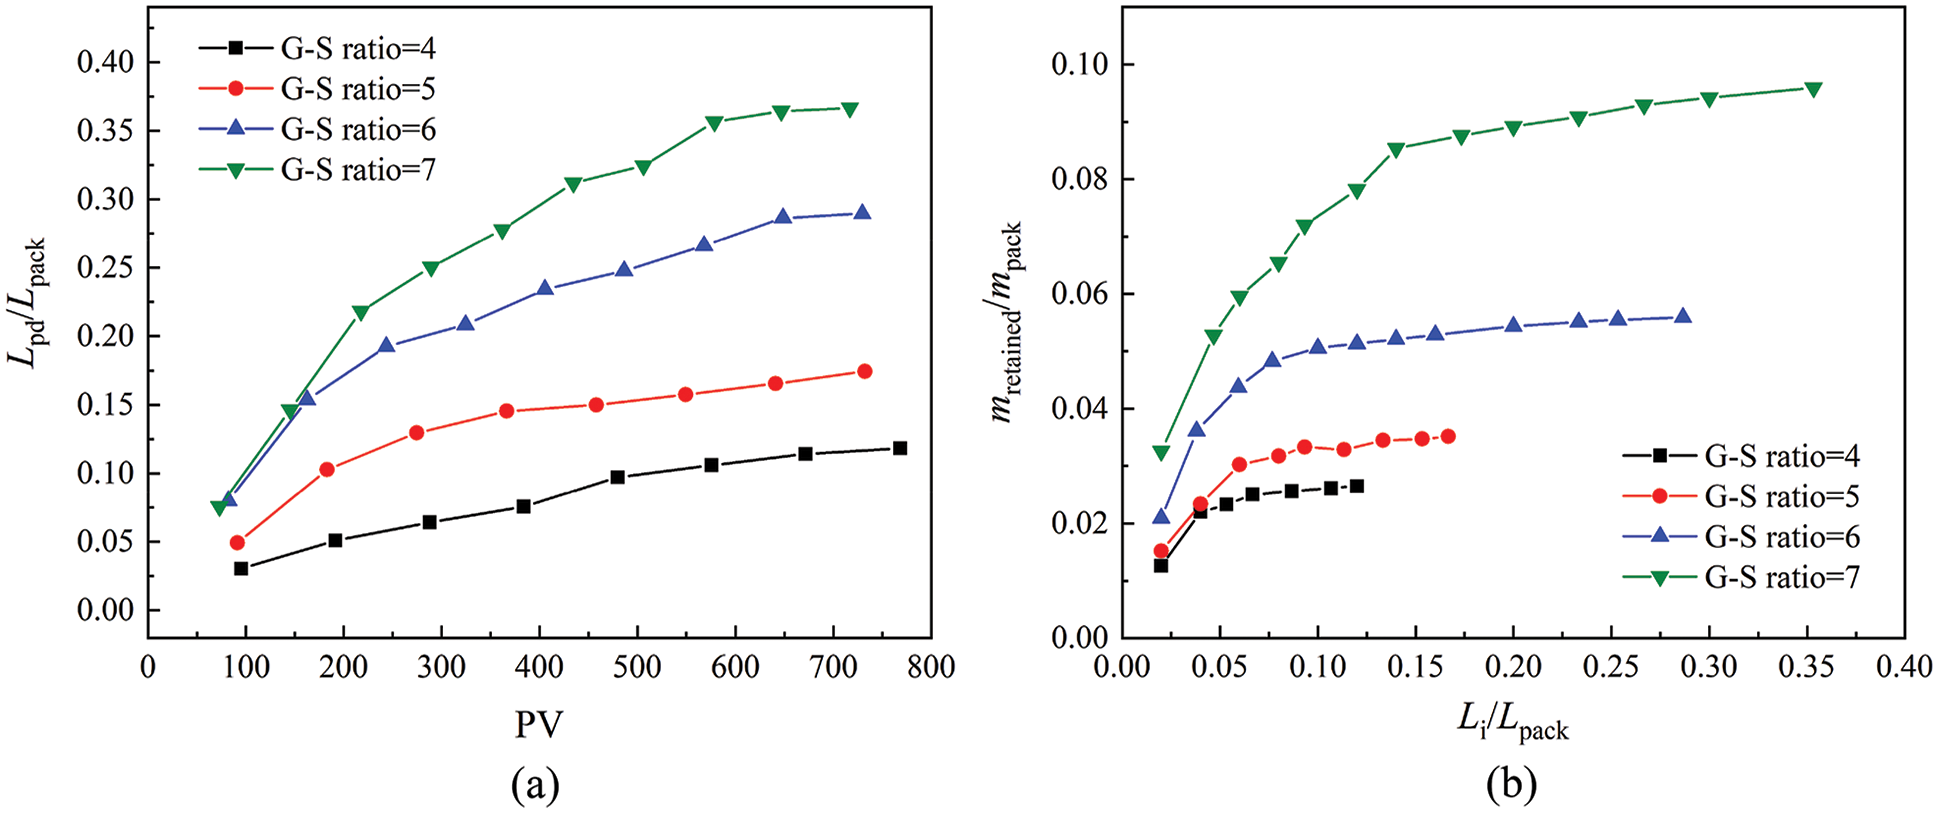
Figure 4: Particle penetration depth and cumulative mass of retained sand influenced by G-S ratio (a) dimensionless penetration depth (b) dimensionless retained sand mass
The distribution of retained particles inside the gravel pack shows in Fig. 4b. Same as the particle penetration depth, the ratio of the retained sand mass in gravel pack (mretained) and the mass of the total packing sand (mpack, which equals 268 g) was proposed to non-dimensionalize the intrusive particle mass. For experimental groups with a G-S ratio of four and five, the total amount of intrusion particles is much smaller than the other two groups. The retained particles were concentrated at the gravel-sand interface as well. The invasion depth and particle concentration increased significantly as the enlargement of packing grain size. The cumulative particle mass of groups 3#, 4# with a G-S ratio of six and seven is 14.5 g, and 24.6 g, respectively, which is much higher than that in groups 1# and 2#. The intrusive sand of these two groups covered a much deeper gravel bed in longitudinal depth as well.
It can be concluded that a particular threshold value exists when it comes to the influence of G-S ratio on particle transportation and blockage. The formation of sand bridges in the pore space kept particles from further intrusion when the G-S ratio is less than five. The G-S ratio should not be higher than six to avoid massive particle intrusion. The experimental results are in good agreement with those proposed by Saucier et al. [24].
3.2 Influence of the Flooding Rate
The flooding rate in the experiment simulated the flow rate of the near region of the wellbore during the production. The effect of flooding rate on particle migration can be concluded into the following three items: sand production rate, the formation of the sand-bridge at the interface and the particle re-migration rate. In this experiment, the migration and blockage of particles in porous media at the flooding rate of 200–800 ml/min were studied.
The particle penetration chart of various flooding rate was shown in Fig. 5a. The penetration depth is shorter than the other groups when the flooding rate is 200 ml/min. That is because certain drive speed is necessary for the formation of loose particles, and fewer intrusive particles generated under the case of low flooding rate. The intrusion depth development of groups with flooding rate of 400 and 600 ml/min show similar law. But when the flooding rate reaches 800 ml/min, re-migration of the retained particles occurred in the pore space, resulting in a noticeable increase of particle penetration depth.
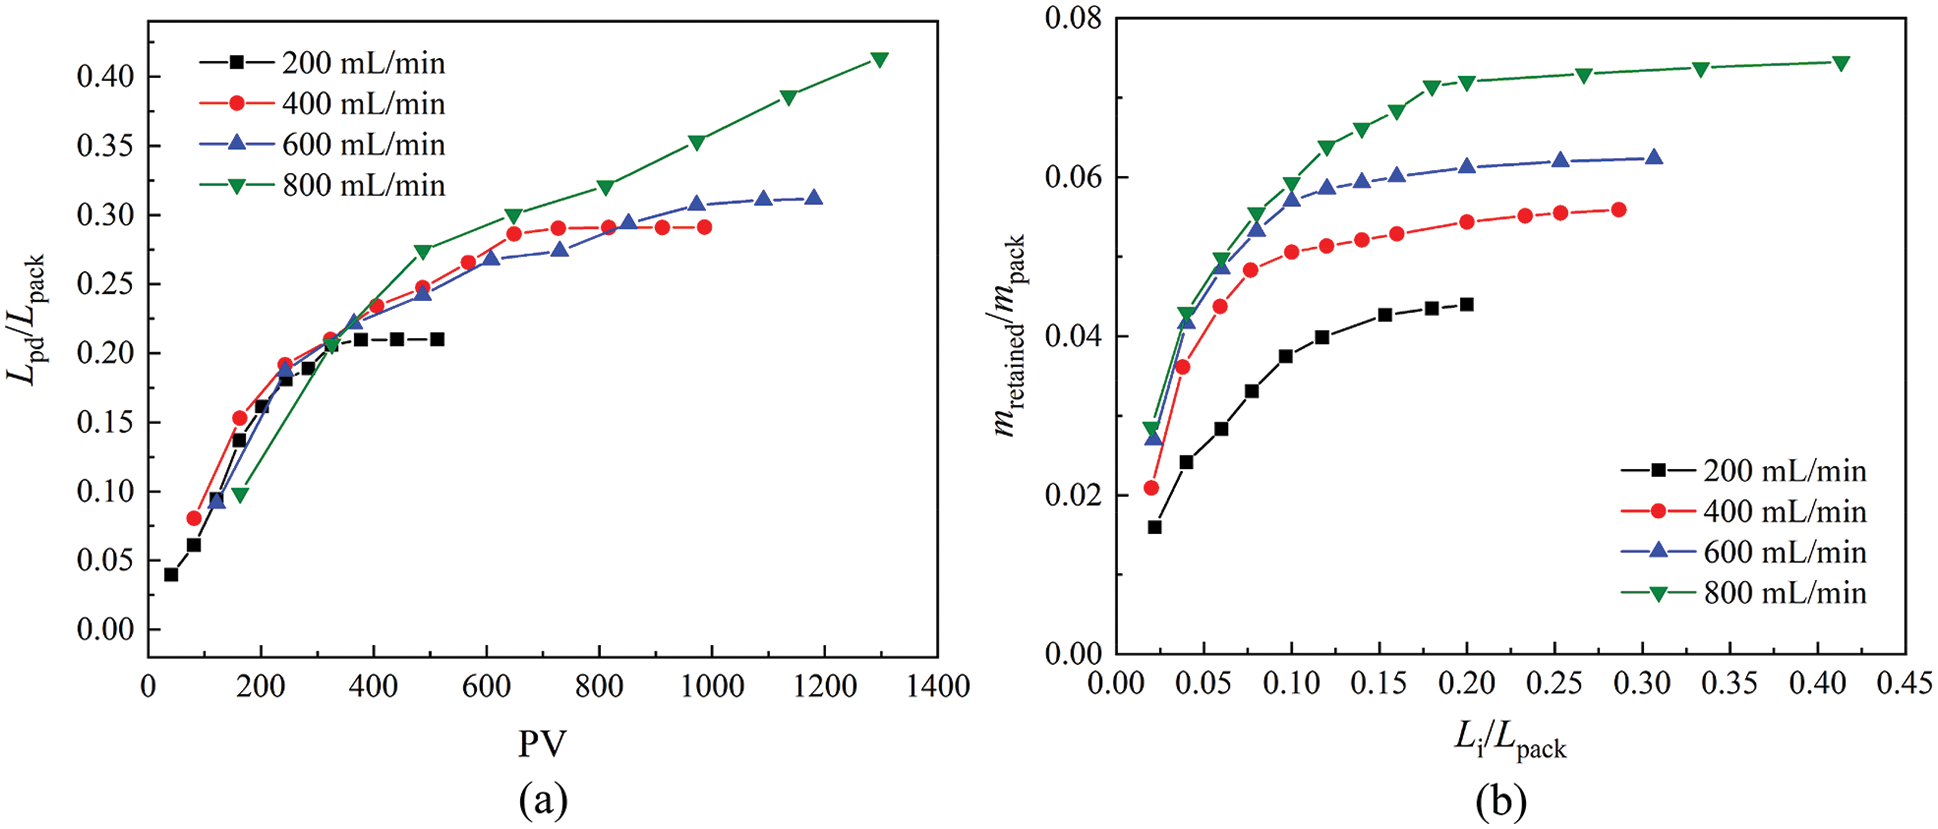
Figure 5: Particle penetration depth and cumulative mass of retained sand influenced by flooding rate (a) dimensionless penetration depth (b) dimensionless retained sand mass
The total mass of retained particles increased linearly with the flooding rate, as shown in Fig. 5b. The blocking degree near the gravel-sand interface was low due to a less mass of intrusive sand in the group of 200 ml/min. For the other three groups of experiments with the flooding rate of 400–800 ml/min, the mass of retained particles near the gravel-sand interface was similar, but the mass of particles that remained in the inner region of the gravel pack increase significantly with the rise of flooding rate.
It can be concluded from the above experimental results that the penetration depth and mass of intrusive particles are relatively low if the flooding velocity does not reach the critical velocity of the particle migration. While when the flooding velocity is above the critical velocity, further velocity increase could lead to a deeper penetration depth of particles in the gravel pack.
3.3 Influence of Fluid Viscosity
The fluid viscosity mainly affects the drag force and settling velocity acting on the intrusive sand. A higher fluid viscosity means a greater particle start-up force and a longer horizontal migration distance. As the fluid viscosity increase, the particles have a more considerable invasion distance in the gravel pack and settled or blocked particles in the pore have a higher chance of re-migration as well. Three experimental groups were carried out to study the sensitivity of fluid viscosities to particle migration and pore blockage.
As can be seen from Figs. 6a and 6b, the particles penetration depth was linearly correlated with the viscosity of the injecting fluid, but not for the mass of retained particles. The experimental groups with a fluid viscosity of 1 and 3 mPa⋅s had the similar retained particle mass, but a different penetration depth. When the viscosity raised to 5 and 7 mPa⋅s, the total mass of blocked particles and the plugging degree of porous media increase significantly. That is because, for the experimental group with lower fluid viscosity, the drag forces acting on the particles have not met the start-up force for particle migration. Therefore, these groups had a lower particle production rate and a smaller gravel-to-sand mixing region. However, when the forces are big enough to separate particles off, a large mass of particles could intrude into the gravel pack and cause a severe blockage.
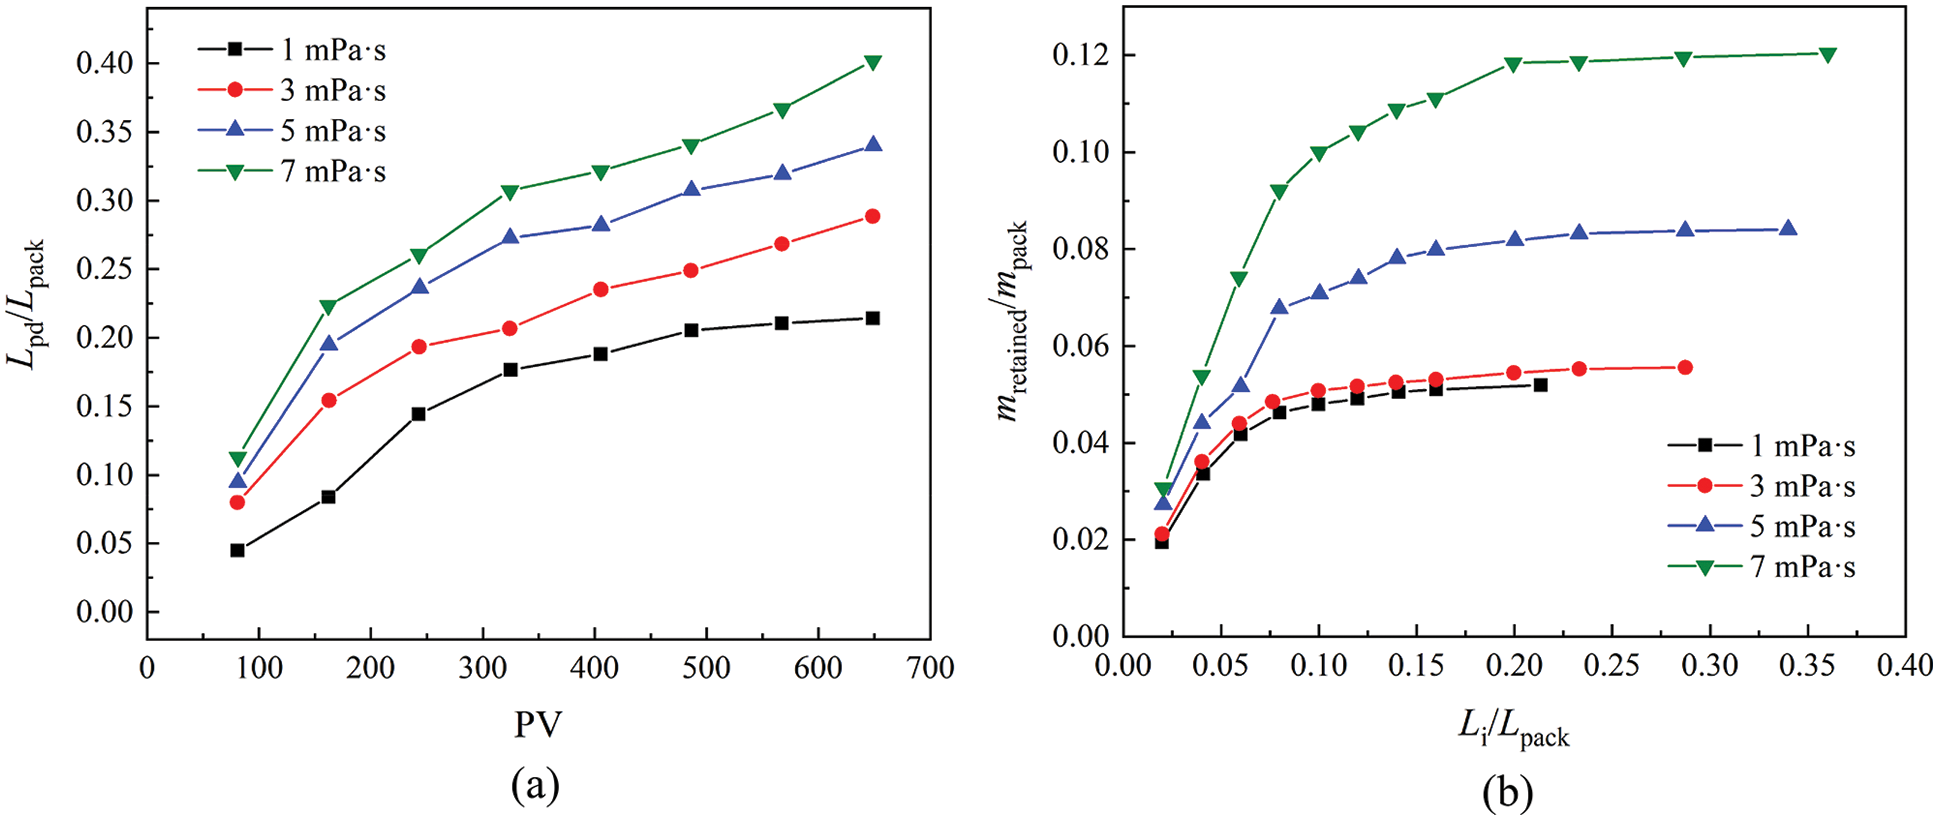
Figure 6: Particle penetration depth and cumulative mass of retained sand influenced by fluid viscosity (a) dimensionless penetration depth (b) dimensionless retained sand mass
4.1 Limitation of Deep Bed Filtration Model in Gravel Packing Application
Compared with other deep filtration applications, the particle blockage problem in the gravel pack has the following characteristics, which leads to the invalidation or inaccuracy of the traditional model. Firstly, the density of the sand particles is much higher than that of the reservoir fluid, so the sedimentation of particles plays a much more important role than that of other cases. Therefore, the network model is chosen to simulate particle distribution in the gravel pack instead of the traditional one-dimensional deep bed filtration model.
Secondly, the gravel-to-sand size ratio is much larger than that in many other industrial fields. Therefore, the influence of particle sedimentation on pore throat characteristics changes and subsequent particle migration cannot be neglected. In the classical deep filtration model, due to the small-suspended particles, the deposition coefficient of particles in porous media is generally constant, that is, the effect of deposited particles on subsequent particle migration was not taken into consideration.
Lastly, gravel packing is an engineering issue that needs large-scale simulation. The existing approaches cannot satisfy the requirements for obtaining inner-pore particle distribution and solving large-scale model efficiently at the same time.
4.2 Pressure and Velocity Distribution in an UBE
In this work, a two-dimensional network was applied to simulate the process of particle transportation and distribution in the gravel pack. The unit bed element (UBE) has been simplified to a pore-throat structure. The elements either have one pore and four throat channels (two vertical and two horizontal) in the middle parts, or one pore and three throat channels (one vertical and two horizontal) at the boundary.
The diagram of the network model used in the simulation is shown in Fig. 7, from which one can obtain the simplified UBE structure. The pressure drop of a single UBE can be demonstrated as follows:
where ΔPu stands for the pressure drop of the whole UBE; ΔPth and ΔPpo is the pressure gradient caused by viscous energy loss in throat and pore channel; pf is the pressure gradient caused by internal fluid kinetics.
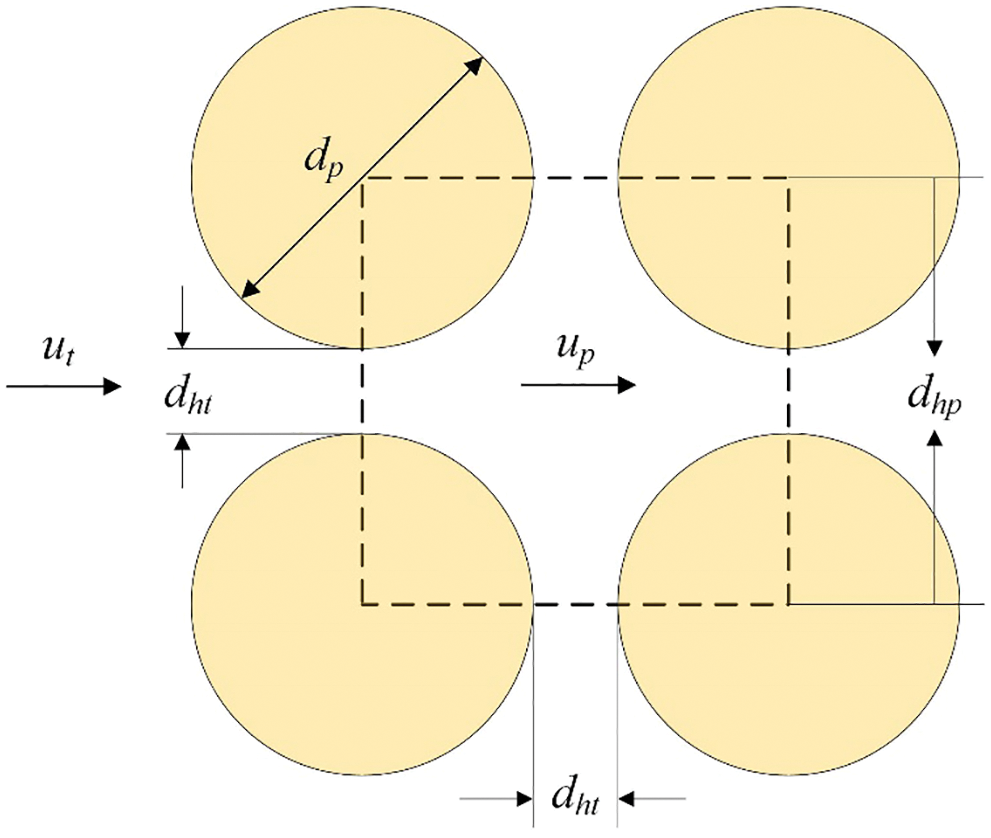
Figure 7: Geometric diagram of UBE’s pore-throat structure and network
Assuming that the flow diffusion rate is much lower than the injection flow rate for a saturated porous media. The relationship between superficial flow velocity in the pore and throat channel is [25]:
where u is the flow velocity, m/s; dh is the equivalent diameter of throat and pore channels, m; δave(i,j) is the average thickness of deposited layer of retained particle along the channel, m; the subscript t and p denote the throat and pore.
As one can observe from Fig. 7, dhp equals dht + dp. Therefore, the non-homogeneity of the pore structure could be achieved by replacing fixed dht and dp values with a randomly distributed array.
A modified Hagen-Poiseuille equation can determine the viscous pressure gradient of a blocked element:
where dh is the equivalent diameter of throat and pore channels; δave(i,j) is the average thickness of deposited layer of retained particle along the channel.
The kinetic pressure gradient pf is caused by the sudden expansion and contraction of the inner-pore geometry. According to Wu et al. [26] pf can be represented as functions of pore-throat diameter ratio β:
where β is the pore-throat diameter ratio,
4.3 Particle Trajectory Model in Porous Media
The forces acting on a single solid particle in the fluid phase can be divided into the following three categories: forces independent of the relative motion of fluid-particle, including gravity and the pressure gradient force; forces in the same direction as the relative motion between fluid and particle, including resistance, additional mass force and Basset force; forces perpendicular to the relative motion direction between fluid and particle, such as Magnus force and Saffman force [27,28].
When the solid phase composition in the particle flow is dominant, inter-particle collision is the primary mechanism affecting particle motion, and the influence of the interaction force between particles should be clarified. In the issue of gravel packing sand control, the particle concentration is low, and the inter-particle collision can be ignored, the particle can be regarded as approximate random free motion. For larger pore space, short-range forces such as electrostatic force and double-layer repulsion force have less effect on particles than gravity force, thus can be neglected. The particles are assumed to move by sliding due to the force controlling the rolling of the particles (Magnus force) is relatively small compared to Stokes force. To take both calculation efficiency and accuracy into consideration, the effects of gravity, buoyancy, viscous force and wall-particle interaction on particle motion are the main considerations in this study.
The joint force of gravity and buoyancy on the vertical direction of particles in pore-throat of the granular porous media is:
where rp is the particle size, m; ρp is the particle density, kg/m3.
For solid-liquid two-phase flow with a low Reynolds number, the resistance of particles in a Newtonian fluid is characterized by the Stokes equation.
where Dc is the viscosity coefficient, Dc = 6πμrp; ur denotes the difference between the particle velocity (v) and the flow velocity (u), i.e., ur = v – u.
For a saturated porous media, it can be assumed that the inner-pore fluid flows only in the horizontal direction, while the flow rate in the vertical direction can be assumed to be 0. When particles move under the domination of Stokes force, the expression of ur is as follows:
Based on the DLVO theory, the forces acting on particles of the porous media internal surface can be characterized by the following equation:
where rs is the particle size of porous media skeleton, m; D = rs + rp + d, d is the minimum distance between particle and the internal surface.
When the solid phase composition in the particle flow is dominant, interparticle collision is the primary mechanism affecting particle motion, and the influence of the interaction force between particles should be clarified. In the issue of gravel packing sand control, the particle concentration is low, and the interparticle collision can be ignored, the particle can be regarded as approximate random free motion. For larger pore space, short-range forces such as electrostatic force and double-layer repulsion force have less effect on particles than gravity force, thus can be neglected.
Force analysis of particles in fluids in longitudinal and transverse directions:
where Vp is the particle volume, m3; vx and vy are the particle velocity components in X and Y direction, respectively, m/s; Fdx and Fdy are the viscous force components in X and Y directions, respectively, N; FA1 and FA2 are DLVO forces from top and bottom surfaces of the pore internal wall, respectively.
By integrating Eqs. (15) and (16), the expressions of particle velocities in X and Y direction can be obtained
The trajectory of injected particles is characterized by Eqs. (17) and (18), and the trajectory model based on the real force of particles can be established.
4.4 Two-Dimensional Particle Mass Conservation Equation
The phenomenological model of filter media describes the macroscopic distribution characteristics of particles in the porous media during the process of deep bed filtration [6,29–31]. Assuming that the flow inside a UBE is one-dimensional and linear, and the dispersion effect of the porous media is negligible. The particle mass conservation equation of one-dimensional deep filtration model is as follows:
where, c is the particle concentration per unit bed volume; σ is the retained particle volume per unit bed volume; D is the flow diffusivity rate.
To obtain the distribution characteristic of particles in the porous media, transportation model of particles in two-dimensional scales is required. A two-dimensional UBE has two entrances and exits in the horizontal and vertical directions. For a UBE with coordinates (x, y), the volume of particles passing through the entrance and exit in the horizontal direction at t time is Cinn1(x,y,t) and Cinn1(x+1,y,t), respectively. Similarly, these variables are Cinn2(x,y,t) and Cinn2(x+1,y,t) for vertical entrance and exit. Consider each row of the UBEs as a column cell, the c and σ in Eq. (20) can be written as the sum of intrusion and retained particles all over the row, as shown in Eqs. (20) and (21).
where, V0 is the average initial pore volume of the UBE, m3; Csettle(x,t) is the total volume of retained particles in a column cell, m3; ε(x,y,t) is the UBE’s porosity.
For a single two-dimensional UBE as shown in Fig. 7, the mass conservation equation is as follows:
The volume of inlet and outlet particles of each cell can be expressed as the function of the particle retained and settled rate of particles, which can be determined from the particle trajectory model. The retained particle volume in the UBE at time t can be defined by the accumulation of captured particles by multiple mechanisms.
where λsettle is the settlement coefficient of injected particles; λre is the coefficient of re-migration of settled particles; λcapture is the particle capture coefficient; n is the number of particle capture mechanisms considered in the model, such as adsorption, blockage and so on. The particle trajectory model in Chapter 4.3 can determine the above coefficients.
The particle transportation model in a two-dimensional scale consists of Eqs. (22) and (25). The macroscopic distribution characteristic of particles in the porous media can be obtained by solving the model using the finite difference method.
4.5 Characterization of Damage Elements
Pore damage by particle intrusion can be divided into the following two modes, as shown in Fig. 8. Some intrusive particles were trapped on the pore surface due to the inertia force and adsorption. The pore damage caused by these particles can be characterized utilizing the equivalent hydrodynamic radius, that is, particles accumulation on the surface area equivalent to the enlargement of pack grain size of the porous media [14,16].
where dg0 is the initial packing grain size, m; ε0 is the initial porosity.
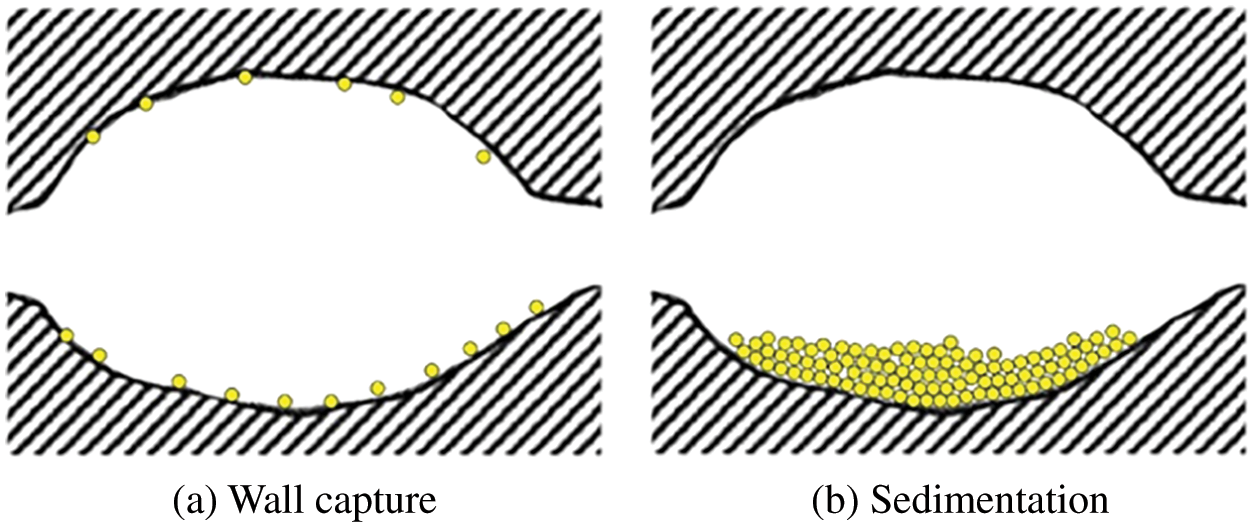
Figure 8: Two particles retention pattern inside the pore space
Also, some intrusive particles settled at the bottom of the pore space under gravity. The settled particles in the pore affect the flow channel width and the subsequent migration of the inflow particles of the UBE. Therefore, the pore damage caused by particle settling can be characterized by the shrinkage of flow channels in the UBE.
where Vp is the volume of settling particles, m3; V0 is the initial volume of the pore space, m3; εp is the porosity of granular matter formed by settling particles.
An UBE should be regarded as the source term of the particles if it was completely blocked by the intrusive particles. The particle production rate is as follows:
4.6 Simulation Results and Validation
Based on the theoretical model proposed in the above sections, the transportation and distribution of particles in the gravel pack under the same parameter setting as the experiments were simulated by the in-house code.
A comparison of numerical simulation with the result of the flooding experiments was conducted to verify the accuracy of the simulation method. The accuracy of the model is validated by determining whether the particle distribution morphology and the particle penetration depth in the numerical simulation are similar to those in the physical simulation. According to the parameters listed in Table 1, the numerical simulation is operated with the experimental groups 1–4# with the G-S ratio of 4–7 as an example.
The particle distribution characteristic obtained by numerical simulation is shown in Fig. 9. The simulated particle distribution characteristic in the gravel pack is consistent with that of the monitored figures during the experiment. The depth and developing velocity of particle intrusion frontier increase with the G-S ratio so does the frontier inclination. Fig. 10 shows the comparison of steady particle penetration depth between the numerical and physical simulation, which shows good agreement as well.
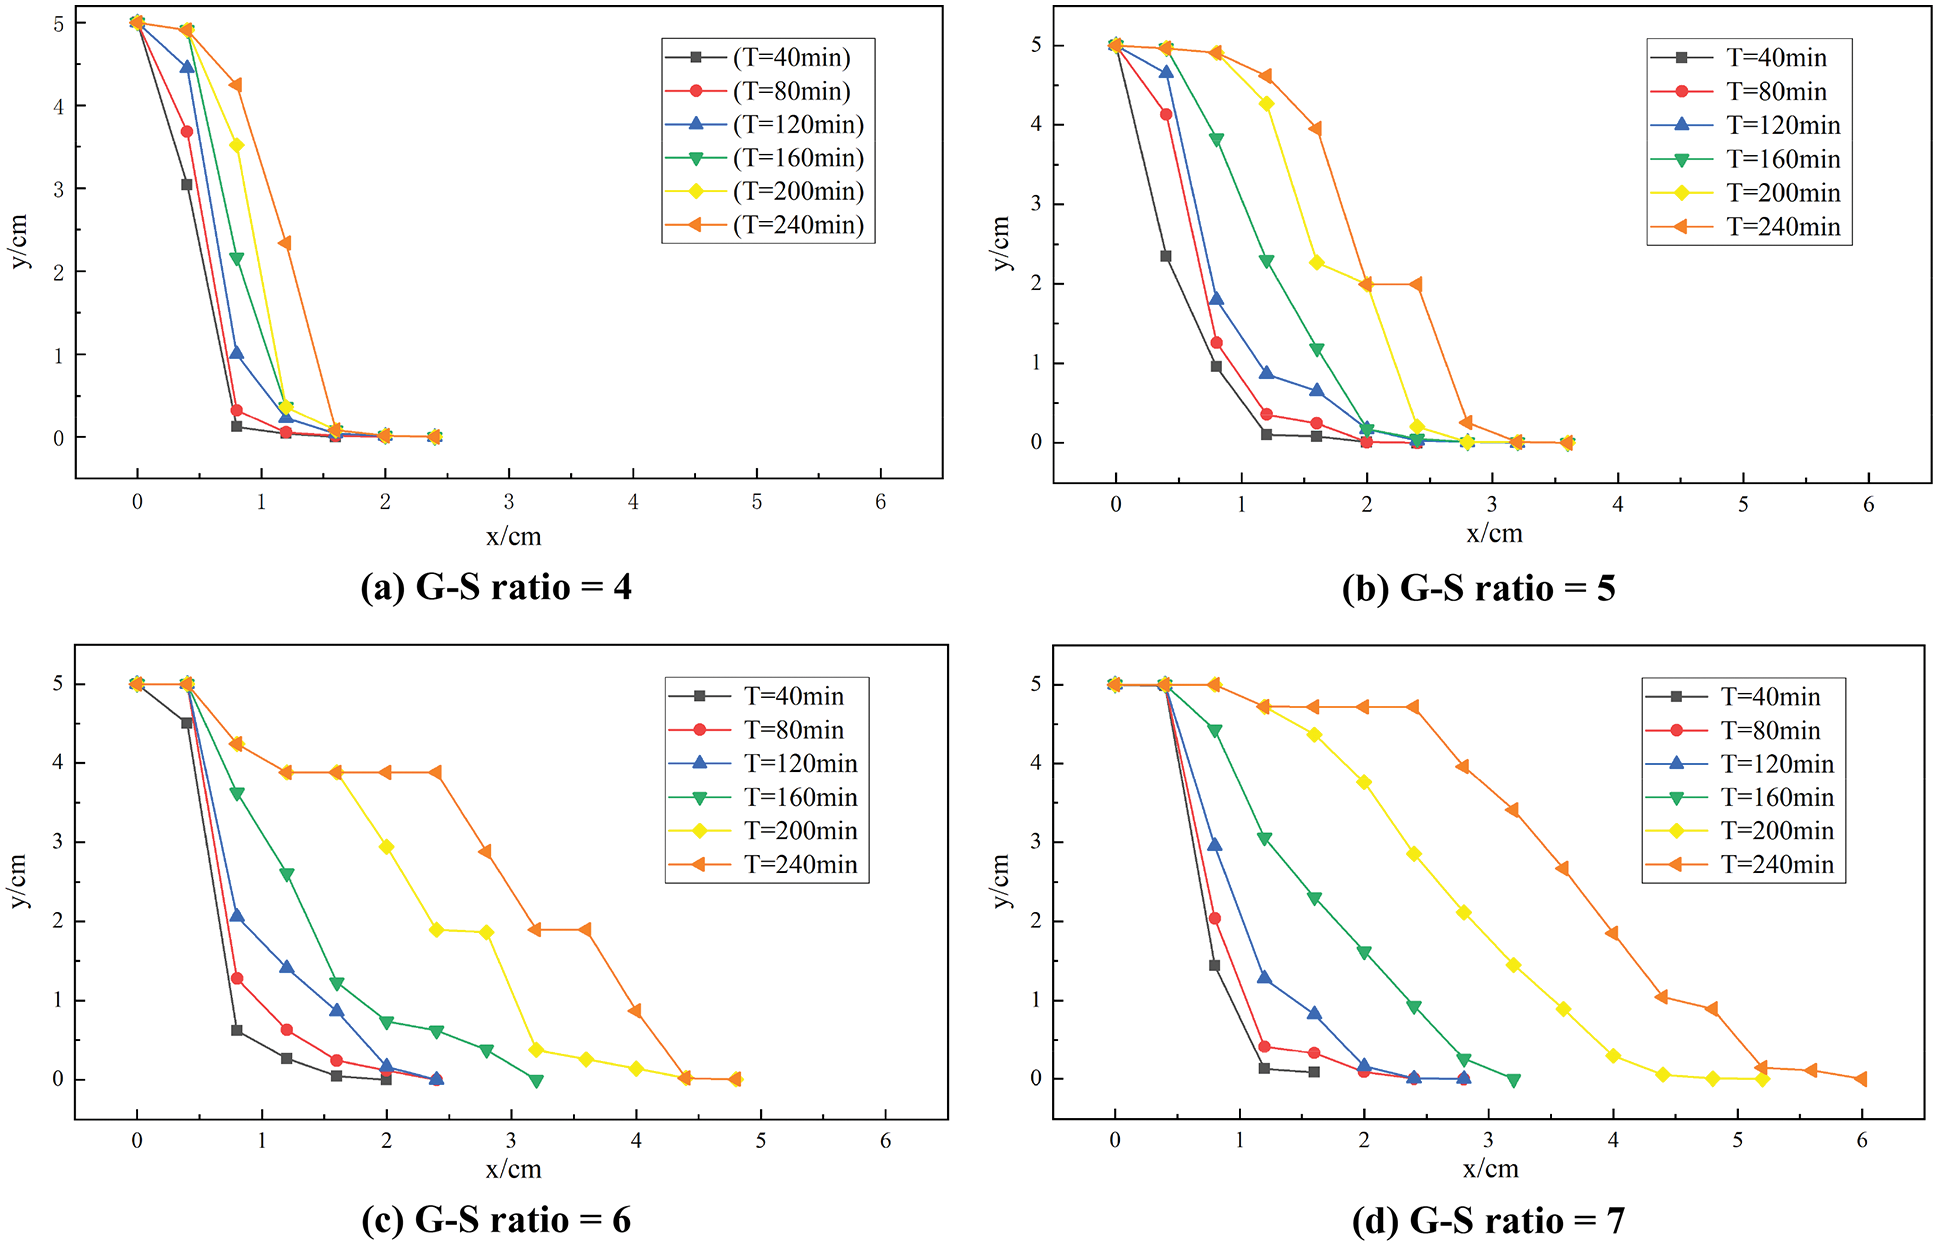
Figure 9: Simulation results of sand distribution in gravel packs affected by G-S grain size ratio
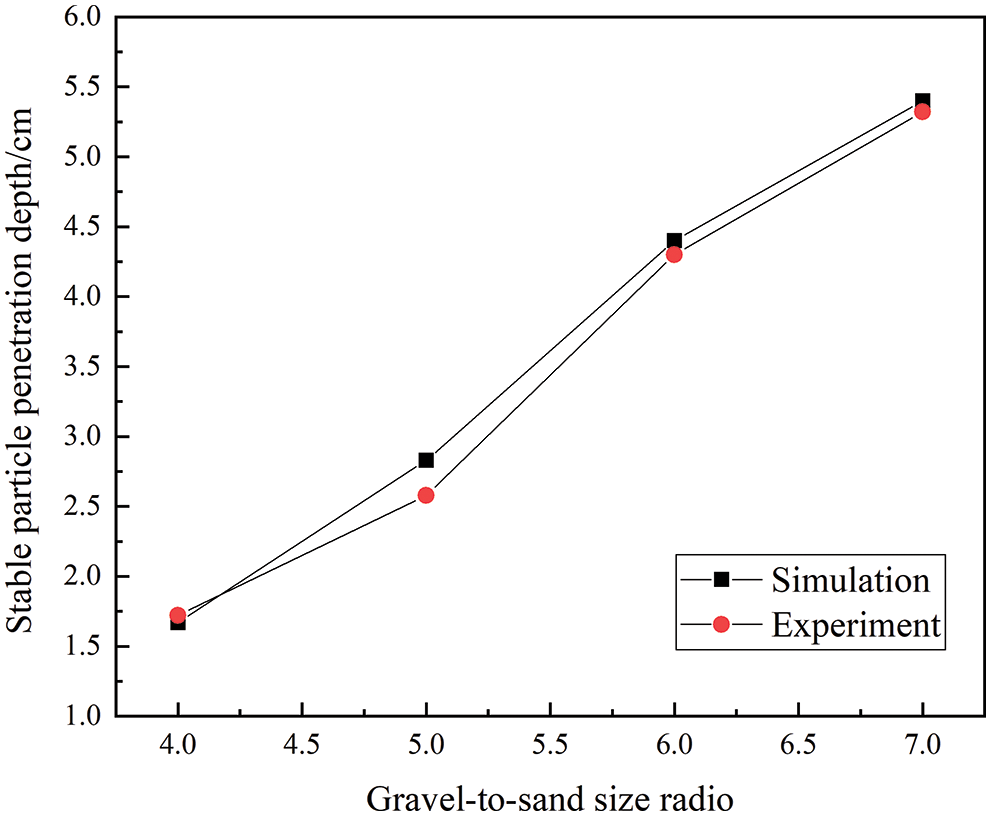
Figure 10: Experimental validation of simulation results of particle penetration depth
From the validation, it can be concluded that the numerical model has high reliability, and it is applicable in the simulation of particle transportation and distribution pattern in the gravel pack.
In this work, the distribution pattern of injected particles in the gravel pack during flooding was carried out by visual experimental and numerical approaches. The inner-pore particle distribution, particle penetration depth and mass of the retained particles were obtained experimentally. By analysis of the experimental results under the influence of G-S size ratio, injection rate and fluid viscosity, the following conclusion can be drawn:
1. When it comes to the influence of G-S ratio on particle migration, there is a particular threshold value that exists. The sand arch that formed at the sand-gravel interface can alleviate sand intrusion effectively when the G-S ratio is less than five, while massive particle intrusion occurs with the increase of the G-S ratio.
2. When the superficial fluid velocity does not reach the critical velocity of particle initiation, both the penetration depth and mass of the intrusive sand were relatively low. But as the fluid velocity further increased above the critical sand production velocity, the gravel pack blockage could be more severe.
3. For the experimental group with low viscosity, the drag force acting on particles does not reach the critical sand migration force, resulting in a decrease of overall sand production rate and alleviate the gravel pack blockage.
By analyzing the characteristics of the sand blockage process in the gravel pack, the limitation of using tradition DBF model in solving this engineering problem were proposed. A new network simulation method was proposed by the combination of DBF theory and particle trajectory model. The experimental validation showed that the new simulation method is of high reliability in predicting both particle penetration depth and distribution pattern. The experimental and simulation method proposed by this work can provide practical guidance for gravel packing design in-field operation.
Acknowledgement: This work was financially supported by National Science and Technology Major Project of the Ministry of Science and Technology of China (Grant No. 2016ZX05011004–003).
Funding Statement: This work was financially supported by Outstanding Youth Fund of Shandong Province (ZR2020YQ36).
Conflicts of Interest: The authors declare that they have no conflicts of interest to report regarding the present study.
References
1. Deng, F., Feng, Y., Yan, C., Lin, H., Gong, N. et al. (2017). Experimental investigation of factors affecting gravel pack efficiency for thermal recovery wells in Bohai Bay, China. Journal of Petroleum Science and Engineering, 156, 835–844. DOI 10.1016/j.petrol.2017.06.054. [Google Scholar] [CrossRef]
2. Mirshekari, B., Dadvar, M., Modares, H., Dabir, B. (2014). Modelling and simulation of gravel-pack damage due to particle transport by single phase flow in cased hole completion. International Journal of Oil, Gas and Coal Technology, 7(2), 152–168. DOI 10.1504/IJOGCT.2014.059278. [Google Scholar] [CrossRef]
3. Sparlin, D. D. (1974). Sand and gravel-A study of their permeabilities. SPE Symposium on Formation Damage Control, pp. 7–8. New Orleans, Louisiana, USA. DOI 10.2523/4772-MS. [Google Scholar] [CrossRef]
4. Ali, M. A. J., Currie, P. K., Salman, M. J. (2005). Measurement of the particle deposition profile in deep-bed filtration during produced water re-injection. SPE Middle East Oil and Gas Show and Conference, pp. 12–15. Manama, Kingdom of Bahrain. DOI 10.2523/93056-MS. [Google Scholar] [CrossRef]
5. Li, Y., Qin, G., Li, M., Wu, J., Wang, W. (2012). Numerical simulation study on gravel-packing layer damage by integration of innovative experimental observations. SPE Heavy Oil Conference Canada, pp. 12–14. Calgary, Alberta, Canada. DOI 10.2118/157927-MS. [Google Scholar] [CrossRef]
6. Shirinabadi, R., Moarefvaand, P., Goshtasbi, K., Ahangari, K. (2016). The physical and numerical modeling of sand production and gravel pack in oil wells by designing and manufacturing the machine and presenting a relation estimating sand production rate. Journal of Mining Science, 52(2), 300–312. DOI 10.1134/S1062739116020453. [Google Scholar] [CrossRef]
7. Bigno, Y., Oyeneyin, M. B., Peden, J. M. (1994). Investigation of pore-blocking mechanism in gravel packs in the management and control of fines migration. SPE Formation Damage Control Symposium, pp. 7–10. Lafayette, LA, USA. DOI 10.2118/27342-MS. [Google Scholar] [CrossRef]
8. Bedrikovetsky, P. (2008). Upscaling of stochastic micro model for suspension transport in porous media. Transport in Porous Media, 75(3), 335–369. DOI 10.1007/s11242-008-9228-6. [Google Scholar] [CrossRef]
9. Bedrikovetsky, P., Marchesin, D., Shecaira, F., Souza, A., Milanez, P. et al. (2001). Characterisation of deep bed filtration system from laboratory pressure drop measurements. Journal of Petroleum Science and Engineering, 32(2–4), 167–177. DOI 10.1016/S0920-4105(01)00159-0. [Google Scholar] [CrossRef]
10. Liu, Q., Cui, X., Zhang, C., Huang, S. (2016). Experimental investigation of suspended particles transport through porous media: Particle and grain size effect. Environmental Technology, 37(7), 854–864. DOI 10.1080/09593330.2015.1088578. [Google Scholar] [CrossRef]
11. Zamani, A., Maini, B. (2009). Flow of dispersed particles through porous media-deep bed filtration. Journal of Petroleum Science & Engineering, 69(1–2), 71–88. DOI 10.1016/j.petrol.2009.06.016. [Google Scholar] [CrossRef]
12. Lawal K, A., Vesovic, V., Boek E, S. (2011). Modeling permeability impairment in porous media due to asphaltene deposition under dynamic conditions. Energy & Fuels, 25(12), 5647–5659. DOI 10.1021/ef200764t. [Google Scholar] [CrossRef]
13. Li, Y., Li, M., Wang, L., Yao, Z., Meng, W. (2013). A productivity prediction model for the gravel-packed horizontal well. Petroleum Science and Technology, 31(6), 633–642. DOI 10.1080/10916466.2011.578091. [Google Scholar] [CrossRef]
14. Civan, F. (2000). Reservoir formation damage: Fundamentals, modeling, assessment, and mitigation. Herd Health Environments Research & Design Journal, 7(2), 60–77. [Google Scholar]
15. Iwasaki, T., Slade, J. J., Stanley, W. E. (1937). Some notes on sand filtration. Journal AWWA, 29(10), 1591–1602. DOI 10.1002/j.1551-8833.1937.tb14014.x. [Google Scholar] [CrossRef]
16. Tien, C.(1989). Granular filtration of aerosols and hydrosols, pp. 9–20. Boston: Butterworths. [Google Scholar]
17. Herzig, J. P., Leclerc, D. M., Goff, P. L. (1970). Flow of suspensions through porous media-application to deep filtration. Industrial & Engineering Chemistry, 62(5), 8–35. DOI 10.1021/ie50725a003. [Google Scholar] [CrossRef]
18. Bai, R., Tien, C. (2000). Effect of deposition in deep-bed filtration: Determination and search of rate parameters. Journal of Colloid & Interface Science, 231(2), 299–311. DOI 10.1006/jcis.2000.7130. [Google Scholar] [CrossRef]
19. Payatakes, A. C., Rajagopalan, R., Tien, C. (1974a). Application of porous media models to the study of deep bed filtration. The Canadian Journal of Chemical Engineering, 52(6), 722–731. DOI 10.1002/cjce.5450520605. [Google Scholar] [CrossRef]
20. Payatakes, A. C., Tien, C., Turian, R. M. (1973a). A new model for granular porous media: Part I. Model formulation. AIChE Journal, 19(1), 58–67. DOI 10.1002/aic.690190110. [Google Scholar] [CrossRef]
21. Payatakes, A. C., Tien, C., Turian, R. M. (1973b). A new model for granular porous media: Part II. Numerical solution of steady state incompressible newtonian flow through periodically constricted tubes. AIChE Journal, 19(1), 67–76. DOI 10.1002/(ISSN)1547-5905. [Google Scholar] [CrossRef]
22. Payatakes, A. C., Tien, C., Turian, R. M. (1974b). Trajectory calculation of particle deposition in deep bed filtration: Part I. Model formulation. AIChE Journal, 20(5), 889–900. DOI 10.1002/aic.690200509. [Google Scholar] [CrossRef]
23. Carlson, D. R., Widnall, S. E., Peeters, M. F. (1982). A flow-visualization study of transition in plane poiseuille flow. Journal of Fluid Mechanics, 121, 487–505. DOI 10.1017/S0022112082002006. [Google Scholar] [CrossRef]
24. Saucier, R. J. (1974). Considerations in gravel pack design. Journal of Petroleum Technology, 26(2), 205–212. DOI 10.2118/4030-PA. [Google Scholar] [CrossRef]
25. Dabir, S., Dabir, B., Moghanloo, R. G. (2016). A new approach to study deposition of heavy organic compounds in porous media. Fuel, 185, 273–280. DOI 10.1016/j.fuel.2016.07.106. [Google Scholar] [CrossRef]
26. Wu, J., Yu, B., Yun, M. (2008). A resistance model for flow through porous media. Transport in Porous Media, 71(3), 331–343. DOI 10.1007/s11242-007-9129-0. [Google Scholar] [CrossRef]
27. Feng, Q., Wang, X., Han, X. (2015). Study of the deposition laws for particles flowing in porous media. Chinese Journal of Hydrodynamics, 30(4), 401–405. [Google Scholar]
28. Kim, Y. S., Whittle, A. J. (2006). Filtration in a porous granular medium: 1. Simulation of pore-scale particle deposition and clogging. Transport in Porous Media, 65(1), 53–87. DOI 10.1007/s11242-005-6087-2. [Google Scholar] [CrossRef]
29. Rege, S. D., Fogler, H. S. (1988). A network model for deep bed filtration of solid particles and emulsion drops. AIChE Journal, 34(11), 1761–1772. DOI 10.1002/(ISSN)1547-5905. [Google Scholar] [CrossRef]
30. Shin, C. (2006). Numerical simulation for particle penetration depth distribution in deep bed filtration. Chemical Engineering & Technology, 29(8), 905–909. DOI 10.1002/ceat.200600111. [Google Scholar] [CrossRef]
31. Żywczyk, Ł, Moskal, A., Gradoń, L. (2015). Numerical simulation of deep-bed water filtration. Separation and Purification Technology, 156(1), 51–60. DOI 10.1016/j.seppur.2015.10.003. [Google Scholar] [CrossRef]
Cite This Article
 Copyright © 2023 The Author(s). Published by Tech Science Press.
This work is licensed under a Creative Commons Attribution 4.0 International License , which permits unrestricted use, distribution, and reproduction in any medium, provided the original work is properly cited.
 Downloads
 Citation Tools