
 Submit a Paper
 Propose a Special lssue
 Open Access
ARTICLE

Analysis of the Mechanisms Underpinning Rainstorm-Induced Landslides
School of Civil Engineering, North China University of Technology, Beijing, 100144, China
* Corresponding Author: Shaojie Feng. Email:
Fluid Dynamics & Materials Processing 2023, 19(5), 1189-1201. https://doi.org/10.32604/fdmp.2023.023637
Received 06 May 2022; Accepted 09 August 2022; Issue published 30 November 2022
 View Full Text
 Download PDF
Abstract
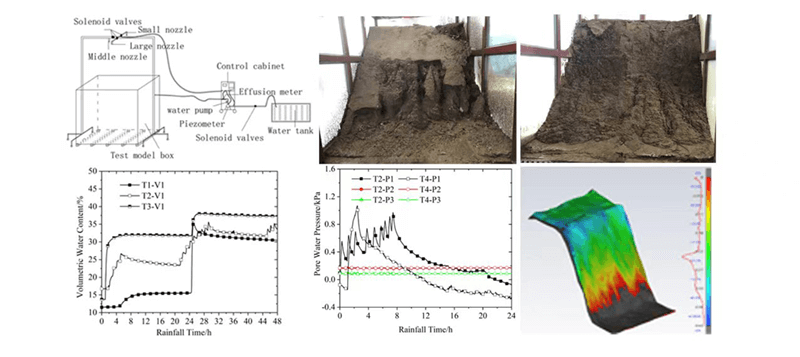
The present study considers the damage mechanisms and the rainfall infiltration process responsible for landslide phenomena which originate from accumulation slopes. Accordingly, a physical test model is developed for different slopes and different rainfall conditions. Moreover, a three-dimensional laser scanner and a camera are used to monitor the slope erosion and the landslide dynamic evolution. Using this approach, the time variation curves of volumetric water content, pore water pressure, soil pressure, slope deformation, and damage are determined. The results show that under similar conditions, similar trends of the pore water pressure are achieved for different slopes and rainfall intensities.Graphic Abstract
Keywords
Landslides are considered to cause a great loss to people’s lives and properties. More precisely, they account for the largest proportion of geological disasters [1,2] among the main disasters such as rainfalls, earthquakes and human construction activities [3,4]. Moreover, rainstorms can be mentioned as the most important cause [5,6]. One highly probable type of landslide in engineering projects is an accumulative landslide. Thus, studying rainstorm-induced landslides of loose accumulation bodies is of great practical significance.
With the advent of 3D laser scanning as a spatial information extraction technology in the mid-1990s, high-resolution terrain data can be instantly collected [7,8]. This technology has been extensively used in monitoring slope deformations by comparing the variations in topographic data before and after rainfalls. The use and adaptability of the technology have also been widely studied and evaluated through simulation tests [9,10].
Currently, three methods, namely, numerical simulation analysis, field monitoring and indoor model experiment on artificial rainfall, are mainly used to study slope instability failure caused by rainfalls [11–13]. For example, to investigate the impact of early rainfall on landslides, Liu et al. [14] established a dynamic critical threshold model of rainfall disasters based on rainfall observation data. In another study, numerical simulation was used to study the dynamic characteristics of landslides [15]. The study investigated the influence of rainfall on pore water change and slope failure. Moreover, applying model tests, Zeng et al. [16] simulated rainfalls and studied the infiltration law and mechanism of loess slopes. In addition, laboratory experiments and numerical simulation methods were comprehensively utilized by Vadivel et al. [17] for studying the geological origin and failure process of the Achanakkal landslide.
Indoor model tests have also been extensively utilized to investigate the instability of rainfall-induced landslides. For example, Xiao et al. [18] developed a large-scale physical model to study the deformation characteristics and instability mechanism of an ancient landslide on the reservoir bank. In another study, Wang et al. [19] looked into the development of slope deformation and failure caused by rainfall and toe immersion. They classified the change in the water content into three periods of initial stability, rising and final stability. Using model tests, Liu et al. [20] studied the effects of rainfall intensity and pattern, slope and soil properties on landslide sensitivity. Moreover, Hojat et al. [21] investigated the impact of rainwater infiltration through landslide body on landslides under rainfall conditions. Taking a centrifuge model test, Guo et al. [22] explored the reactivation mechanism of an ancient landslide, the results of which suggested rainfall and pore water pressure as the main influencing factors of the landslide. In another research, sensors were embedded in a test model and the variations of the landslide’s volumetric water content, temperature, and displacements were examined [23]. Using a comprehensive model test as well as a three-dimensional laser scanning technology, Beaulieu et al. [24] analyzed the underlying mechanics of landslides and estimate material parameters relevant to elastic failure. In another study, a rainfall device was developed and the influence of long-term rainfall on slope instability was studied [25]. The centrifuge model test was also used by Kennedy et al. [26] to study the relative effect of slope angle and shear strength on retrogression distance. Likewise, model tests were also used by Schilirò et al. [27] and Sun et al. [28]. While the former study investigated the effect of initial water content and soil types on slope instability, the latter focused on the effect of rainfall patterns and slope structure on landslide deformation and failure. Furthermore, the relationship between rainfall infiltration and slope stability of weak interlayer accumulation body was considered by Gan et al. [29]. Also, to predict the types of river blockages caused by landslides, Liao et al. [30] simulated the typical movement process of landslides and proposed a new method. Finally, Jacob et al. [31] examined the effect of different triggers on rainfall-induced landslides.
The present study investigated the failure mechanism and rainfall infiltration of rainstorm-induced landslide of loose accumulation slope. To this end, a model test was developed and the loose accumulation slope was studied under artificial rainfall. Consequently, the failure and instability modes of rainstorm-induced landslide were assessed under different conditions. Furthermore, such influencing characteristics as the volume of water content and the pressure of the pore water were considered. As a result, it was found that the accuracy of slope deformation monitoring was improved by applying the 3D laser scanning technology. The findings of the study provide theoretical support for risk identification and safety prevention as well as controlling the loose accumulation slope under rainstorm.
2 Model Test Similarity Theory
Similarity theory has been widely used in model tests. In the present study, the accumulated soil of a waste disposal site was taken as the research object. Accordingly, the test similarity ratio was determined based on the size of the site as well as the size of the test model. While the length, the maximum width and the height of the on-site accumulation body were about 50, 38, and 30 m, respectively, those of the test model were 2.0, 1.5, and 1.2 m. Thus, the similarity ratio of the test was determined as
The principle of geometric dimension similarity needs to be observed when establishing a test model for accumulated soil mass under rainfall infiltration. This is to say that, while the physical model of slope is proportional in volume, area and length to the prototype, the direction of the slope angle remains constant. In line with the similarity theory, the similarity ratio of the geometric dimension of the test model was taken as
The examined soil was obtained from a waste dump, i.e., the trench of silty clay from a foundation pit excavation project. In addition, to ensure the same mechanical parameters of the test material as of the on-site material, a number of measurements were taken. First, the indoor geotechnical test was carried out based on the on-site sampling. Moreover, the proportion of the test material was selected in accordance with the particle gradation of the on-site soil. Finally, the physical and mechanical tests were performed on the remolded soil. Table 1 shows the main physical parameters of the three test schemes.
3 Design of Landslide Model Test Scheme
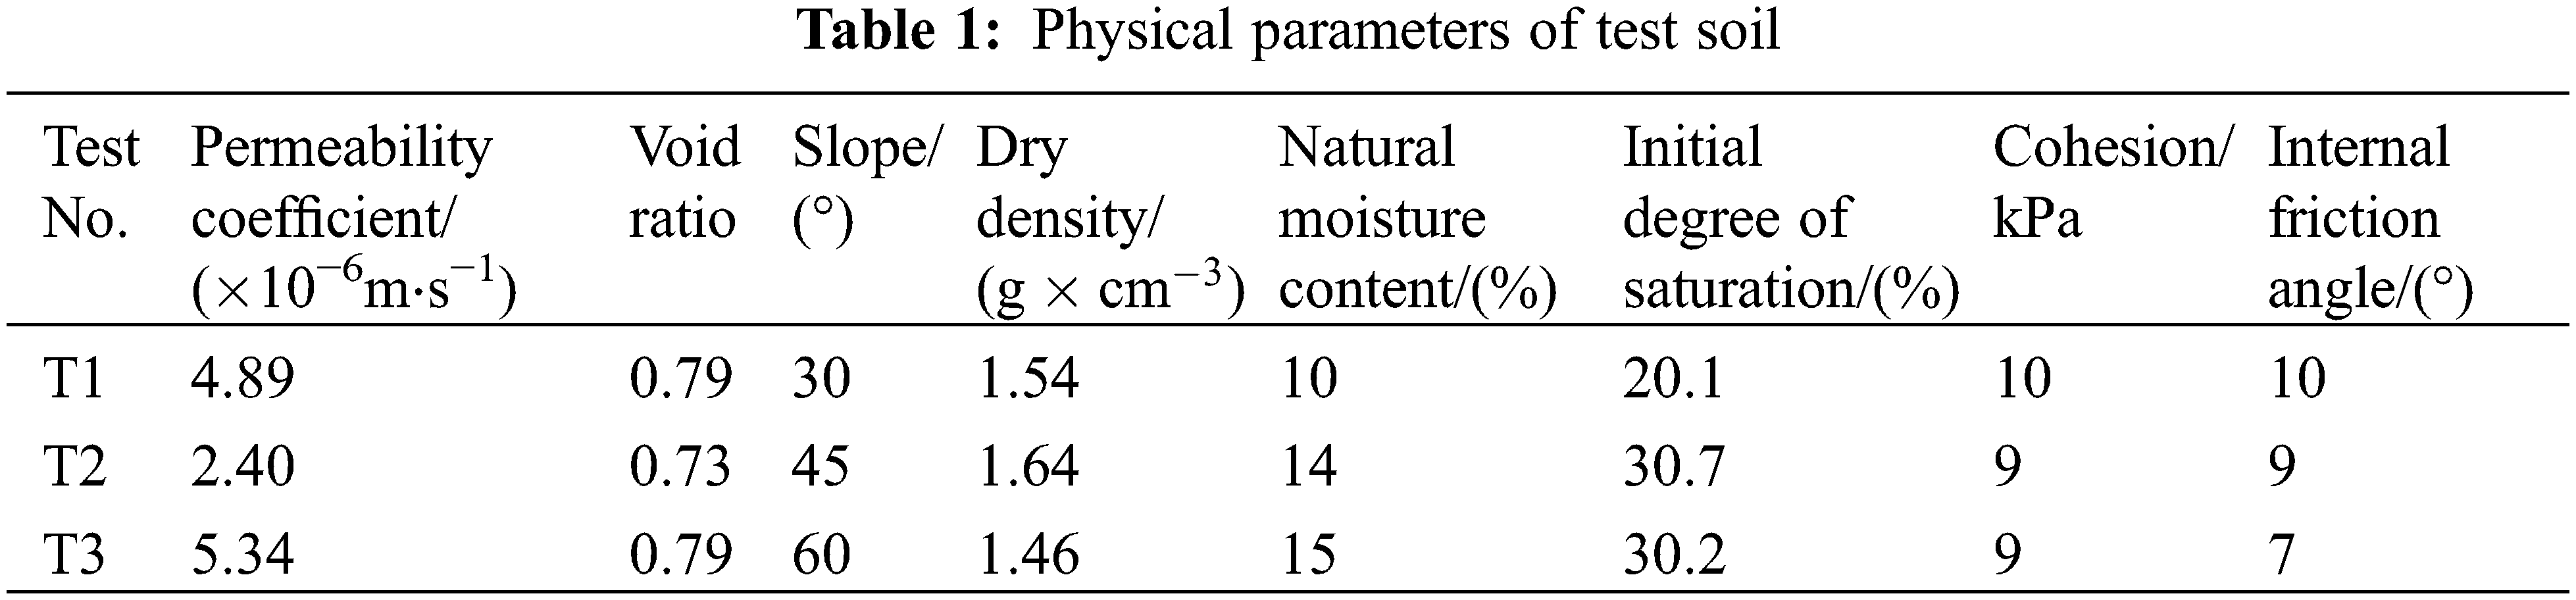
As can be seen in Fig. 1, the test bench consisted of a test model box, a rainfall device, a monitoring system, a console and a water tank. The test model box was designed based on the size of the test model, with the length, width and height of 2.0, 1.5, and 1.5 m, respectively. While the three sides of the box were made of organic glass, the bottom was a steel plate with drainage holes. This made it more feasible for the researcher to observe the process of rainwater infiltration and landslide development. Additionally, while the test box was welded by angle steel, glass adhesive was used to seal the joints. Yet, the slurry generated during the test could be discharged through the door of the test box.
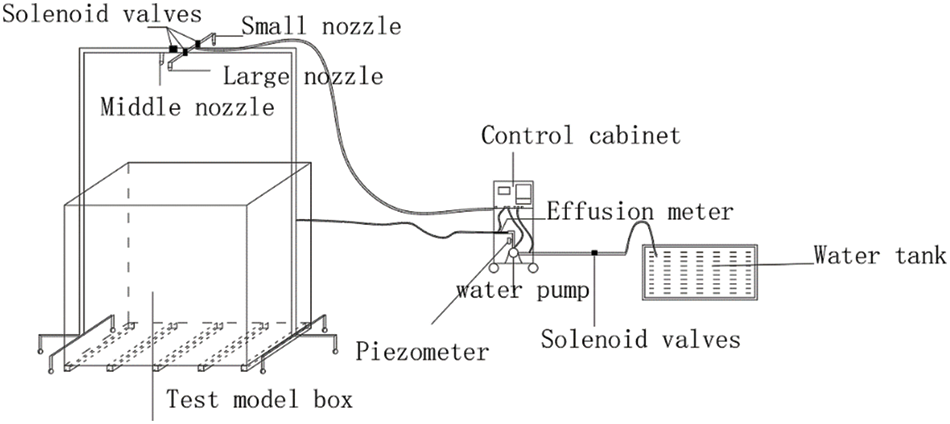
Figure 1: Diagram of rainfall device
3.2 Test Monitoring Scheme and Model Preparation
To acquire point cloud data, the deformation was monitored using a Z+F IMAGE○R5016 3D laser scanner. Moreover, as shown in Fig. 2, TEROS 21 sensor was used to monitor the matric suction. More precisely, with a range of −2000 kPa to −9 kPa and an accuracy of 0.1 kPa, the surrounding moisture of the soil was calculated using the moisture release curve of the internal porous material. Furthermore, as can be observed in Fig. 3, the content of the soil moisture was measured using the CSF 11 soil moisture sensor. This was done through generating and receiving signals by an internal crystal oscillator with the measurement and accuracy of 0%∼60%, and ±2%, respectively.
Figure 2: TEROS 21 matrix suction sensor
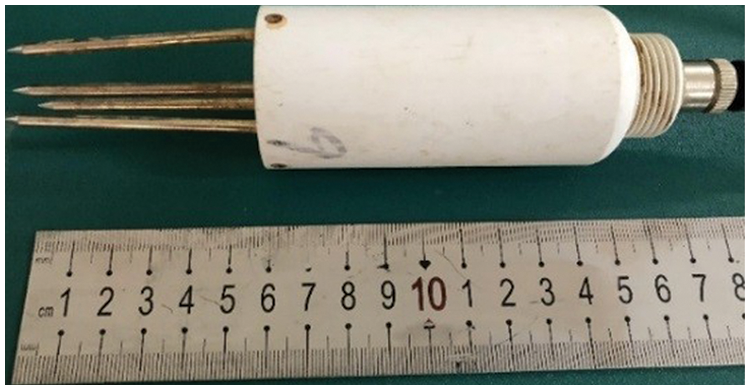
Figure 3: CSF 11 soil moisture sensor
Fig. 4 displays the HC-25 pore water pressure sensor. When under stress, the Wheatstone bridge inside the sensor loses its balance and, as a result, sends an electrical signal proportional to the pressure. The measuring range and the accuracy of the sensor were 0∼25 kPa and 0.2% F.S, respectively. Furthermore, as shown in Fig. 5, the pressure of the soil was monitored using a HC-16 miniature stress sensor, with the range and accuracy of 0∼100 kPa and 0.3% F.S, respectively.
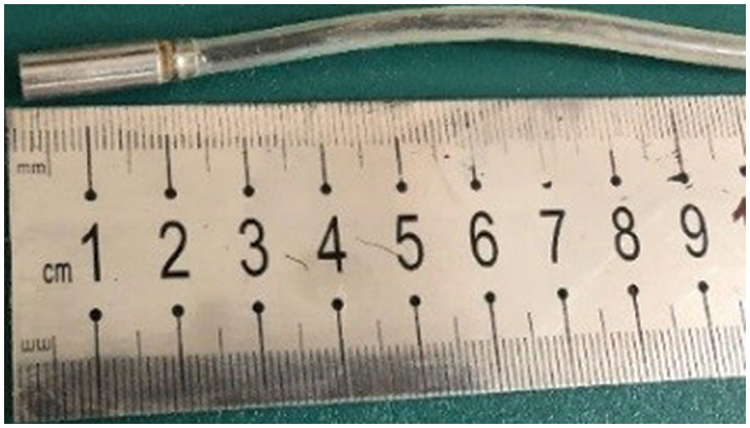
Figure 4: Pore water pressure sensor
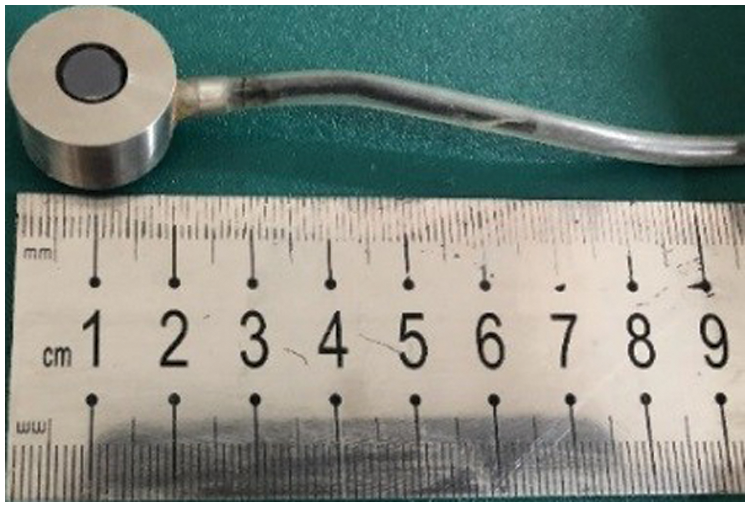
Figure 5: Soil pressure sensor
The sensor layout is shown in Fig. 6. Three groups of sensors were embedded in this experiment, the frequency of data acquisition of which was 1 min/time. While the first group of sensors was buried at a depth of 40 cm, the second and the third were buried at 50 and 25 cm, respectively.
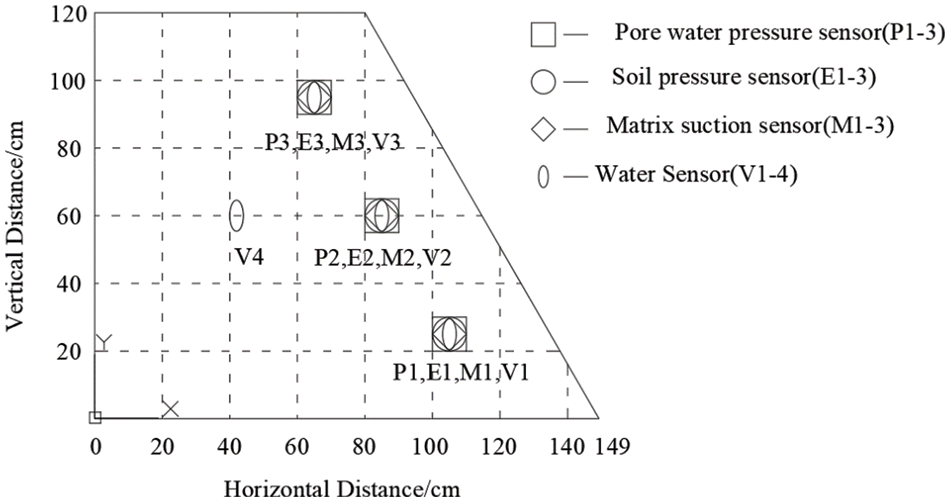
Figure 6: T3 group of sensors embedded position profile
To ensure the uniformity of the proposed slope model, layered filling method was applied. The parameters of the material were also verified through sampling and testing. To prevent the soil particles being lost through the existing holes, a permeable plate and a geotextile were initially laid at the bottom of the test box. The sensor was also embedded in the specified location (Fig. 6). When the height of the test model reached the required level, the slope was adjusted according to the design size of the model.
The length, width, and height of the accumulation soil model were 2.0, 1.5, and 1.2 m with the slopes of 30°, 45°, and 60°, at the trailing edge, respectively. The main purpose of this research was to study the mechanism and development process of rainstorm-induced large-scale accumulation body landslides. Moreover, the effects of different rainfall conditions and slopes on the stability of slope were investigated. Four groups of tests were designed for the test scheme. The material parameters and the rainfall conditions are demonstrated in Tables 1 and 2. Before taking the tests, each sensor was calibrated separately. Moreover, to ensure the stability and the reliability of the instrument readings, the model was tested after being stored for an entire one day.

Due to the low rainfall intensity of T2 test and the insignificant permeability coefficient, most of the water generated by the intermittent rainfall flew through the slope runoff. Therefore, it can be argued that only a small amount of erosion damage occurred near the slope toe. Accordingly, T4 test was performed.
3.4 Point Cloud Data Processing
Monitoring deformation with 3D laser scanning requires one-time scanning before, during and after the rainfall. Within the scanning range, the point cloud data of all objects was collected using the 3D laser scanner, which included irrelevant data as well. Accordingly, to remove the irrelevant data, the point cloud data was required to be denoised before post-processing [32]. Moreover, to completely scan the point cloud data, four-station scanning was required. Thus, the collected data was imported into the supporting JRC software to perform the multi-station splicing and point cloud data rasterization. Subsequently, for further interpretation and deformation comparison, the data was analyzed using the 3DReshaper software.
Fig. 7 displays the process of landslide development in T1 test. As can be observed, the wetting front deeply penetrated into the slope, causing the soil color to be deepened in the early stage of the rainfall. Next, the shallow erosion appeared on the surface of the slope body. As can be seen in Fig. 7c, with an increase in the rainfall time, the erosion ditch was gradually formed and, then, expanded all over the slope. The erosion ditch stopped after developing to a certain depth. According to the above landslide development process, the failure mode can be argued to be the erosion-induced local shallow sliding failure.
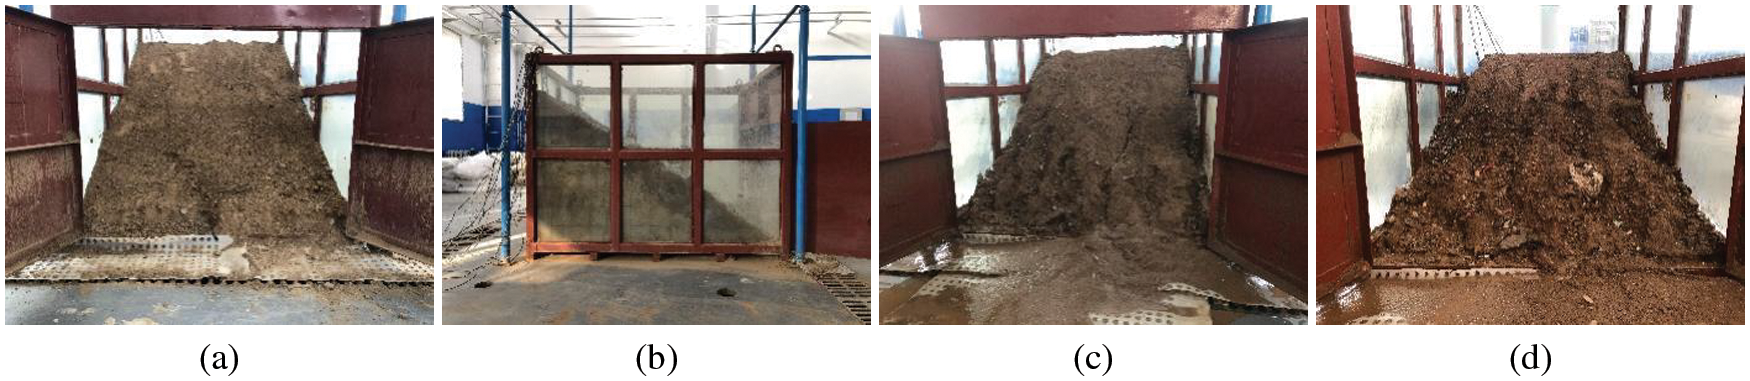
Figure 7: T1 development process of landslide; (a) prior to the rainfall; (b) penetration of the wetting front into the slope; (c) appearance of the erosion ditch; (d) failure of the slope
The process of landslide development in T2 test is shown in Fig. 8. In the early stage of the rainfall, the soil color deepened, the rainwater infiltrated slowly, and the loose fine soil particles on the slope were splashed. As the rain continued, a layer of mud film was formed on the slope surface. This layer hindered the total infiltration of rainwater, i.e., it was only partly infiltrated to the slope body. As can be seen in Fig. 8, the result reveals a small amount of erosion near the slope toe only, with no large displacement and no cracks in the slope.
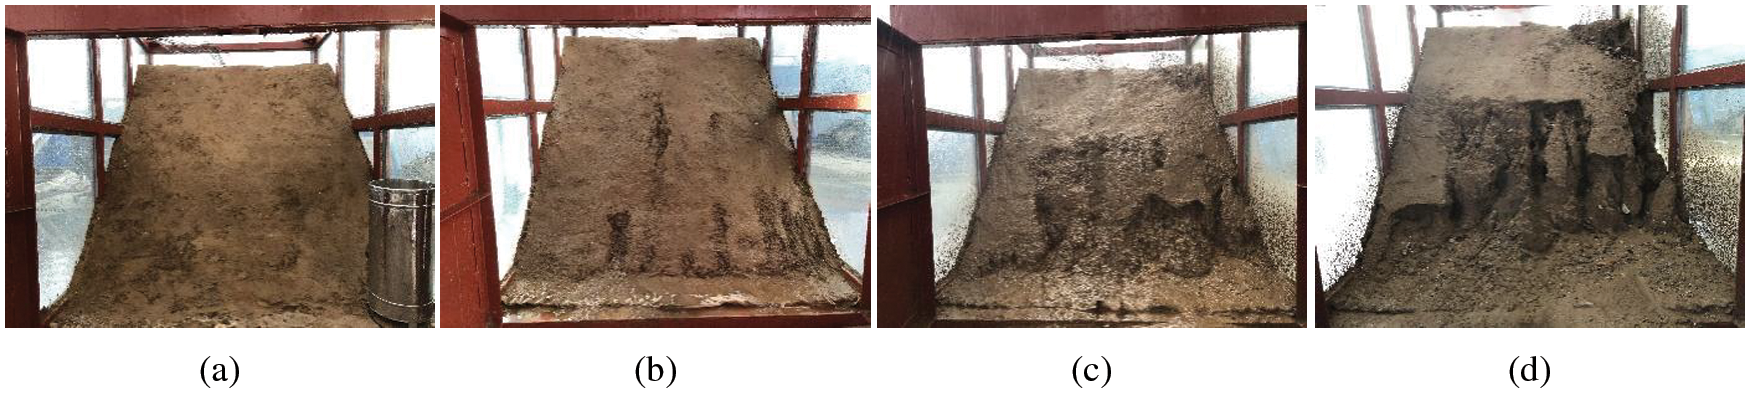
Figure 8: T2 and T4 development processes of landslide; (a) prior to the rainfall; (b) appearance of the erosion ditch; (c) failure of the slope toe; (d) failure of the slope body
In the T4 test, the rainfall was continuous. As can be observed in Fig. 8c, by the beginning of the rainfall, a large area of erosion appeared on the surface of the slope foot. Due to the erosion of runoff, several rills with the depths of about 15 cm extended from the toe to the slope. Afterward, based on Fig. 8d, the collapse block fell on the slope foot, and the damage continued and developed. While the local failure initially occurred at the toe of the slope, it then gradually expanded and finally led to the global failure. Hence, the failure mode of landslide is multi-stage backward landslide.
Fig. 9 shows the process of the landslide development in T3 test. As can be observed, water accumulated at the toe of the slope and the soil softened at the beginning of the test. As the rainfall continued, shallow landslide occurred at the slope toe. Subsequently, soil sliding developed from the bottom to the top, and eventually the whole slope surface suffered the shallow sliding failure, which, accordingly, can be argued to be the comprehensive failure of shallow sliding and erosion sliding.
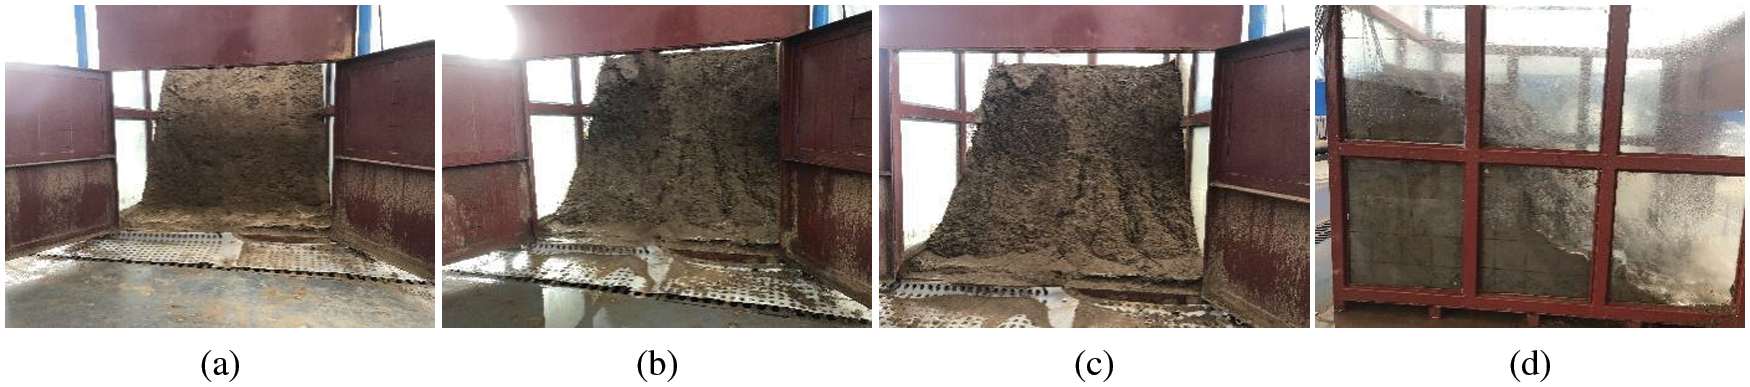
Figure 9: Development process of landslide for test T3; (a) prior to the rainfall; (b) appearance of the erosion ditch; (c) erosion ditch deepens and enlarges; (d) failure of the slope body
4.2 Influence of Slope Angle on Slope Stability
The monitoring data obtained from the first two days of T1, T2 and T3 tests were selected for analysis. With the intensity of 70–140 mm/h, the rainfalls of the first two days of the tests were almost the same. Figs. 7d, 8b and 9c display the influence of the rainfall on the failure modes of three groups of slopes. After comparative analysis, significantly different modes of failure were detected. This is to say that while the failure of the 30° slope belonged to the erosion-slip failure, that of the 60° slope belonged to the comprehensive failure of shallow collapse and erosion-slip. Furthermore, since the failure of 45° slope was insignificant, the failure mode was not obvious.
Fig. 10 shows the change in volumetric water content at the measuring points of the three groups of tests. The difference between the peak value and the initial value of the measuring point is defined as the maximum increment. The maximum increment of volumetric water content at the foot of the slope was close to that of the three test groups. Moreover, the maximum increment of volumetric water content under 30° was found to be significantly greater than that of the other two experimental conditions in the middle and top of the slope. In other words, the large rainfall area of the gentle slope facilitates the infiltration of rainwater. Rather than flowing to the foot, the infiltrated water flows into the depth of the slope through the runoff channel. Hence, the maximum increment of the foot of the slope is close to that of the steep slope.
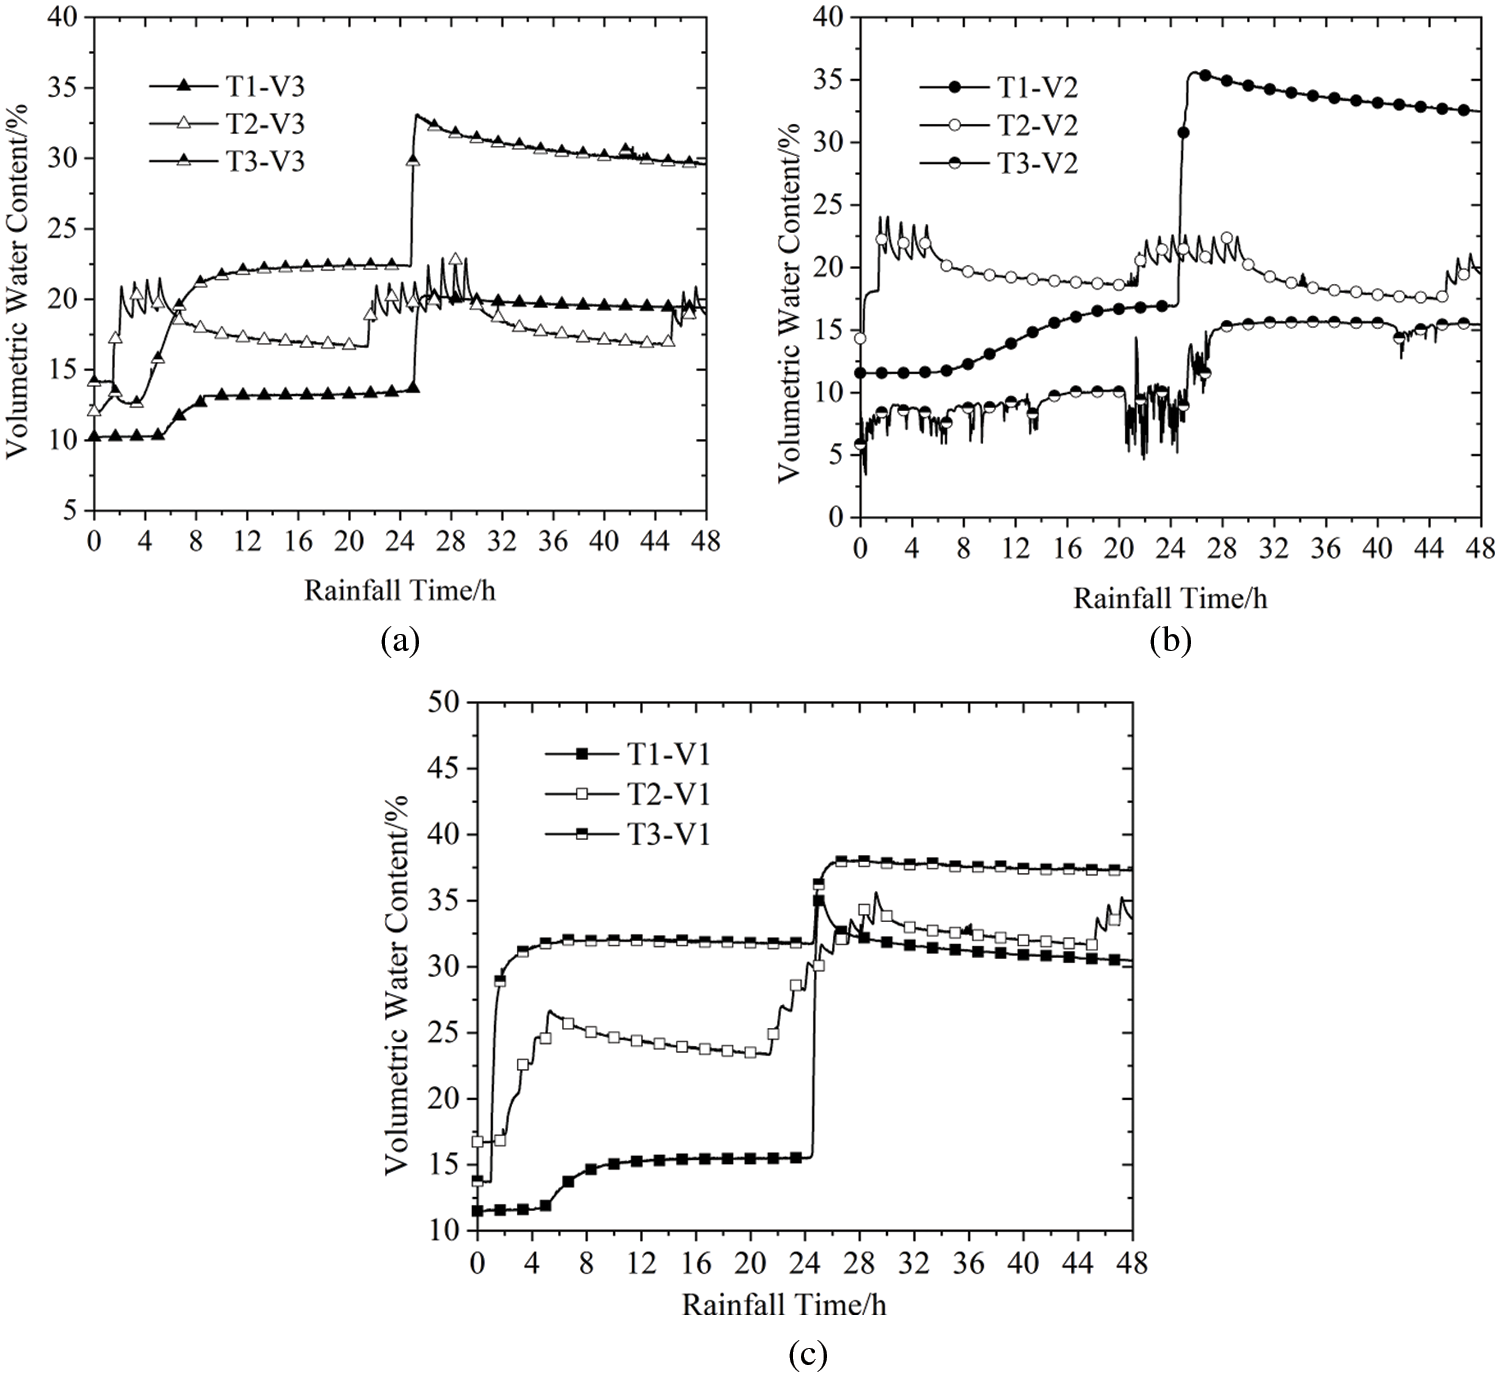
Figure 10: Variation in the volumetric water content at each measuring point of T1, T2 and T3 slopes; (a) top of the slope; (b) middle of the slope; (c) toe of the slope
Fig. 11 shows the change in the pressure of the pore water in the three groups of experimental conditions. While no pore water pressure was detected in the middle and at the top of the slope, the toe of the slope at 45° demonstrated the highest level of pressure. This was followed by the 30° and 60° of the experimental conditions. Therefore, no obvious relationship was found between the peak pore water pressure and the slope angle.
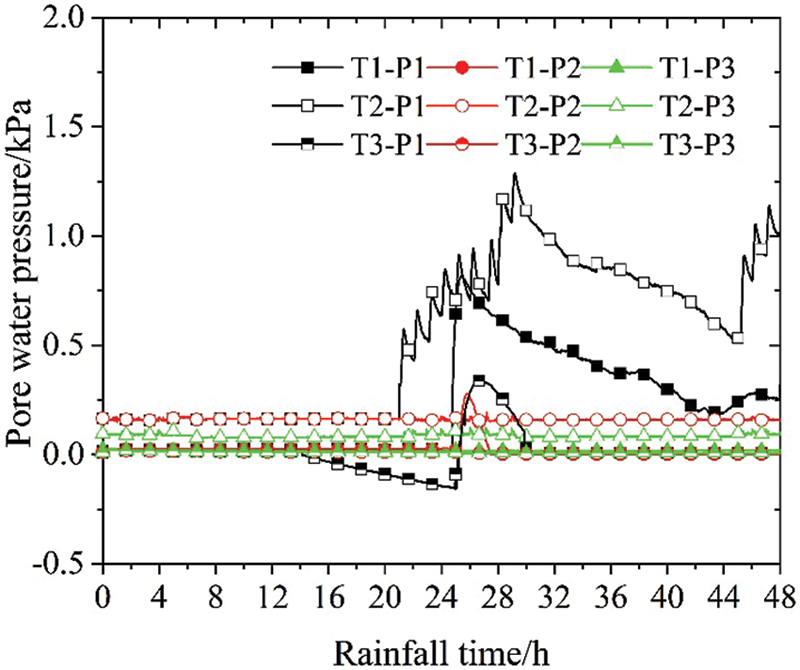
Figure 11: Variation of pore water pressure with time
To summarize, due to the large rainfall area of the gentle slope, the water could fully infiltrate from the surface, form a runoff channel, enter deep into the soil, and as a result, soften the soil. Consequently, the slope was prone to overall sliding failure. The steep slope was mainly due to the increase of water absorption on its surface, which, due to its unstable structure, made it prone to collapse.
4.3 Influence of Rainfall Pattern on Slope Stability
The sixth rainfall of T2 test and the first rainfall of T4 test were comparatively analyzed. In both tests, the amount of daily rainfall was the same. Moreover, the intermittent rainfall was 10 min per hour. Figs. 8b and 8c display the results obtained from the slope failure of intermittent rainfall and continuous rainfall, respectively. The analysis revealed a small amount of erosion damage at the foot of the slopes. Moreover, no large-scale landslide and deformation damage were found in the slopes, which was an indication of the similar initiation mode of slope landslide in the two rainfall conditions.
Figs. 12 and 13 demonstrate the variations in the volumetric water content and pore water pressure in the two rainfall conditions. Under the continuous rainfall, the peak volumetric water content was slightly larger than that of the intermittent rainfall at the middle and top of the slope. Moreover, with close peak values, the soil at the foot of the slope was saturated. In addition, the peak value of pore water pressure at the foot of the slope was slightly larger under continuous rainfall than the intermittent one. With the pore pressure of 0, the middle and the top of the slope were not saturated in either of the conditions. Furthermore, since the beginning of the rainfall, the volumes of the moisture content were observed to become stable after 8 and 12 h for the continuous and intermittent rainfalls, respectively.
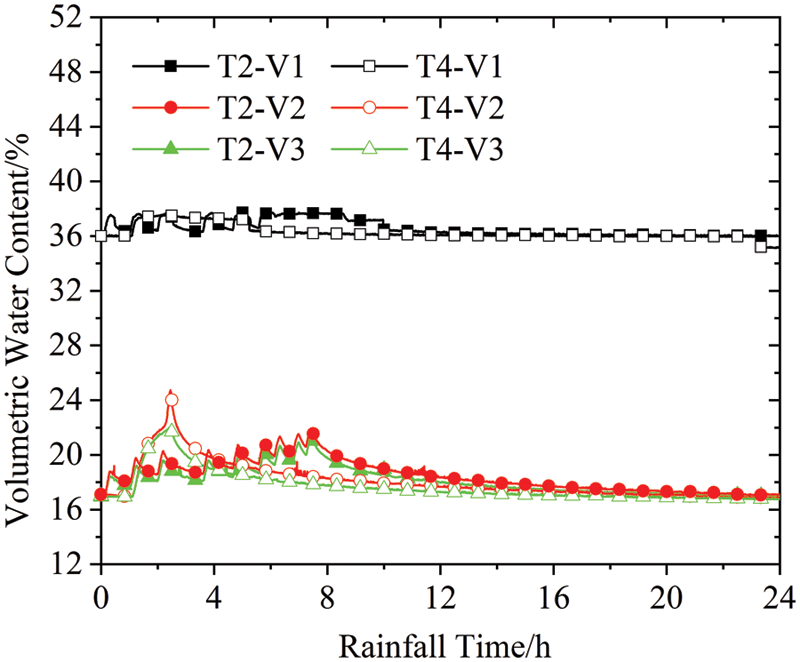
Figure 12: Variation of volumetric water content at each measuring point of T2 and T4 test slopes
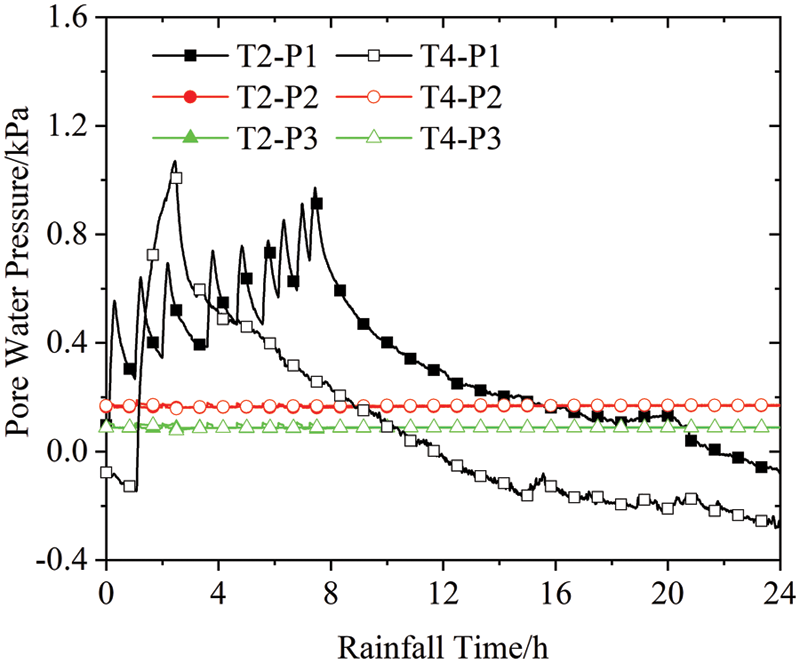
Figure 13: Variation of pore water pressure at each measuring point of T2 and T4 test slopes
To summarize, in the process of rainwater infiltration, the failure mode of the continuous and intermittent rainfalls on the accumulation body was close. However, the internal moisture of the slope took a longer time, the soil softening degree was higher, and the risk of overall sliding of the slope was greater in the intermittent rainfall.
4.4 Monitoring of 3D Laser Scanning Deformation
Using the 3D laser scanner, the slope model was scanned for several times before and after the test, the purpose of which was to generate an effective 3D model of elevation. To analyze the slope deformation and failure characteristics, the collected data was further processed using the JRC and 3DReshaper software. Fig. 14 shows the three-dimensional laser scanning maps of T3 test slope before and after the rainfall. The figures are obtained by assigning colors to different elevations of point cloud data. Furthermore, Fig. 14a is the scanned image of the 60° slope model before the rainfall. As can be seen, the slope has a relatively smooth surface, with a basically straight shoulder. As indicated by Fig. 14b, with only small erosion pits and a small amount of accumulation body at the toe, the soil at the slope shoulder was still relatively intact after a certain level of rainfall. Accordingly, this is an indication of the appropriate capability of the 3D laser scanner in reproducing the occurrence and development of landslides.
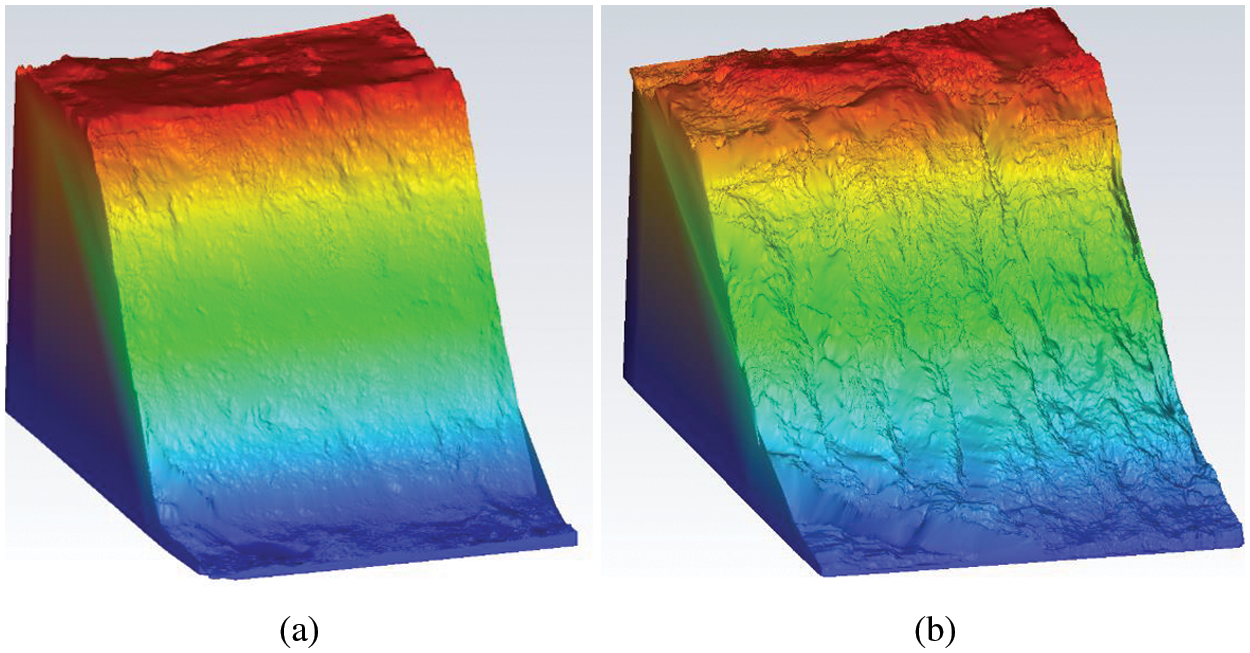
Figure 14: Three-dimensional scanning pictures of T3 test; (a) prior to the rainfall (b) after the rainfall
Fig. 15 demonstrates the overall slope deformation map of the T3 test. The map is generated through a comparison of the point cloud data of the same part of the slope model before and after certain level of rainfall. The red line in Fig. 15 represents the deformation degree of the corresponding elevation of the slope. While the maximum deformation of T3 slope occurred in the middle of the slope, relatively small deformation at the shoulder and the toe was observed. Using the 3D laser scanning technology, the point cloud data of the slope was instantly collected and the 3D model was constructed. The slope deformation was measured through a comparison of the 3D model before and after the rainfall. Consequently, efficient, accurate, and relatively simple monitoring results were obtained for slope monitoring. Hence, the practicality of the 3D laser scanning technology is corroborated.
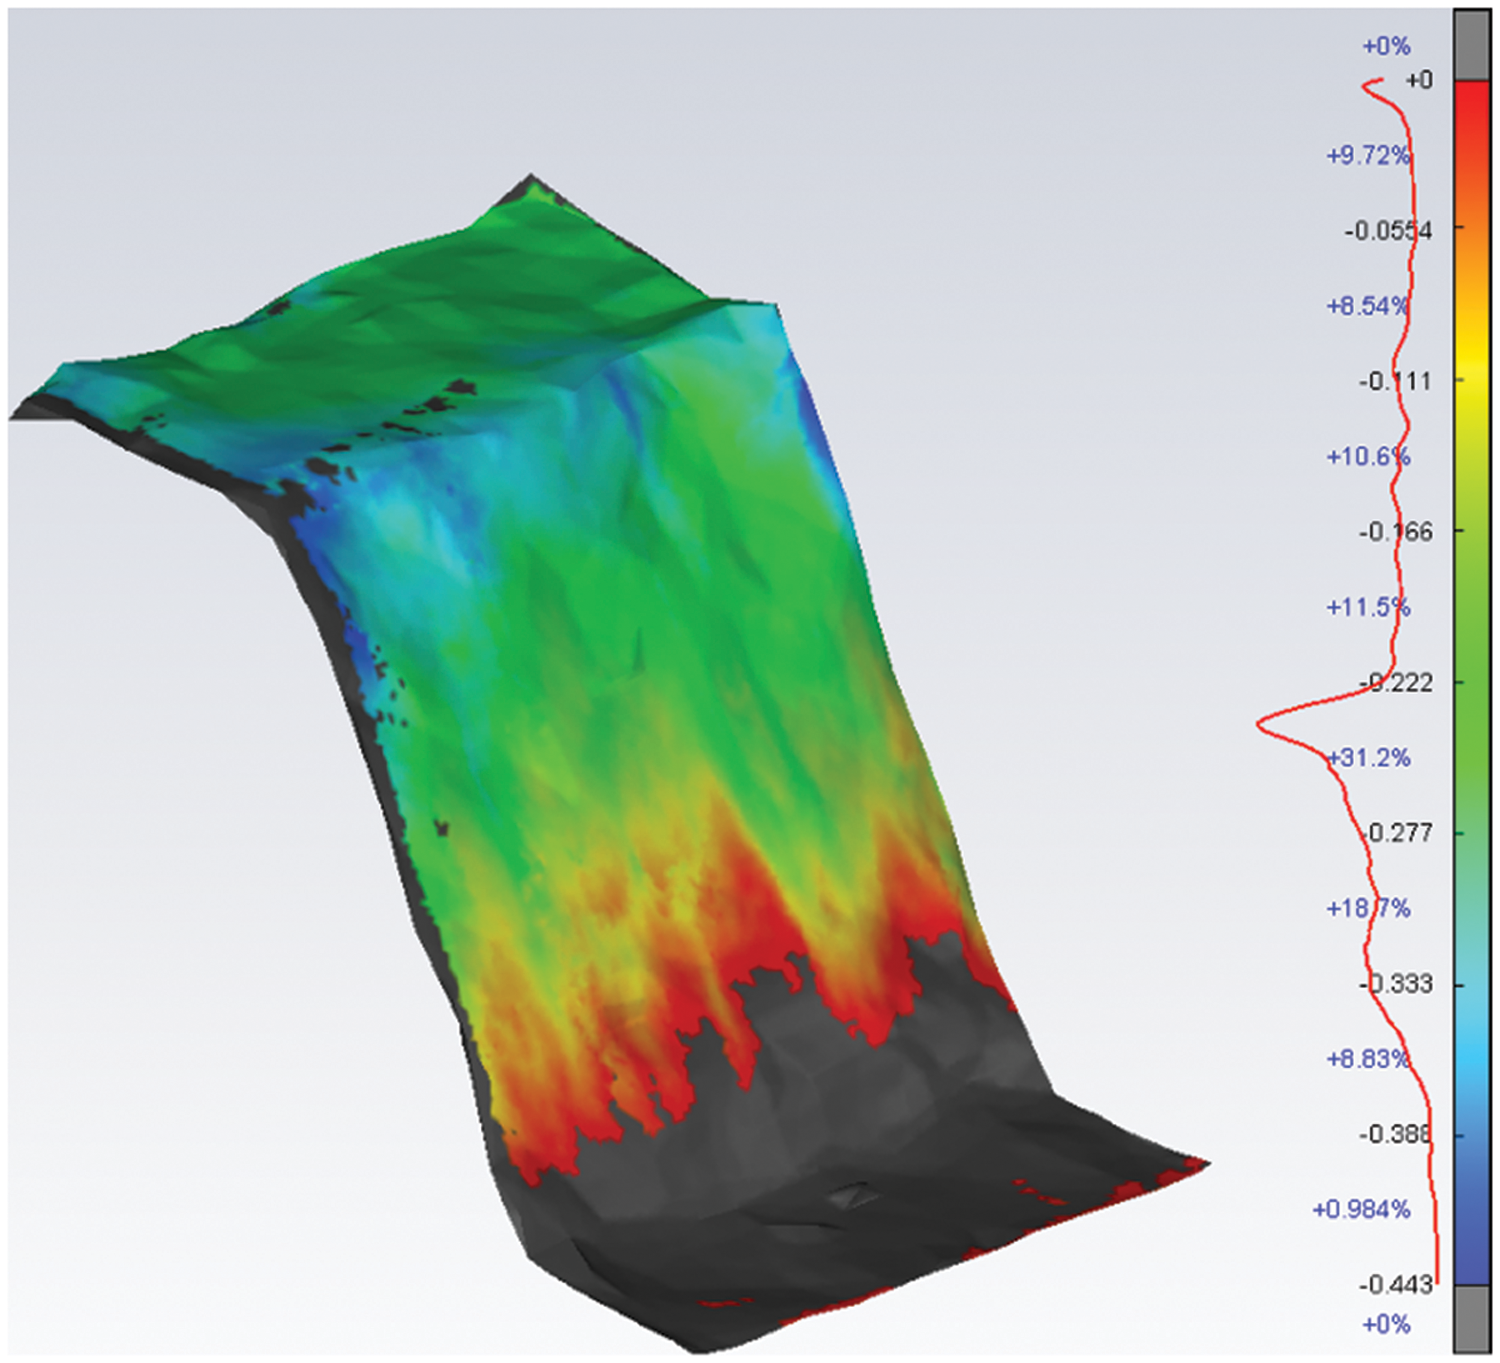
Figure 15: T3 test slope deformation figure
In the present study, indoor artificial rainfall model tests were taken to investigate the failure mechanism and rainwater infiltration of loose accumulation slope under rainstorm conditions. The following conclusions are preliminarily derived.
No significant relationship was found between the rainfall characteristics and the failure mode of the slope. This is to say that the stability of the slope is mainly determined by the amount of rainwater infiltration. The rainfall intensity used in the experiment was rainstorm-extreme rainstorm. Moreover, the level of daily rainfall was more than 70 mm, which was greater than the permeability coefficient of the accumulation model. Also, similar rainwater infiltration was found per unit time. So, the softening effect of soil slope was obvious after the rainfall. Moreover, intermittent rainfall was found to reduce slope stability more than continuous rainfall when rainfall infiltration per unit time was close and the rainfall was the same.
Considering the slope gradient, the slope’s stability of was mainly influenced by the speed of the rainwater infiltration as well as its own structural stability under rainstorm conditions. Certain model size demonstrated that the gentler slope led to the larger area of the rainfall, as well as the faster movement of the wetting front and the rainwater infiltration. However, gentler slopes proved better the structural stability which, in turn, suggested a longer time for the landslide to occur. On the other hand, steeper slopes were shown to have less stability. Finally, an increase in the soil gravity of the surface of the slope led to an increase in the sliding force and, consequently, made it prone to shallow landslides during the rainfall.
Three main types of slope failure modes were found for loose accumulation soil. In the first type, i.e., the erosion slip failure as in T1 test, the slope was eroded by rainfall and the whole slope slipped forward. The second type is the comprehensive failure of shallow collapse and erosion slip as in T3 test, in which tension cracks appeared on the slope, large area of slope collapsed, and the overall slope slipped forward. Yet, the third kind was multi-stage backward landslide failure, as in T4 test, where tensile cracks appeared at the foot of the slope, small-scale landslide appeared at the foot of the slope, and a series of tensile surface were gradually formed and developed into large-scale landslide.
Finally, the 3D laser scanning technology was found to be effectively and accurately used in monitoring the slope deformation in landslide model test of residual soil slope.
Funding Statement: National Key Research and Development Program of China (2018YFC0809900), National Natural Science Foundation of China (41772335), General Project of National Natural Science Foundation of China (51774184), Yuyou Team Project of North China University of Technology (107051360019XN134/017).
Conflicts of Interest: The authors declare that they have no conflicts of interest to report regarding the present study.
References
1. Lainas, S., Depountis, N., Sabatakakis, N. (2021). Preliminary forecasting of rainfall-induced shallow landslides in the wildfire burned areas of western Greece. Land, 10(8), 877. DOI 10.3390/land10080877. [Google Scholar] [CrossRef]
2. Arai, N., Chigira, M. (2019). Distribution of gravitational slope deformation and deep-seated landslides controlled by thrust faults in the Shimanto accretionary complex. Engineering Geology, 260, 105236. DOI 10.1016/j.enggeo.2019.105236. [Google Scholar] [CrossRef]
3. Xu, W. Y., Zhou, W. J., Yan, L. (2020). Research progress on seepage stability of rainfall accumulation landslide. Advances in Science and Technology of Water Resources, 40(4), 87–94. [Google Scholar]
4. Ali, M. Z., Chu, H., Chen, Y., Ullah, S. (2021). Machine learning in earthquake- and typhoon-triggered landslide susceptibility mapping and critical factor identification. Environmental Earth Sciences, 80(6), 1–21. DOI 10.1007/s12665-021-09510-z. [Google Scholar] [CrossRef]
5. Li, Q. M., Gou, G., Zhou, J. W., Gan, B. R. (2019). Experimental study on large scale physical model of rainstorm accumulation landslide. Gansu Water Resources and Hydropower Technology, 55(6), 22–26+31. [Google Scholar]
6. Marino, P., Comegna, L., Damiano, E., Olivares, L., Greco, R. (2020). Monitoring the hydrological balance of a landslide-prone slope covered by pyroclastic deposits over limestone fractured bedrock. Water, 12(12), 3309. DOI 10.3390/w12123309. [Google Scholar] [CrossRef]
7. Quan, X., Shi, H. W., Cai, Q. G., He, J. J., Zheng, M. G. et al. (2021). Experimental study on settlement degree of loess slope under simulated rainfall. Journal of Shaanxi Normal University (Natural Science Edition), 49(2), 98–106. [Google Scholar]
8. Dematteis, N., Wrzesniak, A., Allasia, P., Bertolo, D., Giordan, D. (2022). Integration of robotic total station and digital image correlation to assess the three-dimensional surface kinematics of a landslide. Engineering Geology, 303, 106655. DOI 10.1016/j.enggeo.2022.106655. [Google Scholar] [CrossRef]
9. Lyu, C. X., Maerz, N. H., Boyko, K. J. (2021). Terrestrial LiDAR system accuracy investigation for slow-moving landslide deformation. Journal of Applied Remote Sensing, 15(4), 044510. DOI 10.1117/1.JRS.15.044510. [Google Scholar] [CrossRef]
10. Xing, Z. Y. (2020). Application of 3D laser scanning technology in slope monitoring. Surveying and Mapping and Spatial Geographic Information, 43(6), 222–224. [Google Scholar]
11. Liu, G. N., Li, C., Lu, B., Zhu, J. B., Wang, X. W. et al. (2020). Model test study on shallow instability of fully strongly weathered rock slope induced by rainfall. Journal of Changjiang Academy of Sciences, 37(7), 88–95+104. [Google Scholar]
12. Greco, R., Comegna, L., Damiano, E., Marino, P., Olivares, L. et al. (2021). Recurrent rainfall-induced landslides on the slopes with pyroclastic cover of Partenio Mountains (Campania, ItalyComparison of 1999 and 2019 events. Engineering Geology, 288, 106160. DOI 10.1016/j.enggeo.2021.106160. [Google Scholar] [CrossRef]
13. Duc, D. M., Khang, D. Q., Duc, D. M., Ngoc, D. M., Quynh, D. T. et al. (2020). Analysis and modeling of a landslide-induced tsunami-like wave across the Truong River in Quang Nam Province, Vietnam. Landslides, 17(10), 2329–2341. DOI 10.1007/s10346-020-01434-2. [Google Scholar] [CrossRef]
14. Liu, H. Z., Xu, H., Bao, H. J., Xu, W., Yan, X. F. et al. (2021). Characteristics analysis of rainfall-induced landslide thresholds in local regions. Journal of Natural Disasters, 30(4), 181–190. [Google Scholar]
15. Yuan, J., Papaioannou, I., Straub, D. (2019). Probabilistic failure analysis of infinite slopes under random rainfall processes and spatially variable soil. Georisk, 13(1), 20–33. DOI 10.1080/17499518.2018.1489059. [Google Scholar] [CrossRef]
16. Zeng, C. L., Li, R. J., Guan, X. D., Zhang, S. B., Bai, W. S. (2020). Experimental study on rainfall infiltration characteristics of loess slope under different rainfall intensities. Chinese Journal of Geotechnical Engineering, 42(S1), 111–115. [Google Scholar]
17. Vadivel, S., Sennimalai, C. S. (2019). Failure mechanism of long-runout landslide triggered by heavy rainfall in Achanakkal, Nilgiris, India. Journal of Geotechnical and Geoenvironmental Engineering, 145(9), 04019047. DOI 10.1061/(ASCE)GT.1943-5606.0002099. [Google Scholar] [CrossRef]
18. Xiao, J. F., Li, Y. A., Hu, Y., Zhang, S., Cai, J. M. (2021). Model test study on deformation characteristics of ancient landslide under reservoir water fuctuation and rainfall. Rock and Soil Mechanics, 42(2), 471–480. [Google Scholar]
19. Wang, Y. B., Zhu, B. Q., Zhou, C., Tan, C. M., Han, L. B. (2020). Model test study on influence of rainfall and soaking at slope toe on soil slope. Journal of Water Resources and Architectural Engineering, 18(2), 21–26+32. [Google Scholar]
20. Liu, Y., Deng, Z. Y., Wang, X. K. (2021). The effects of rainfall, soil type and slope on the processes and mechanisms of rainfall-induced shallow landslides. Applied Sciences, 11(24), 11652. DOI 10.3390/app112411652. [Google Scholar] [CrossRef]
21. Hojat, A., Arosio, D., Ivanov, V. I., Longoni, L., Papini, M. et al. (2019). Geoelectrical characterization and monitoring of slopes on a rainfall-triggered landslide simulator. Journal of Applied Geophysics, 170, 103844. DOI 10.1016/j.jappgeo.2019.103844. [Google Scholar] [CrossRef]
22. Guo, C. B., Zhang, Y. S., Liu, D. T., Hua, S., Ren, S. S. et al. (2022). Centrifuge model test of reactivation mechanism of Jiangdingya ancient landslide in Gansu province. Journal of Engineering Geology, 30(1), 164–176. [Google Scholar]
23. Pajalić, S., Peranić, J., Maksimović, S., Ceh, N., Jagodnik, V. et al. (2021). Monitoring and data analysis in small-scale landslide physical model. Applied Sciences, 11(11), 5040. DOI 10.3390/app11115040. [Google Scholar] [CrossRef]
24. Beaulieu, O. P., Witte, L. D., Wickert, A. D. (2021). Mechanistic insights from emergent landslides in physical experiments. Geology, 49(4), 392–396. DOI 10.1130/G47875.1. [Google Scholar] [CrossRef]
25. Ye, W. J., Zhang, Y. P. (2021). Model test study on instability of loess slopes under long-term rainfall. Chinese Science Paper, 16(6), 603–609. [Google Scholar]
26. Kennedy, R., Take, W. A., Siemens, G. (2021). Geotechnical centrifuge modelling of retrogressive sensitive clay landslides. Canadian Geotechnical Journal, 58(10), 1452–1465. DOI 10.1139/cgj-2019-0677. [Google Scholar] [CrossRef]
27. Schilirò, L., Poueme, D. G., Esposito, C., Scarascia, M. G. (2019). The role of initial soil conditions in shallow landslide triggering: Insights from physically based approaches. Geofluids, 2019, 1–14. DOI 10.1155/2019/2453786. [Google Scholar] [CrossRef]
28. Sun, P., Wang, G., Wu, L. Z. (2019). Physical model experiments for shallow failure in rainfall-triggered loess slope, Northwest China. Bulletin of Engineering Geology and the Environment, 78(6), 4363–4382. DOI 10.1007/s10064-018-1420-5. [Google Scholar] [CrossRef]
29. Gan, J. J., Tang, C., Chen, B. G., Luozang, Q. P., Yang, T. (2019). Model test of rainfall infiltration on accumulation landslide with weak interlayer. Science Technology and Engineering, 19(18), 109–117. [Google Scholar]
30. Liao, H. M., Yang, X. G., Lu, G. D. (2019). Experimental study on the river blockage and landslide dam formation induced by rock slides. Engineering Geology, 261, 105269. DOI 10.1016/j.enggeo.2019.105269. [Google Scholar] [CrossRef]
31. Jacob, C., Ivan, G. (2019). A study on the effect of rainfall and slope characteristics on landslide initiation by means of flume tests. Landslides: Journal of the International Consortium on Landslides, 16(1), 2369–2379. [Google Scholar]
32. Si, M. Y., Zhou, Y., Guo, J. M., Yuan, Y. T., Bai, Z. Y. et al. (2020). Deformation monitoring and analysis of high slope based on 3D laser scanning technology. Science Technology and Engineering, 20(19), 7922–7927. [Google Scholar]
Cite This Article
 Copyright © 2023 The Author(s). Published by Tech Science Press.
This work is licensed under a Creative Commons Attribution 4.0 International License , which permits unrestricted use, distribution, and reproduction in any medium, provided the original work is properly cited.
 Downloads
 Citation Tools