
 Submit a Paper
 Propose a Special lssue
 Open Access
ARTICLE

Experimental Research on the Millimeter-Scale Distribution of Oil in Heterogeneous Reservoirs
1 Exploration & Development Research Institute, Daqing Oilfield Company, Daqing, 163712, China
2 Heilongjiang Provincial Key Laboratory of Reservoir Physics & Fluid Mechanics in Porous Media, Daqing, 163712, China
* Corresponding Author: Zhao Yu. Email:
(This article belongs to the Special Issue: Advanced Oil and Gas Transportation and Treatment Technologies)
Fluid Dynamics & Materials Processing 2023, 19(6), 1521-1534. https://doi.org/10.32604/fdmp.2023.023296
Received 19 April 2022; Accepted 26 July 2022; Issue published 30 January 2023
 View Full Text
 Download PDF
Abstract
Oil saturation is a critical parameter when designing oil field development plans. This study focuses on the change of oil saturation during water flooding. Particularly, a meter-level artificial model is used to conduct relevant experiments on the basis of similarity principles and taking into account the layer geological characteristics of the reservoir. The displacement experiment’s total recovery rate is 41.35%. The changes in the remaining oil saturation at a millimeter-scale are examined using medical spiral computer tomography principles. In all experimental stages, regions exists where the oil saturation decline is more than 10.0%. The shrinkage percentage is 20.70% in the horizontal well production stage. The oil saturation reduction in other parts is less than 10.0%, and there are regions where the oil saturation increases in the conventional water flooding stage.Keywords
Nomenclature
| PIi | Physical interlayer [i = 1–2] |
| Soi | Initial oil saturation [%] |
| Sor | Remaining oil saturation [%, i = 1 − x × y × z] |
| V | Volume of each part [cm3] |
| WVi∼n | Part volume weight [%, i = 1–13] |
| Htop | Distance from the top of model [cm] |
| K | Permeability [10−3 μm2] |
| Wi | Injection Well [i = 1–2] |
| Oi | Production Well [i = 1–6] |
| SP1∼i | Sample port [i = 1–30] |
| νin | Injection rate of a well [ml/min] |
| fw | The water cut of the flooding stage [%] |
| PA/PB | Pump A/B injection pressure [KPa] |
| PV | Pore volume [cm3] |
| ER | The total recovery rate [%] |
| ΔER | Stage recovery rate addition [%] |
| CWF stage | Conventional water flooding stage [fw, νin] |
| FSuWF stage | First speed-up the water flooding stage [fw, νin] |
| SSuWF stage | Second speed-up the water flooding ftage [fw, νin] |
| CFD stage | Changing flow direction stage [fw, νin] |
| HWP stage | Horizontal well production stage [fw, νin] |
The distribution of remaining oil in the reservoir after water flooding is a hot topic in the study of enhanced oil recovery technology [1–3]. Druetta et al. [4] used a 2D multiphase simulation at macro-micro scale of a recovery process with different fluid models, and studied the capillary forces affect on the recovery efficiency, finding the viscosity of the displacing phase and the interfacial forces play a vital role in the microscopic sweeping efficiency in flooding processes. Ren et al. [5] conducted a simulation study on injection into reservoirs subject to either water flooding or long-term natural water flooding, indicating that residual oil zones are widespread reservoirs. The structural location of the remaining oil enrichment is more complex [6–8]. A microscopic residual oil distribution law after water flooding in the layer is more dispersion [9–11]. Akai et al. [12] used direct numerical simulation to study the mechanism of microscopic displacement during enhanced oil recovery in mixed-wet rocks. Heydari-Farsani et al. [13–16] proposed that the characteristics of reservoirs and structures can affect the location and migration direction of hydrocarbons. Liu et al. [17] analyzed the mechanism and effect of nitrogen foam flooding using sand-packing pipe experiments to enhance oil recovery and concluded that high-porosity, high-permeability, and strong edge-water reservoirs entered the high water-cut stage in the middle and late development stages, with the remaining oil mainly distributed at the top and edge of the structure and reservoirs. Rezaeiakmal et al. [18] compared the performance displacement oil between the conventional foam and polymer-enhanced foam in the heterogeneous porous media using visualization experiments, and the performance displacement oil of polymer-enhanced foam in the vertical mode was better than that in the horizontal mode. Ma [19] investigated the adaptability of kilometer-scale-well patterns in oilfields using a combination of theoretical research and numerical simulation of oil reservoirs. The results show that the more complex the geological structure of the reservoir formed by water flooding, the more difficult it is to produce the remaining oil by water flooding. Ma et al. [20] and Xie et al. [21] investigated the microscopic pore structure and characteristics of rock seepage capacity. Abdulkareem et al. [22] studied the residual oil mobilization by inducing vibration through the laboratory way in porous media. Ma et al. [23] and Li et al. [24] investigated the pore-scale continuous flow and nanometer scale on the causes, types, and reproduction mechanisms of the remaining oil. The flow laws of the different fluids were analyzed. Parmigiani et al. [25–29] investigated the relationship between relative permeability, capillary pressure, and oil saturation. Ma et al. [30], and Wang et al. [31] investigated the changes in oil saturation due to reservoir pore size and the hydrodynamic radius of the chemical constituents in the injected fluid using fluid flow simulation experiments. We can obtain residual oil distribution and quantification data on the nanomicro pore level using industrial computed tomography (CT) scanning reconstruction technology [32,33] and nuclear magnetic resonance technology [34]. Fannir et al. [35] studied the experimental research on two-phase flow displacement using Magnetic Resonance Imaging (MRI) techniques and investided the process of the phase trapping, the front deformation and the phases saturation propagation along a vertical model during (water-oil) two-phase flow. Yadali Jamaloei et al. [36–38] analyzed the effect of wettability on the microscopic oil displacement mechanism. Alyafei et al. [39] took cores containing oil and a specified initial water saturation, injected water flooding until 10 pore volumes, and observed the relationship between the initial oil saturation and the residual saturation. Gao et al. [40] and Li et al. [41] used industrial CT to obtain the fluid distribution in the pores through laboratory fluid experiments, with precision down to the nanometer scale. The experimental simulation process and the actual seepage process of the oil layer differ because the sample is too small. In this study, we created a meter-scale model similar to the actual oil layer structure based on the principle of similarity, and we arranged the well pattern according to the oilfield production process. We performed indoor oil displacement experiments, using the MSCT to obtain distribution data of an oil saturation distribution at millimeter-scale at different displacement stages, and using grayscale processing software to obtain an oil saturation distribution picture. We studied the quantitative change of oil saturation in different structural parts using an oil saturation distribution picture.
2.1 The Artificial Experimental Model
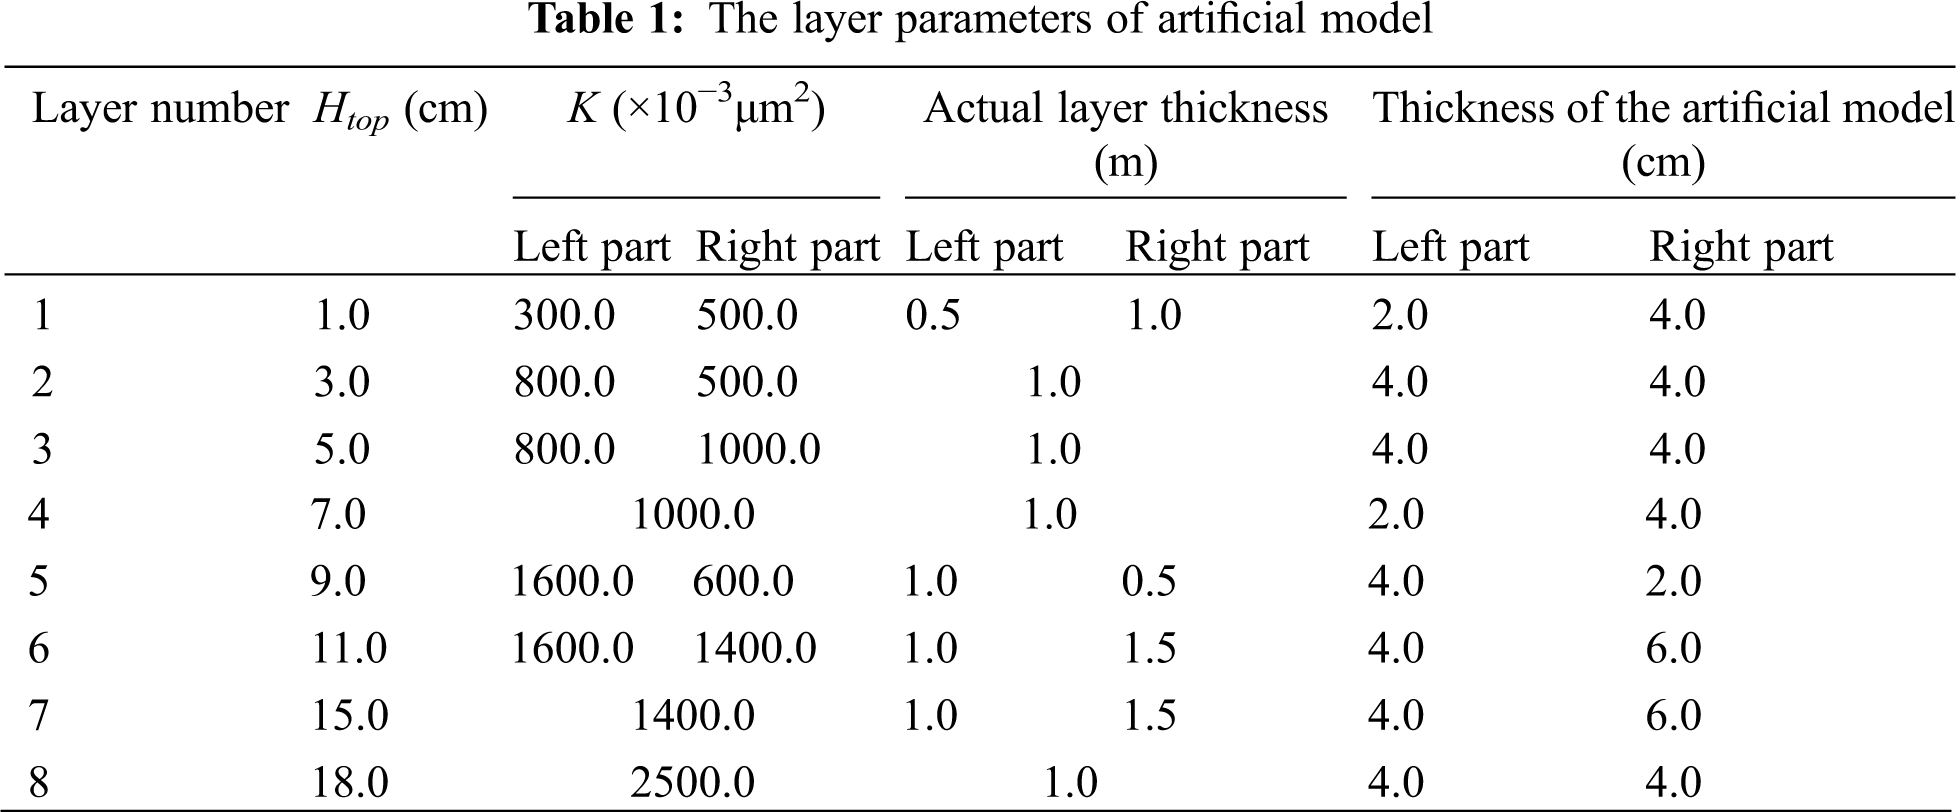
The layers of the study reservoir are a low-curved channel and the middle of the point bar; the reservoir structure includes two physical interlayers (PIs), and the inclination of the PIs is 5 degrees. Based on the actual oil layer structure characteristics of the reservoir, and the permeability and pore structure characteristics of each layer, we studied the core particle size composition, cement content, and the pressing pressure in the mode-made process, and based on the relevant research results of other researchers [42,43], we studied both the fabrication and composition parameters of each layer in the artificial model to create the artificial model. The red line in Fig. 1 represents the PI, the permeability of the PI is 30.0 × 10⁻³μm2 and the thickness is 0.1 m in the layer. The permeability in the artificial model is 30.0 × 10⁻³μm2 and the thickness is 4.0 mm in the artificial model. The structure of the artificial model is shown in Fig. 1. Both parameters of each part in the artificial model and the parameters of the layers are shown in Table 1.
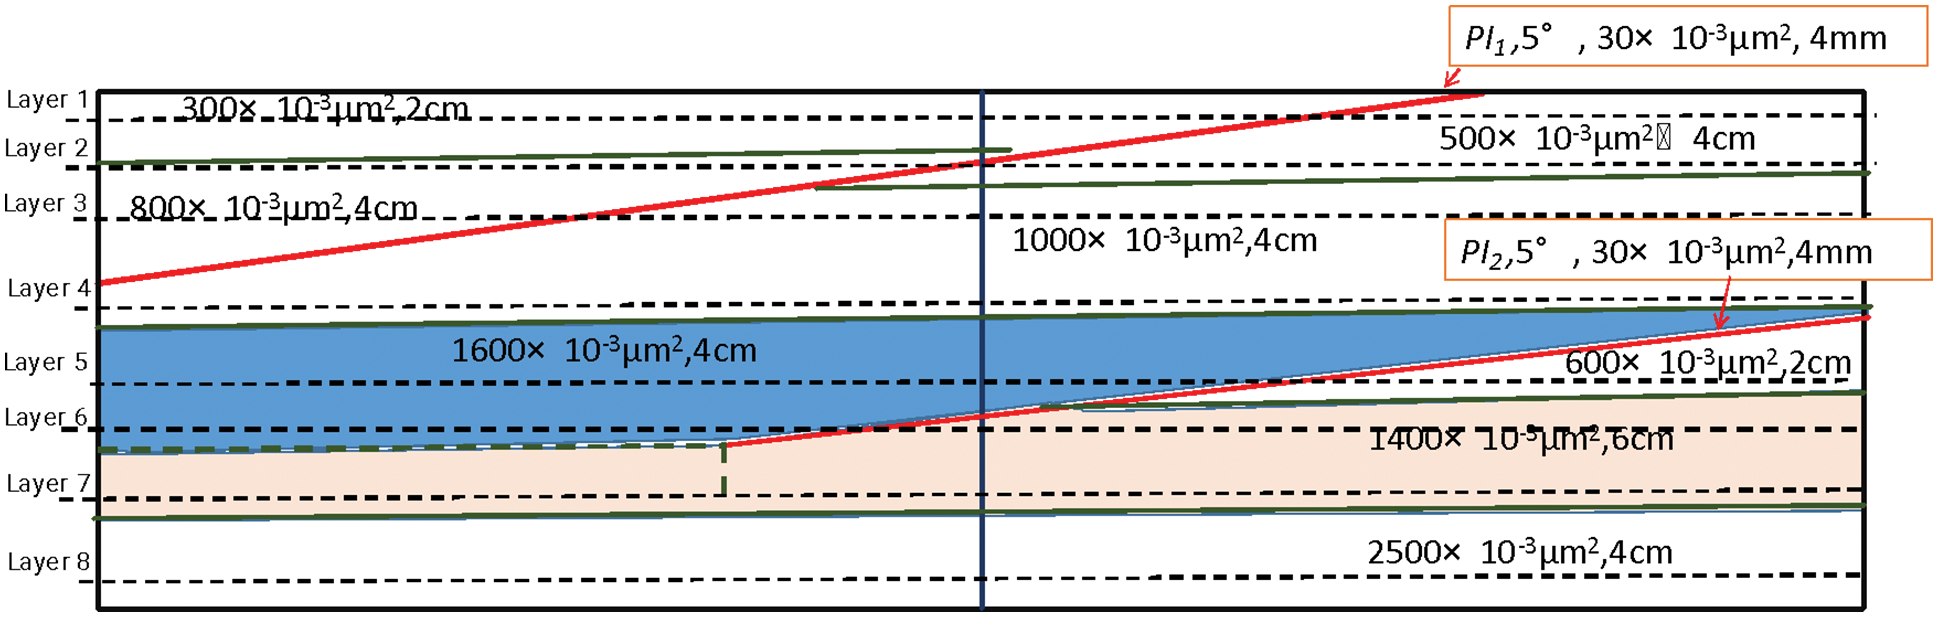
Figure 1: The schematic of the model structure (the red line represents the PIs)
The geometric dimensions of the model are 60 cm in length (z-direction), 30 cm in width (x-direction), and 20.8 cm in thickness (y-direction), and the net weight of the model is 82.60 kg.
We select eight different layers in the artificial model for comparative analysis of the distribution change in the remaining oil. The locations of the analysis layers are shown in Fig. 1 and Table 1.
There are two water wells (Wi, i = 1–2) and six oil wells (Oi, i = 1–6) at the top of the model and 30 sample ports in four directions on the side. We conducted the saturated water process, saturated oil, and process oil displacement experiments using the above 38 channel ports. The location schematic of channel ports is shown in Fig. 2.
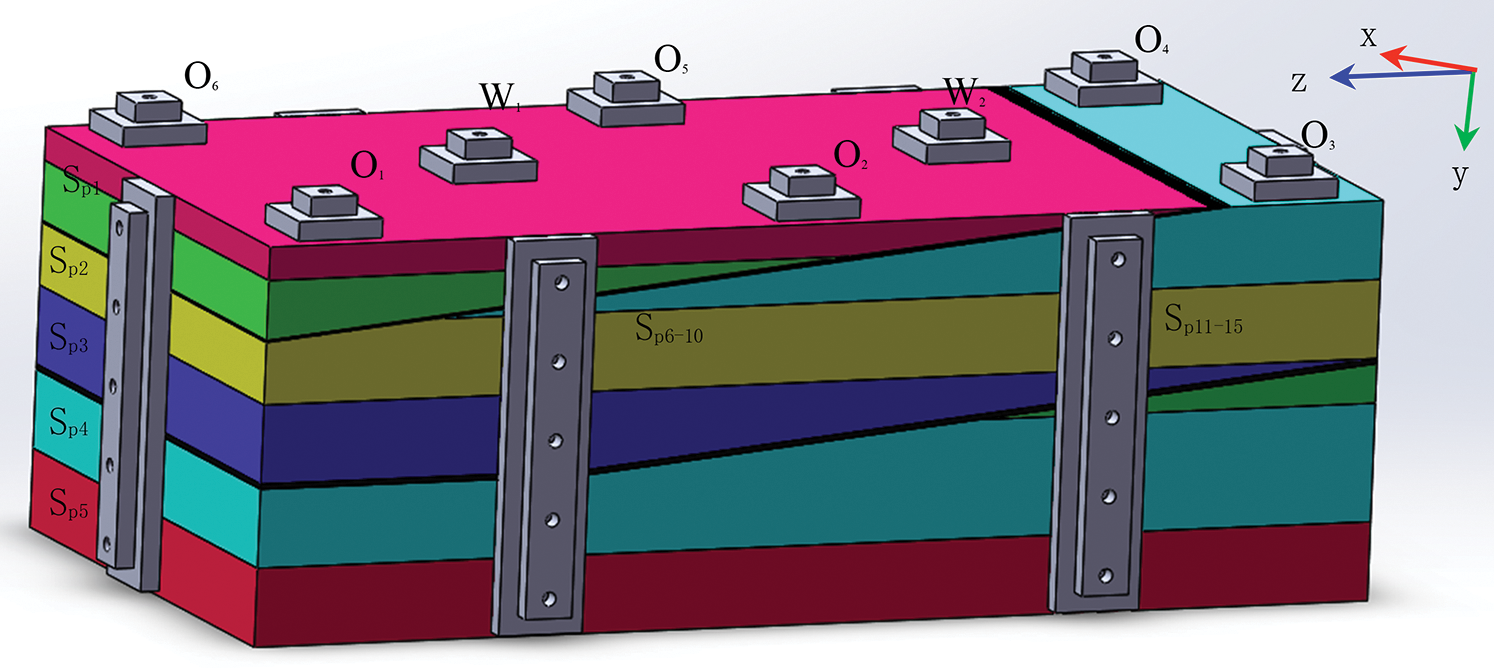
Figure 2: Schematic of the channel ports of the artificially heterogeneous model in the three-dimensional position
Under an experimental temperature of 24°C condition, the dead oil in the laboratory has a 0.84 g/cm3 density and a 10.0 mPa⋅s viscosity, which is provided with light kerosene on site. The synthetic brine is a 150000 ppm KI solution.
The CT instrument model for the experiment is a Toshiba Aquilion 16-row spiral CT. The scanning layer distances in three directions, X, Y, and Z, are 0.77, 0.77, and 0.25 mm, respectively; the frame rotation time was 0.3 s, the scanning field was 750.0 mm, the tube voltage was 120 kV, the tube current was 250 mA, the matrix is 390 × 270 × 2400, the layer thickness is 0.25 mm, and the interval is 0.25 mm. The MSCT test equipment is shown in Fig. 3.
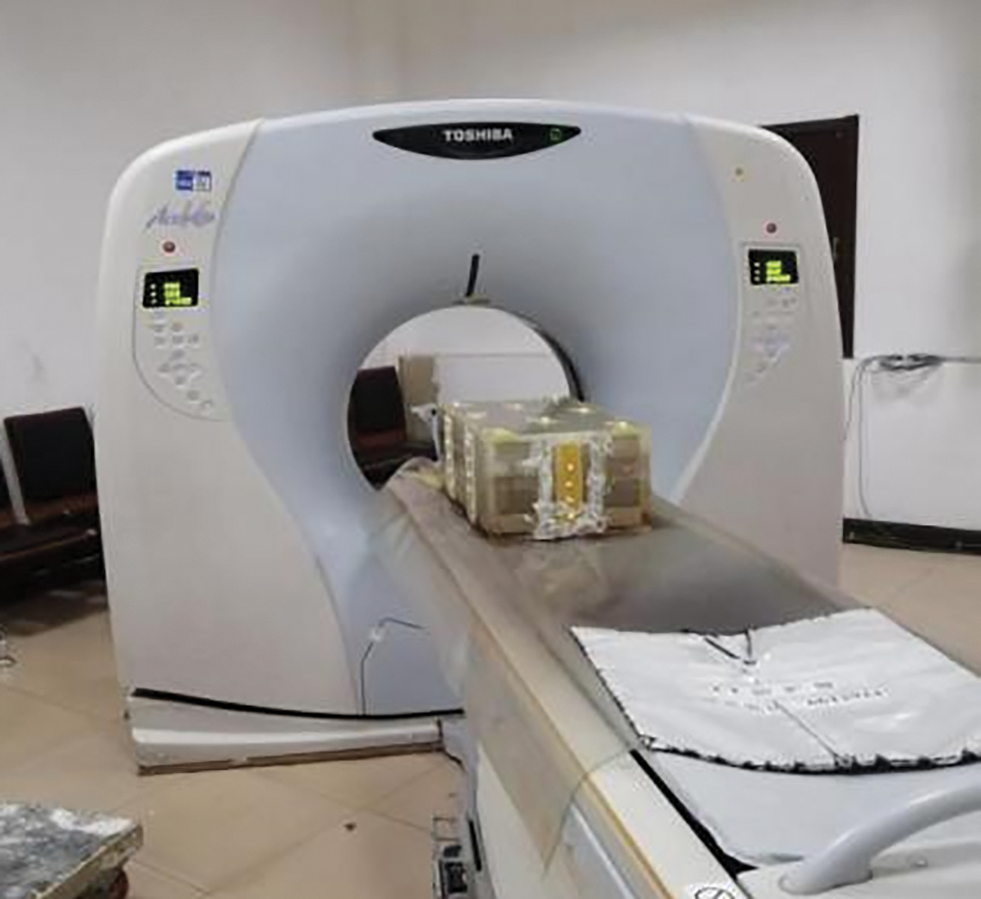
Figure 3: Picture of toshiba aquilion 16-row spiral CT
We performed oil displacement experiments using different water flooding development methods. After each oil displacement experimental stage, we perform an MSCT scan on the artificial model and obtain MSCT data of the remaining oil distribution in different layers of the artificial model.
The following is the procedure for the oil displacement experiment:
(1) The saturated water stage: First, we used a negative vacuum pressure-saturated water method, accumulating 3.45 L of saturated water. Then, by using the seepage method, the injection rate of a well (νin) of injection is 2.40 ml/min, and the saturated water volume is 8.235 L. The model’s total saturated water volume is 11.685 L. The porosity of the artificial model is 31.21%.
(2) The saturated oil stage (SO stage): First, we injected the experimental simulated oil from the O3 and O4 wells; the νin is 2.40 ml/min. We open the sample port SP5, which is the farthest distance sample port from the O3 and O4 wells. In this way, we established the seepage relationship between the injection wellhead and the sample port farthest from the injection until the oil saturation reached 100% in the liquid at SP5, the SO process of O3 and O4 wells stopped, and the SP5 stopped, as the sampling port. Open the sampling port SP4, and establish a new seepage channel. By using the seepage method, the oil-saturated process of O3 and O4 wells stops when the oil content in the product liquid of the sampling port closest to O3 and O4 wells reaches 100%. We completed the SO process when all eight wellheads were saturated (including two injection and six production wells). The model’s total SO was 7.5283 L, and the initial oil saturation (Soi) was 64.43%.
(3) Conventional water flooding stage (CWF stage): W1 and W2 are injection wells; the νin is 2.40 ml/min. Wells O1 to O6 are production wells. The water flooding stage stops until the stage water content (fw) reaches 98.00%.
(4) First speed-up the water flooding stage (FSuWF stage): W1 and W2 are injection wells, and wells O1 to O6 are production wells. The νin of the injection well is 3.04 ml/min. The water flooding stage stops until the fw reaches 98.00%.
(5) Second speed-up the water flooding stage (SSuWF stage): W1 and W2 are injection wells, and wells O1 to O6 are the production wells. The νin of the injection well is 3.60 ml/min. The water flooding stage stops, while the fw reaches 98.00%.
(6) Changing flow direction stage (CFD stage): W1 and W2 close and stop to inject water, well O2 and O5 changed to injection well. The νin of the injection well is 3.60 ml/min. Wells O1, O3, O4, and O6 are still active producing wells. The oil displacement experiment stops until the fw reaches 98.00%.
(7) Horizontal well production stage (HWP stage): well O2 and O5 changed to the injection well, νin is 3.60 ml/min. Wells P1 and P2 are the production wells. The oil displacement experiment of the model stops until the fw reaches 98.00%.
The model has a horizontal well; the Htop (Distance to the top of the model) of the horizontal well-bore is 2.5 cm.
3 Result of the Oil Displacement Experiment
In different water flooding development stages, the water flooding experiment stops until the fw reaches 98.0%, and the ΔER in the CWF stage is 10.36%, the ΔER of the FSuWF and SSuWF stages is 5.94% and 0.38%, respectively. The ΔER in the CFD stage is 7.85%, the ΔER in the HWP stage is 16.82%, and the ER in the oil displacement experiment is 41.36%, the experimental injection parameters and experimental results of each stage are shown in Table 2 and Fig. 4.
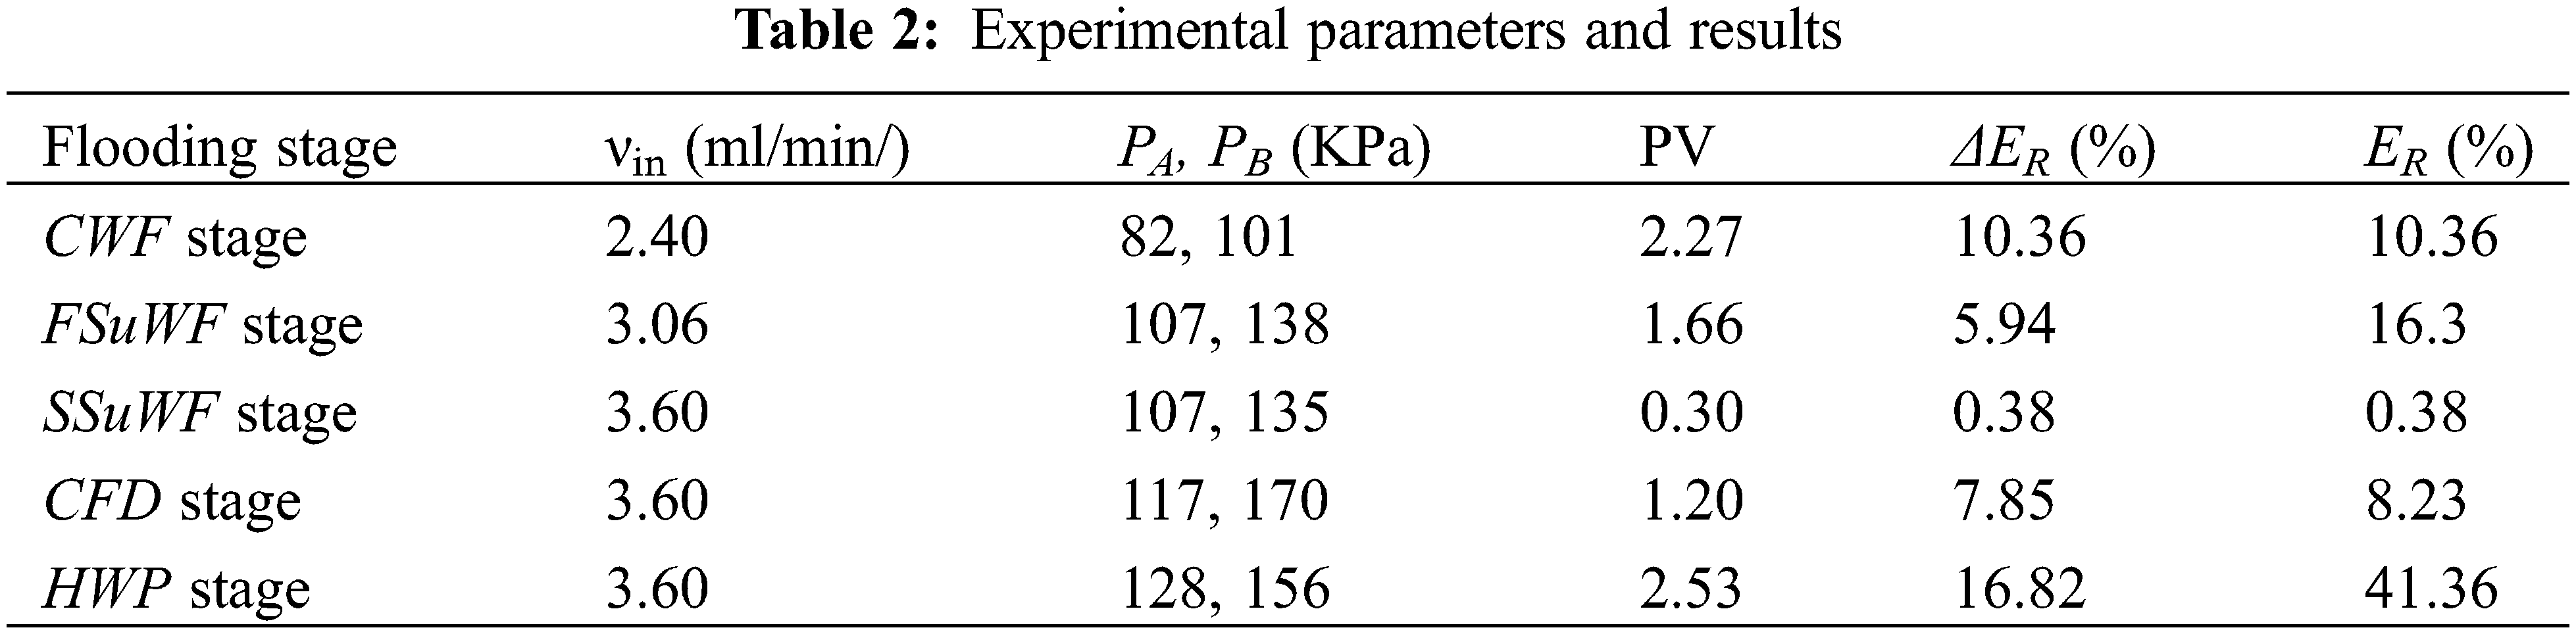
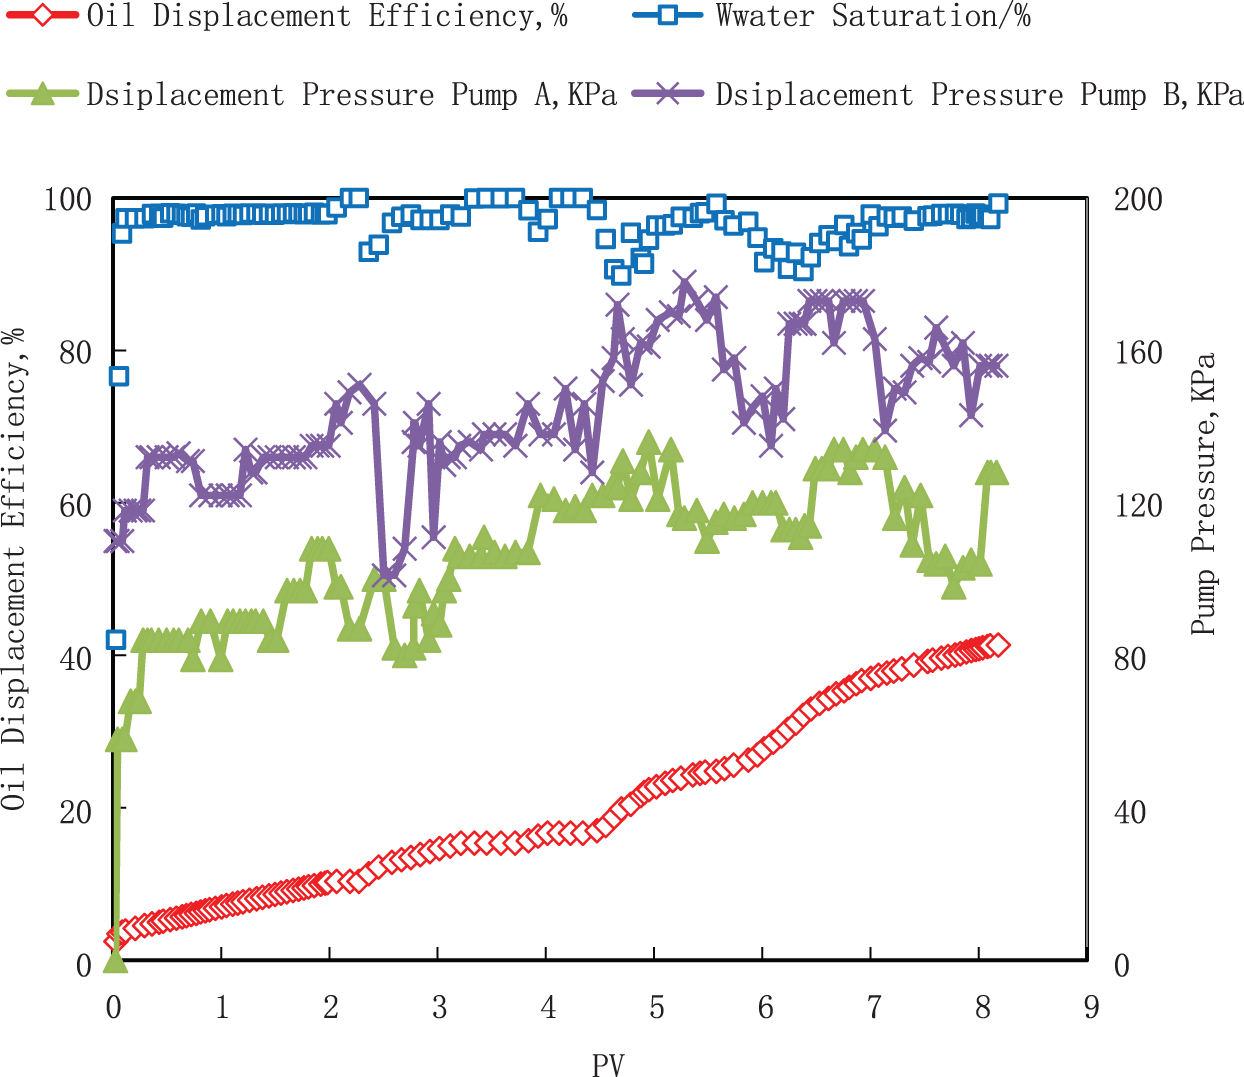
Figure 4: Recovery factor, injection pressure, and water-cut curves at different displacement stages
4 Millimeter-Scale Residual Oil of Artificial Model Analysis
4.1 Principles of Quantitative Analysis
The MSCT scan method can test the CT value of both sample and fluid, so it can study the change in fluid distribution in the rock pores during the oil displacement experiment stage. According to the theoretical basis of quantitative calculation, the same ray linear attenuation theory can be used to calculate the remaining oil distribution in the micro-pores of nanomicron CT, assuming that the single-energy X-ray conforms to Beer’s law [27]. We make the following two assumptions: 1) that both the pore structure and shape of the framework particles do not change during the process of water-saturated, oil-saturated, and different oil displacement experiments; 2) that the total pressure along the path of the fluid in the pore seepage process does not affect the stress-sensitive characteristics of the rock, and the pores of the core are unaffected. There is no change in the pore structure of the model, so we continue the change study of oil saturation at the millimeter-scale. We tested the CT value of the model at different oil displacement stages using the MSCT scan method, and we calculated the oil saturation of the model in each stage using formula (1).
We tested the CT value of air and water, with different KI concentrations, as well as the model without the fluid; the data can be used to calculate the oil saturation of the model. The CT value of the experimental water is 1284–1931 Hu, the CT value of the simulated oil is -200–160 Hu, and the CT value of the model before dripping water is 665–729 Hu. The value of the model after saturated water is 1451–1673 Hu.
where: Ha,r—CT value of dry core before saturated water,
Hair—CT value of air,
Hw,r—CT value of wet core after saturated water,
Hwater—CT value of water,
Htwo-phase—CT value of core at a certain time of oil displacement experiment,
Hoil—CT value of crude oil.
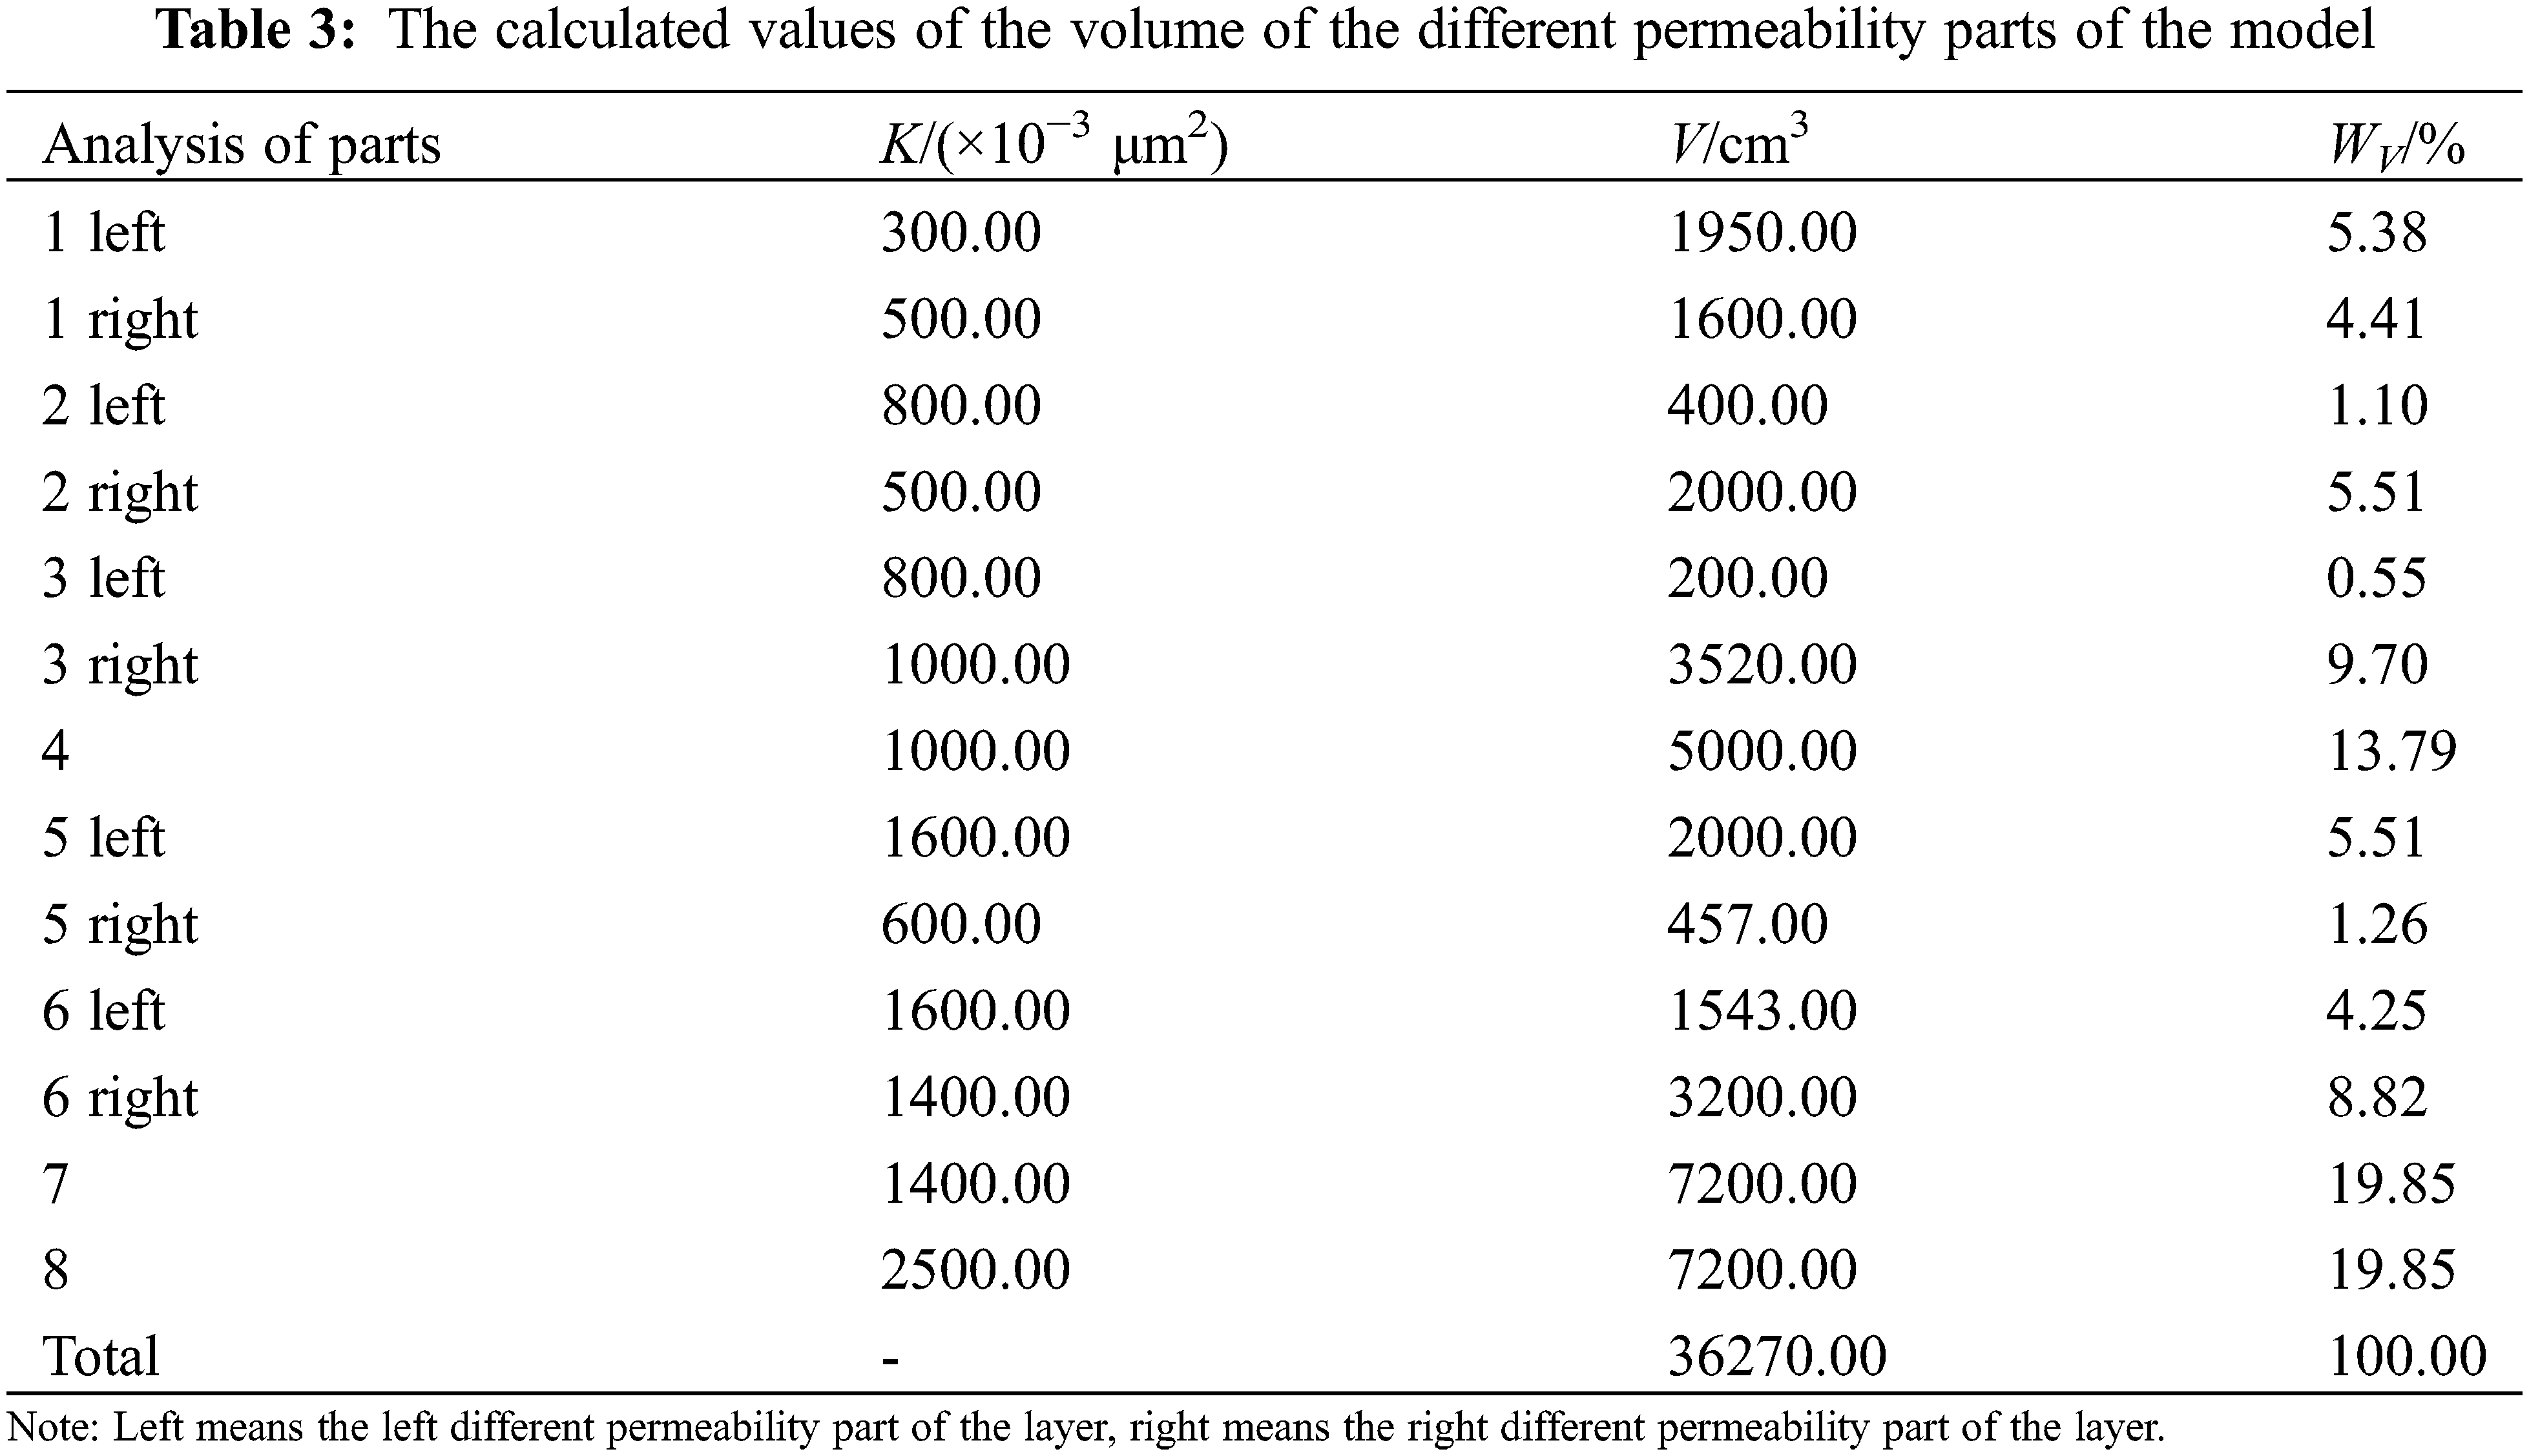
Because of differences in permeability and geological structure in both the plane and vertical directions of the model, when we use the conventional CT data processing, the residual oil distribution results obtained have a large error. According to the CT value data and volume of different parts of the model, we used the partition weighting method in this study to calculate the oil saturation changes in different analysis layers using formulas (2) and (3). We show each analysis part’s volume and weight data in Fig. 5 and Table 3.
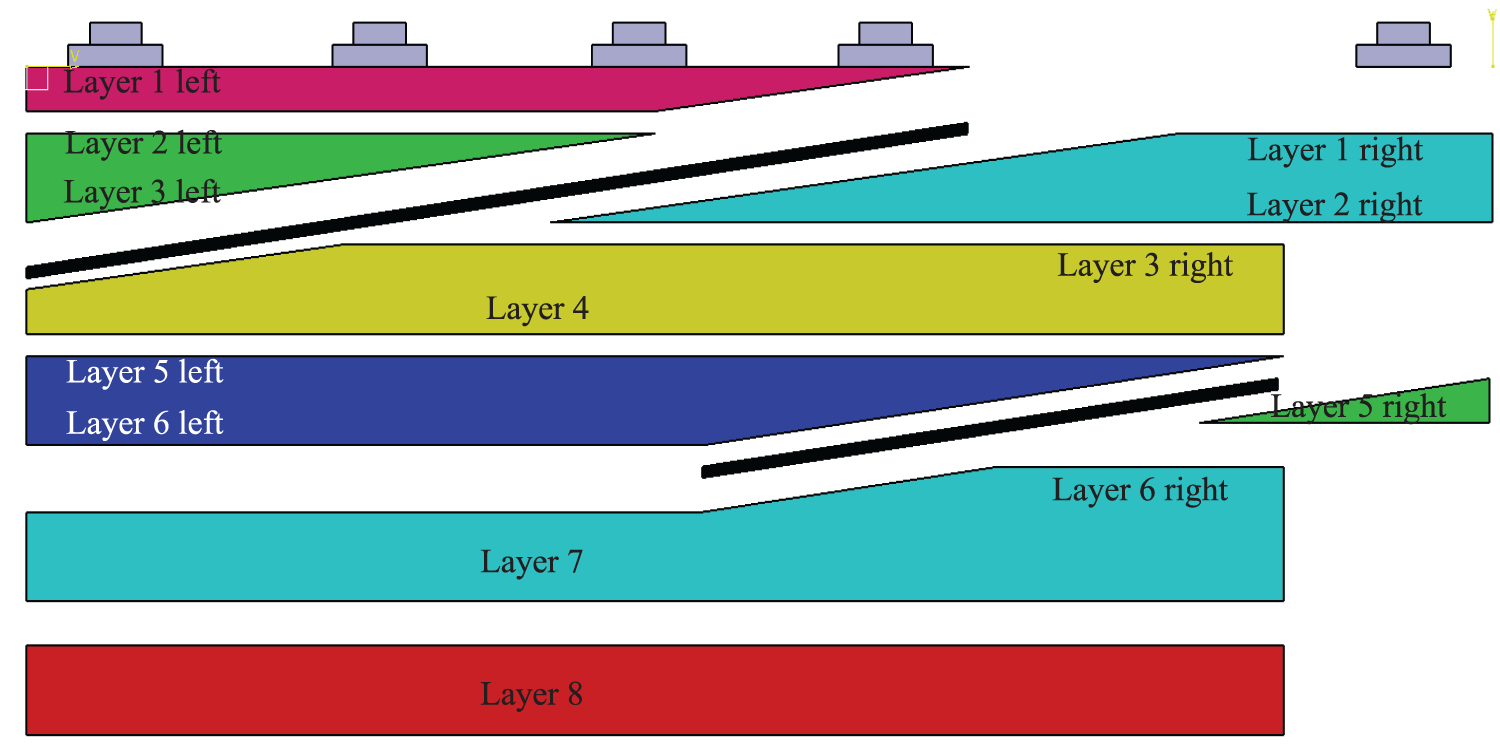
Figure 5: Schematic of the analysis layer with different permeability and geological structures
where: Sori—Remaining oil saturation of i-th part, [%, i = 1–x × y × z]
V—Volume of each part, [cm3]
WVi∼n—Part volume weight of i-th part, [%, i = 1–13]
x, y, z—Analysis part x, y, z scan pixel number.
4.2 Quantitative Analysis of Remaining Oil
The calculation results of oil saturation at different oil displacement stages are shown in Table 4. The results show that oil saturation decreases significantly in the CWF and HWP stages.
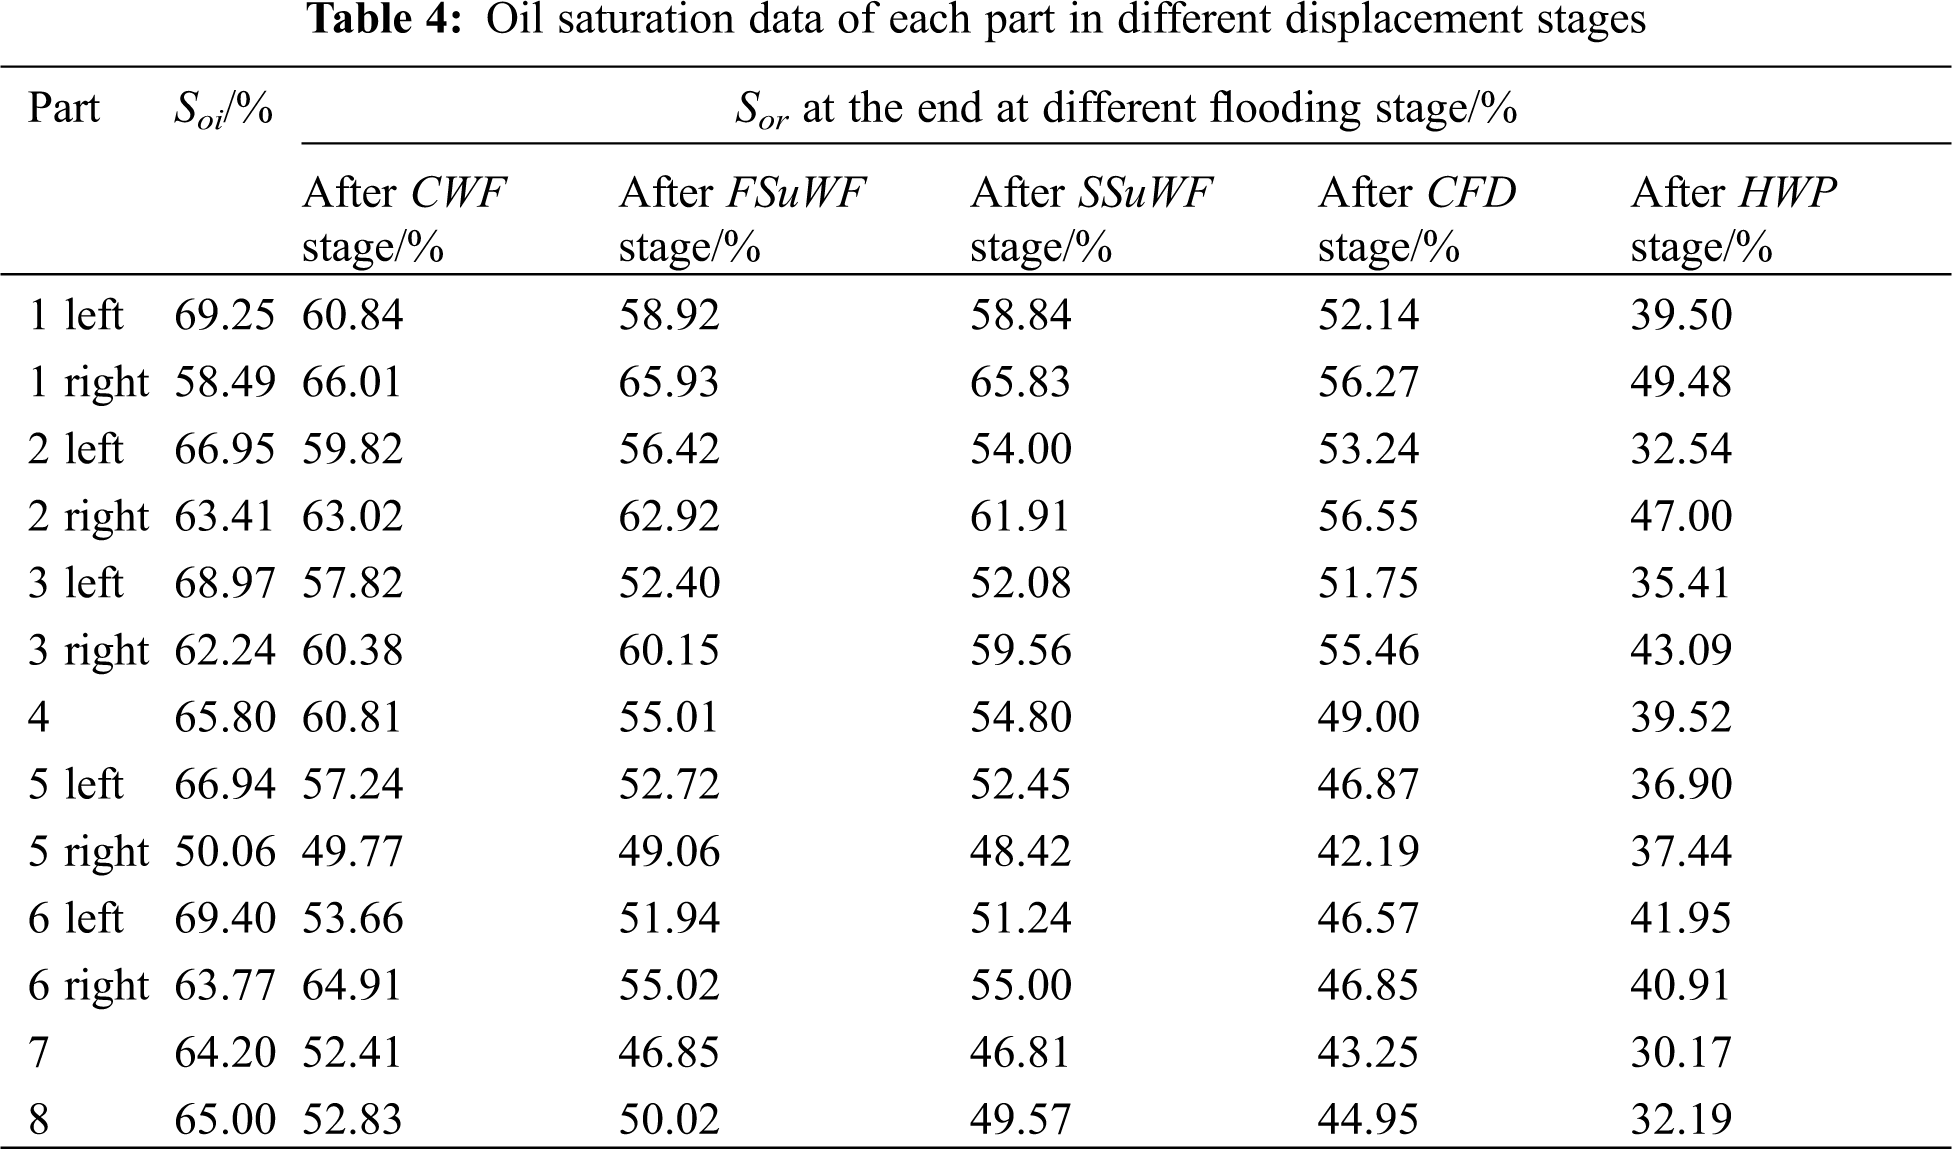
After the CWF stage, there are four parts where the oil saturation decline is more than 10.0%, and the oil saturation in the left part of layer 6 has the largest decline, from 69.40% to 53.66%, a decline of 15.74%. In the HWP stage, there are six parts where the oil saturation decline is more than 10.0%, and the oil saturation in the left part of layer 2 has the largest decline, a decline of 20.70%. In all experimental stages, the oil saturation reduction in other parts is less than 10.0%. There are two parts where the oil saturation increases in the CWF stage and the increments are 7.52% and 1.14%.
4.3 Distribution of Remaining Oil
The MSCT test data and image analysis software were used to perform image reconstruction and quantitative analysis of the remaining oil saturation in each layer. We obtain the oil saturation of layers at the millimeter-scale in each stage. The oil saturation distribution of each part is shown in Figs. 6–13. Based on the distribution of oil saturation at the millimeter-scale in each analysis layer of the model, the PI influences the oil saturation of the nearby structural layers. Layers 5 and 6 are influenced significantly by PI on the different oil displacement stages, whereas the influence is less on layers 7 and 8. The model horizontal well is 2.5 cm away from the top of the model during the HWP stage. The PI causes different variations in oil saturation at different distances from the horizontal well-bore; as the distance from the horizontal well-bore increases, the oil saturation becomes less affected. The horizontal well-bore effect disappears near layer 4.
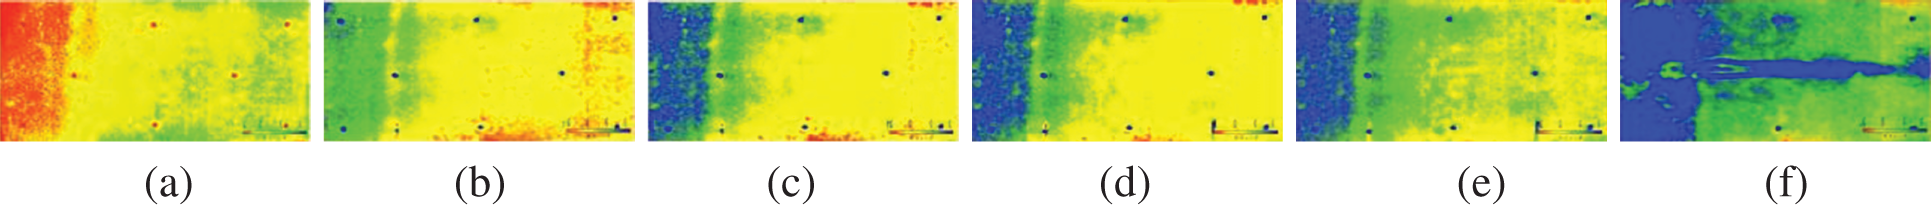
Figure 6: Oil saturation distribution of layer 1
Note: (a) SO stage; (b) CWF stage; (c) FSuWF stage; (d) SSuWF stage; (e) CFD stage; (f) HWP stage.
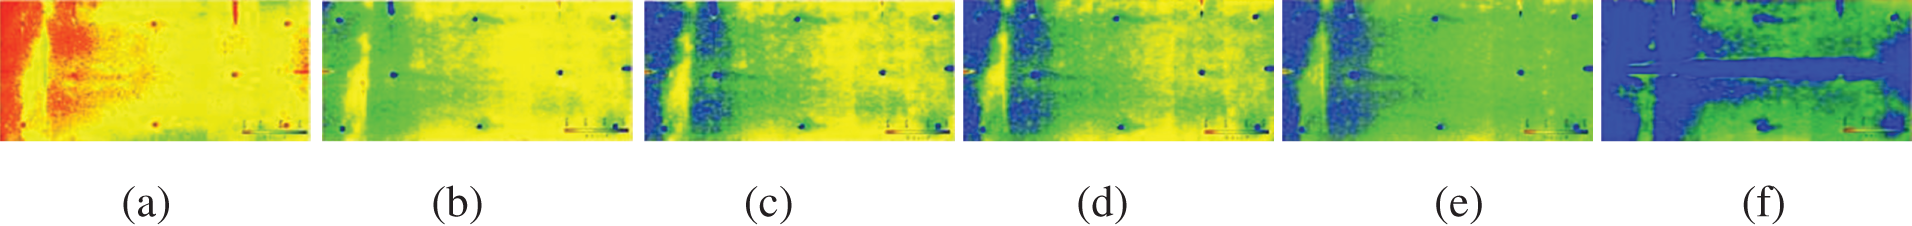
Figure 7: Oil saturation distribution of layer 2
Note: (a) SO stage; (b) CWF stage; (c) FSuWF stage; (d) SSuWF stage; (e) CFD stage; (f) HWP stage.
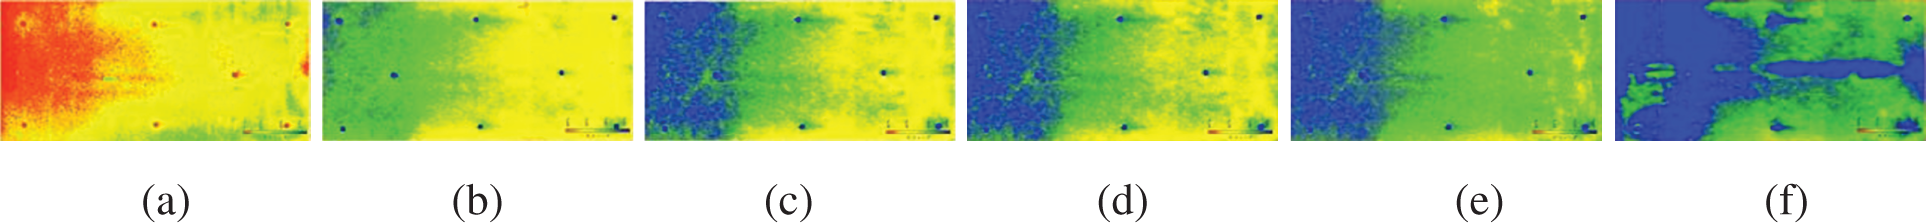
Figure 8: Oil saturation distribution of layer 3
Note: (a) SO stage; (b) CWF stage; (c) FSuWF stage; (d) SSuWF stage; (e) CFD stage; (f) HWP stage.
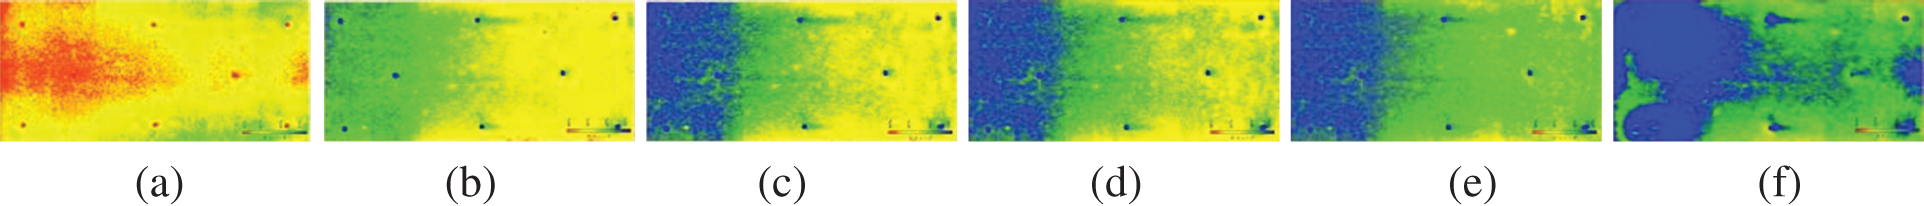
Figure 9: Oil saturation distribution of layer 4
Note: (a) SO stage; (b) CWF stage; (c) FSuWF stage; (d) SSuWF stage; (e) CFD stage; (f) HWP stage.
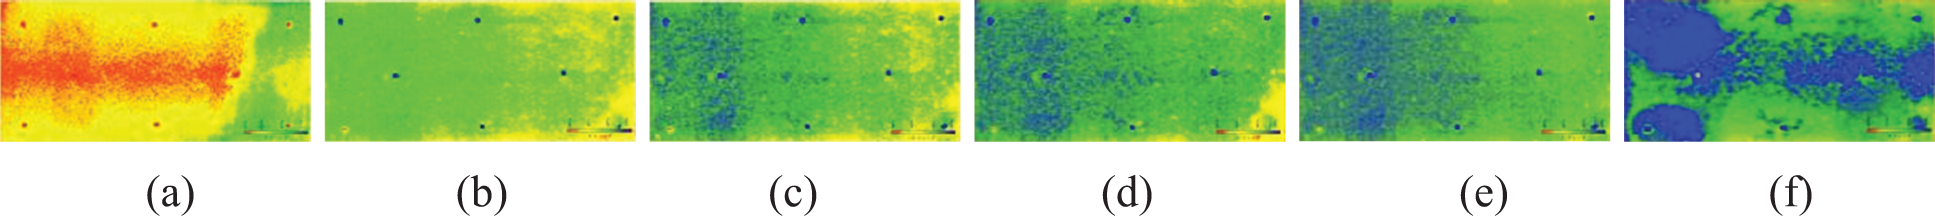
Figure 10: Oil saturation distribution of layer 5
Note: (a) SO stage; (b) CWF stage; (c) FSuWF stage; (d) SSuWF stage; (e) CFD stage; (f) HWP stage.
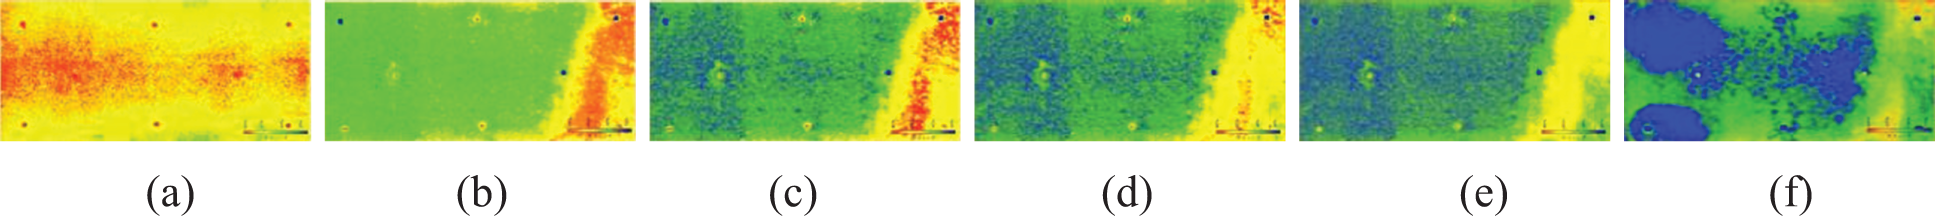
Figure 11: Oil saturation distribution of layer 6
Note: (a) SO stage; (b) CWF stage; (c) FSuWF stage; (d) SSuWF stage; (e) CFD stage; (f) HWP stage.
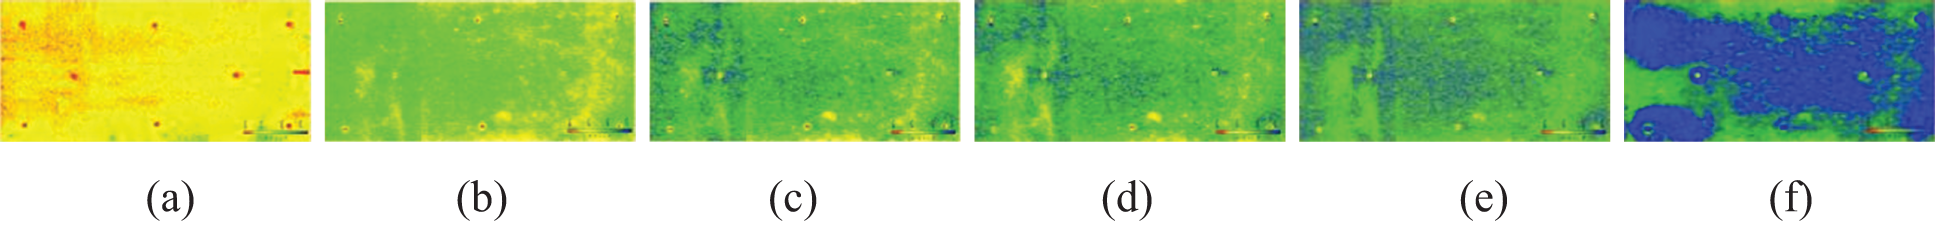
Figure 12: Oil saturation distribution of layer 7
Note: (a) SO stage; (b) CWF stage; (c) FSuWF stage; (d) SSuWF stage; (e) CFD stage; (f) HWP stage.
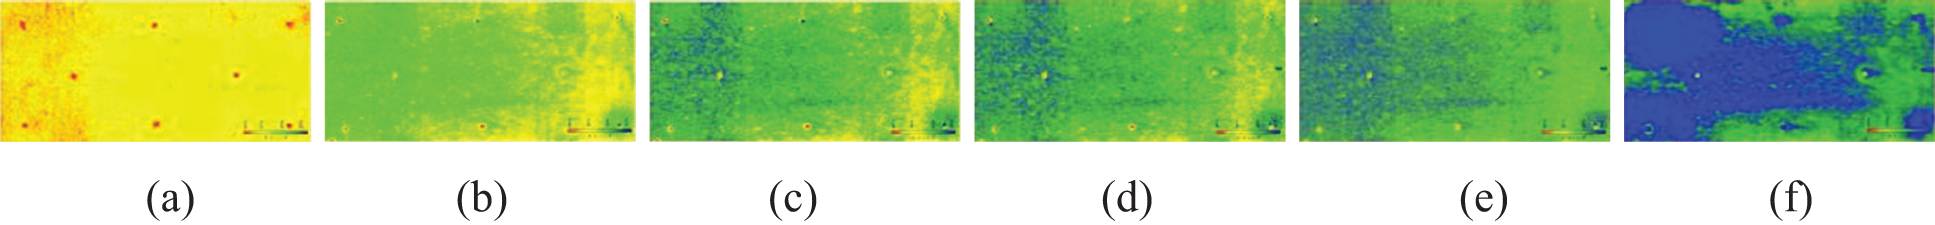
Figure 13: Oil saturation distribution of layer 8
Note: (a) SO stage; (b) CWF stage; (c) FSuWF stage; (d) SSuWF stage; (e) CFD stage; (f) HWP stage.
We analyze the oil saturation change of different layers and parts at different oil displacement experiment stages using the MSCT data and the oil saturation distribution picture. Among them, the oil saturation of the right part of layer 1 increased abnormally after the CWF stage, exceeding the original oil saturation of 7.52%. Another oil saturation increasing part is the right side of the analysis layer 6 during the CWF stage, with a value-added of 1.14%. At the end of the CWF stage, on the left side of the model, the oil saturation near wells O1 and O6 of the top 4 layers decreases to 60.84%, 59.82%, 57.82%, 60.81%, from the Soi of 69.25%, 66.95%, 68.97%, 65.80%, respectively. The oil saturation in the adjacent part below the bottom PI decreased the slowest, and it is still 40.91% after the HWP stage. The oil saturation of the top 5 layers decreases significantly during the HWP stage.
(1) In the heterogeneous oil displacement experiment, the ΔER in the CWF stage is 10.36%, and the ΔER in the FSuWF stage is 5.94%. The ΔER in the CFD stage is 7.85%, the ΔER in the HWP stage is 16.82%, and the ER of the oil displacement experiment is 41.36%.
(2) The oil saturation of each layer decreases significantly during the CWF, CFD, and HWP stages.
(3) After the CWF stage, there are four parts where the oil saturation decline exceeds 10.0%. There are six parts in the HWP stage, where the oil saturation decline exceeds 10.0%. Only two parts in the CWF stage increased oil saturation in all experimental stages.
Funding Statement: This work was supported by the National Science and Technology Major Projects of China for Oil and Gas (Projects Nos. 2016ZX05010 and 2016ZX05058).
Author Contributions: Investigation: Y. Z.; Resources: Y. Z.; Funding acquisition:Y. Z.; Methodology: Y. Z.; Data curation: Y. Z.
Conflicts of Interest: The authors declare that they have no conflicts of interest to report regarding the present study.
References
1. AI-Ghamdi, A., Haq, B., AI-Shehri, D., Muhammed, N. S., Mohmoud, M. (2022). Surfactant formulation for green enhanced oil recovery. Energy Reports, 8, 7800–7813. DOI 10.1016/J.EGYR.2022.05.293. [Google Scholar] [CrossRef]
2. Alfazazi, U., AlAmeri, W., Hashmet, M. R. (2019). Experimental investigation of polymer flooding with low-salinity preconditioning of high temperature–high-salinity carbonate reservoir. Journal of Petroleum Exploration and Production Technology, 9(2), 1517–1530. DOI 10.1007/s13202-018-0563-z. [Google Scholar] [CrossRef]
3. Farzad, P., Ghasem, Z., Ali, K., Ahmad, R., Ali, M. et al. (2022). Experimental evaluation of designed and synthesized alkaline-surfactant-polymer (ASP) for chemical flooding in carbonate reservoirs. Fuel, 321, 1–17. DOI 10.1016/J.FUEL.2022.124090. [Google Scholar] [CrossRef]
4. Druetta, P., Picchioni, F. (2020). Influence of physical and rheological properties of sweeping fluids on the residual oil saturation at the micro and macroscale. Journal of Non-Newtonian Fluid Mechanics, 286, 1–16. DOI 10.1016/j.jnnfm.2020.104444. [Google Scholar] [CrossRef]
5. Ren, B., Duncan, I. J. (2021). Maximizing oil production from water alternating gas (CO2) injection into residual oil zones: The impact of oil saturation and heterogeneity. Energy, 222, 1–13. DOI 10.1016/J.ENERGY.2021.119915. [Google Scholar] [CrossRef]
6. Alvarez, E., MacBeth, C., Brain, J. (2017). Quantifying remaining oil saturation using time-lapse seismic amplitude changes at fluid contacts. Petroleum Geoscience, 23(2), 238–250. DOI 10.1144/petgeo2016-037. [Google Scholar] [CrossRef]
7. Wang, H. J. (2018). The application of horizontal well pattern optimization technique in the tapping of remaining oil in meandering river sand body. Proceedings of the 2018 5th International Conference on Management Innovation and Business Innovation (ICMIBI 2018), Singapore Management and Sports Science Institute. [Google Scholar]
8. Hai, X. L. (2021). A brief talk on the description method of residual oil in thick reservoir. IOP Conference Series: Earth and Environmental Science, 770(1), 012009. DOI 10.1088/1755-1315/770/1/012009. [Google Scholar] [CrossRef]
9. Zhu, W., Zou, C., Wang, J., Liu, W., Wang, J. (2021). A new three-dimensional effective water-flooding unit model for potential tapping of remained oil in the reservoirs with rhythmic conditions. Journal of Petroleum Exploration and Production Technology, 11(3), 1375–1391. DOI 10.1007/s13202-020-01068-z. [Google Scholar] [CrossRef]
10. Zahoor, M. K., Haris, M. (2013). Simulation study of tertiary gas injection process in water-wet naturally fractured reservoirs with slab type matrix blocks. Proceedings of the Pakistan Academy of Sciences, 50(1), 13–19. [Google Scholar]
11. Kurevija, T., Grebenar, D., Kolin, S. K. (2018). Pressure build-up test analysis of the reservoir system with the multiphase flow. Rudarsko-geološko-naftni Zbornik, 33(3), 75–84. DOI 10.17794/rgn.2018.3.8. [Google Scholar] [CrossRef]
12. Akai, T., Alhammadi, A. M., Blunt, M. J., Bijeljic, B. (2019). Mechanisms of microscopic displacement during enhanced oil recovery in mixed-wet rocks revealed using direct numerical simulation. Transport in Porous Media, 130(3), 731–749. DOI 10.1007/s11242-019-01336-5. [Google Scholar] [CrossRef]
13. Heydari-Farsani, E., Neilson, J. E., Alsop, G. I., Hamidi, H. (2020). Tectonic controls on residual oil saturation below the present-day fluid contact level in reservoirs of the Persian Gulf. Journal of Asian Earth Sciences, 190, 1–14. DOI 10.1016/j.jseaes.2019.104133. [Google Scholar] [CrossRef]
14. Heydari-Farsani, E., Neilson, J. E., Alsop, G. I., Hamidi, H. (2020). The effect of rock type on natural water flooding and residual oil saturation below free water level and oil water contact: A case study from the middle east. Journal of Petroleum Science and Engineering, 193, 1–14. DOI 10.1016/j.petrol.2020.107392. [Google Scholar] [CrossRef]
15. Zhang, Q., Liu, Y., Wang, B., Ruan, J., Yan, N. et al. (2022). Effects of pore-throat structures on the fluid mobility in chang 7 tight sandstone reservoirs of longdong area, Ordos Basin. Marine and Petroleum Geology, 135, 1–17. DOI 10.1016/J.MARPETGEO.2021.105407. [Google Scholar] [CrossRef]
16. Wang, X., Wan, L., Jiang, Z., Liu, R., Wang, X. et al. (2017). Controlling factors and accumulation model of hydrocarbon reservoirs in the Upper Cretaceous Yogou Formation, Koulele Area, Termit Basin, Niger. Journal of Earth Science, 28(6), 1126–1134. DOI 10.1007/s12583-016-0936-5. [Google Scholar] [CrossRef]
17. Liu, Y., Ling, X., Peng, Q., Cheng, Y. (2021). Study on nitrogen foam flooding for enhanced oil recovery in high porosity, high permeability and strong edge water reservoirs. Petrochemical Applications, 40(10), 71–76+81. [Google Scholar]
18. Rezaeiakmal, F., Parsaei, R. (2021). Visualization study of polymer enhanced foam (PEF) flooding for recovery of waterflood residual oil: Effect of cross flow. Journal of Petroleum Science and Engineering, 203, 1–11. DOI 10.1016/J.PETROL.2021.108583. [Google Scholar] [CrossRef]
19. Ma, W. (2011). Research on the distribution of remaining oil in high water-cut oil fields. Science Technology and Engineering, 11(14), 3278–3279+3283. [Google Scholar]
20. Ma, W., Liu, A. (2011). Study on the pore structure of rock by CT scanning technology. Zhongwai Energy, 16(7), 54–56. [Google Scholar]
21. Xie, M., Dai, Z., Luo, D., Li, H., Tang, F. et al. (2020). A new method for analysis of remaining oil characteristics in heavy oil reservoirs based on micro-CT scanning displacement experiment. Unconventional Oil and Gas, 7(5), 102–107. [Google Scholar]
22. Abdulkareem, A. N., Hussien, M. Y., Mashkoor, H. H. (2021). Laboratory study of residual oil mobilization by induce vibration in porous media. IOP Conference Series: Materials Science and Engineering, 1145, 012052. DOI 10.1088/1757-899X/1145/1/012052. [Google Scholar] [CrossRef]
23. Ma, W., Xia, H., Liu, Y., Wu, W., Wang, K. et al. (2012). A method for identifying and quantifying oil-water distribution in micron-scale pores. Chinese invention patent: Authorization number: CN102628354A, authorization time. (2012/08/08). [Google Scholar]
24. Li, J., Liu, Y., Gao, Y., Cheng, B., Meng, F. et al. (2018). Influence of microscopic pore-throat heterogeneity on the distribution of remaining oil. Petroleum Exploration and Development, 45(6), 1043–1052. [Google Scholar]
25. Parmigiani, A., Huber, C., Bachmann, O., Chopard, B.(2011). Pore-scale mass and reactant transport in multiphase porous media flows. Journal of Fluid Mechanics, 686, 40–76. DOI 10.1017/jfm.2011.268. [Google Scholar] [CrossRef]
26. Tang, M., Lu, S., Zhan, H., Guo, W., Ma, H. (2018). The effect of a microscale fracture on dynamic capillary pressure of two-phase flow in porous media. Advances in Water Resources, 113, 272–284. DOI 10.1016/j.advwatres.2018.01.015. [Google Scholar] [CrossRef]
27. Adenutsi, C. D., Li, Z., Lai, F., Hama, A. E., Aggrey, W. N. (2019). Pore pressure variation at constant confining stress on water–oil and silica nanofluid-oil relative permeability. Journal of Petroleum Exploration and Production Technology, 9(3), 2065–2079. DOI 10.1007/s13202-018-0605-6. [Google Scholar] [CrossRef]
28. Zivar, D., Pourafshary, P., Moradpour, N. (2021). Capillary desaturation curve: Does low salinity surfactant flooding significantly reduce the residual oil saturation? Journal of Petroleum Exploration and Production Technology, 11, 783–794. DOI 10.1007/S13202-020-01074-1. [Google Scholar] [CrossRef]
29. Rostami, B., Kharrat, R., Ghotbi, C., Tabatabaie, S. H. (2009). Gas-oil relative permeability and residual oil saturation as related to displacement instability and dimensionless numbers Étude de la perméabilité relative gaz-huile et de la saturation en huile résiduelle dans le cas d’une instabilité de déplacement et des nombres sans dimension s’y rapportant. Oil & Gas Science and Technology, 65(2), 299–313. DOI 10.2516/ogst/2009038. [Google Scholar] [CrossRef]
30. Ma, W. G., Wang, P., Wang, Y. (2013). The study of daqing oilfield class II reservoirs pore throat ratio using conventional pressure mercury method. Applied Mathematical Modelling, 423–426, 622. DOI 10.4028/www.scientific.net/AMM.423-426.622. [Google Scholar] [CrossRef]
31. Wang, P., Ma, W., Zhang, Y., Yan, Q. (2020). Relationship between the molecular coil dimension and the energy storage modulus of polymer solution configured with oilfield-produced sewage. International Journal of Analytical Chemistry, 2020, 1–8. DOI 10.1155/2020/2538521. [Google Scholar] [CrossRef]
32. Liang, B., Wang, X., Zeng, J., Wang, Q., Wei, Y. et al. (2019). Application of CT scanning technology in the analysis of core microscopic oil displacement characteristics. Logging Engineering, 30(2), 34–37. [Google Scholar]
33. Herlinger, R., Vidal, A. C. (2022). X-Ray μCt extracted pore attributes to predict and understand Sor using ensemble learning techniques in the Barra Velha Pre-salt carbonates, Santos Basin. Offshore Brazil. Journal of Petroleum Science and Engineering, 212, 110282. DOI 10.1016/J.PETROL.2022.110282. [Google Scholar] [CrossRef]
34. Wang, Y., Li, Z., Zhang, S., Liu, D., Ding, M. (2021). Remaining oil distribution in models with different heterogeneities after CO2 WAG injection: Visual research by nuclear magnetic resonance technique. Journal of Central South University, 28(5), 1412–1421. DOI 10.1007/S11771-021-4712-Z. [Google Scholar] [CrossRef]
35. Fannir, J., Panfilova, I., Leclerc, S., Stemmelen, D. (2020). Studying of parameters of two-phase displacement in porous media with MRI technique. Mechanics & Industry, 21(5), 524. DOI 10.1051/meca/2020058. [Google Scholar] [CrossRef]
36. Yadali Jamaloei, B., Kharrat, R. (2010). Analysis of microscopic displacement mechanisms of dilute surfactant flooding in oil-wet and water-wet porous media. Transport in Porous Media, 81(1), 1–19. DOI 10.1007/s11242-009-9382-5. [Google Scholar] [CrossRef]
37. Afrapoli, M. S., Alipour, S., Torsaeter, O. (2012). Analysis of microscopic displacement mechanisms of a MIOR process in porous media with different wettability. Transport in Porous Media, 93(3), 705–719. DOI 10.1007/s11242-012-9978-z. [Google Scholar] [CrossRef]
38. Amirmoshiri, M., Wang, X., Bai, C., Tewari, R. D., Xie, S. X. et al. (2021). Distinguishing the effect of rock wettability from residual oil on foam generation and propagation in porous media. Energy & Fuels, 35(9), 7681–7692. DOI 10.1021/ACS.ENERGYFUELS.0C04247. [Google Scholar] [CrossRef]
39. Alyafei, N., Blunt, M. J. (2016). The effect of wettability on capillary trapping in carbonates. Advances in Water Resources, 90, 36–50. DOI 10.1016/j.advwatres.2016.02.001. [Google Scholar] [CrossRef]
40. Gao, J., Han, D., Wang, J., Wu, K., Liu, L. (2009). Application of CT imaging technology to study oil saturation distribution characteristics of core water flooding. Xinjiang Petroleum Geology, 30(2), 269–271. [Google Scholar]
41. Li, H., Pan, C., Miller, C. T. (2005). Pore-scale investigation of viscous coupling effects for two-phase flow in porous media. Physical Review E, 72(2), 026705. DOI 10.1103/PhysRevE.72.026705. [Google Scholar] [CrossRef]
42. Xu, H., Xiong, Y., Wang, Y., Zhou, W., Wang, L. et al. (2017). Preparation and evaluation on artificial core of extra high permeability unconsolidated sandstone. Oil Drilling and Production Technology, 39(4), 477–483. [Google Scholar]
43. Cheng, L., Wu, F. (2008). Method for making standard testing core and study on porosity-permeability parameter ratio. Petroleum Instruments, 22(6), 64–65. [Google Scholar]
Cite This Article
 Copyright © 2023 The Author(s). Published by Tech Science Press.
This work is licensed under a Creative Commons Attribution 4.0 International License , which permits unrestricted use, distribution, and reproduction in any medium, provided the original work is properly cited.
 Downloads
 Citation Tools