
 Submit a Paper
 Propose a Special lssue
 Open Access
ARTICLE

Hemodynamic Analysis and Diagnosis Based on Multi-Deep Learning Models
1 School of Automation, Key Laboratory of Measurement and Control for CSE, Ministry of Education, Southeast University, Nanjing, 210096, China
2 School of Computer, Jiangsu University of Science and Technology, Zhenjiang, 212003, China
3 Department of Electrical and Computer Engineering, University of Nevada, Las Vegas, 89154, USA
* Corresponding Author: Feipeng Da. Email:
Fluid Dynamics & Materials Processing 2023, 19(6), 1369-1383. https://doi.org/10.32604/fdmp.2023.024836
Received 08 June 2022; Accepted 25 October 2022; Issue published 30 January 2023
 View Full Text
 Download PDF
Abstract
This study employs nine distinct deep learning models to categorize 12,444 blood cell images and automatically extract from them relevant information with an accuracy that is beyond that achievable with traditional techniques. The work is intended to improve current methods for the assessment of human health through measurement of the distribution of four types of blood cells, namely, eosinophils, neutrophils, monocytes, and lymphocytes, known for their relationship with human body damage, inflammatory regions, and organ illnesses, in particular, and with the health of the immune system and other hazards, such as cardiovascular disease or infections, more in general. The results of the experiments show that the deep learning models can automatically extract features from the blood cell images and properly classify them with an accuracy of 98%, 97%, and 89%, respectively, with regard to the training, verification, and testing of the corresponding datasets.Graphic Abstract

Keywords
Nomenclature
| | input vector of the residual unit |
| | activation function |
| | residual function |
| | underlying mapping of the residual unit |
| | the image width |
| | the image height |
| | the convolution kernel step size |
| TP | true positive cases |
| TN | true negative cases |
| FP | false positive cases |
| FN | false negative cases |
The goal of a routine blood examination is to measure the number and concentration of blood cells in a patient’s blood in order to determine, among other things, if the patient has anemia or an infection. Therefore, high-precision blood cell detection technology is essential for human health diagnostics [1]. There are five different types of white blood cells, neutrophils, eosinophils, basophils, lymphocytes, and monocytes. There are now two available types of cell detection and counting technologies. Traditional image processing techniques like automatic cell recognition technology based on Hough transform [2], watershed method based on distance transform [3], and method based on threshold [4] were used in the early stages, but they will not be accurate enough for real-world applications, especially in areas with a lot of cell overlap. In the earliest stages of pre-blood cell identification, which is divided into two categories, traditional image processing technology was mostly used. The most prevalent technique was hand-staining, followed by manual inspection and classification under a microscope [5]. This method requires examiners to have a comprehensive understanding of cell morphology and to have mastered the capacity to spot and recognize patterns via consistent study and practice. Due to the vast amount of microscopic image data and the diversity of blood cell morphology, traditional blood cell identification methods are becoming more unsuitable for addressing the various complex challenges confronted by blood cell analysis inspectors. Many effective deep learning-based object detection algorithms, such as R-CNN, Mask-R-CNN [6], YOLO [7], and RetinaNet [8], have been presented in recent years, and they are now frequently employed in blood cell detection applications.
Francois Chollet proposed CNNs that are superior to Inception by substituting depth-wise separable convolutions. An experiment with a larger dataset of 350 million images and 17,000 classes for image classification [9] shows that the Xception can improve the performance of CNNs. Christian et al. scaled networks using correctly factorized convolutions and aggressive regularization [10]. He et al. [11] introduced a residual learning framework and evaluated residual networks with up to 152 layers using the ImageNet dataset. Han et al. [12] proposed a three-step strategy to eliminate superfluous connections to circumvent the issues that neural networks are difficult to deploy on embedded systems and that traditional neural networks can correct the design prior to training. Start by training the network and identifying the vital links. Second, eliminate any unnecessary connections. The network must then be retrained. Szegedy et al. [13] proposed the Inception architecture for deep convolutional neural networks. In addition, the Hebbian principle and multi-scale processing intuition were used to maximize quality in design decisions. Ma et al. [14] created the novel ShuffeNet V2 architecture to analyze the direct metric on the target platform. Wang et al. [15] proposed an end-to-end training method for a residual attention network employing an attention mechanism and a hybrid feed-forward network architecture. The proposed network achieves state-of-the-art object performance on three benchmark datasets, including CIFAR-10, CIFAR-100, and ImageNet. Zoph et al. [16] made a new search space called the “NASNet search space” and a new regularization method called Scheduled DropPath to make the NASNet models more general.
Hegde et al. [17] categorized white blood cells using both traditional image processing techniques and deep learning methods. The output of the classifier was evaluated using a neural network with hand-crafted features that had an average accuracy of 99.8 percent. In addition, white blood cells were classified with approximately 99% accuracy using CNN and transfer learning. Kutlu et al. [18] utilized Regional Convolutional Neural Networks (R-CNN) and merged AlexNet, VGG16, GoogLeNet, and ResNet50 architectures to recognize WBC cells. When the sample size is small, Baydilli et al. [19] classified WBC using capsule networks. Shahin et al. [20] proposed transfer learning using deep activation characteristics and fine-tuning of existing deep networks for the identification of WBCs. In addition, “WBCsNet,” a novel end-to-end convolutional deep architecture, was proposed and utilized to balance the categorization of the WBCs dataset. Sharma et al. [21] created a deep learning system that uses convolutional neural networks to make the whole process of classifying white blood cells (WBC) automatic. Sahlol et al. [22] proposed a more effective hybrid technique for classifying WBCs. The hybrid strategy consisted primarily of two steps, Initially, features were extracted from WBC images using VGGNet. The collected features were then filtered using the Salp Swarm Algorithm (SESSA). Zhang et al. [23] added the deformable convolution layer to the standard U-Net structure to deform U-Net (dU-Net) and improve the accuracy of RBC classification in order to further address the low image quality resulting from noise and artifacts. Iqbal et al. [24] utilized machine learning techniques such as logistic regression, support vector machine (SVM), and CNN to differentiate between healthy and diseased cells. Kassim et al. [25] introduced the RBCNet pipeline, which consists of a U-Net first stage for cell-clusteror superpixel segmentation and a faster R-CNN second refinement stage for recognizing tiny objects within connected component clusters. Jiang et al. [26] proposed a new deep learning method called attention-YOLO, which adds a channel attention mechanism and a spatial attention mechanism to a feature extraction network in order to effectively realize the automation of blood count and solve the problems of inadequate positioning of the bounding boxes in the YOLO detection method. Compared to RBC cell classification, Aliyu et al. [27] proposed a method to classify abnormalities based on images of RBCs with deformed shapes using SVM and Deep learning. Boldú et al. [28] used pre-trained CNNs (VGG16, ResNet101, DenseNet121, and SENet154) to adjust their layers to datasets, after which they selected the optimal architecture and created a system with two parallel modules (ALNet). Mohamed et al. [29] classified WBC using ten distinct pre-trained models and six distinct machine learning techniques. Reference [30] proposed geometric-feature spectrum ExtremeNet (GFS-ExtremeNet), a geometry-aware deep-learning technique for cell detection. Khouani et al. [31] developed an approach based on deep learning for automatically recognizing white blood cells in images of peripheral blood and bone marrow. In particular, the application of combined predictions and corrections increased model outputs, as did the use of a new technique that improved segmentation quality by collaborating model results with geographical information. Tran et al. [32] used cutting-edge deep learning semantic segmentation techniques to separate red and white blood cells in blood smear images.
The rest of this work is arranged as follows, Section 2 contains the deep learning classification model and model classification assessment criteria, such as model architecture design and analysis, and Section 3 contains the model optimization approach. Section 3 presents a feature distribution study of the four blood cells as well as a comparison of nine deep learning models for classification. The Section 4 of this paper brings the paper to a conclusion.
2 Proposed Approaches for Hemodynamic Classification Analysis
On numerous occasions, deep neural networks outperform conventional machine learning techniques. Complex nonlinear relationships between input and output variables are modeled by DNNs. Given sufficient data, deep neural networks can provide a reliable solution for hemodynamic classification tasks. CNNS learns features implicitly from training data. Because neurons on the same feature map surface have identical weights, the networks can be trained concurrently. The structure of local weight sharing reduces network complexity and provides unique benefits for image classification tasks. Resnet’s residual structure enables the network to be deeper, to converge more rapidly, and to be optimized with fewer parameters and less complexity than earlier models. Based on InceptionV3, Xception replaces the Inception module with depth-separable convolutions and combines Resnet skip-connection structures. This expedites the model’s convergence and increases its precision. However, the computational process of the InceptionV3 network structure is relatively dispersed, and the performance of existing convolutional neural networks for classification tasks is inadequate. SqueezeNet is a traditional lightweight network, and on the ImageNet dataset, AlexNet can achieve comparable results with 50 times fewer parameters than SqueezeNet. GoogleNet includes an additional classifier during training, which can mitigate the effects of vanishing gradients. Once the model has been trained, the supplementary classifier is no longer required. Additionally, the fully connected layer and a global average pooling layer are utilized to reduce the number of parameters in the model, allowing it to be successfully applied to image classification tasks. SuffleNetV2’s primary function is to alter the data flow using channel shuffling. It reduces the number of parameters and computation required for small models. Its disadvantage is that it creates a boundary effect in which only a small portion of the input channel is used to generate the output channel. Attention 56 performs better when the output sequence and input sequence are not in the same order. NASNet can be applied to arbitrary classification tasks by stacking network units. NASNet is essentially a more complicated version of Inception. We think that these traditional neural networks can do a good job of analyzing how blood moves through the body.
In this paper, a multi-deep learning model-based classification analysis for hemodynamics is proposed. This paper uses a total of 12,444 images, which are divided into training sets, verification sets, and test sets, totaling 7965, 1992, and 2487 images, respectively. These images are categorized as eosinophils, neutrophils, monocytes, and lymphocytes. All datasets are subjected to uniform data preprocessing, including normalization distribution testing. The CNNs, Xception, InceptionV3, ResNet50, Squeeze, GoogleNet, SuffleNetV2, Attention56, and NasNet deep learning models are used for the four categories. The performance of the proposed approaches is measured by the TP, TN, FP, FN, accuracy, and model loss.
Fig. 1 illustrates the process flow for this paper. In the classification task’s overall architecture, the original data set is processed before the training set, validation set, and test set are proportionally divided. The processing networks CNNs, Xception, InceptionV3, ResNet50, Squeeze, GoogleNet, SuffleNetV2, Attention56, and NasNet receive the processed data. Then, visualize the training epoch’s curve using the loss and accuracy values obtained during model training. At the conclusion, each model’s test results were evaluated using a confusion matrix.
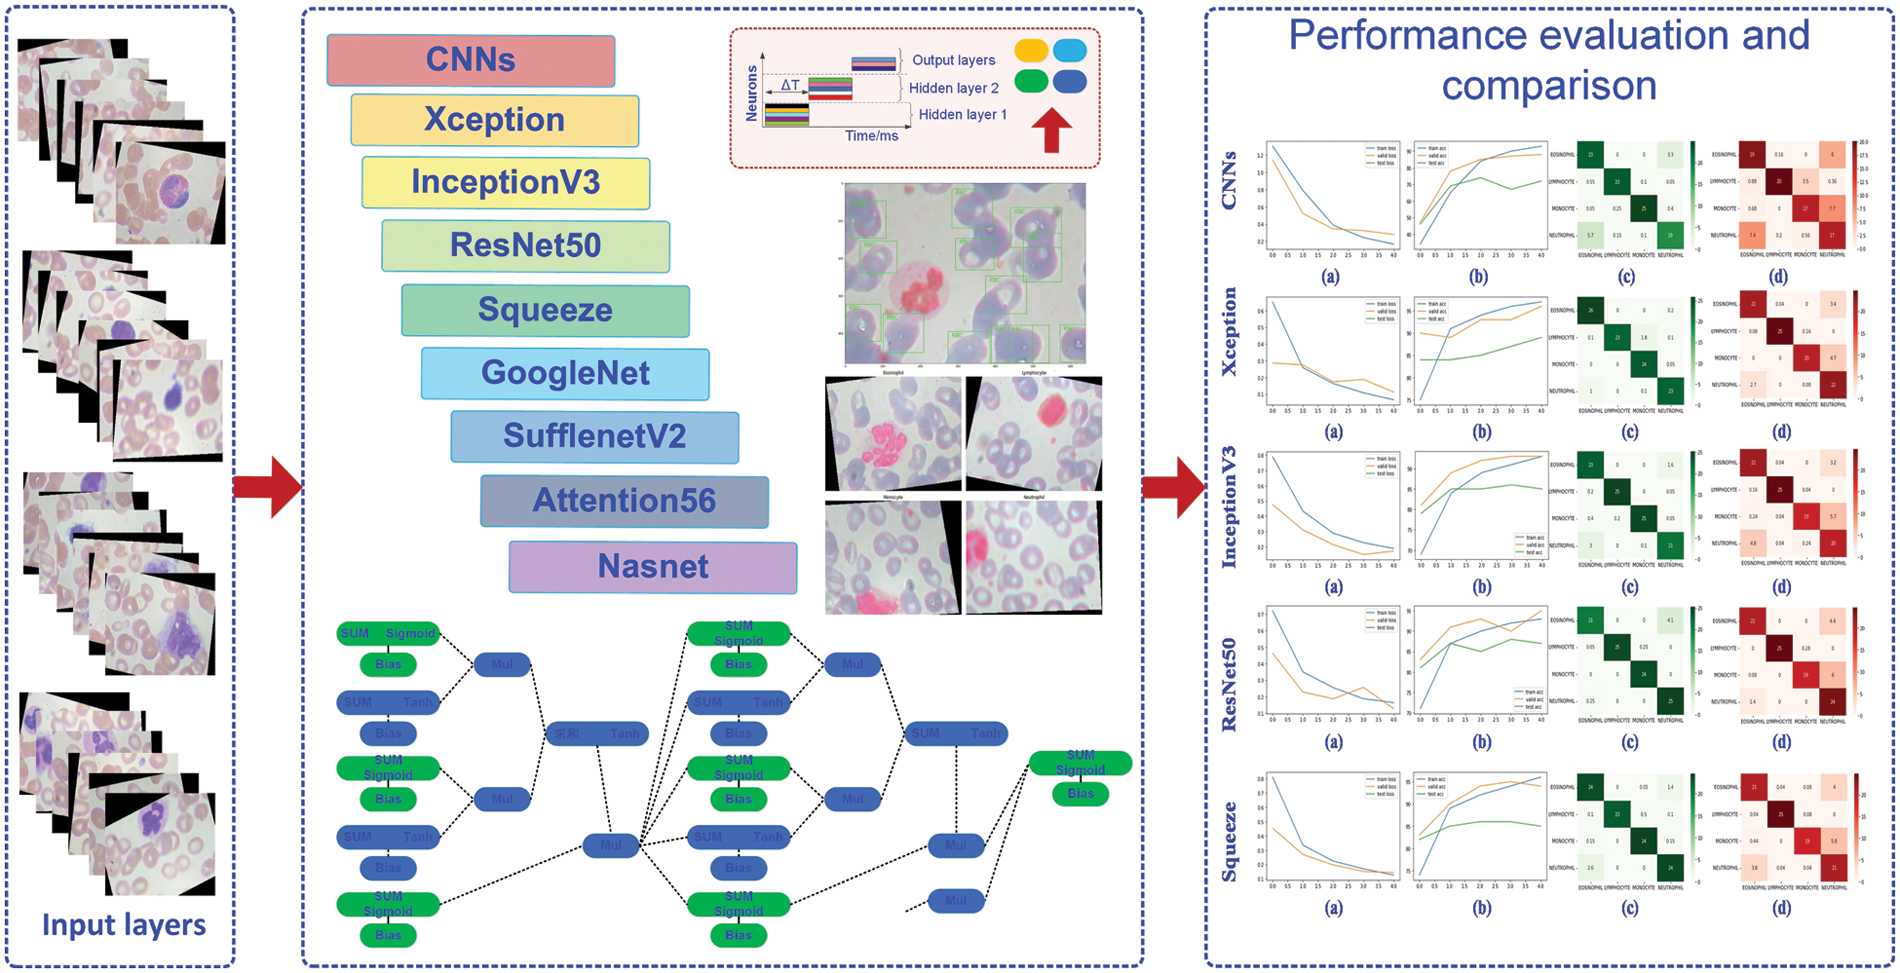
Figure 1: The processing diagram of this paper
2.1 The Classification Model Based on Deep Learning
Without the need for manual feature creation and cell position calibration, deep learning models can accept training samples, extract valid features from the samples, and perform classification recognition without the need for manual feature creation and cell position calibration. Additionally, they can extract valid features from the sample and perform classification recognition. By increasing the number of hidden layers, deep neural networks can analyze and process a substantial amount of cell data, and this increase in the number of layers improves accuracy and overcomes the limitations of shallow neural networks [33,34]. In the case of the widespread ResNet network, the following model applies,
where
where
where W represents the image width, H represents the image height, S represents the convolution kernel step size, and P represents the increased number of boundary pixel layers at the edge of the image. If the boundary pixel filling mode is the same mode, P is the number of boundary layers added to the image; if the fill mode is the valid mode, then
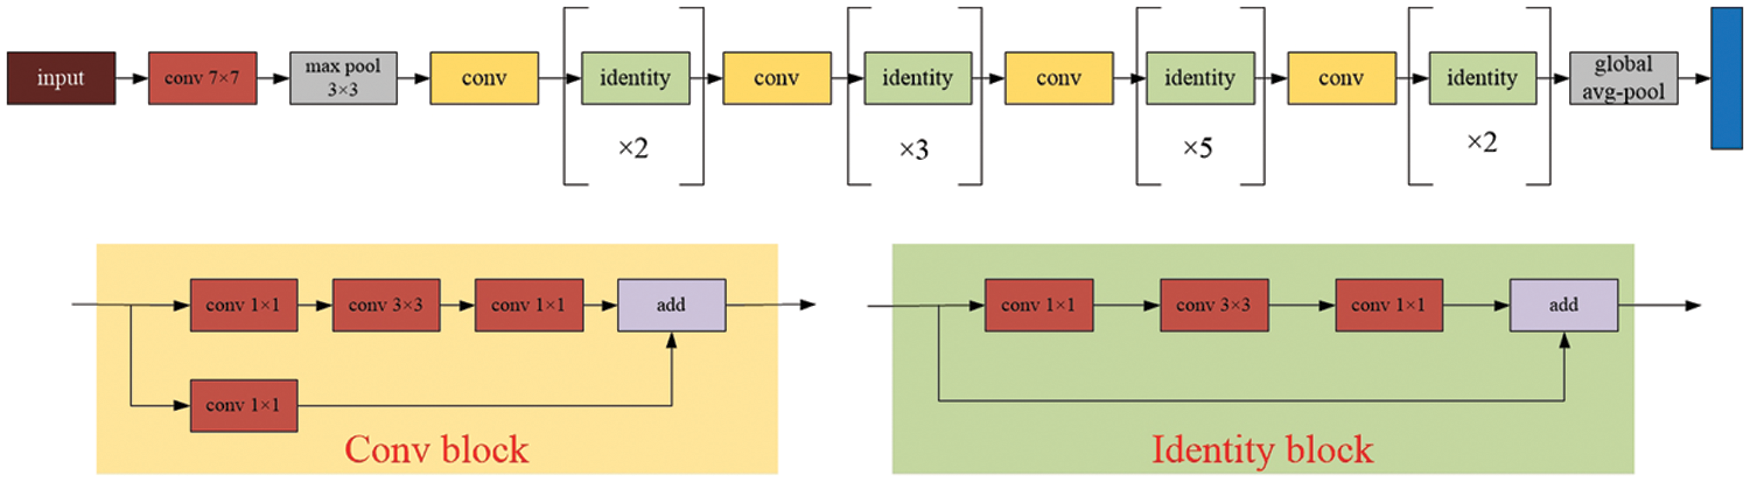
Figure 2: The model architecture of the ResNet
where x represents the input and
where M expressed as the number of categories, and
where
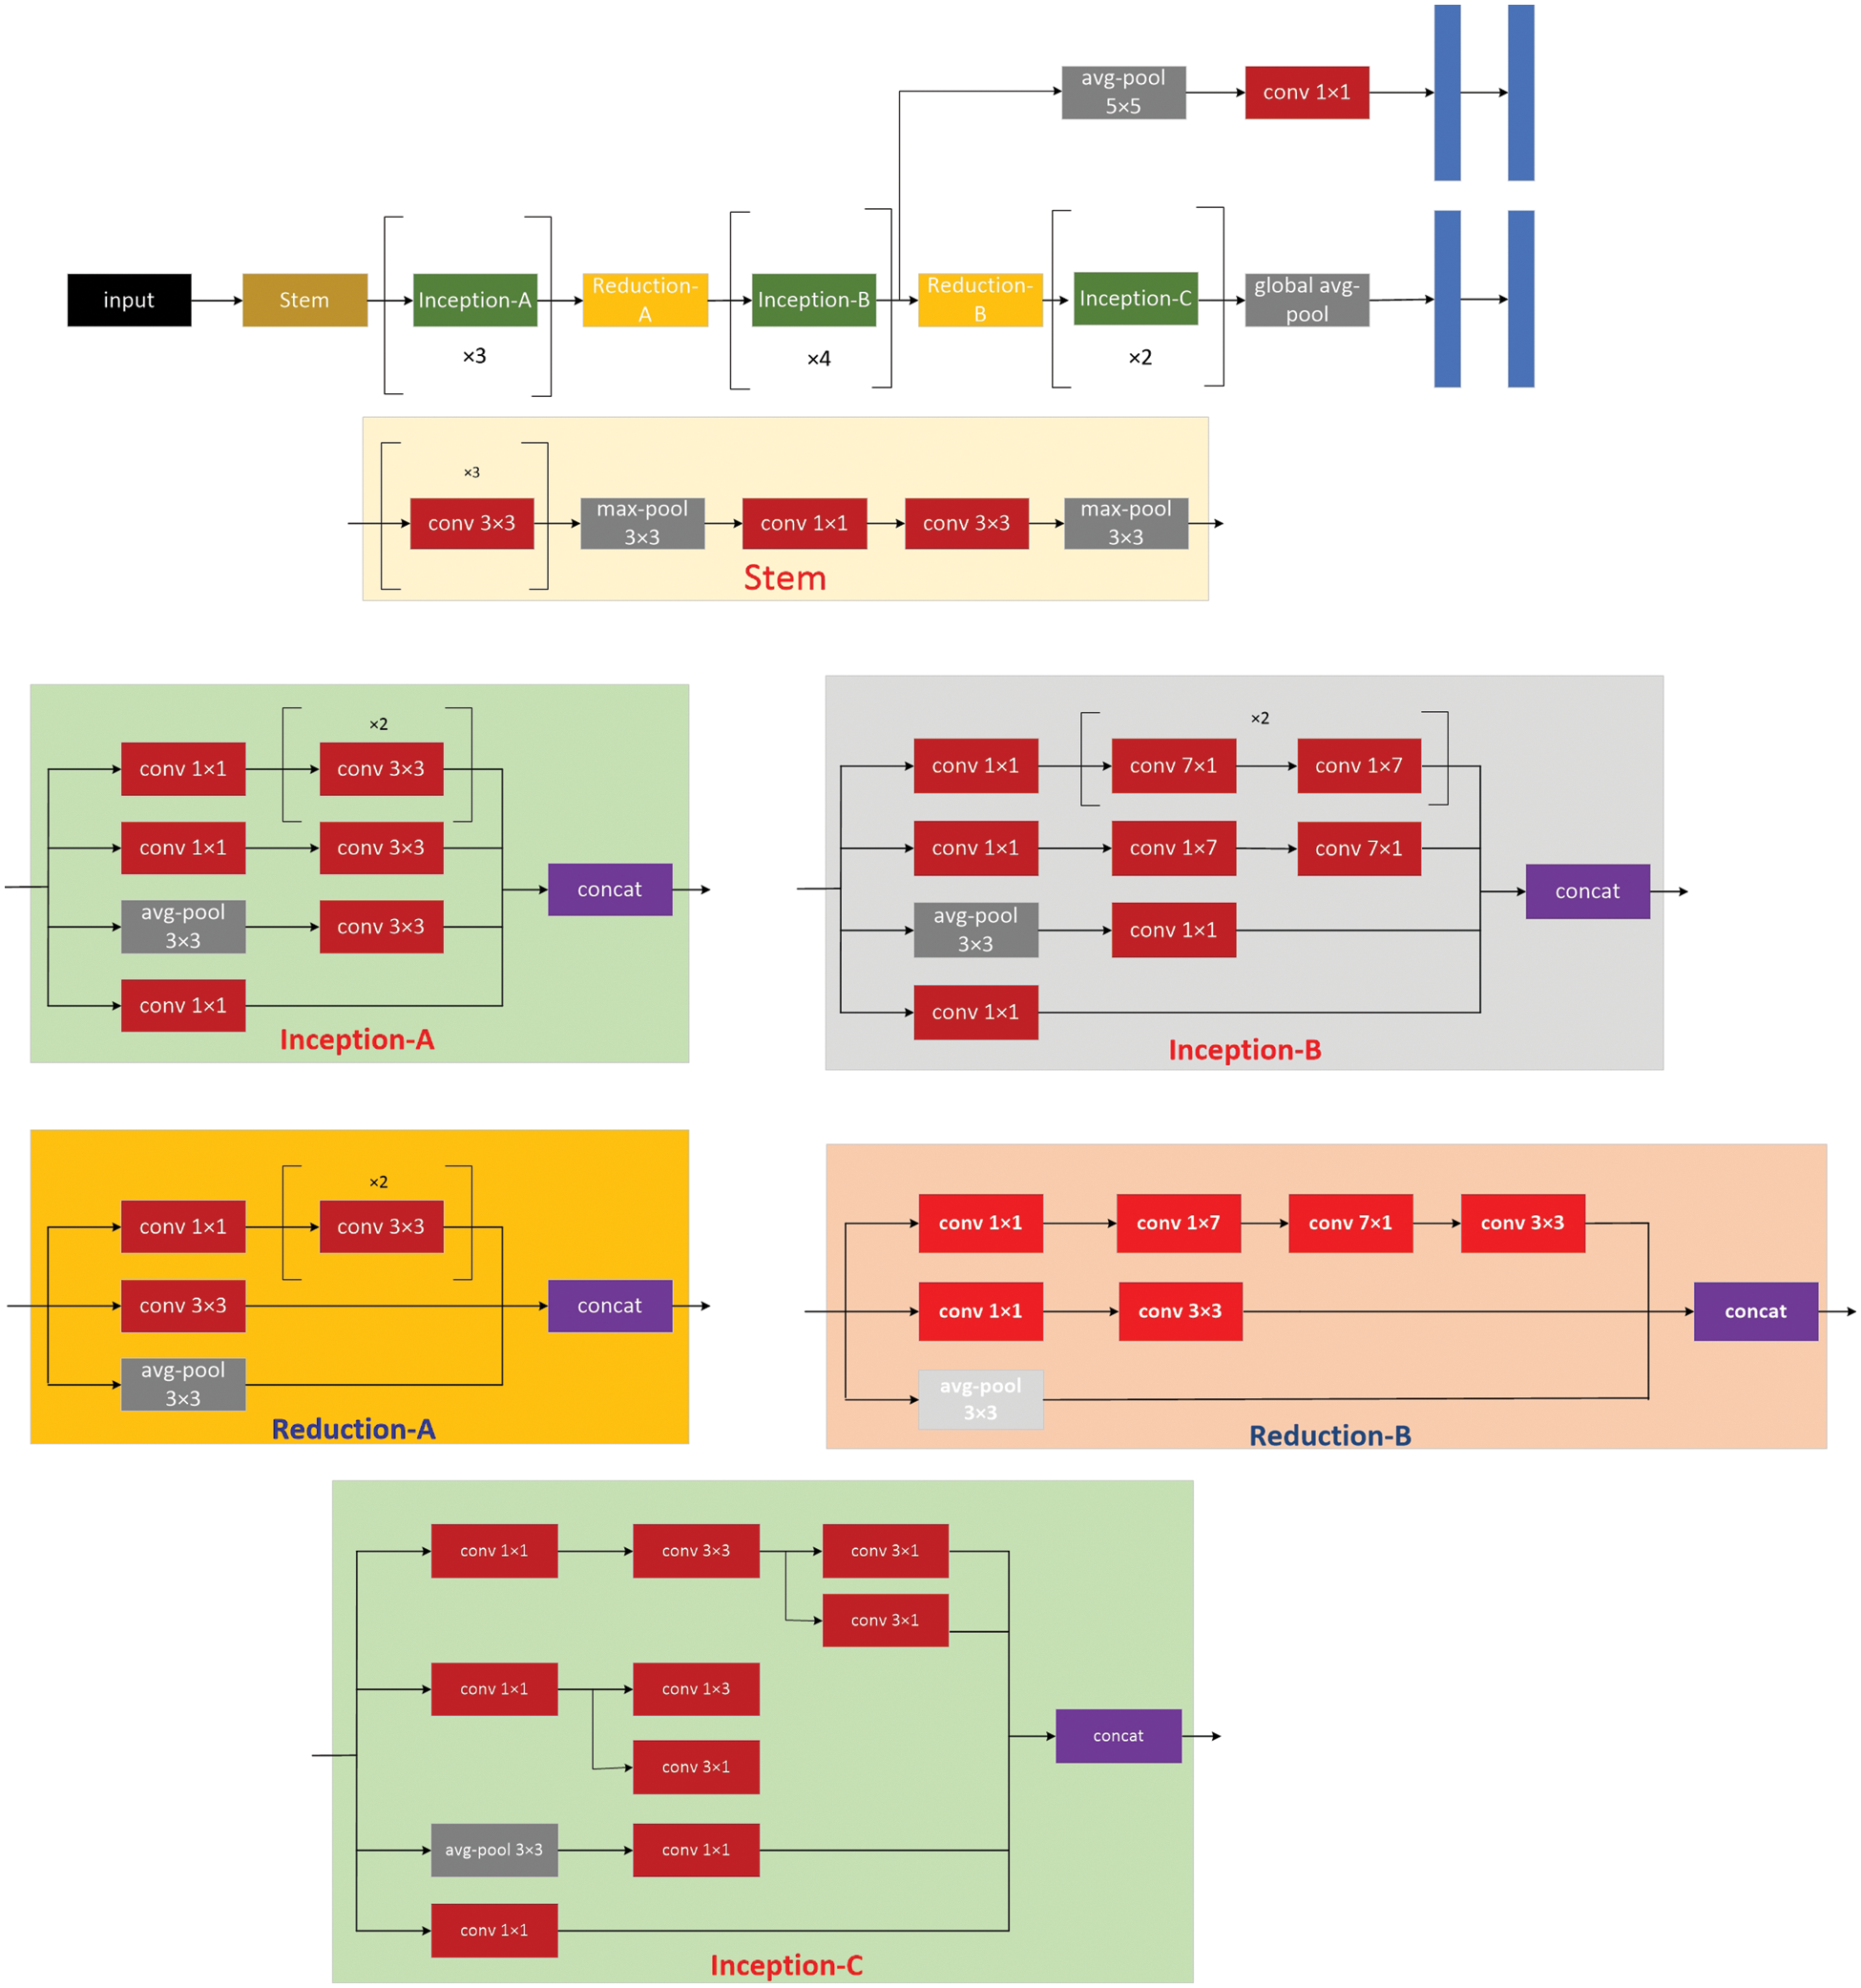
Figure 3: The model architecture of the inception
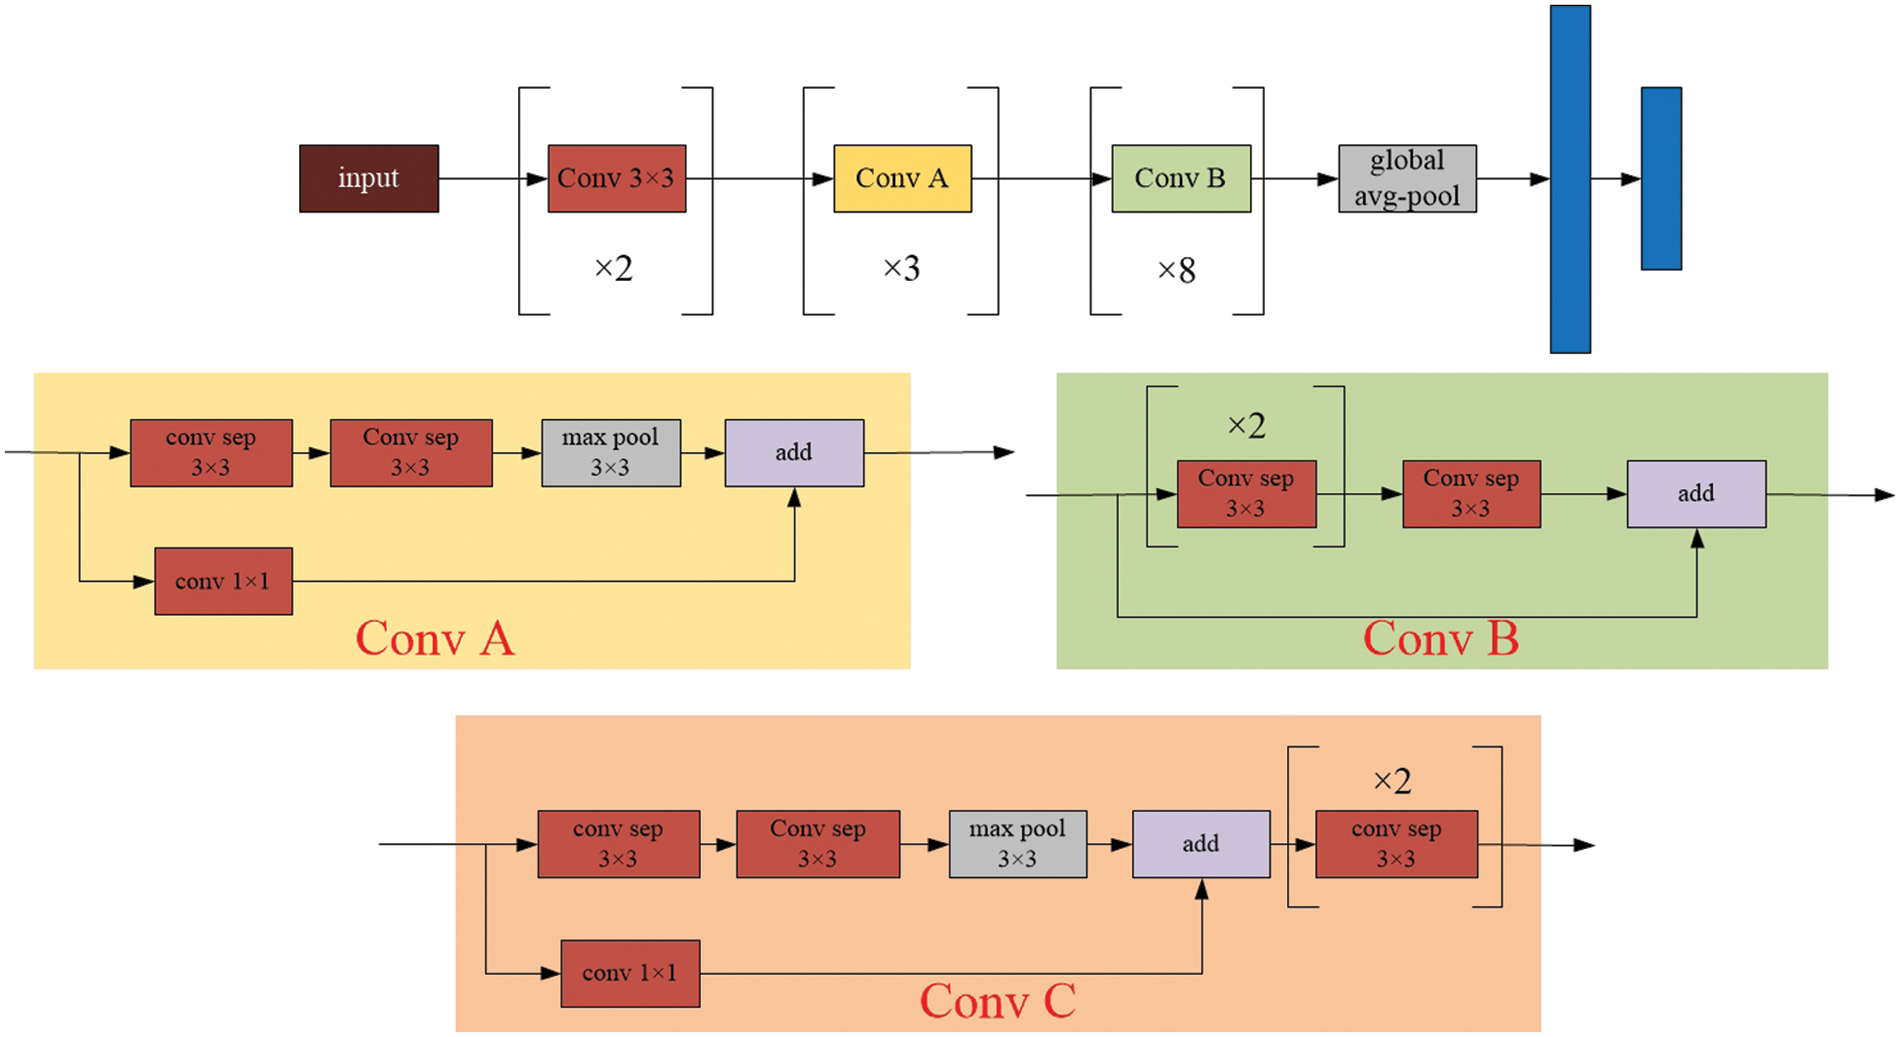
Figure 4: The model architecture of the Xception
2.2 Evaluation Criteria of Model Classification
Accuracy, Precision, Reccall and F1 values are used as measurement indexes. The Accuracy, Precision, recall rate, and F1 are defined as follows:
TP stands for true positive cases (both actual and predicted positive cases), TN stands for true negative cases (actually positive cases, predicted false cases), FP stands for false positive cases (actually negative cases, predicted positive cases), and FN stands for false negative cases (both actual and predicted negative cases). The utilized Adam algorithm for deep learning architecture optimization in this paper is provided in Algorithm 1.
where t represents the number of steps updated,
This section contains an evaluation of feature distribution and performance. Visulization examines the typical distribution of the four sample categories. To make sure that the final classifications are correct, the performance of the eight deep learning models is compared to that of the benchmarking methods.
3.1 Feature Distribution Analysis of the Four Blood Cells
The contents of granules can be released by eosinophils, causing tissue damage and accelerating the onset of inflammation. During the day and night, the quantity of eosinophils in the blood changes. White blood cells are split into two types based on physical differences, granular and non-granular, with eosinophils being a type of non-granular white blood cell. Eosinophils are white blood cell components that, like other granulocytes, are generated from bone marrow hematopoietic stem cells. Eosinophils are white blood cells that kill bacteria and parasites. They are also crucial cells in the immunological and allergy response processes. In Wright stained blood smears, Neutrophils’ cytoplasm appears colorless or extremely pale reddish, with many diffuse small (0.2–0.4 micron) light red or light purple particles. Tissue damage, malignant tumors, aplastic anemia, agranulocytosis, myelodysplastic syndrome, hypersplenism, and autoimmune illnesses all cause it to rise or fall. Lymphocytes, the smallest white blood cells, are also a type of white blood cell. They are made by lymphoid organs and are mostly found in the lymph fluid that circulates through lymphatic channels. They are a major cellular component of the immune response function of the body and the main executor of practically all lymphatic immune functions. Lymphocytes are a type of cell that has the ability to recognize and respond to antigens. T lymphocytes (also known as T cells), B lymphocytes (also known as B cells), and natural killer (NK) cells can be classified based on their motility, surface chemicals, and roles. Monocytes are the largest white blood cells and the largest blood cells in the body. They play a crucial role in the body’s defense system. Monocytes are produced from hematopoietic stem cells in the bone marrow and develop in the bone marrow before entering the bloodstream as immature cells. Monocytes also play a role in immunological responses, inducing a specific immune response in lymphocytes after phagocytosing antigen carried by the antigen determinant given to them. Monocytes are also the primary cellular defense against intracellular harmful bacteria and parasites, and they may recognize and kill tumor cells. Monocytes have more non-specific lipases and have a better phagocytosis than other blood cells. The total%age of monocytes might alter when the body is inflamed or has various disorders. As a result, measuring monocyte count has become an important supplemental diagnostic tool. Figs. 5–7 illustrate the visulization of four blood cells and the examination of eosinophils with labeling.
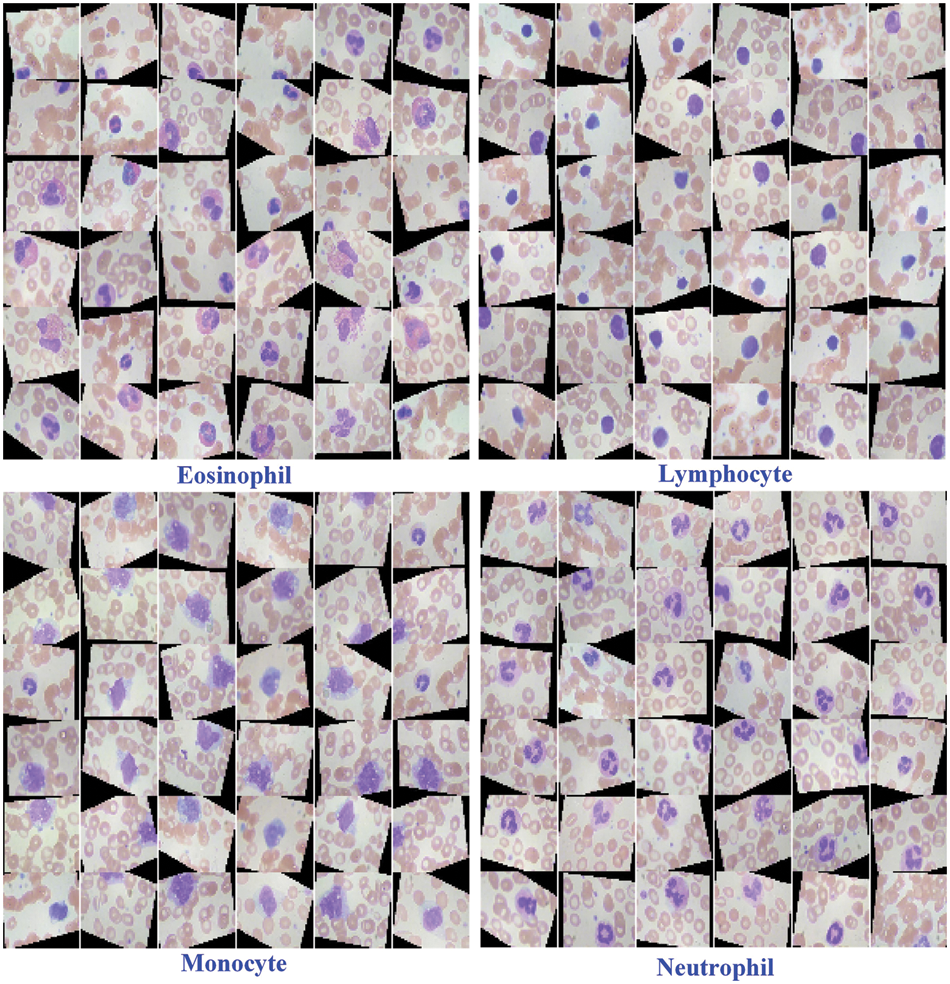
Figure 5: Visulization of four blood cells
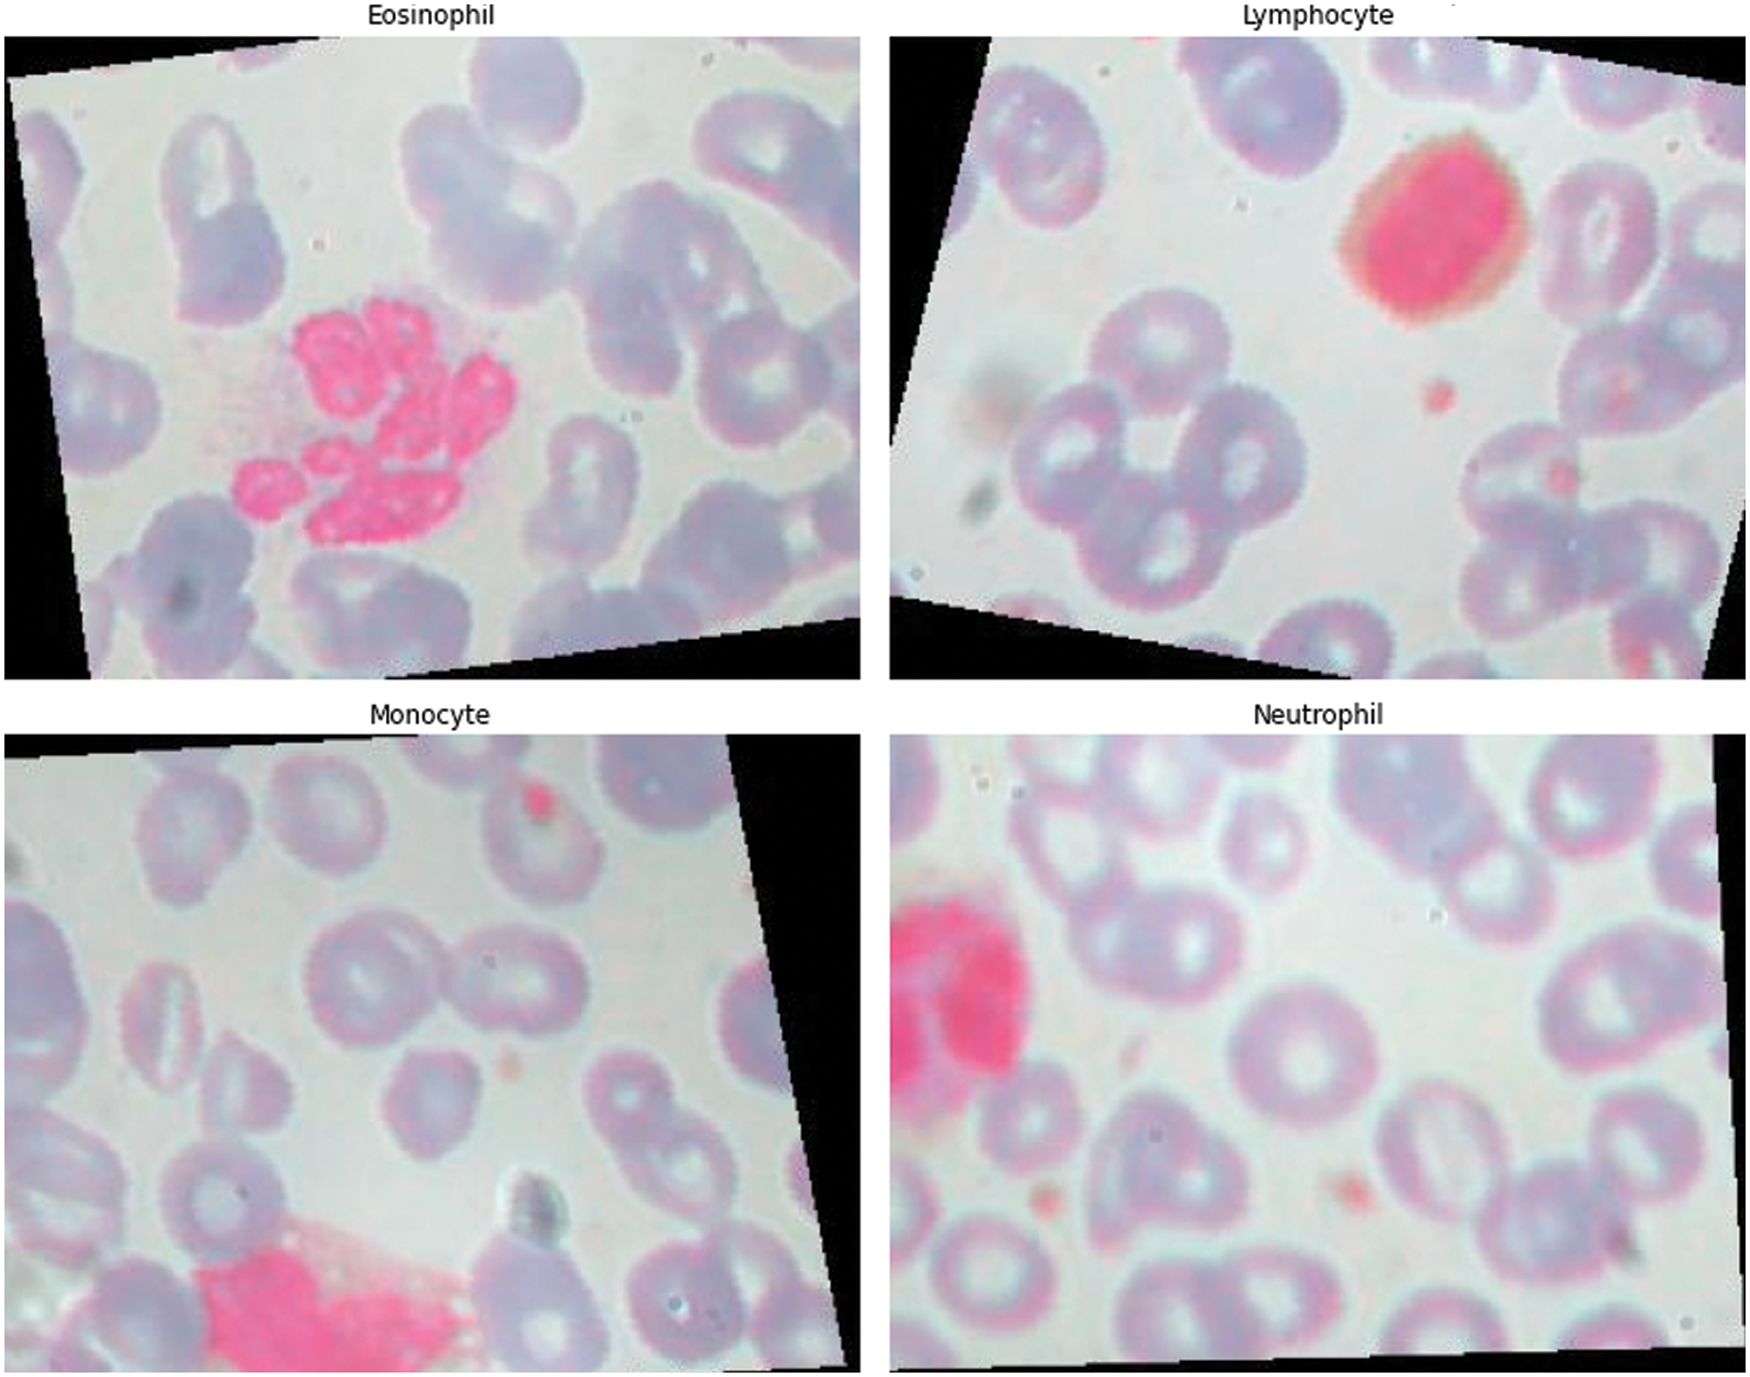
Figure 6: Visulization of four blood cells
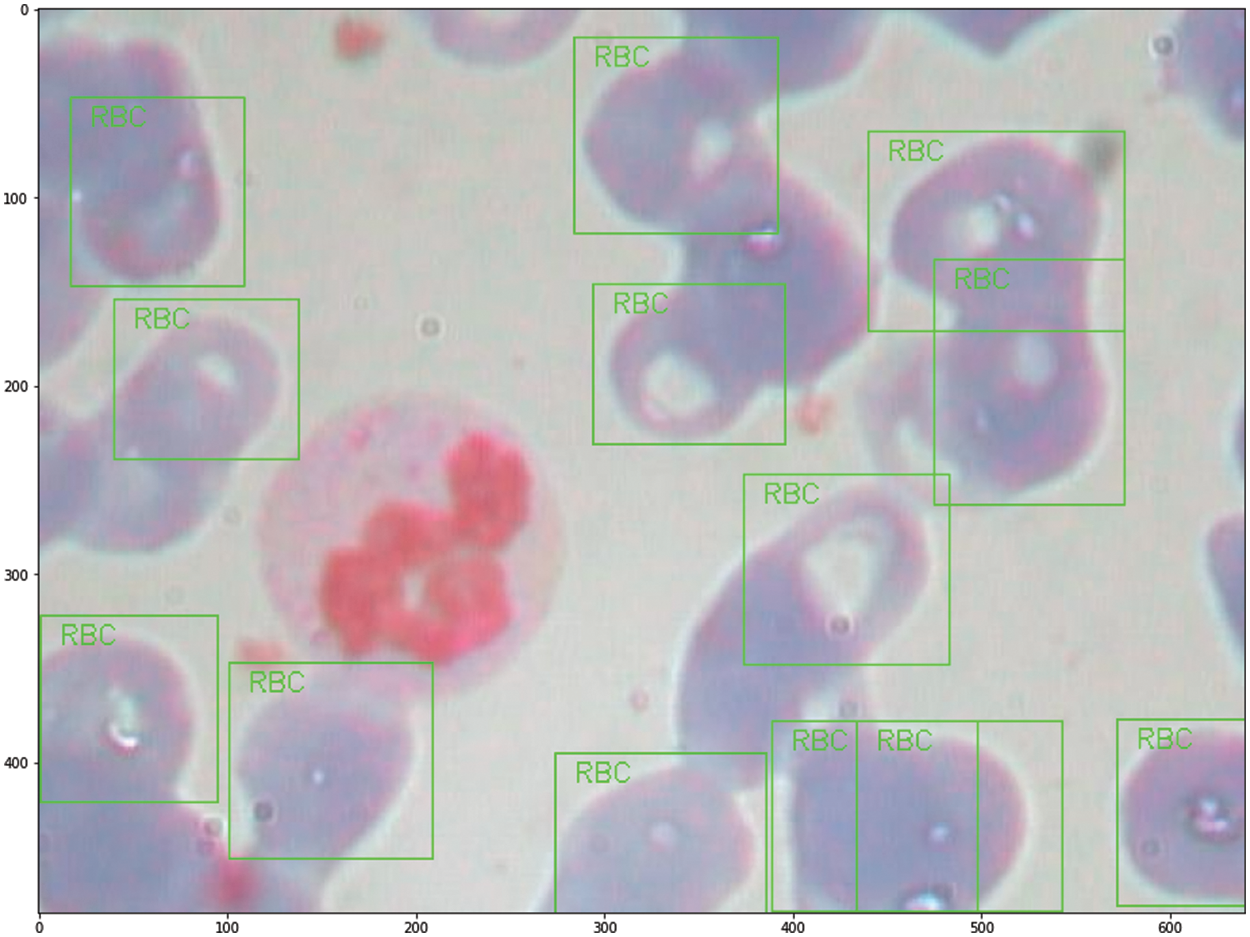
Figure 7: Labeling analysis of Eosinophils
3.2 Classification Comparison of the Deep Learning Models
Traditional CNNs with four hidden layers, such as Xception [9], InceptionV3 [10], ResNet50 [11], Squeeze [12], GoogleNet [13], SuffleNetV2 [14], Attention56 [15], and NasNet [16], are utilized to evaluate the final four classification detections. On the basis of deep learning’s excellent classification performance, the Keras and Pytorch frameworks are utilized to develop the deep learning network classification model for the classified findings. Crossectropy is used to assess model loss in the trials, and the Adam method is utilized to optimize model performance. The maximum epoch length is 20 and the learning rate is 0.0001. All tests are conducted on a Dell Precision 5820 running Linux. The graphics processing unit is an NVIDIA 2080Ti 11G. Table 1 shows how the performance of nine deep learning models was judged, and Figs. 8 and 9 show how the performance of nine deep learning models was judged.
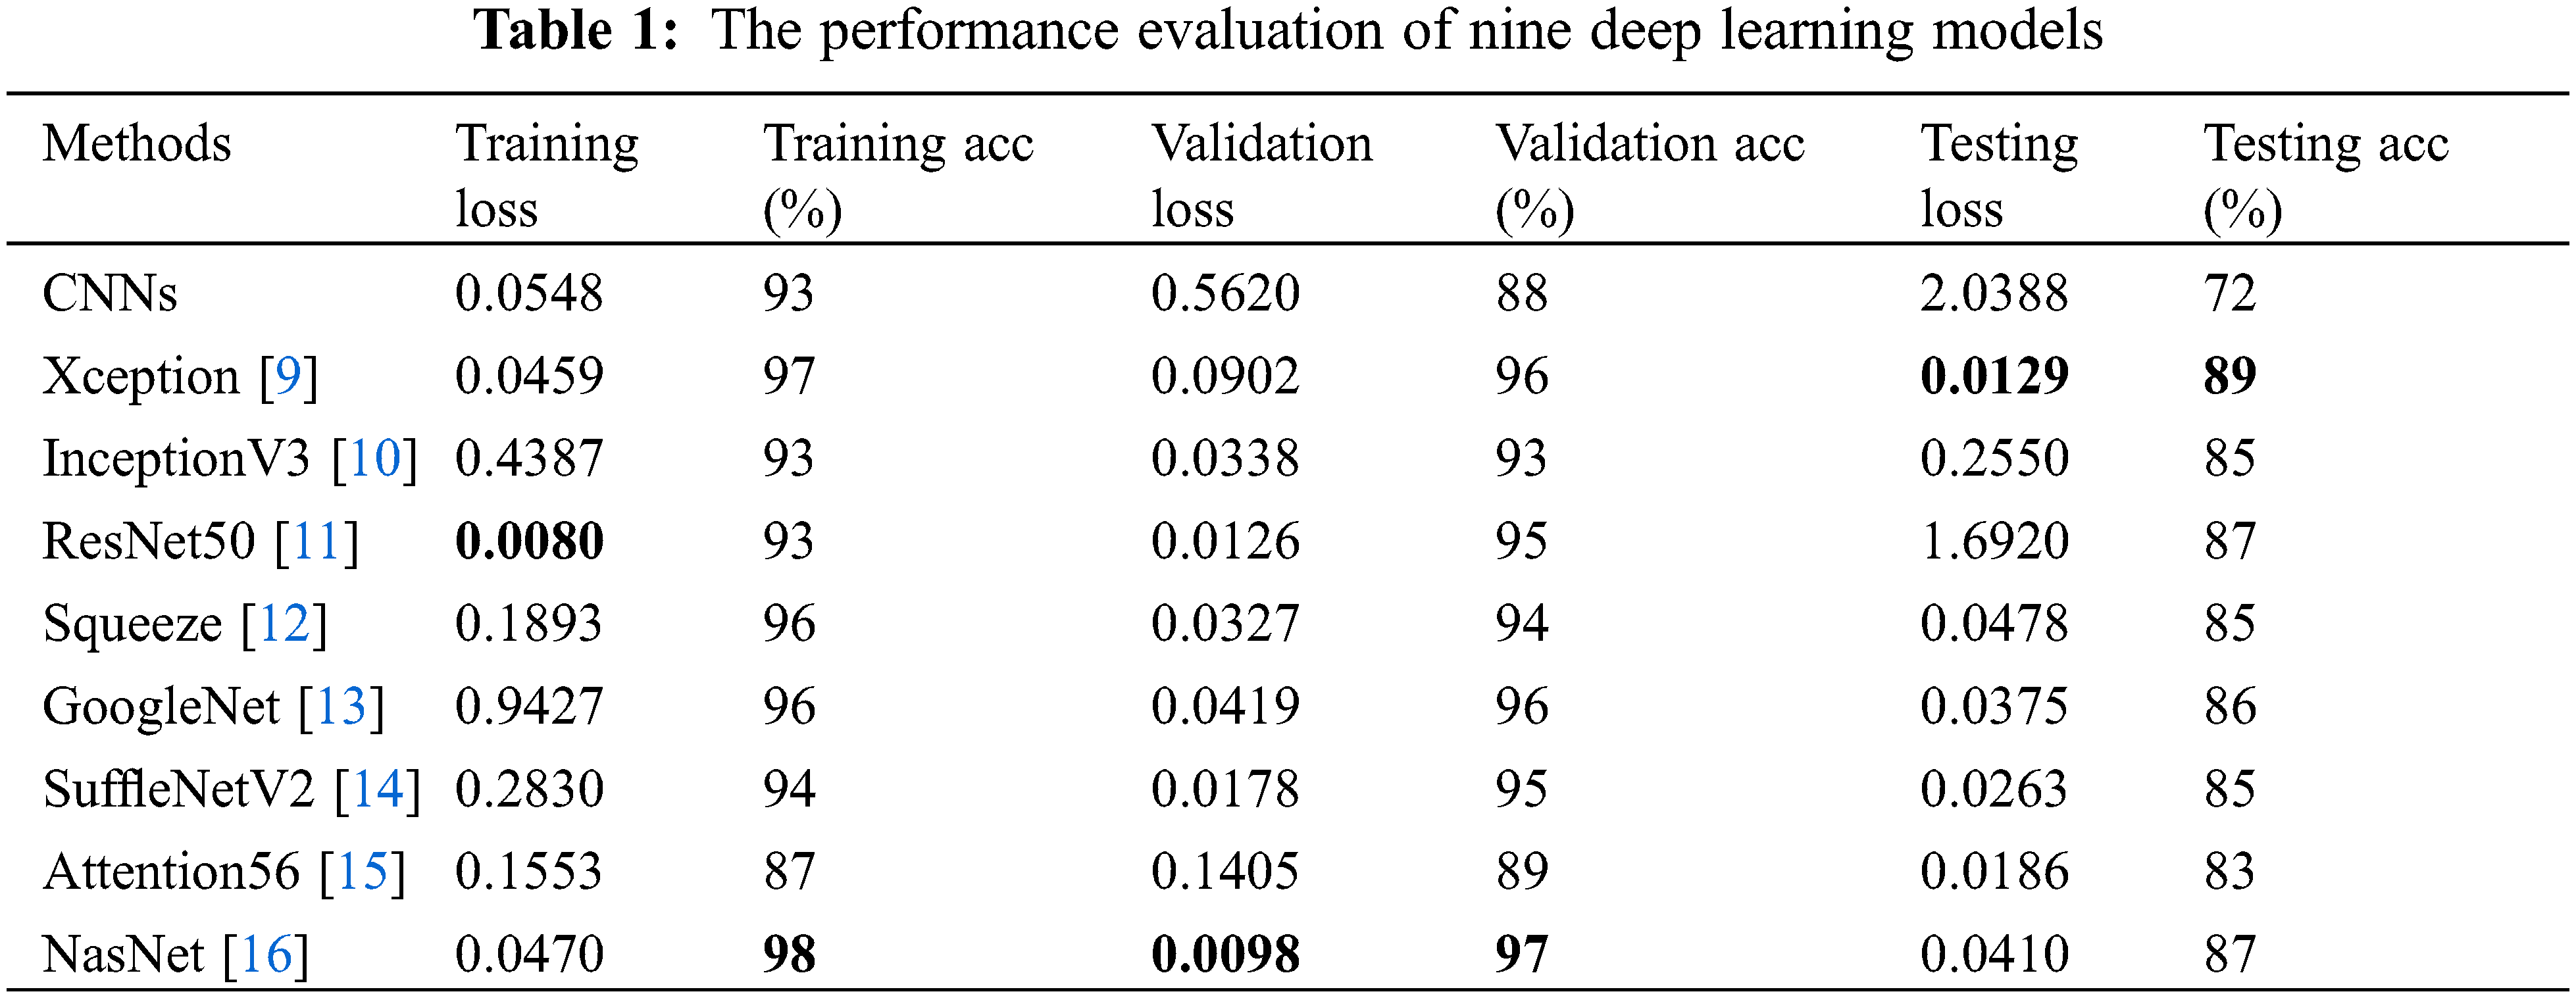
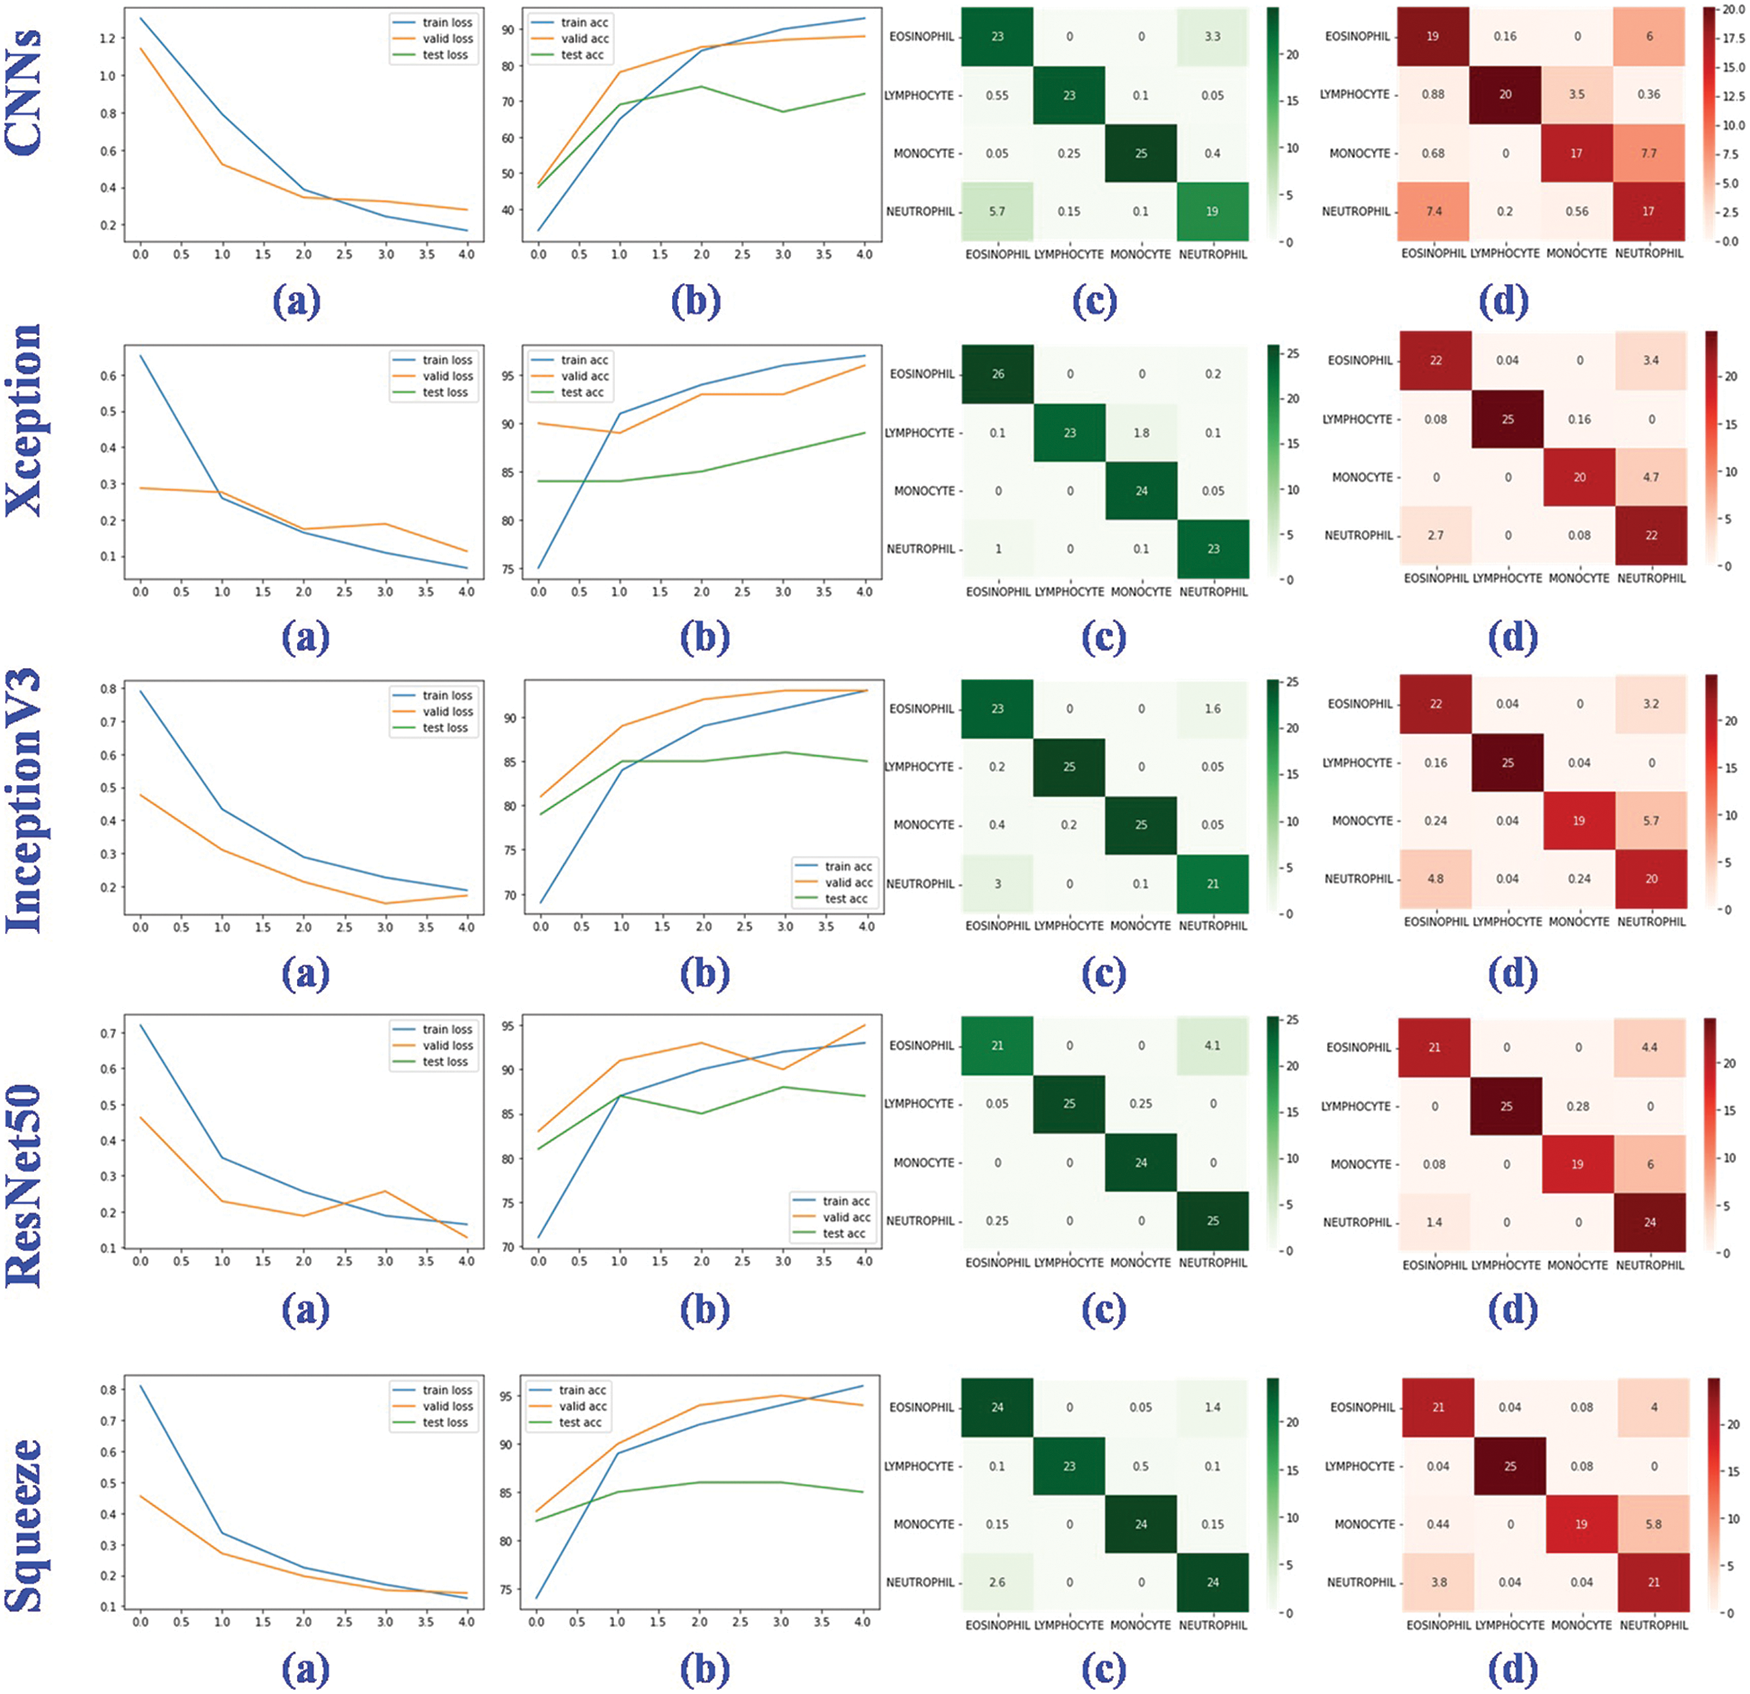
Figure 8: Performance evaluation of five deep learning models. (a) The training, valid and testing loss curve; (b) The training, valid and testing accuracy curve; (c) Confusion matrix of the valid dataset; (d) Confusion matrix of the testing dataset
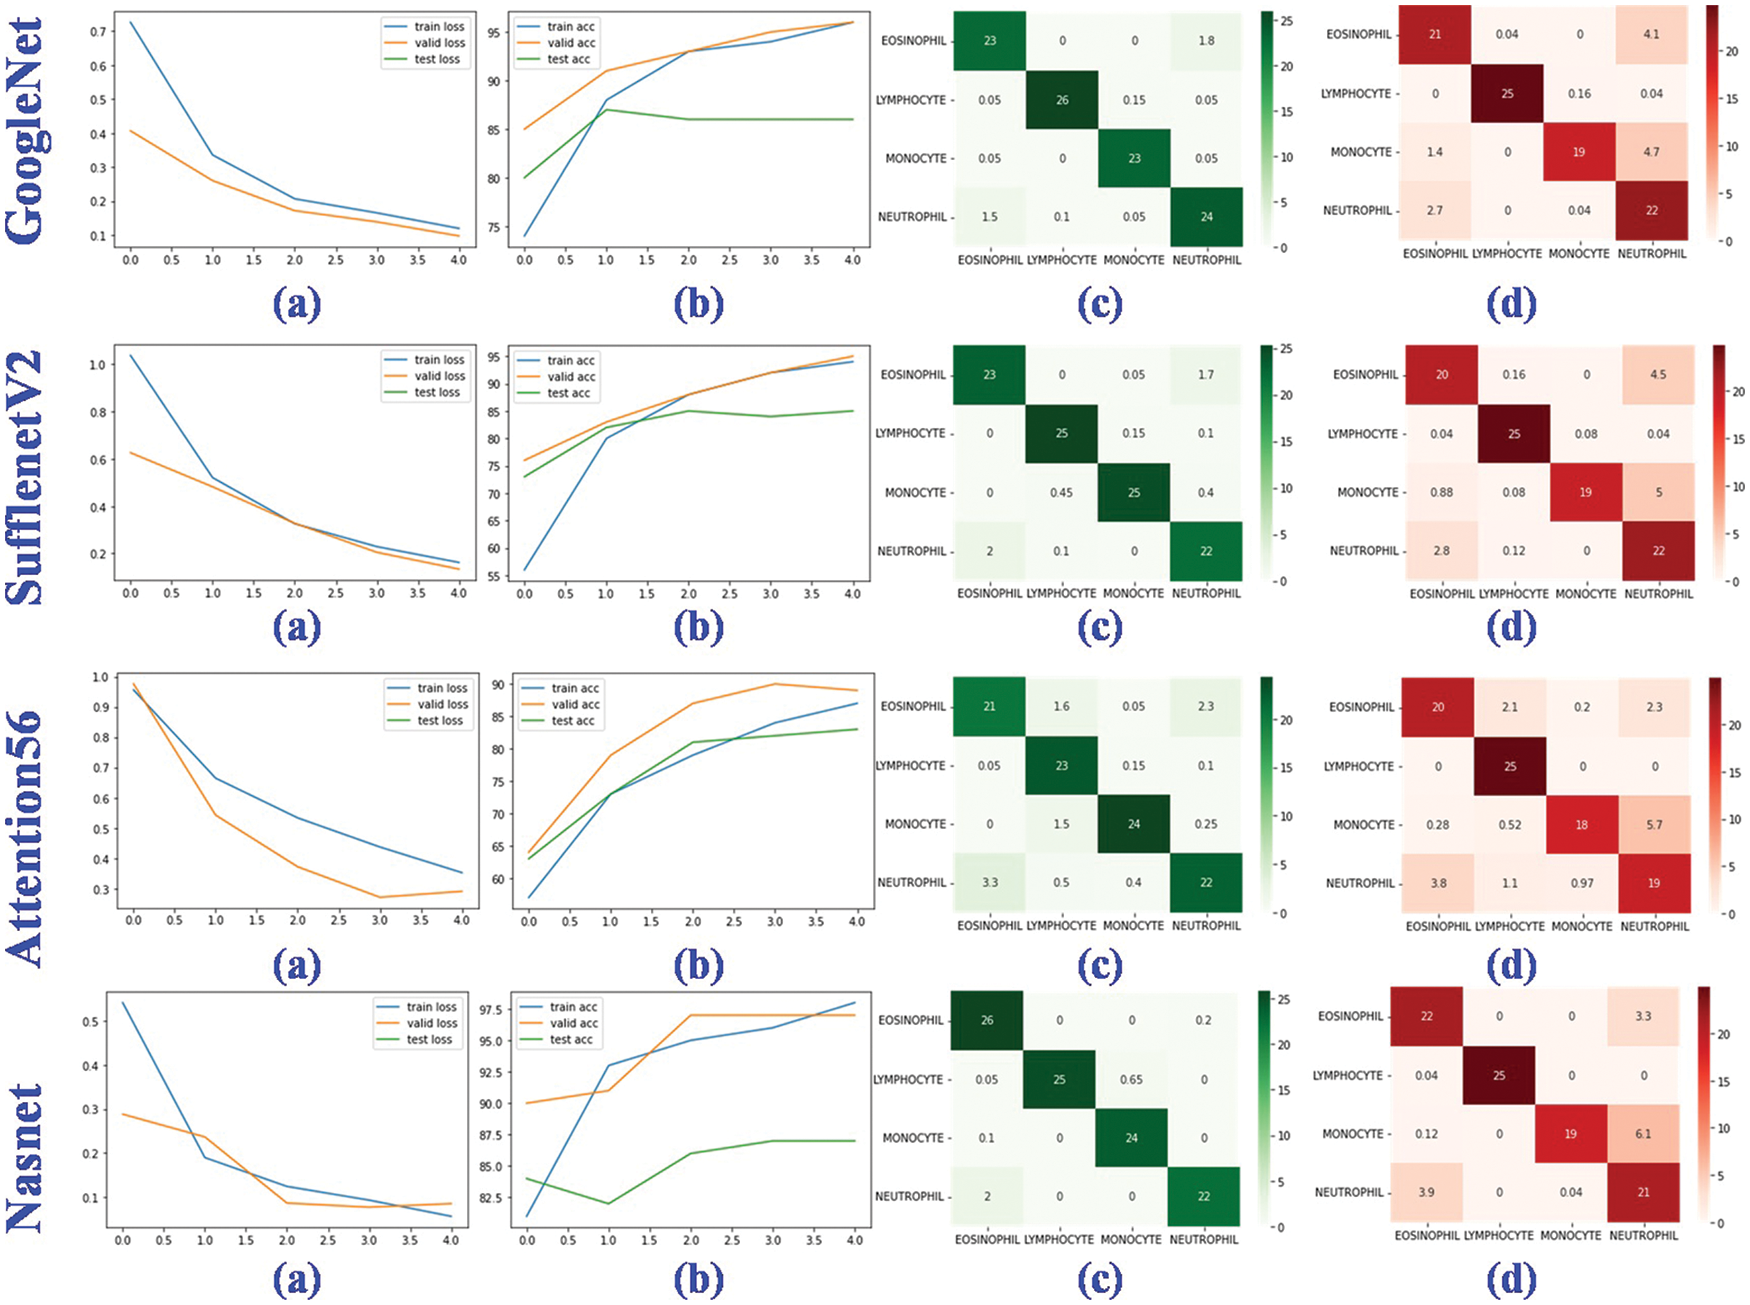
Figure 9: Performance evaluation of four deep learning models. (a) The training, valid and testing loss curve; (b) The training, valid and testing accuracy curve; (c) Confusion matrix of the valid dataset; (d) Confusion matrix of the testing dataset
In training, validation, and testing, the ResNet50, NasNet, and Xception achieve low model loss of 0.0080, 0.0098, and 0.0129, respectively. NasNet, NasNet, and Xception, respectively, have the best categorization accuracy of 98%, 97%, and 89%. In terms of individual metrics, the best results for training loss, training accuracy, validation loss, validation accuracy, test loss and test accuracy are ResNet50 (0.0080), NasNet (98%), NasNet (0.0098), NasNet (97%), Xception (0.0129) and Xception (89%). For overall metrics, we believe that the NasNet model achieves the best results, with the best performance in training accuracy, validation loss and validation accuracy, and is second only to Xception in test accuracy compared to other models. Despite the fact that the granulocyte appearance, diameter, and refractive index of the aforementioned four blood cells are distinct, the classification accuracy and model loss of nine deep learning models, in particular the benchmark model, were compared. It was discovered that deep learning is capable of automatically extracting features from four types of blood cells, including eosinophils, neutrophils, monocytes, and lymphocytes, and performing accurate classification analysis. This shows that the method proposed for analyzing hemodynamic categorization makes sense and works well.
In this study, nine models of deep learning were employed to classify four types of blood cells, eosinophils, neutrophils, monocytes, and lymphocytes. CNNs, Xception, InceptionV3, ResNet50, Squeeze, GoogleNet, SuffleNetV2, Attention56, and NasNet are among these models. Also presented are the statistical data derived from the aforementioned deep learning model, as well as the experiments based on 12,444 blood cell images and the experimental parameters setup. ResNet50, NasNet, and Xception achieve minimal model loss of 0.0080, 0.0098, and 0.0129 in training, validation, and testing datasets, respectively, and NasNet, NasNet, and Xception achieve 98%, 97% and 89% classification accuracy in training, validation, and testing datasets, despite blood cells with varying granulocyte appearance, diameter, and refractive index. Future research will investigate the analysis of clinical datasets utilizing improved techniques.
Acknowledgement: The authors would like to thank the editor and the anonymous reviewers for their insightful comments and helpful suggestions to improve the quality of this manuscript, which significantly enhanced the paper’s presentation.
Funding Statement: This project is supported by National Natural Science Foundation of China (NSFC) (Nos. 61806087, 61902158).
Conflicts of Interest: The authors declare that they have no conflicts of interest to report regarding the present study.
References
1. Gu, Y., Chen, A., Zhang, X., Fan, C., Li, K. et al. (2021). Deep learning based cell classification in imaging flow cytometer. ASP Transactions on Pattern Recognition and Intelligent Systems, 1(2), 18–27. DOI 10.52810/TPRIS. [Google Scholar] [CrossRef]
2. Lu, S. (2011). Accurate and efficient optic disc detection and segmentation by a circular transformation. IEEE Transactions on Medical Imaging, 30(12), 2126–2133. DOI 10.1109/TMI.2011.2164261. [Google Scholar] [CrossRef]
3. Liu, Z., Jin, L., Chen, J., Fang, Q., Ablameyko, S. et al. (2021). A survey on applications of deep learning in microscopy image analysis. Computers in Biology and Medicine, 134, 104523. DOI 10.1016/j.compbiomed.2021.104523. [Google Scholar] [CrossRef]
4. Tiwari, P., Qian, J., Li, Q., Wang, B., Gupta, D. et al. (2018). Detection of subtype blood cells using deep learning. Cognitive Systems Research, 52, 1036–1044. DOI 10.1016/j.cogsys.2018.08.022. [Google Scholar] [CrossRef]
5. Khalil, A. J., Abu-Naser, S. S. (2022). Diagnosis of blood cells using deep learning. International Journal of Academic Engineering Research (IJAER), 6(2), 69–84. [Google Scholar]
6. Dhieb, N., Ghazzai, H., Besbes, H., Massoud, Y. (2019). An automated blood cells counting and classification framework using mask R-CNN deep learning model. 2019 31st International Conference on Microelectronics (ICM), pp. 300–303. Cairo, Egypt, IEEE. [Google Scholar]
7. Larpant, N., Niamsi, W., Noiphung, J., Chanakiat, W., Sakuldamrongpanich, T. et al. (2022). Simultaneous phenotyping of five Rh red blood cell antigens on a paper-based analytical device combined with deep learning for rapid and accurate interpretation. Analytica Chimica Acta, 1207, 339807. DOI 10.1016/j.aca.2022.339807. [Google Scholar] [CrossRef]
8. Pasupa, K., Vatathanavaro, S., Tungjitnob, S. (2020). Convolutional neural networks based focal loss for class imbalance problem, A case study of canine red blood cells morphology classification. Journal of Ambient Intelligence and Humanized Computing. DOI 10.1007/s12652-020-01773-x. [Google Scholar] [CrossRef]
9. Chollet, F. (2017). Xception: Deep learning with depthwise separable convolutions. Proceedings of the IEEE Conference on Computer Vision and Pattern Recognition, pp. 1251–1258. Honolulu, Hawaii. [Google Scholar]
10. Szegedy, C., Vanhoucke, V., Ioffe, S., Shlens, J., Wojna, Z. (2016). Rethinking the inception architecture for computer vision. Proceedings of the IEEE Conference on Computer Vision and Pattern Recognition, pp. 2818–2826. Las Vegas, Nevada. [Google Scholar]
11. He, K., Zhang, X., Ren, S., Sun, J. (2016). Deep residual learning for image recognition. Proceedings of the IEEE Conference on Computer Vision and Pattern Recognition, pp. 770–778. Las Vegas, Nevada. [Google Scholar]
12. Han, S., Pool, J., Tran, J., Dally, W. (2015). Learning both weights and connections for efficient neural network. Advances in Neural Information Processing Systems, 28, 1–9. [Google Scholar]
13. Szegedy, C., Liu, W., Jia, Y., Sermanet, P., Reed, S. et al. (2015). Going deeper with convolutions. Proceedings of the IEEE Conference on Computer Vision and Pattern Recognition, pp. 1–9. Boston, Massachusetts. [Google Scholar]
14. Ma, N., Zhang, X., Zheng, H. T., Sun, J. (2018). ShuffleNet V2: Practical guidelines for efficient cnn architecture design. Proceedings of the European Conference on Computer Vision (ECCV), pp. 116–131. Munich, Germany. [Google Scholar]
15. Wang, F., Jiang, M., Qian, C., Yang, S., Li, C. et al. (2017). Residual attention network for image classification. Proceedings of the IEEE Conference on Computer Vision and Pattern Recognition, pp. 3156–3164. Honolulu, Hawaii. [Google Scholar]
16. Zoph, B., Vasudevan, V., Shlens, J., Le, Q. V. (2018). Learning transferable architectures for scalable image recognition. Proceedings of the IEEE Conference on Computer Vision and Pattern Recognition, pp. 8697–8710. Salt Lake City, Utah. [Google Scholar]
17. Hegde, R. B., Prasad, K., Hebbar, H., Singh, B. M. K. (2019). Comparison of traditional image processing and deep learning approaches for classification of white blood cells in peripheral blood smear images. Biocybernetics and Biomedical Engineering, 39(2), 382–392. DOI 10.1016/j.bbe.2019.01.005. [Google Scholar] [CrossRef]
18. Kutlu, H., Avci, E., Özyurt, F. (2020). White blood cells detection and classification based on regional convolutional neural networks. Medical Hypotheses, 135, 109472. DOI 10.1016/j.mehy.2019.109472. [Google Scholar] [CrossRef]
19. Baydilli, Y. Y., Atila, Ü. (2020). Classification of white blood cells using capsule networks. Computerized Medical Imaging and Graphics, 80, 101699. DOI 10.1016/j.compmedimag.2020.101699. [Google Scholar] [CrossRef]
20. Shahin, A. I., Guo, Y., Amin, K. M., Sharawi, A. A. (2019). White blood cells identification system based on convolutional deep neural learning networks. Computer Methods and Programs in Biomedicine, 168, 69–80. DOI 10.1016/j.cmpb.2017.11.015. [Google Scholar] [CrossRef]
21. Sharma, M., Bhave, A., Janghel, R. R. (2019). White blood cell classification using convolutional neural network. In: Soft computing and signal processing, pp. 135–143. Singapore: Springer. [Google Scholar]
22. Sahlol, A. T., Kollmannsberger, P., Ewees, A. A. (2020). Efficient classification of white blood cell leukemia with improved swarm optimization of deep features. Scientific Reports, 10(1), 1–11. DOI 10.1038/s41598-020-59215-9. [Google Scholar] [CrossRef]
23. Zhang, M., Li, X., Xu, M., Li, Q. (2020). Automated semantic segmentation of red blood cells for sickle cell disease. IEEE Journal of Biomedical and Health Informatics, 24(11), 3095–3102. DOI 10.1109/JBHI.6221020. [Google Scholar] [CrossRef]
24. Iqbal, M. S., Ahmad, I., Bin, L., Khan, S., Rodrigues, J. J. (2021). Deep learning recognition of diseased and normal cell representation. Transactions on Emerging Telecommunications Technologies, 32(7), e4017. DOI 10.1002/ett.4017. [Google Scholar] [CrossRef]
25. Kassim, Y. M., Palaniappan, K., Yang, F., Poostchi, M., Palaniappan, N. et al. (2020). Clustering-based dual deep learning architecture for detecting red blood cells in malaria diagnostic smears. IEEE Journal of Biomedical and Health Informatics, 25(5), 1735–1746. DOI 10.1109/JBHI.2020.3034863. [Google Scholar] [CrossRef]
26. Jiang, Z., Liu, X., Yan, Z., Gu, W., Jiang, J. (2021). Improved detection performance in blood cell count by an attention-guided deep learning method. OSA Continuum, 4(2), 323–333. DOI 10.1364/OSAC.413787. [Google Scholar] [CrossRef]
27. Aliyu, H. A., Sudirman, R., Razak, M. A. A., Abd Wahab, M. A. (2018). Red blood cell classification, deep learning architecture versus support vector machine. 2018 2nd International Conference on Biosignal Analysis, Processing and Systems (ICBAPS), pp. 142–147. Kuching, Malaysia, IEEE. [Google Scholar]
28. Boldú, L., Merino, A., Acevedo, A., Molina, A., Rodellar, J. (2021). A deep learning model (ALNet) for the diagnosis of acute leukaemia lineage using peripheral blood cell images. Computer Methods and Programs in Biomedicine, 202, 105999. DOI 10.1016/j.cmpb.2021.105999. [Google Scholar] [CrossRef]
29. Mohamed, E. H., El-Behaidy, W. H., Khoriba, G., Li, J. (2020). Improved white blood cells classification based on pre-trained deep learning models. Journal of Communications Software and Systems, 16(1), 37–45. DOI 10.24138/jcomss. [Google Scholar] [CrossRef]
30. Jiang, H., Li, S., Liu, W., Zheng, H., Liu, J. et al. (2020). Geometry-aware cell detection with deep learning. Msystems, 5(1), e00840-19. DOI 10.1128/mSystems.00840-19. [Google Scholar] [CrossRef]
31. Khouani, A., El Habib Daho, M., Mahmoudi, S. A., Chikh, M. A., Benzineb, B. (2020). Automated recognition of white blood cells using deep learning. Biomedical Engineering Letters, 10(3), 359–367. DOI 10.1007/s13534-020-00168-3. [Google Scholar] [CrossRef]
32. Tran, T., Kwon, O. H., Kwon, K. R., Lee, S. H., Kang, K. W. (2018). Blood cell images segmentation using deep learning semantic segmentation. 2018 IEEE International Conference on Electronics and Communication Engineering (ICECE), pp. 13–16. Xi’an, China, IEEE. [Google Scholar]
33. Li, W. Q., Deng, X., Shao, H. J., Wang, X. (2021). Deep learning applications for COVID-19 analysis. A State-of-the-art survey. Computer Modeling in Engineering & Sciences, 129(1), 65–98. DOI 10.32604/cmes.2021.016981. [Google Scholar] [CrossRef]
34. Deng, X., Shao, H., Shi, L., Wang, X., Xie, T. (2020). A classification–detection approach of COVID-19 based on chest X-ray and CT by using keras pre-trained deep learning models. Computer Modeling in Engineering & Sciences, 125(2), 579–596. DOI 10.32604/cmes.2020.011920. [Google Scholar] [CrossRef]
Cite This Article
 Copyright © 2023 The Author(s). Published by Tech Science Press.
This work is licensed under a Creative Commons Attribution 4.0 International License , which permits unrestricted use, distribution, and reproduction in any medium, provided the original work is properly cited.
 Downloads
 Citation Tools