
 Submit a Paper
 Propose a Special lssue
 Open Access
ARTICLE
A New Distribution Method for Wet Steam Injection Optimization
Hubei Key Laboratory of Oil and Gas Drilling and Production Engineering, Yangtze University, Wuhan, 434000, China
* Corresponding Author: Xingkai Zhang. Email:
Fluid Dynamics & Materials Processing 2024, 20(1), 109-127. https://doi.org/10.32604/fdmp.2023.030106
Received 22 March 2023; Accepted 27 June 2023; Issue published 08 November 2023
 View Full Text
 Download PDF
Abstract
A new approach and a new related distribution system are proposed to address the issue of uneven steam injection caused by the different suction capacities of the used wells during the application of steam “stimulation” methods for enhanced oil recovery. The new distribution system consists of a swirler, spiral dividing baffles, and critical flow nozzles. Numerical simulations are used to analyze the flow-field and degree of steam homogeneity obtained with such an approach. The results indicate that a higher inlet pressure leads to better results. Additionally, the internal flow field becomes more stable, and the deviation from an even distribution reduces to ±4.0% even when the resistance of each branch is inconsistent. Furthermore, field tests have yielded satisfactory results.Keywords
In heavy oil production, steam stimulation is utilized to enhance oil recovery by decreasing oil viscosity and increasing fluidity [1,2]. The steam generated by a boiler is often injected into multiple wells. However, differences in pipe network structure, the back pressure of each well, and steam-water phase separation during transmission on the ground result in uneven steam distribution among different wells. The development of heavy oil reservoirs primarily relies on the heat energy carried by high-temperature and high-pressure saturated steam. The non-uniform distribution of steam quality leads to thermal energy resource wastage and hampers the development of heavy oil reservoirs. Therefore, achieving homogeneous distribution has become a critical topic in multiphase flow research.
Fachun et al. and Zhang et al. have demonstrated that entrance flow pattern, inlet geometry, and inlet quality are critical factors that impact steam quality distribution [3,4]. Some researchers have proposed the installation of a static mixer and guide plate in the main pipe, which has improved distribution uniformity to some extent. However, downstream phase separation still occurs [5]. Rubel et al. adjusted the flow area of the two branches to achieve equal dryness by changing the position of the guide plate when the guide plate was installed before the static mixer. However, the apparatus has not addressed the problem of maintaining a short distance and high resistance after gas-liquid two-phase mixing, and there is also the issue of adjusting the guide plate in the gas-liquid two-phase flow [6]. Wren et al. suggested that partial phase separation occurring at the T-junction could be enhanced where the branch was inserted into the branch. They found that the angle of insertion of the branch tube had almost no significant impact on the separation characteristics. Therefore, further investigation is necessary to reduce dryness deviations in each branch and improve the homogeneous distribution of the gas-liquid two-phase flow. They also found that cutting angle of the branch had little effect on the separation characteristics and that further improvements were needed to minimize deviations in the homogeneous distribution of each branch [7]. To minimize significant deviation from the homogeneous distribution of the gas-liquid two-phase flow in the impact tee, Tian et al. installed orifice plates in the tee to alter the flow pattern and simultaneously enhance the flow characteristics. However, they could only ensure homogeneous distribution within a limited range of gas-liquid velocities [8]. Centrifugal devices, such as swirl blades, drums, and runners, are commonly used to adjust the gas-liquid two-phase distribution and consequently improve the effect of the inlet flow pattern [9–11]. Wang et al. presented an industrially realizable drum-wheel type time-sharing distribution system for the first time, which utilizes a drum for time-sharing distribution. When the gas-liquid two-phase fluid enters the drum, it is driven to rotate, and distribution is achieved by designing distribution flow channels of different proportions. The device underwent air-water experiments, which revealed that under certain experimental conditions, the purpose of homogeneous distribution of gas-liquid two-phase flow can be achieved, but the structure is relatively complex [12]. Furthermore, Huang et al. suggested that the two-phase distribution can be adjusted using devices such as acceleration tubes and runners, and that homogeneous distribution can be achieved via centrifugal action, which is superior to gravity action. However, even if the gas-liquid distribution is adjusted, the quality distribution of the steam can still be affected by the different resistance characteristics of the downstream branch pipes [13].
Zhang et al. conducted numerical simulations to investigate the distribution of gas-liquid two-phase flow in a multi-parallel branch channel. They found that the branch pressure difference influences the distribution of the gas-liquid two-phase flow by altering the outlet pressure of the branch [14]. In addition, Chun et al. employed straight-hole critical flow nozzles to improve the production of wells by controlling the quality of steam injection in each one [15]. Redus et al. carried out experiments at the Texaco steam drive site using critical flow nozzles in series and an orifice plate in cyclical steam stimulation. They determined the size of the nozzle for each steam injection well based mainly on solving the equations for the critical flow nozzle and the mass of wet steam passing through the sharp-edged orifice plate, which enable the required steam flow rate to be achieved with homogeneous injection into each well [16,17]. Liang et al. utilized a Venturi nozzle to eliminate the inconsistency of downstream resistance in the branch. This ensured that the gas-liquid mixture reached the velocity of sound at the throat, which implies that the steam distribution was not affected by the upstream flow pattern and gas–liquid velocity [18]. In addition, Dolatabadi et al. optimized the position of the steam injection within nozzle, finding that optimal injection mode exhibited the highest kinetic energy and efficiency while minimizing entropy. They also modified the wet steam model, reducing wetness loss by up to 6.5% compared to the original model [19,20]. Through experimentation and simulations of supersonic flow in a suddenly expanded nozzle, they successfully utilized optimization techniques to predict optimal results for flow control, thus avoiding the need for additional experimentation and reducing costs and energy usage [21,22]. Moreover, adjusting the inlet pressure of the critical flow Venturi or changing the throat size of the nozzle are both means to regulate the flow rate [23–25]. Liu et al. [26] proposed a new device for homogeneous distribution based on the principle of isokinetic, which showed homogeneous distribution within an error of ±3% during experimentation and simulation of gas-liquid two-phase flow at normal temperature and pressure. However, their study only considered the distribution of air-water two-phase flow, without taking into account the effect of downstream pressure from the branch outlet.
In this study, wet steam at high temperature and high pressure is utilized as the research medium, and a critical flow Venturi nozzle is added to the branch. This method ensures that the stability of the airflow and the flow field in the main pipe are not affected by the inconsistent resistance characteristics of the branch outlet, thereby achieving homogeneous distribution of steam.
2 Principle of the Homogeneous Distribution System
2.1 Construction of the Homogeneous Distribution System
The aim of this study is to develop a method for achieving homogeneous distribution of wet steam, using a two-branch homogeneous distribution system as an example. Fig. 1 illustrates the structure of a double-branch homogeneous distribution system, which includes a swirler consisting of four thin semi-elliptical blades with an inclination of 45° near the entrance of the main pipe. Spiral dividing baffles are located below the swirler and divide the main channel into two branches, channels 2 and 3. Critical flow Venturi nozzles are placed on each of the two branch channels, with cylindrical-throat Venturi nozzle design specifications based on those listed in GB/T 21188-2007 [27]. The dimensions of the two nozzles were determined using the flow-distribution ratio, with specific dimensions illustrated in Fig. 2.
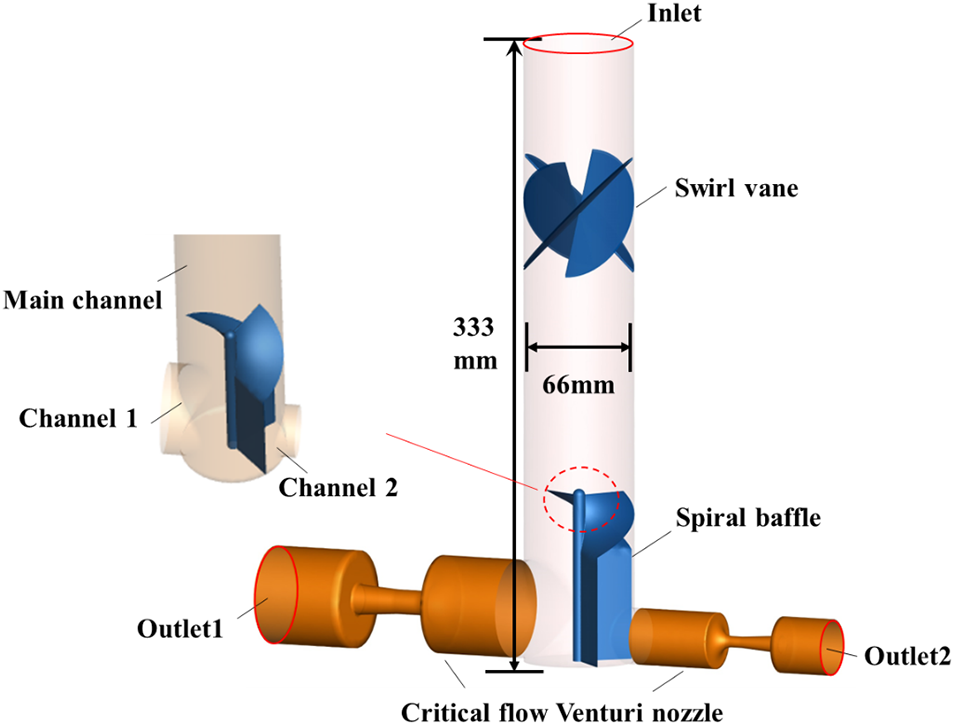
Figure 1: Structure of the homogeneous distribution device
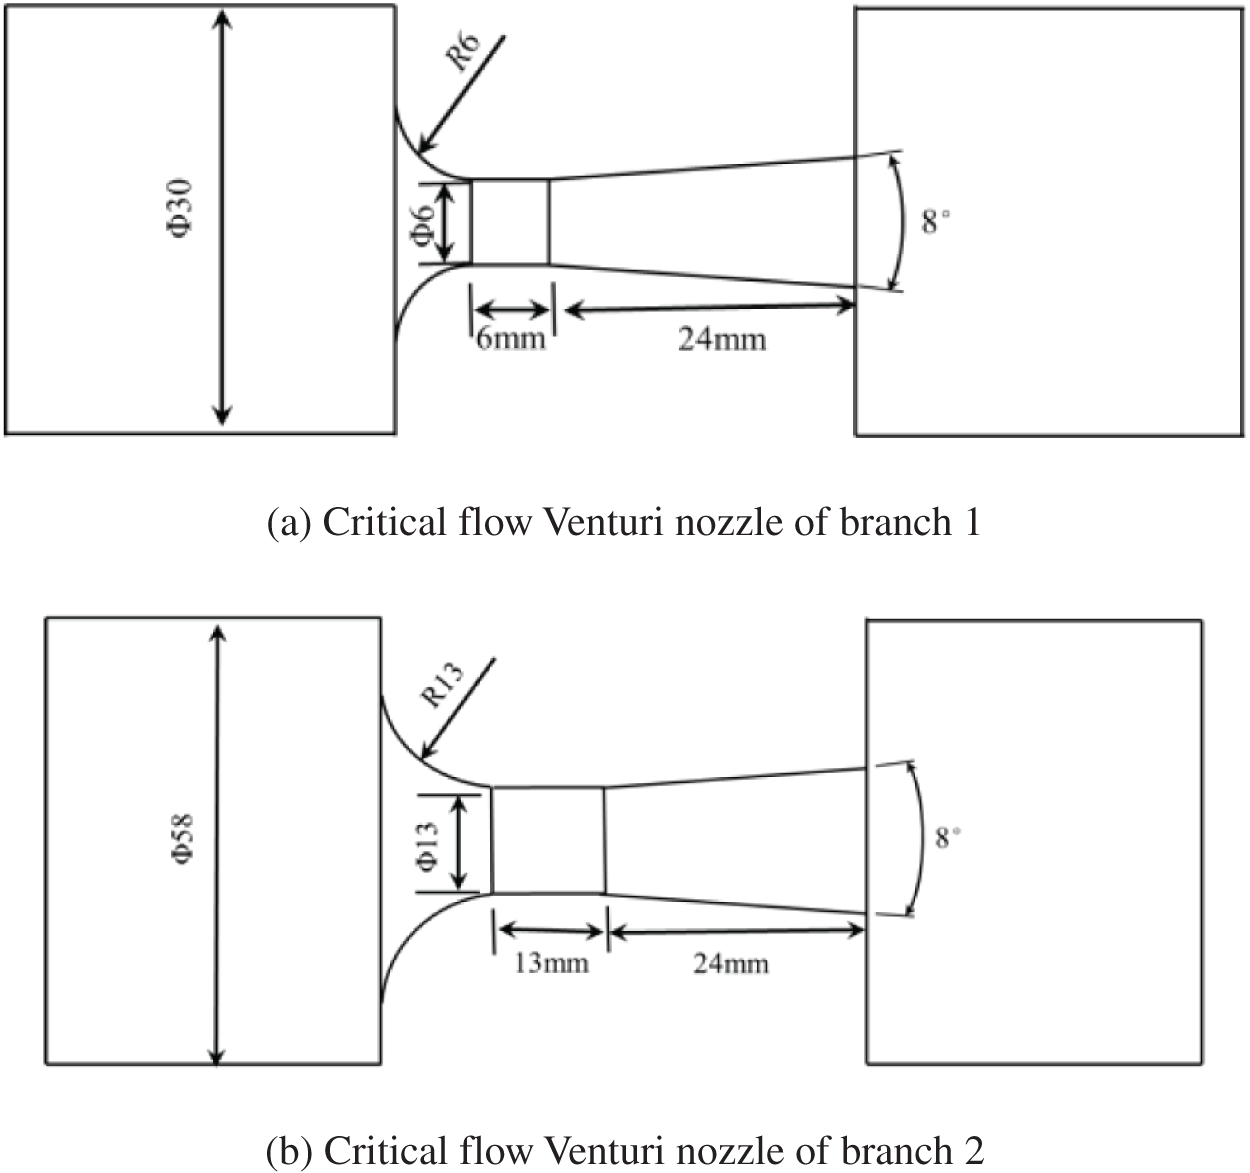
Figure 2: Critical flow Venturi nozzles of the two branches
In practical engineering applications, critical flow Venturi nozzles are specifically designed to address issues related to pressure fluctuations and flow control at the outlets of both branches. For this study, the nozzles were specifically designed for steam flow rates ranging from 19 to 36 t/h, with an inlet quality ranging from 40% to 80%. The Thornhill-Craver equation was chosen as the critical flow control equation for this study [28].
where W is the steam flow in kg/s, Y is the expansion coefficient of steam, d is the Venturi nozzle throat diameter (mm), H is the Venturi nozzle throat length (mm), ρ is the steam density (kg/m3), and P is the inlet pressure of the critical flow nozzle (MPa).
Fig. 3 illustrates a schematic of the distribution structure used in this study. The primary principle of the homogeneous distribution method involves transforming the inlet gas-liquid two-phase flow regime, using a swirler, into a homogeneous and symmetrical annular flow to eliminate the influence of the inlet two-phase flow regime on the distribution process. Then, the main flow pipe is separated into fan-shaped spiral channels by spiral dividing the baffles at suitable locations downstream of the swirler corresponding to the branches. This allows the axisymmetric gas-liquid two-phase fluid to be guided into the divided channels in parallel without obstruction. Finally, the gas–liquid critical flow nozzle balances the resistance between the inlet and outlet of the divided channels, thereby avoiding the effect of fluctuations in the downstream flow and pressure on the homogeneous distribution. The gas-liquid two-phase flow then flows into the divided fan-shaped channels under separated states and isokinetic conditions before entering the branches through the critical flow nozzles, achieving homogeneous distribution of different gas-liquid flow ratios. It is essential that the upstream swirler, diversion channels, and downstream critical flow nozzle are all interlinked and indispensable. Homogeneous distribution in various gas-liquid two-phase flow ratios can be achieved only when all three of them work together perfectly.
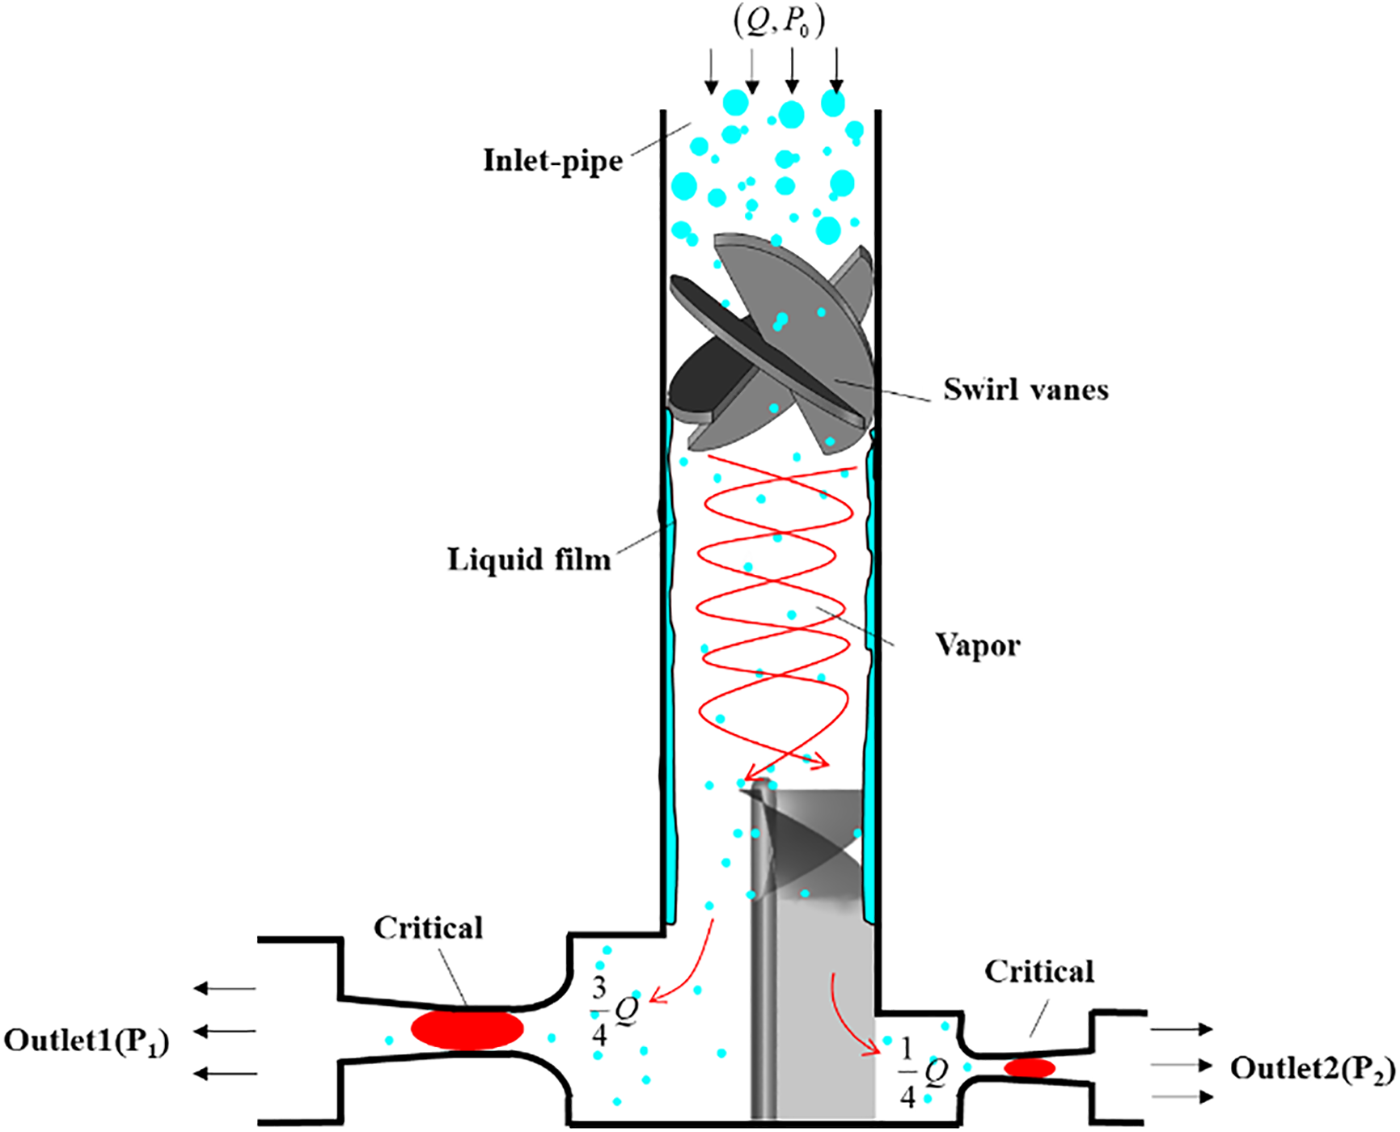
Figure 3: Schematic of the structure of the distribution device
3 Numerical Simulation Approach
This study employed ANSYS Inc.’s Fluent 19.0 software to investigate the gas-liquid two-phase flow field in the distribution system and the homogeneous distribution effect. The VOF, Mixture, and Eulerian-Eulerian models are all commonly used fluid calculation models. The VOF model is suitable for two or more immiscible fluids with laminar flow, free surface flow of fluids, and vapor bubble flow in liquids. Meanwhile, the Mixture and Euler-Eulerian models are used for mixing/separation of different phases, with the Mixture model applied to bubble flow, settling, and cyclone separators [28].
Multifluid and mixture models are often used to predict the behavior of flows with dispersed interfaces where complete modeling is not practical or necessary. These models are particularly useful in systems such as sedimentation tanks, cyclone separators, and annular flow systems [29].
In this study, the working medium consisted of vapor and water, with vapor as the primary phase and water as the secondary phase. To balance accuracy with computing load capacity and convergence time, the Mixture model was employed during the calculation process.
The vapour is the main phase and is continuous; water is the secondary phase. Collision, agglomeration, or break-up of droplets was neglected during the CFD simulations. The continuity equation for the saturated water–vapour two-phase flow Mixture model is expressed as follows:
where
The momentum equation of the saturated steam two-phase flow Mixture model is as follows:
where p is the static pressure in Pa, g is the acceleration in m/s2, F is the volume force,
The energy conservation equation for the two-phase flow Mixture model of saturated wet steam is:
where
For the vapour phase:
For the water phase:
where
The Reynolds stresses in the RANS equations were estimated using epsilon models, including standard and RNG epsilon models, as well as the Reynolds stress model. In the epsilon models, the Reynolds stress tensor can be calculated based on the isotropic eddy viscosity assumption. The RNG epsilon model, which is a member of the epsilon family of turbulence models, is developed using a statistical method based on Renormalization Group (RNG) techniques by Yakhot et al. [30]. This model features an additional term in the dissipation equation to increase its accuracy when dealing with rapidly strained flows [31].
The standard epsilon model is a semi-empirical formulation with high accuracy and wide applicability. However, it assumes isotropic turbulence as the default turbulence, which may result in significant deviations from actual results when solving numerical problems with strong cyclonic flows and complex flow directions and internal excitation velocities. In contrast, the RNG epsilon model employs a rigorous statistical technique that integrates turbulent vortex factors to enhance the accuracy of rotational flow field simulation. The analytical formulation based on the RNG theory incorporates the effects of low Reynolds number flow viscosity, which is particularly important for solving the near-wall region flow, making the RNG epsilon model more reliable and accurate than the standard epsilon model, especially for rotational flow. Lakzian et al. used the RNG epsilon model to predict turbulence vortices accurately and considered the tip clearance region [32].
Considering the influence of fluid compressibility, the speed of convergence required, and the computational time, the RNG epsilon model was selected as the final turbulence model [33].
where
For RNG k-ε model, the pressure was discretized using second order. The pressure-velocity coupling is achieved by using the SIMPLE scheme [34]. The discretization of the convective terms for momentum, turbulent kinetic energy, dissipation rate and Reynolds stresses is achieved by second order upwind scheme.
3.4 Meshing and Grid Independency Test
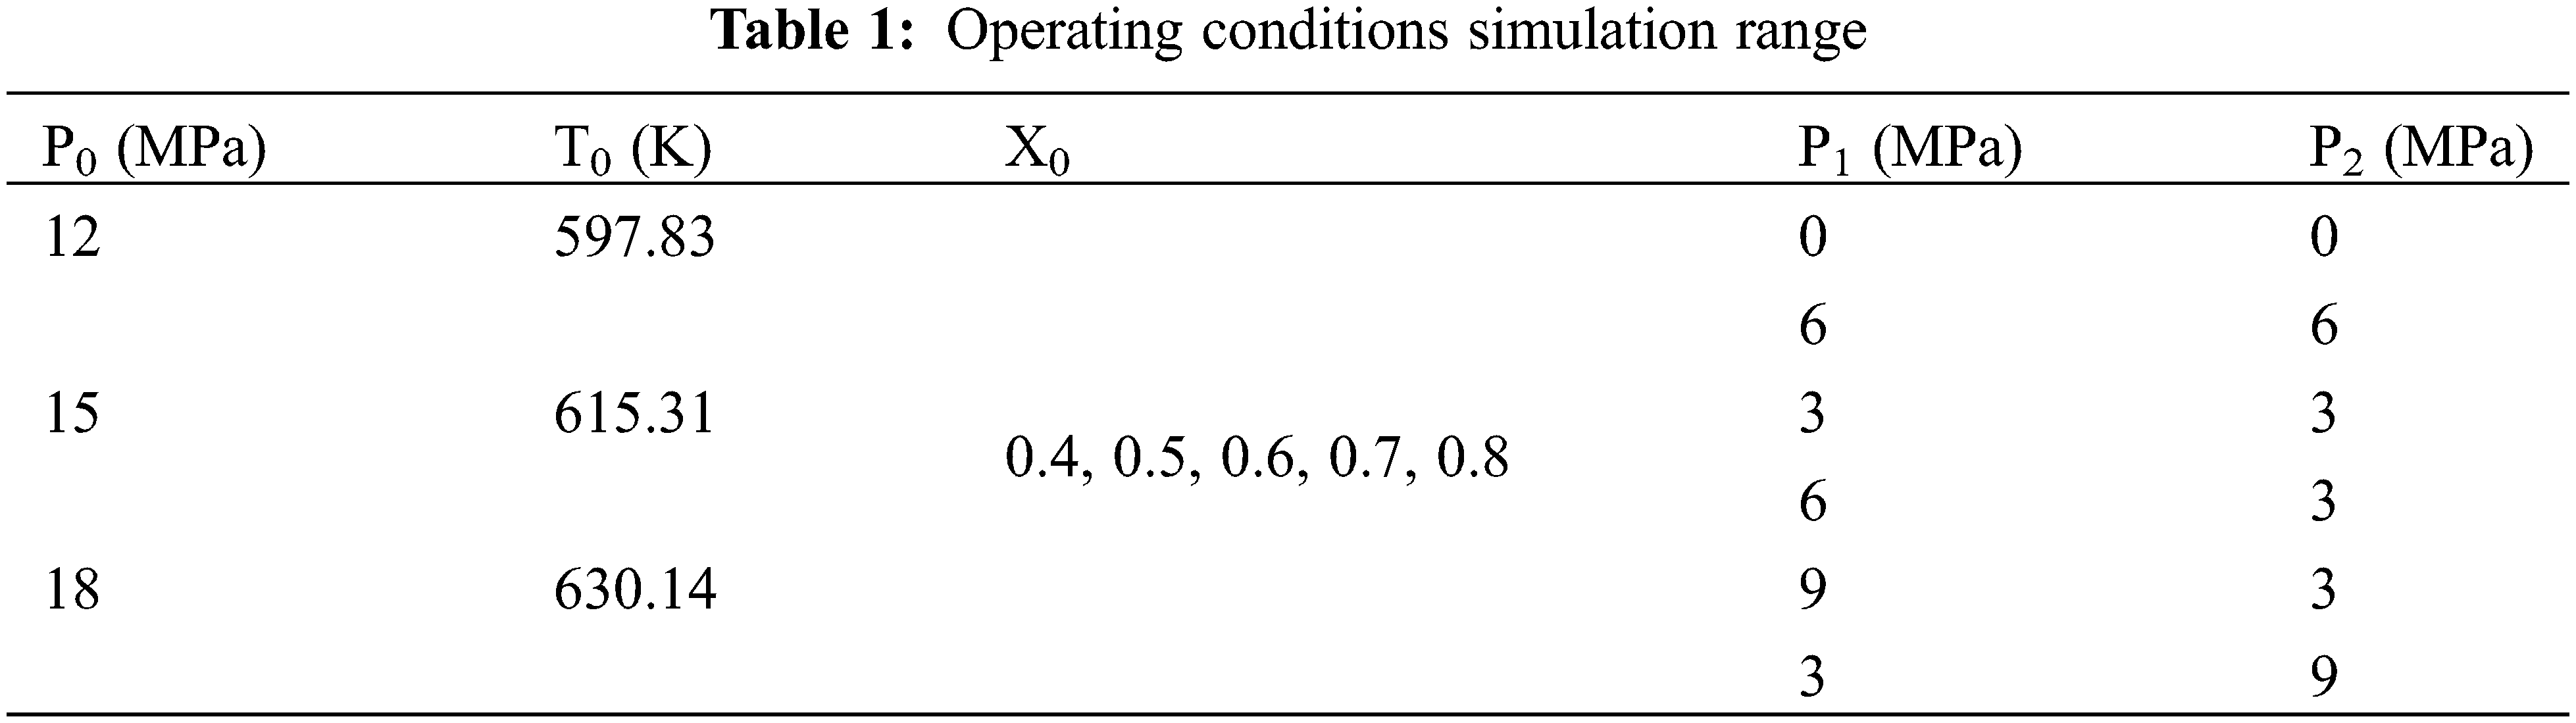
(1) Boundary conditions were employed for the pressure inlet and outlet. There was no slide on the wall. To analyse the impact of each branch outlet pressure on the distribution of equal quality under various pressures and temperatures, the specific boundary conditions of the computation were set up as given in Table 1.
(2) The viscosities of the vapour and water are the corresponding saturated viscosity values, and the inlet turbulence intensity is set to 5%.
The fluid domain mesh was generated using the ANSYS Inc. mesh software, consisting of a hybrid grid composed of both structured and unstructured meshes. The total cell count was approximately 7 million. To facilitate observation of the generated revolving annular fluid film, a boundary layer mesh with a thickness of 10 and a growth rate of 0.05 was applied to the pipe wall downstream of the swirler.
The simulations were carried out on five different grid sizes, with outlet 1 and outlet 2 water vapor mass flow rates (qmv1, qmv2) used as references. The inlet pressure was set at 18 MPa, the inlet quality of the two-phase mixture was X0 = 0.4, and the outlet pressure of each branch was 0 MPa. The results for the five grids, named Mesh1 to Mesh5, are presented in Table 2. It can be seen that there is a difference of no more than 0.023% in the vapor quality of outlets 1 and 2 between Meshes 3 and 5. Increasing the number of meshes does not always improve the accuracy of the computation, but it increases the computational time and resource requirements. Therefore, Mesh3 was chosen for the simulation calculations in this study. Fig. 4 shows the mesh division of the distribution system.
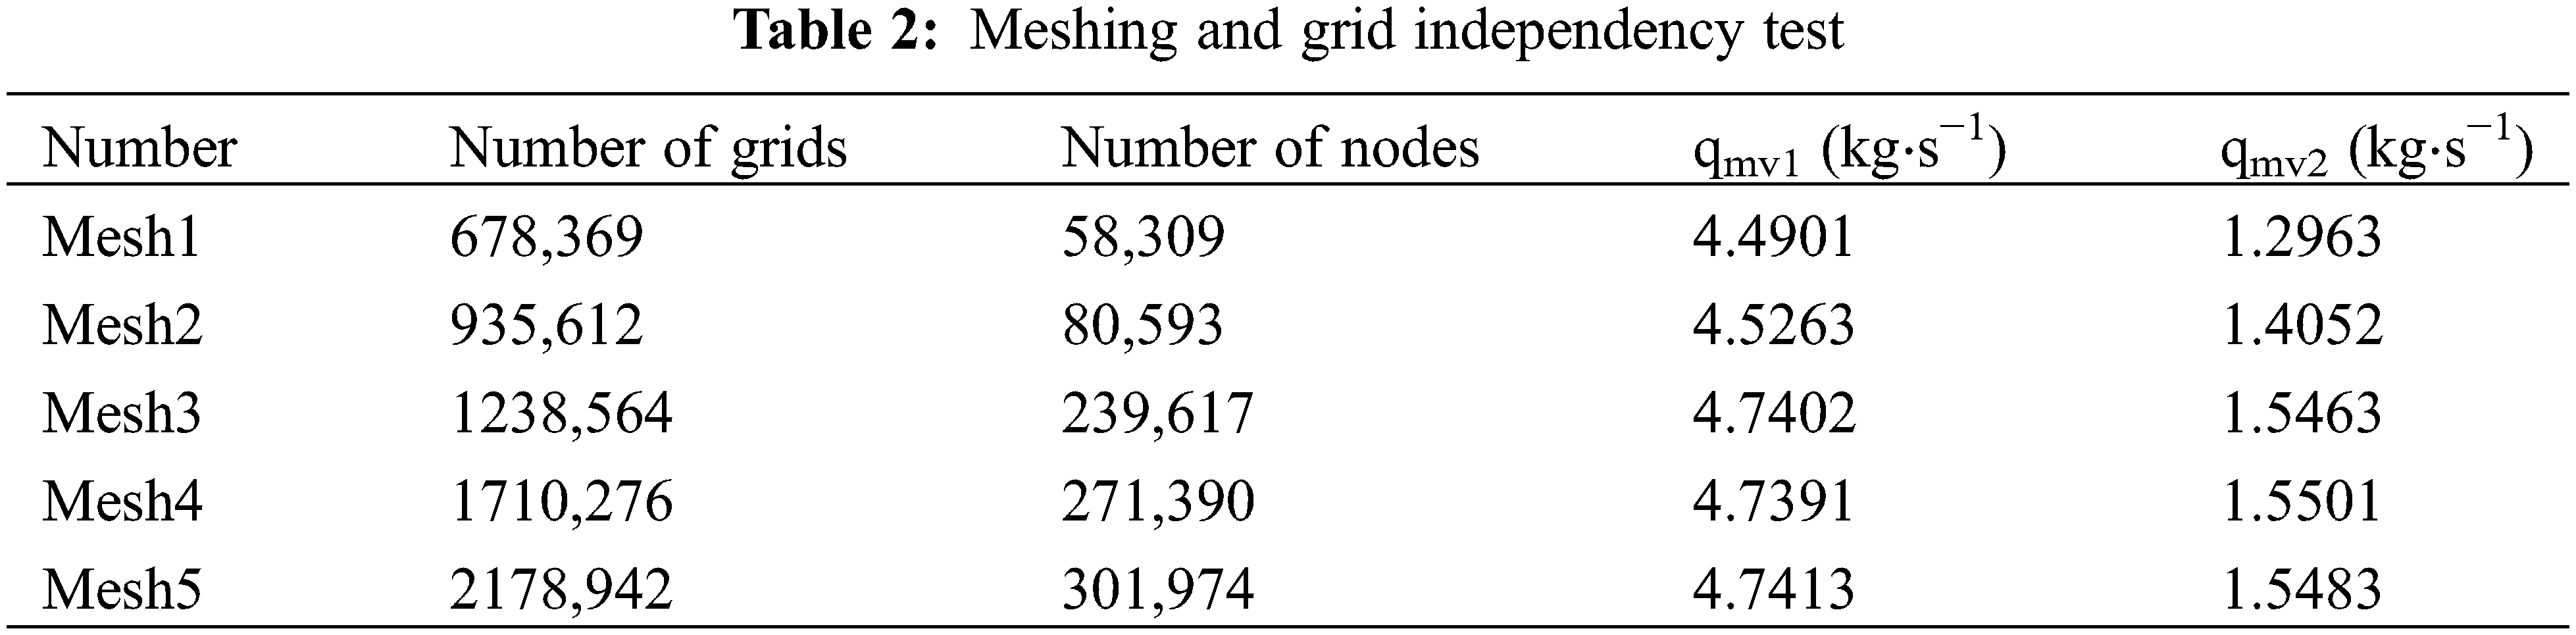
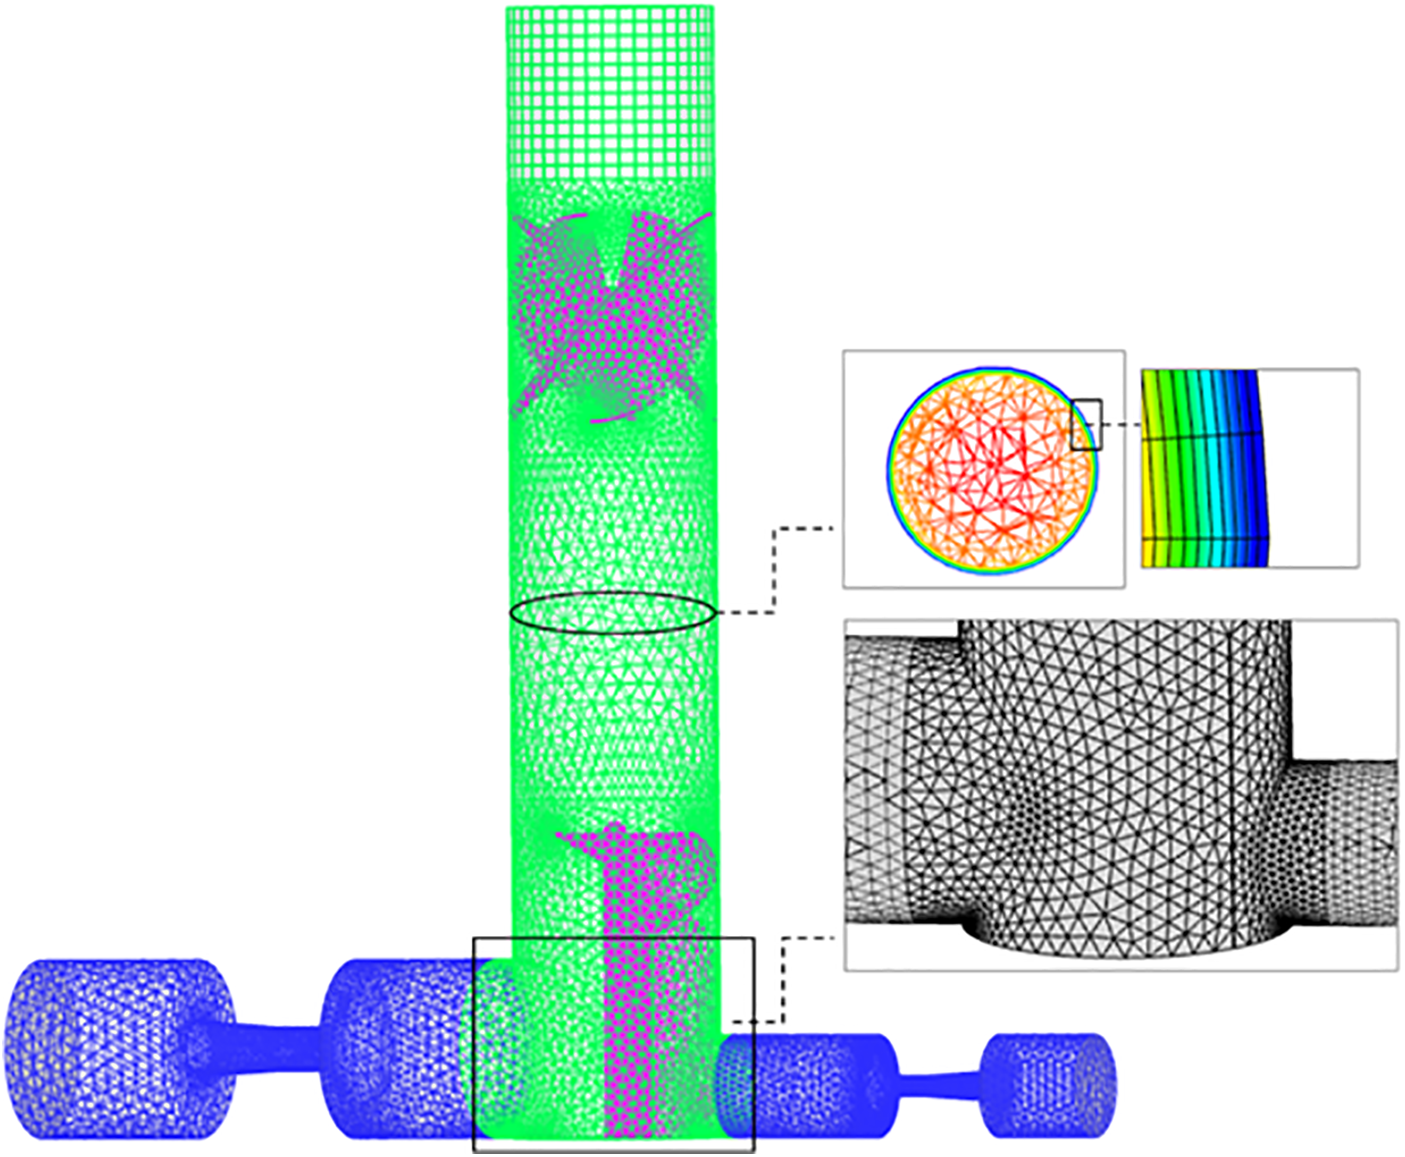
Figure 4: Schematic of the distribution system grid
4.1 Flow Pattern Distribution before the Spiral Divider
Figs. 5a and 5b illustrate representative CFD results of the gas-phase distribution contour on different cross-sections, located downstream of the swirler, with and without critical flow nozzles installed in the two branches. Cross-sections Y1, Y2, and Y3 are located 0.15D, D, and 2D downstream of the swirler, respectively (D = 60 mm being the pipe inner diameter). The gas superficial velocity is 27 m/s, the inlet quality of the two-phase mixture is X0 = 0.4, and the pressures downstream of the two branch outlets are P1 = 9 MPa and P2 = 3 MPa. Based on Fig. 5, it can be observed that the gas phase is centralized in the center of the main pipe, forming a gas core. The liquid phase is thrown to the wall to form a distinguishable liquid film due to the action of the swirler and the significant difference in the gas-liquid density. This indicates that the liquid film in the gas-liquid two-phase flow can maintain its original inertial flow under the symmetric structure, despite fluctuations in downstream pressure. The thickness of the liquid film always remains uniform, and there are no visible droplets are left in the air core. Notably, the presence of a critical flow nozzle has little effect on the formation of the liquid film. Furthermore, changes in downstream pressure hardly have any impact on the flow of the liquid film. As a result, this ensures that the liquid phase enters the spiral manifold channel in a specific ratio, parallel and unhindered.
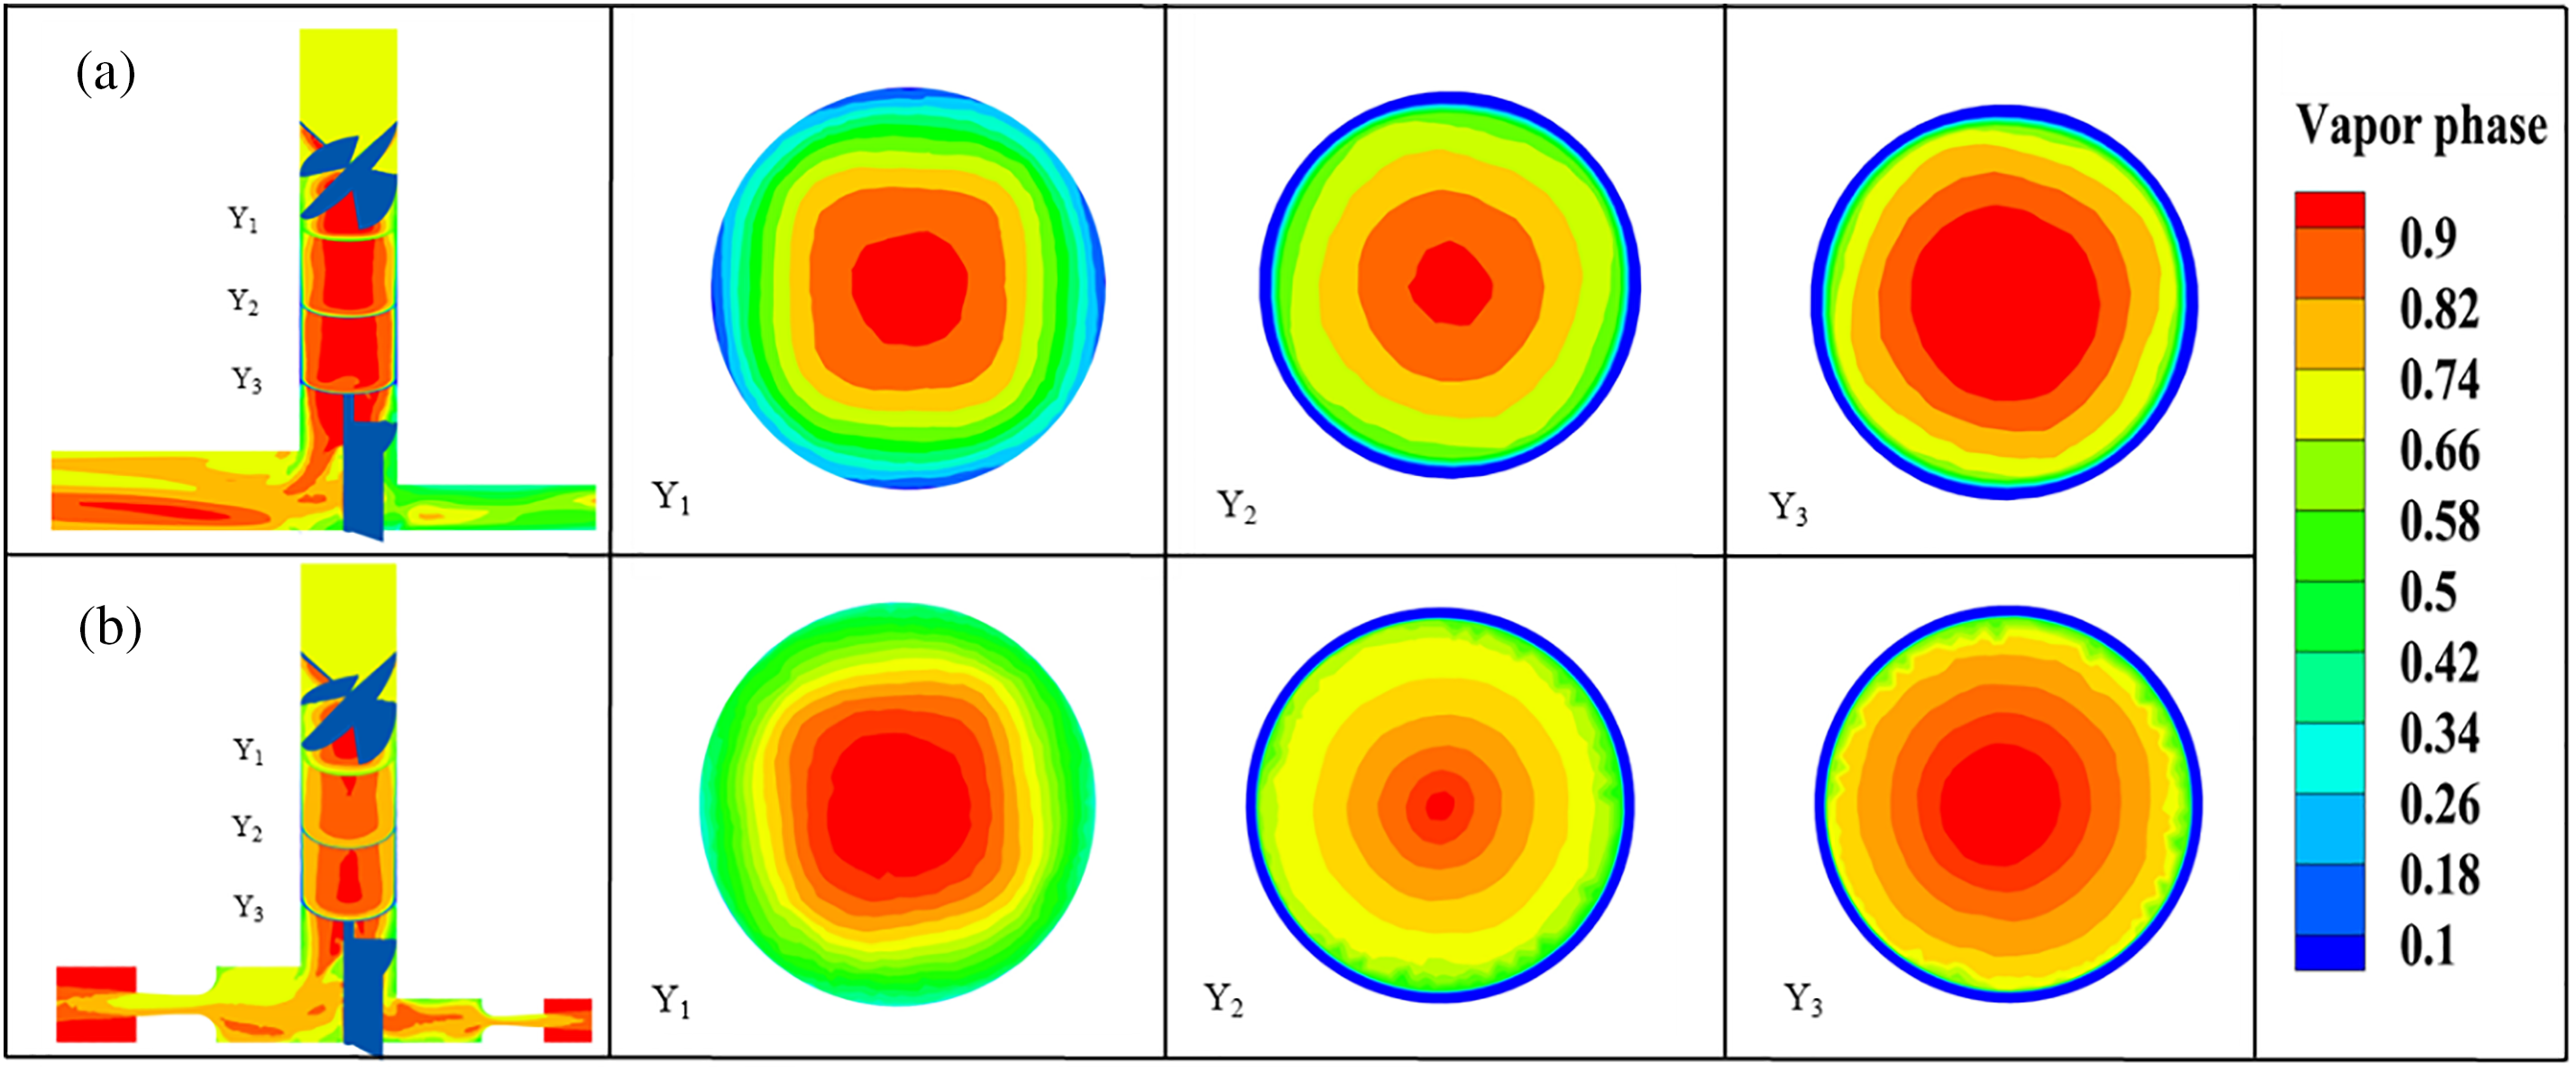
Figure 5: Gas axial vapor phase contour at different locations
4.2 Velocity and Pressure Field Characteristics before the Spiral Divider
Figs. 6 and 7 show the location of the central longitudinal section, both without and with a critical flow nozzle, and the velocity vector distribution of the gas phase before the spiral dividing baffles. The inlet pressure is set at 18 MPa, with P1 and P2 representing the downstream pressure at outlets 1 and 2. The difference in pressure between the two branch outlets is either 6, 0, and −6 MPa.
Figure 6: Velocity vector distribution of the gas phase before the baffles without critical flow nozzles
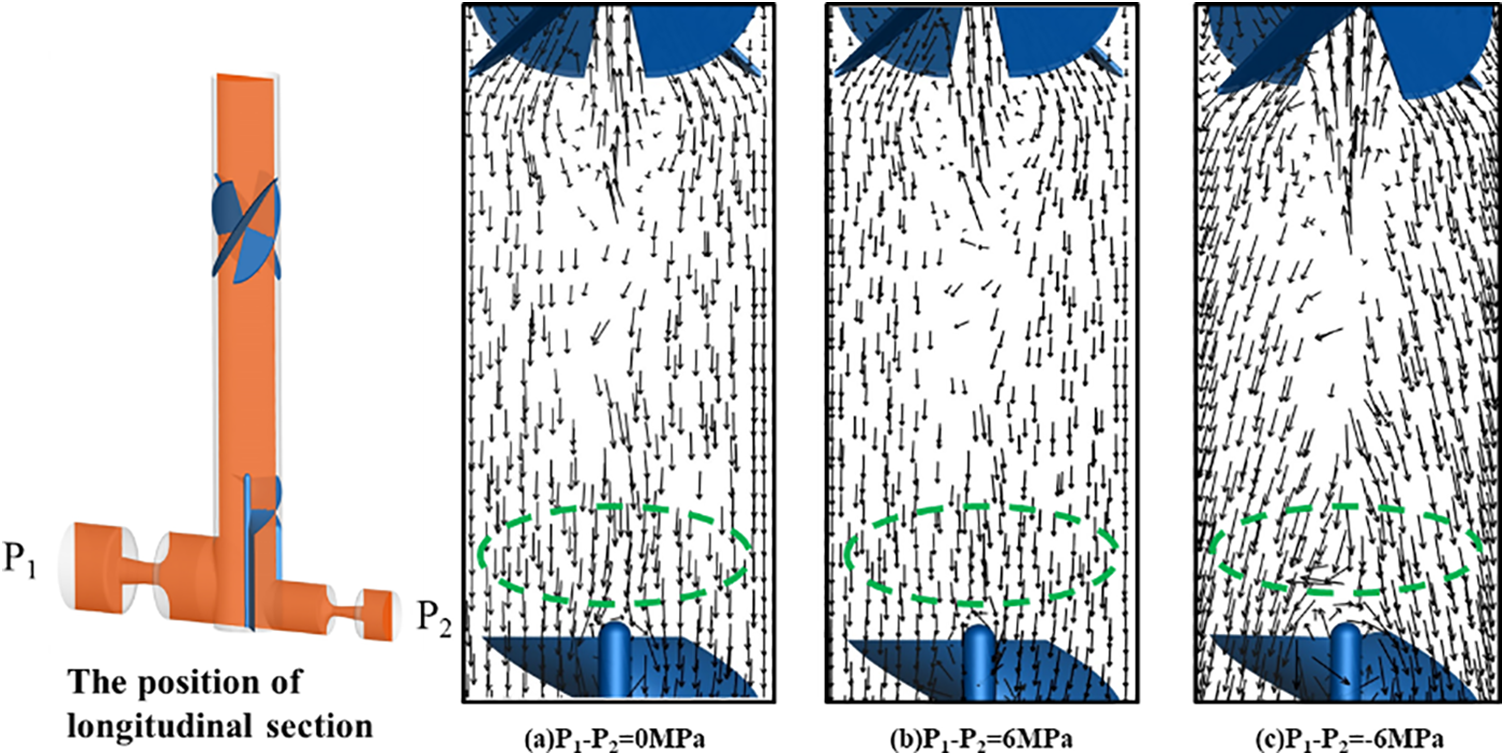
Figure 7: Velocity vector distribution of the gas phase before the baffles with critical flow nozzles
Based on the principle of isokinetic distribution, Fig. 6a indicates that the pressure difference at outlet between two branches is zero, i.e., P1–P2 = 0 MPa. This indicates that the central gas in the main pipe is symmetrically distributed along the axial direction. However, it should be noted that even with P1–P2 = 0 MPa, a small amount of gas backflow may still exist. Conversely, Figs. 6b and 6c show that when P1 is either higher or lower than P2, the gas in the central portion of the main pipe is significantly deflected before the spiral dividing baffles, and inclined more towards the downstream branch channel with a lower pressure. The variability in downstream resistance of the branch outlet can lead to instability in the gas flow field before entering the spiral-dividing baffles.
However, once a critical flow nozzle is established as shown in Figs. 7a–7c, the velocity vector of the gas in the center of the pipe remains unchanged in both direction and magnitude before entering the spiral-dividing baffles, while being symmetrically distributed along the axis. This guarantees that downstream pressure fluctuations in the main flow field are effectively controlled by the critical flow nozzle, thereby ensuring stability of the flow field. Additionally, the distribution of the gas-liquid two-phase flow changes from a non-isotropic state to an isotropic one, satisfying the condition for isokinetic distribution.
Figs. 8a and 8b display the radial gas velocity distribution of the Y2 section without and with a nozzle, respectively (e.g., “9–3 MPa” in the legend means P1 = 9 MPa and P2 = 3 MPa). Unlike traditional flow tubes, the velocity distribution of gas with or without a nozzle exhibits an “M” shape, with low velocities in the middle, high velocities near the wall, and the lowest velocities close to the wall (due to wall effects). Significant variations were observed in the gas velocity field without nozzles when downstream pressure variations were present in the branch. However, after the introduction of nozzles, a consistent “M”-shaped velocity field distribution was observed. Furthermore, the velocity near the wall can be sustained at around 65 m/s, indicating a stable flow of the formed liquid film.
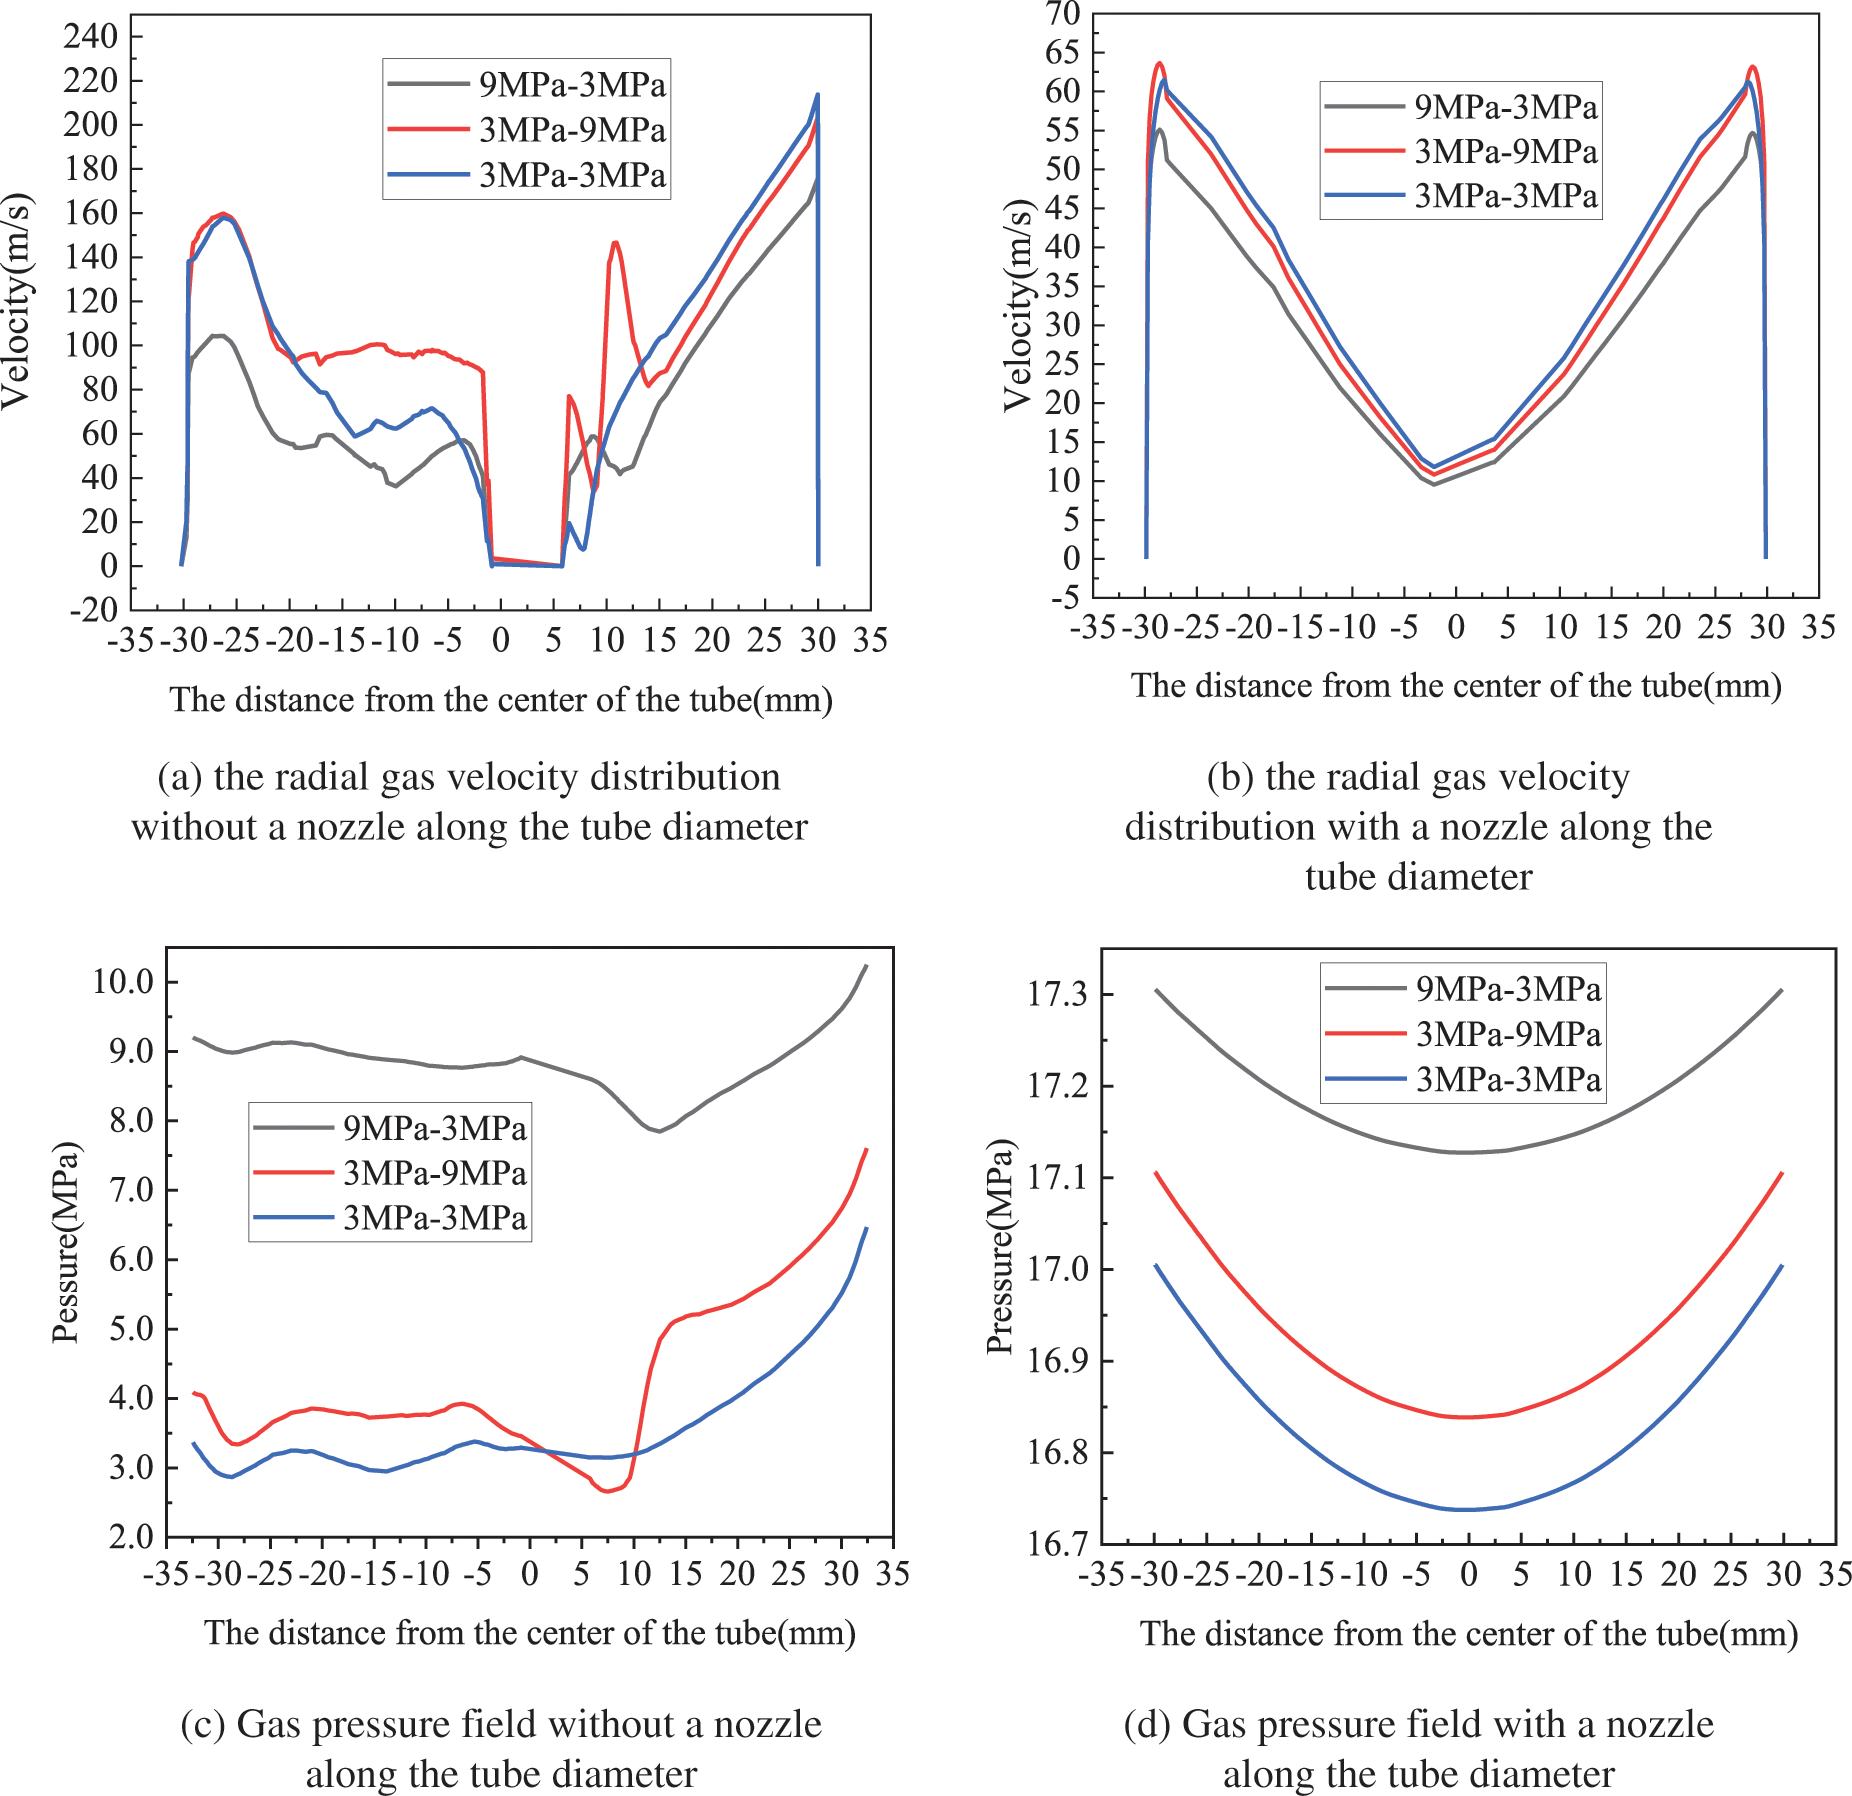
Figure 8: Profiles of (a, b) gas velocity and (c, d) pressure at Y2 section (Fig. 5) along the diameter
On the other hand, Figs. 8c and 8d depict the gas pressure distribution along the diameter of the Y2 cross-section with and without nozzles, respectively. The pressure distribution forms a “U” shape, which is different from the pressure characteristics of conventional pipelines. Specifically, low pressure exists in the center of the section while pressure near the wall increases progressively. However, the addition of nozzles leads to a more stable pressure distribution and insignificant changes in pressure under different working conditions. Overall, the critical flow nozzle overcomes the effect of downstream resistance variations caused by pressure fluctuations in the branch, which would otherwise affect upstream flow characteristics and quality distribution.
4.3 Analysis of the Quality Distribution of the Two Branches
Figs. 9 and 10 show the homogeneous distributions with and without critical flow nozzles under six conditions of pressure fluctuations downstream of the outlet, at a pressure of 18 MPa and a temperature of 630.14 K, while the inlet quality ranges from 0.4 to 0.8. The closer the outlet quality is to the diagonal, the closer it is to the inlet quality, indicating the effectiveness of the homogeneous distribution. Fig. 9 reflects that the qualities of outlets 1 and 2 deviate significantly from the diagonal, especially when there are inconsistent downstream pressure fluctuations. However, after introducing the critical flow Venturi nozzle, Fig. 10 displays that the quality of outlets 1 and 2 approximately match the diagonal and are close to the inlet quality. Therefore, the critical flow Venturi nozzle overcomes the effect of the inconsistent pressure downstream of the two branches’ outlets, resulting in a more uniform distribution of quality.
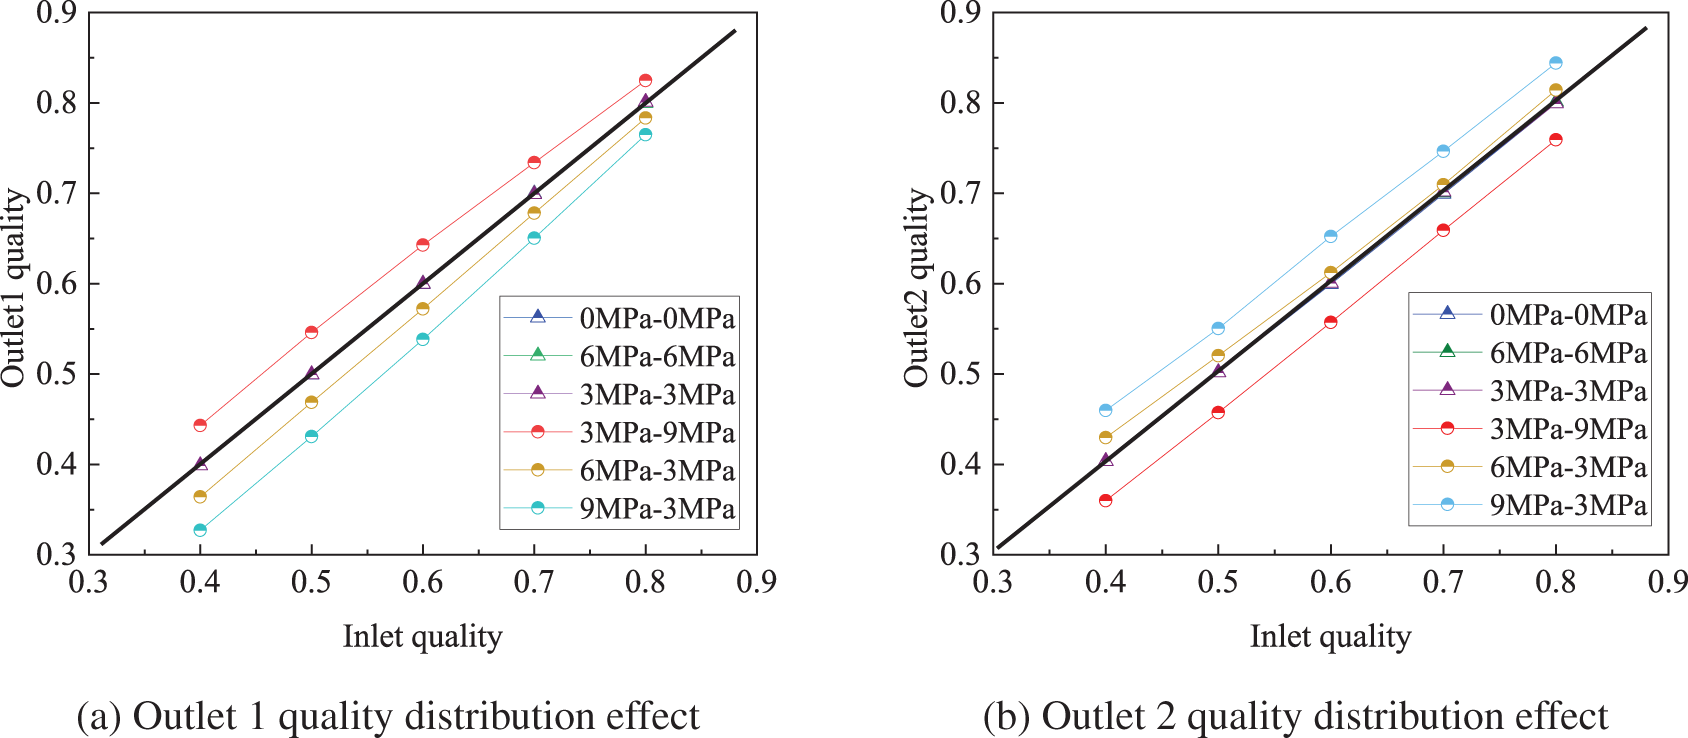
Figure 9: Quality distribution effect without a nozzle
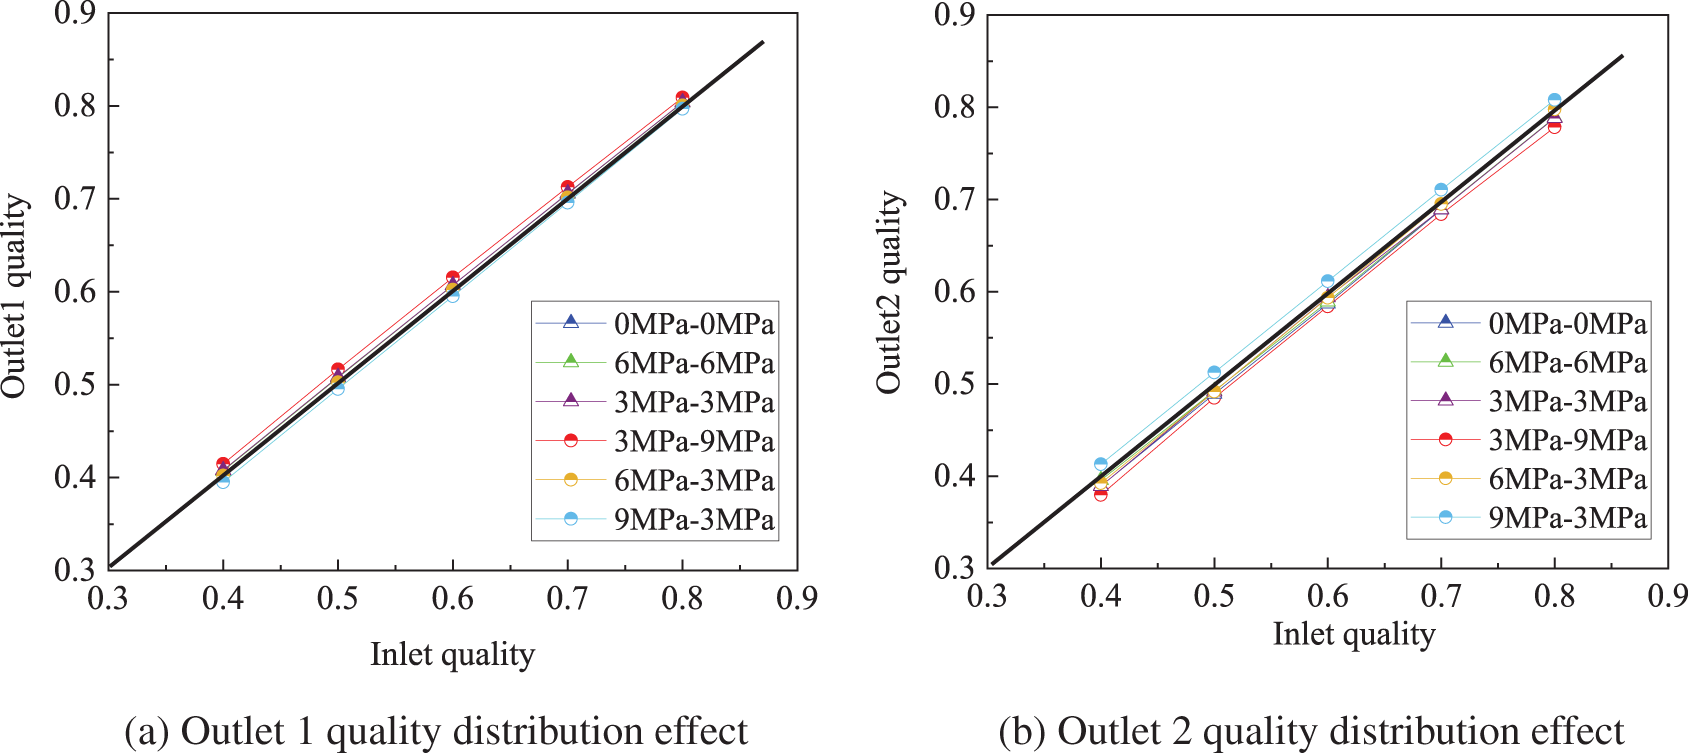
Figure 10: Quality distribution effect with a nozzle
4.4 Analysis of the Flow Distribution of the Two Branches
In order to quantitatively evaluate the flow distribution between the two branches, the distribution deviation of flow is defined as
where Q(X) is the flow distribution deviation, Q1 and Q2 are the flow rate of branch 1 and branch 3 respectively, and λ is the ratio of the distribution area of spiral divider channel 1 to channel 2.
Fig. 11 shows the distribution of the gas–liquid mixing mass flow (Q(X)) when the outlet pressures of the two branches are not equal. The flow ratio of the two branches should conform to a 3:1 distribution ratio, given that the distribution area ratio in the spiral dividing channel is 3:1. Flow distribution is influenced by inlet qualities and different outlet pressures. When the outlet pressures of the two branches are equal, the gas–liquid mixed mass flows from the two outlets consistent with a 3:1 distribution ratio. However, when the outlet pressures of the two branches are not equal, smaller the pressure difference between the two outlets result in smaller flow distribution deviations. Conversely, when the difference in outlet pressure between the two branches is large (P1 = 3 MPa, P2 = 9 MPa or P1 = 9 MPa, P2 = 3 MPa), the flow distribution deviation increases with increasing inlet quality. However, the maximum flow distribution deviation is only within ±8%. Due to the gradual accumulation of vapour as the inlet quality increases, liquid films and droplets are more easily carried away by the deflecting airflow.
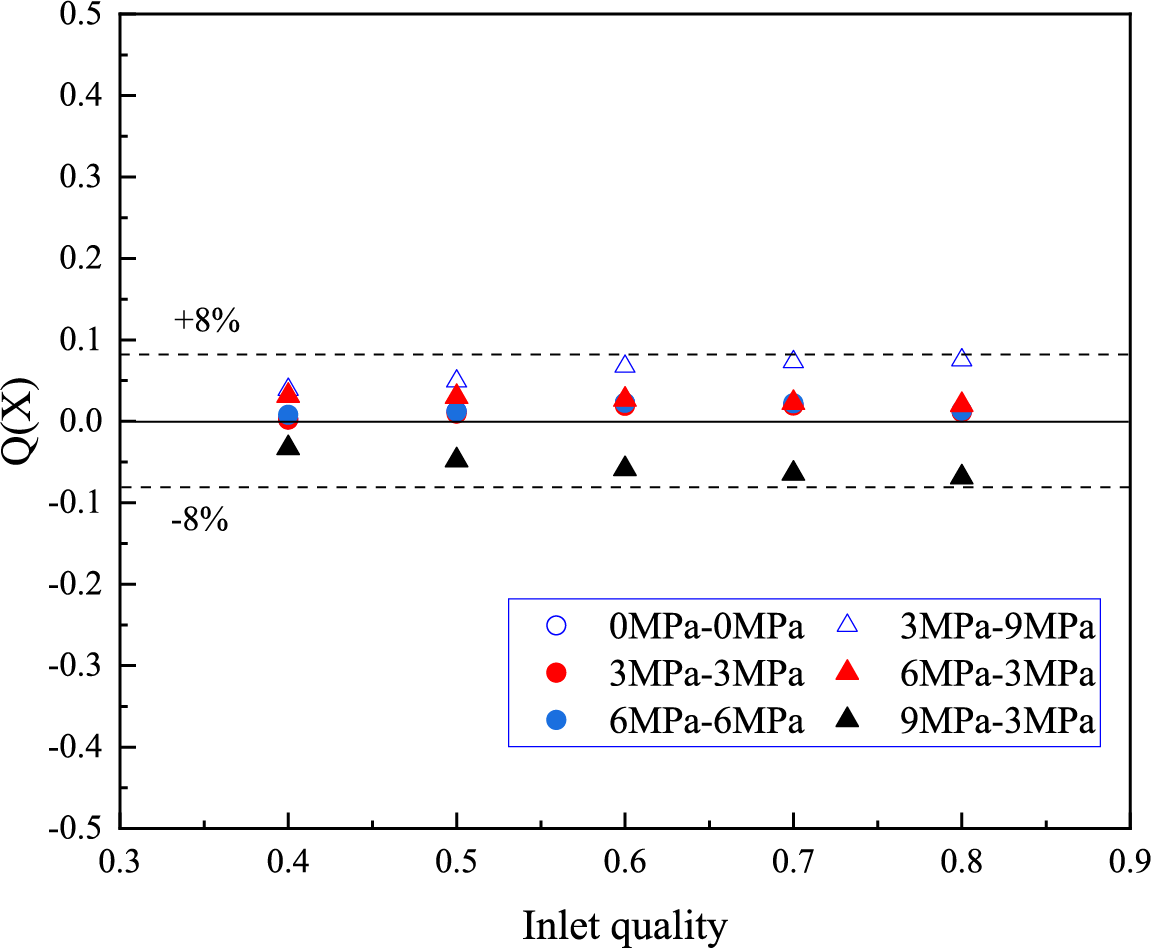
Figure 11: Gas–liquid mixing mass flow ratio for two branches at different outlet pressures
4.5 Effect of Inlet Pressure on Homogeneous Distribution
Fig. 12 displays the deviation (D(X)) of the quality of the two branches at various outlet pressures for inlet pressures of 12, 15, and 18 MPa. The deviation of the quality is calculated as D(X) = X1–X0 (where X1 is quality of outlet). As can be seen from the graphs, most of the quality deviations are less than 2% at different inlet pressures, with only a very rare percentage approaching 4%. These findings indicate the broad applicability of the homogeneous distribution method proposed in this study.
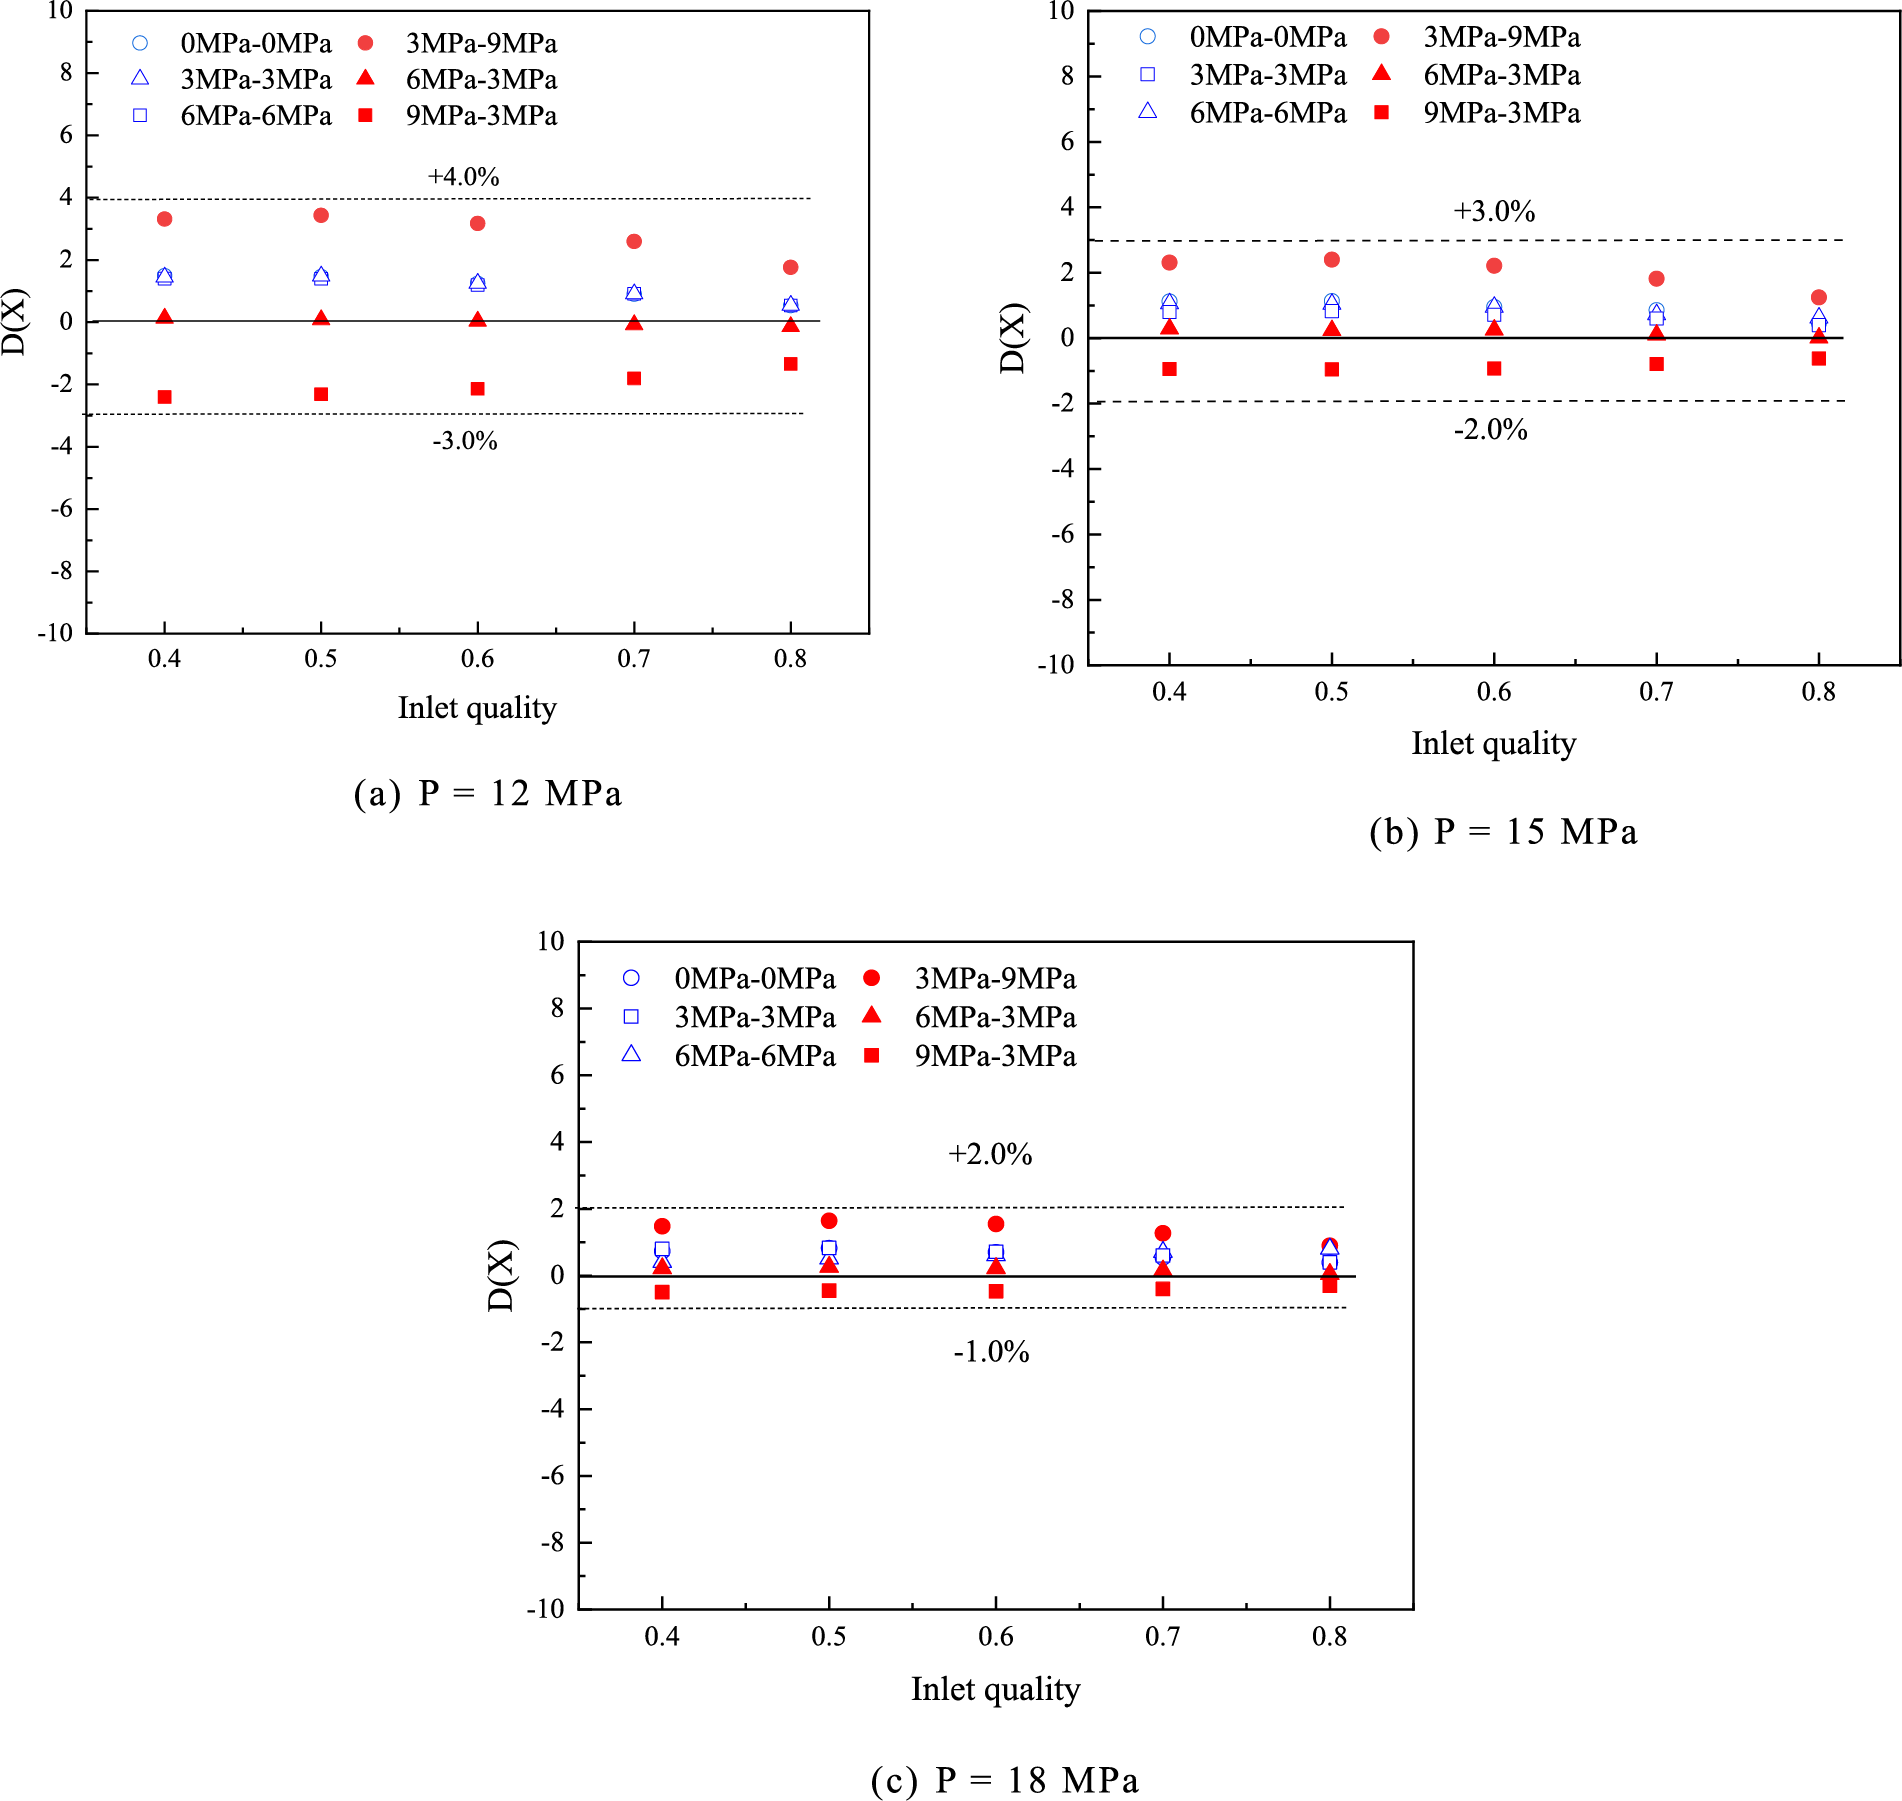
Figure 12: Deviation of the quality of the two branches under different inlet pressures
Additionally, Fig. 12 demonstrates that the homogeneous distribution effect is better with higher inlet pressures. This is due to the fact that an increase in pressure leads to an increase in steam density, resulting in greater inertia and resistance to external differential pressure disturbances. Furthermore, a smaller difference between the outlet pressures of the two branches results in a better homogeneous distribution effect.
5 Injection Steam Homogeneous Distribution Field Test
The steam distribution system is designed according to the principle of homogeneous distribution, as described above. Wet steam flowmeters are installed on each branch to measure both the flow rate and quality of wet steam. Fig. 13 presents the flow chart of the field test. The steam generated by the boiler passes through the flowmeter-dryness meter, then flows through the equal dryness distribution system, and subsequently passes through the flow-dryness meter downstream of the outlet. Finally, the steam is distributed evenly among the three wells. Additionally, Fig. 14 depicts a photograph of the steam injection well field test of the distribution system. A thermal insulation layer is wrapped around the outside of the distribution system to reduce heat loss of the steam.
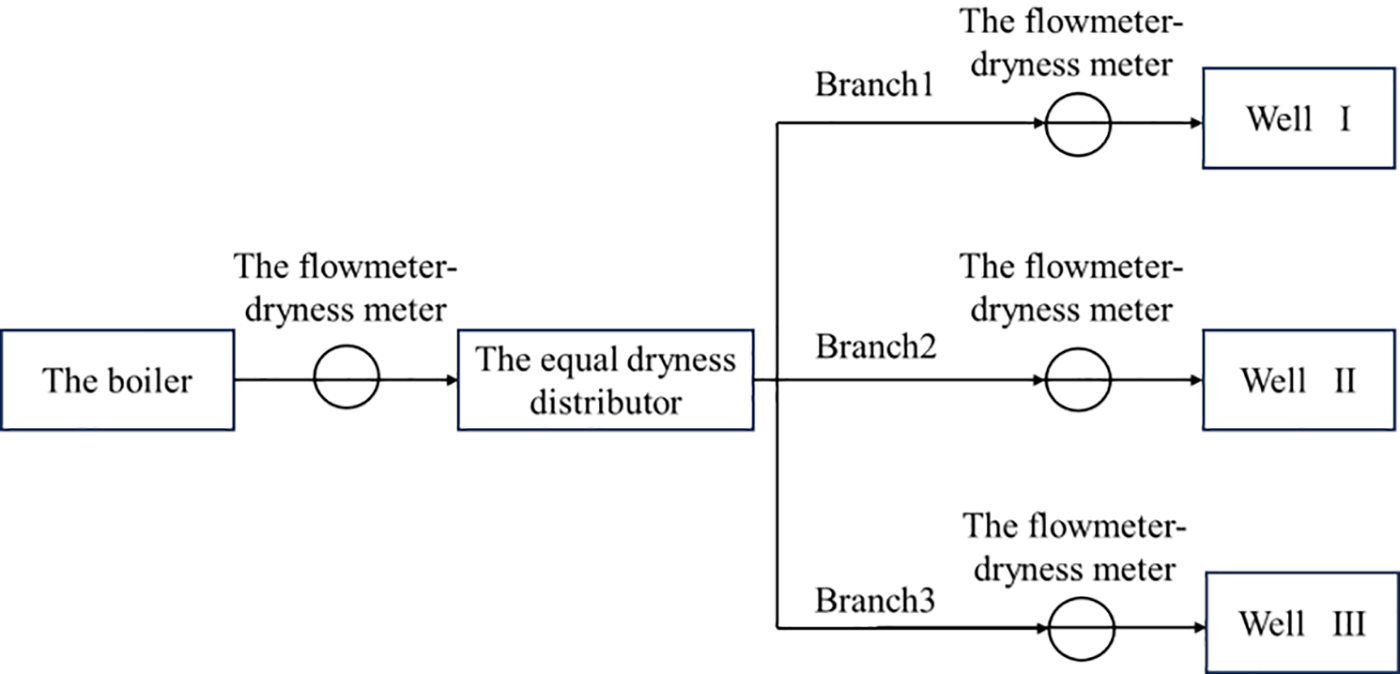
Figure 13: The flow chart of the field test
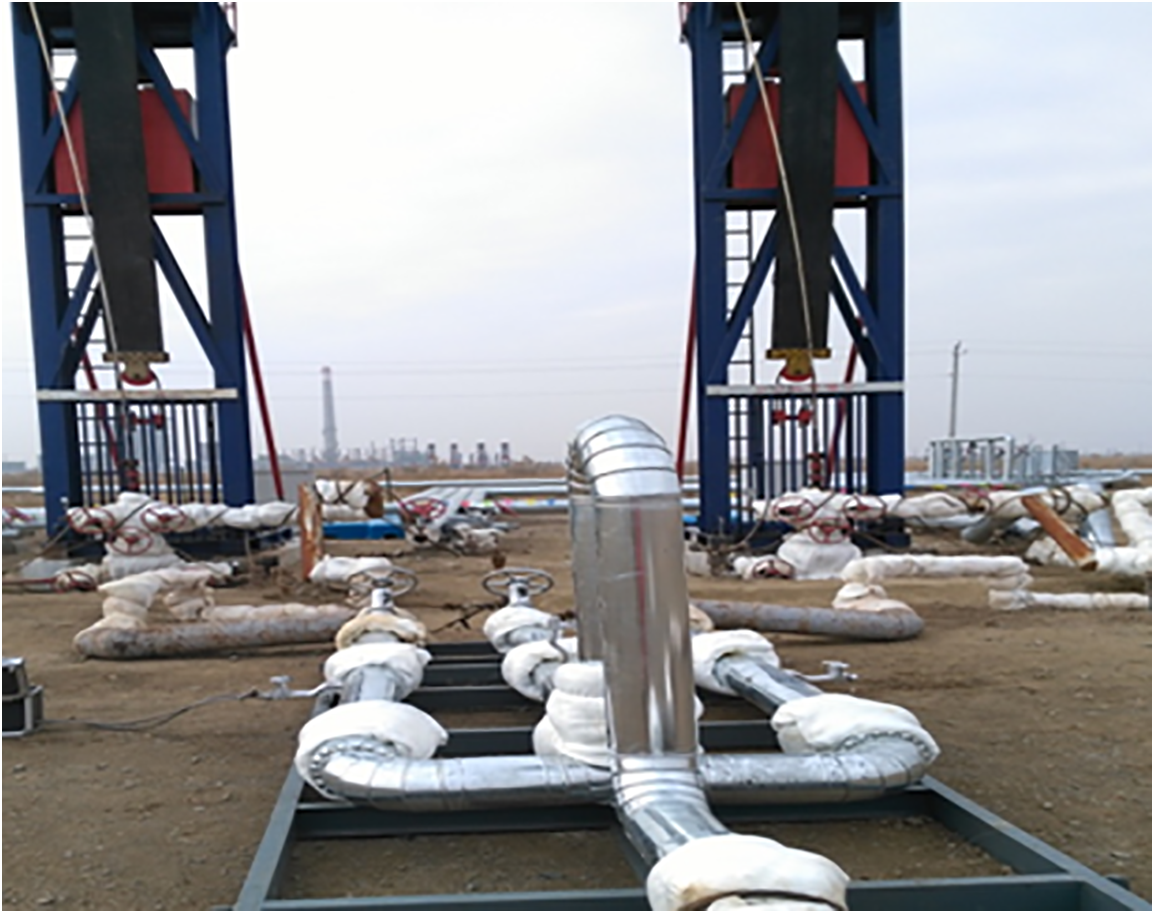
Figure 14: Photo of the field-tested distribution system
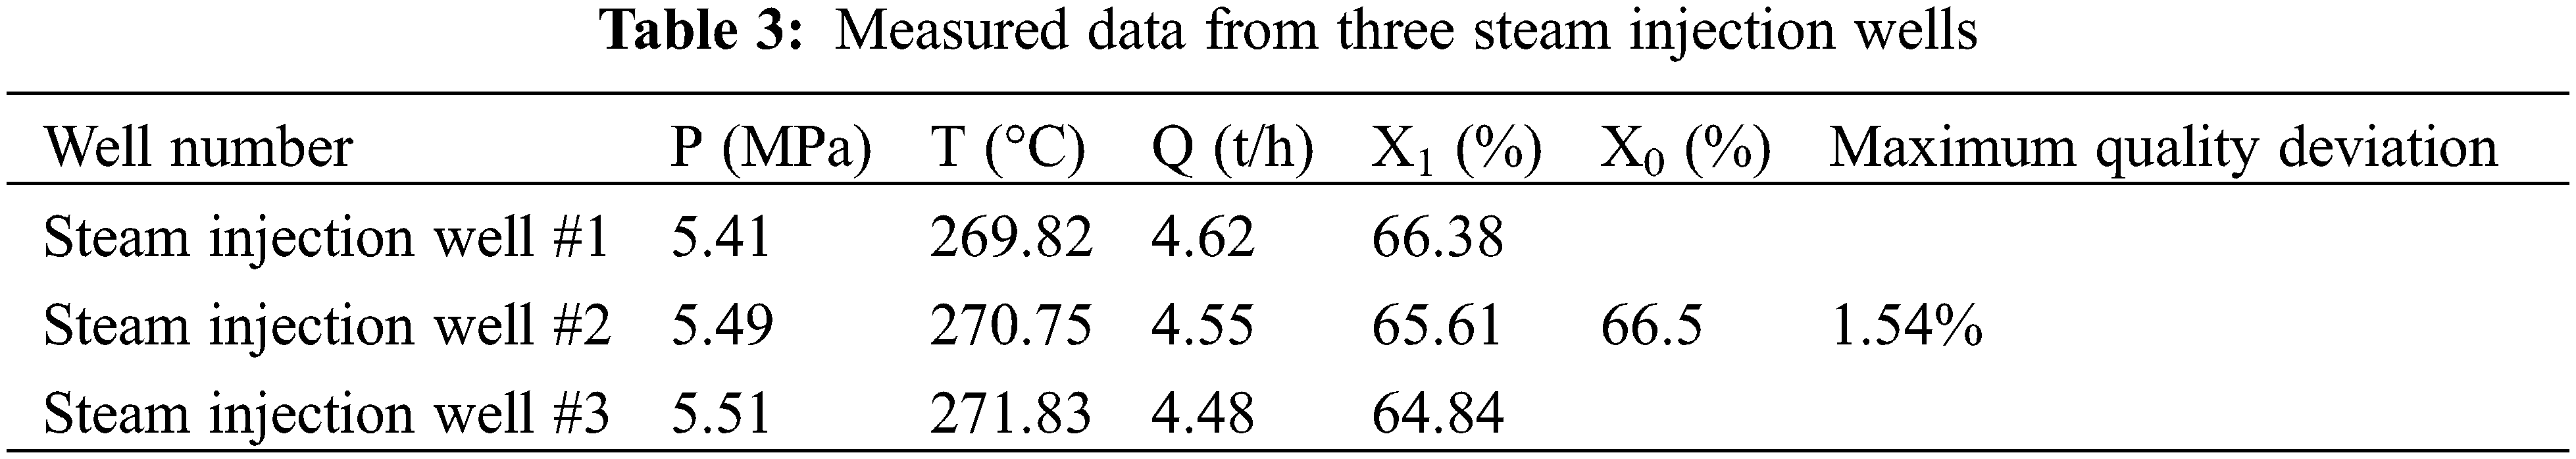
Continuous field testing was conducted over a four-day period, and the results demonstrated satisfactory application performance. The average test data for the three steam injection wells are shown in Table 3. Notably, the inlet quality, branch nozzle size, and outlet flow rate were all consistent, resulting in a maximum quality deviation of only 1.54% among the three wells. The results of the field experiments indicate that co-injection wells were successfully distributed equally in terms of quality, achieving uniform steam injection and verifying the feasibility and effectiveness of the isokinetic homogeneous distribution device.
The primary goal of the current study was to determine whether the wet steam in a boiler is distributed to different branches based on a predetermined proportion of the distribution flow and principle of equal quality. To achieve this, swirlers, spiral dividing baffles, and critical flow nozzles were implemented. Based on the isokinetic homogeneous distribution principle, the CFD investigation revealed that the maximum deviation in the quality distribution was less than 4.0%. The research also demonstrated that critical flow nozzles in each branch eliminated the impact of inconsistent resistance downstream on the internal flow field, liquid film, and gas, thereby maintaining their original velocity and direction and ensuring that the flow in each branch meets the distribution ratio.
The second major finding was that an increase in inlet quality leads to an increased risk of droplet carryover by the airflow, resulting in greater deviations in flow distribution. However, reducing the difference in pressure between the two branch outlets decreases in deviation in homogeneous distribution. Higher inlet pressure provides more stability to airflow and improves homogeneous distribution. In field experiments on isokinetic quality distribution for steam injection, excellent dispensing results were achieved, with an average quality deviation of ≤1.54% within the range of 50% to 90% of the actual quality measured on-site. These experiments demonstrated the safety and practicality of the isokinetic homogeneous distribution system. Further development and improvement are expected to expand its range of applications and enhance accuracy.
Acknowledgement: None.
Funding Statement: The authors would like to acknowledge the support provided by Supported By Open Fund of Hubei Key Laboratory of Oil and Gas Drilling and Production Engineering (Yangtze University), YQZC202309.
Author Contributions: The authors confirm contribution to the paper as follows: study conception and design: Jingjing Gao, Xingkai Zhang; data collection: Jingjing Gao; analysis and interpretation of results: Jingjing Gao, Xingkai Zhang; draft manuscript preparation: Jingjing Gao, Xingkai Zhang. All authors reviewed the results and approved the final version of the manuscript.
Availability of Data and Materials: We acknowledge the importance of data accessibility in scientific research and strive to promote transparency and reproducibility. In this study, Some of the data was obtained through Fluent simulations and is presented in the form of data graphs in the article. However, we must note that there may be certain instances where data cannot be released due to legitimate reasons. These reasons may include legal or ethical restrictions, privacy concerns, intellectual property rights, or agreements with third parties. We assure you that any unavailability of data is not intended to hinder scientific progress but rather ensures compliance with applicable regulations and protects the rights and privacy of individuals or entities involved. We thank our readers for their understanding and support in promoting open science while respecting the limitations and constraints associated with data accessibility. Should there be any concerns or inquiries regarding data availability, please feel free to contact us directly.
Conflicts of Interest: The authors declare that they have no conflicts of interest to report regarding the present study.
References
1. Mahmoud, M., Alade, O. S., Hamdy, M., Patil, S., Mokheimer, E. M. (2019). In situ steam and nitrogen gas generation by thermochemical fluid injection: A new approach for heavy oil recovery. Energy Conversion and Management, 202, 112203. [Google Scholar]
2. Gharibshahi, R., Jafari, A., Ahmadi, H. (2019). CFD investigation of enhanced extra-heavy oil recovery using metallic nanoparticles/steam injection in a micromodel with random pore distribution. Journal of Petroleum Science and Engineering, 174, 374–383. [Google Scholar]
3. Liang, F. C., Sun, S. T., Gao, J. F., Han, L. Y., Shang, G. B. (2018). Equal split of gas-liquid two-phase flow at variable extraction ratio. Chemical Engineering Research & Design, 136, 165–176. [Google Scholar]
4. Zhang, B., Zhang, X., Wang, D., Huang, S. (2013). Equal quality distribution of gas-liquid two-phase flow by partial separation method. International Journal of Multiphase Flow, 57, 66–77. [Google Scholar]
5. Zheng, N., Zhao, L., Wei, J. (2017). Experimental research on liquid-vapor two-phase flow separation of zeotropic mixtures at an impacting T-junction. Experimental Thermal and Fluid Science, 89, 140–152. [Google Scholar]
6. Rubel, M. T., Stoy, J. R. (1993). USA Patent US5251662A. USA, New York. [Google Scholar]
7. Wren, E., Azzopardi, B. (2004). Affecting the phase split at a large diameter T-junction by using baffles. Experimental Thermal and Fluid Science, 28(8), 835–841. [Google Scholar]
8. Tian, J., Wu, M., Wang, S., Zhang, B. D., Wang, D. (2014). Application of modified impacting tee to achieve equal quality distribution of gas-liquid two-phase flow. CIESC Journal, 65(3), 836–842. [Google Scholar]
9. Wei, P., Wang, D., Niu, P., Pang, C., Liu, M. (2019). A novel centrifugal gas liquid pipe separator for high velocity wet gas separation. International Journal of Multiphase Flow, 124(3), 103190. [Google Scholar]
10. Liang, F., Wang, D., Chen, J., Yang, G. (2014). Gas–liquid two-phase flow equal distribution using a wheel distributor. Experimental Thermal & Fluid Science, 55, 181–186. [Google Scholar]
11. Chen, J., Wang, S., Zhang, X., Ke, H., Li, X. (2015). Experimental investigation of two-phase slug flow splitting at a micro impacting T-junction. International Journal of Heat and Mass Transfer, 81, 939–948. [Google Scholar]
12. Wang, D., Liang, F. C., Peng, Z. Q., Wang, Y. G., Lin, Z. H. (2012). Gas–liquid two-phase flow measurements by full stream batch sampling. International Journal of Multiphase Flow, 40, 113–125. [Google Scholar]
13. Huang, S. F., Wang, D., Lin, Z. H. (2012). New method on gas-liquid two-phase distribution with equal phase fraction in different branches. Journal of Engineering Thermophysics, 33(10), 1727–1730. [Google Scholar]
14. Zhang, P. F., Xu, X. G., Hua, Y. J., Huang, Y. Q. (2022). Effects of the outlet pressure on two-phase slug flow distribution uniformity in a multi-branch microchannel. Journal of Zhejiang University Science A, 23(1), 68–82. [Google Scholar]
15. Chun, M. H., Park, C. K., Park, J. W. (1996). An experimental investigation of critical flow rates of subcooled water through short pipes with small diameters. International Communications in Heat and Mass Transfer, 23(8), 1053–1064. [Google Scholar]
16. Redus, C. L., Schoen, D. M., Chien, S. F., Hall, D. (1988). Kern river field test of a steam quality measurement technique. SPE Western Regional Meeting, SPE17445. California, USA. [Google Scholar]
17. Redus, C. L. (1991). USA Patent US5031466A. US, NewYork. [Google Scholar]
18. Liang, F., Wang, D., Yang, G., Cao, X. (2015). Gas-liquid two-phase flow critical distribution characteristic and phase splitting control. Journal of the Xi’an Jiaotong University, 49(1), 53–58. [Google Scholar]
19. Dolatabadi, A. M., Masoumi, S., Lakzian, E. (2021). Optimization variables of the injection of hot-steam into the non-equilibrium condensing flow using TOPSIS method. International Communications in Heat and Mass Transfer, 129, 105674. [Google Scholar]
20. Dolatabadi, A. M., Lakzian, E., Heydari, M., Khan, A. (2022). A modified model of the suction technique of wetness reducing in wet steam flow considering power-saving. Energy, 238, 121685. [Google Scholar]
21. Aabid, A., Khan, S. A. (2021). Investigation of high-speed flow control from CD nozzle using design of experiments and CFD methods. Arabian Journal for Science and Engineering, 46(3), 2201–2230. [Google Scholar]
22. Alkhalifah, T., Aabid, A., Khan, S. A., Azami, M. H. B., Baig, M. (2021). Response surface analysis of nozzle parameters at supersonic flow through microjets. Australian Journal of Mechanical Engineering, 13(2), 13. [Google Scholar]
23. Zhang, X., Wang, D., Liao, R., Zhao, H., Shi, B. (2019). Study of mechanical choked venturi nozzles used for liquid flow controlling. Flow Measurement and Instrumentation, 65, 158–165. [Google Scholar]
24. Li, C., Cao, P., Zhang, H., Cui, L. (2018). Throat diameter influence on the flow characteristics of a critical venturi sonic nozzle. Flow Measurement and Instrumentation, 60, 105–109. [Google Scholar]
25. Yoon, W., Yoon, H., Ahn, J., Ahn, K. (2021). Flow measurement and instrumentation flow control characteristics of throttling venturi valve with adjustable area. Flow Measurement and Instrumentation, 81, 102034. [Google Scholar]
26. Liu, M., Niu, P., Zhang, X., Zheng, W., Wang, Z. et al. (2022). Equal quality distribution of two-phase fluid by isokinetic principle. SPE Production & Operations, 37(3), 475–492. [Google Scholar]
27. ISO (2005). Measurement of gas flow by means of critical flow venturi nozzles ISO/CD. [Google Scholar]
28. Amini, A., Owen, I. (1995). The use of critical flow venturi nozzles with saturated wet steam. Flow Measurement & Instrumentation, 6(1), 41–47. [Google Scholar]
29. Ishii, M., Hibiki, T. (2011). Thermo-fluid dynamics of two-phase flow, pp. 155–216. Springer Science & Business Media. [Google Scholar]
30. Yakhot, A., Orszag, S. A., Yakhot, V., Israeli, M. (1989). Renormalization group formulation of large-eddy simulations. Journal of Scientific Computing, 4(2), 139–158. [Google Scholar]
31. Najafi, A. F., Saidi, M. H., Sadeghipour, M. S., Souhar, M. (2005). Numerical analysis of turbulent swirling decay pipe flow. International Communications in Heat and Mass Transfer, 32(5), 627–638. [Google Scholar]
32. Lakzian, E., Soltanmohamadi, R., Nazeryan, M. (2016). A comparison between entropy generation analysis and first law e ciency in a monoplane wells turbine. Scientia Iranica, 23(6), 2673–2681. [Google Scholar]
33. Zuraidi, N. H. M., Khan, S. A., Aabid, A., Baig, M., Shaiq, I. M. (2023). Passive control of base pressure in a converging-diverging nozzle with area ratio 2.56 at Mach 1.8. Fluid Dynamics & Materials Processing, 19(3), 807–829. https://doi.org/10.32604/fdmp.2023.023246 [Google Scholar] [CrossRef]
34. Song, J., Kharoua, N., Khezzar, L., Alshehhi, M. (2021). Numerical simulation of turbulent swirling pipe flow with an internal conical bluff body. Fluid Dynamics & Materials Processing, 17(2), 455–470. https://doi.org/10.32604/fdmp.2021.014370 [Google Scholar] [CrossRef]
Cite This Article
 Copyright © 2024 The Author(s). Published by Tech Science Press.
This work is licensed under a Creative Commons Attribution 4.0 International License , which permits unrestricted use, distribution, and reproduction in any medium, provided the original work is properly cited.
 Downloads
 Citation Tools