
 Submit a Paper
 Propose a Special lssue
 Open Access
ARTICLE

Numerical Simulation of Asphaltene Precipitation and Deposition during Natural Gas and CO2 Injection
Nanhai East Petroleum Research Institute, Shenzhen Branch of CNOOC Ltd., Shenzhen, 518000, China
* Corresponding Author: Shasha Feng. Email:
Fluid Dynamics & Materials Processing 2024, 20(2), 275-292. https://doi.org/10.32604/fdmp.2023.041825
Received 08 May 2023; Accepted 22 September 2023; Issue published 14 December 2023
 View Full Text
 Download PDF
Abstract
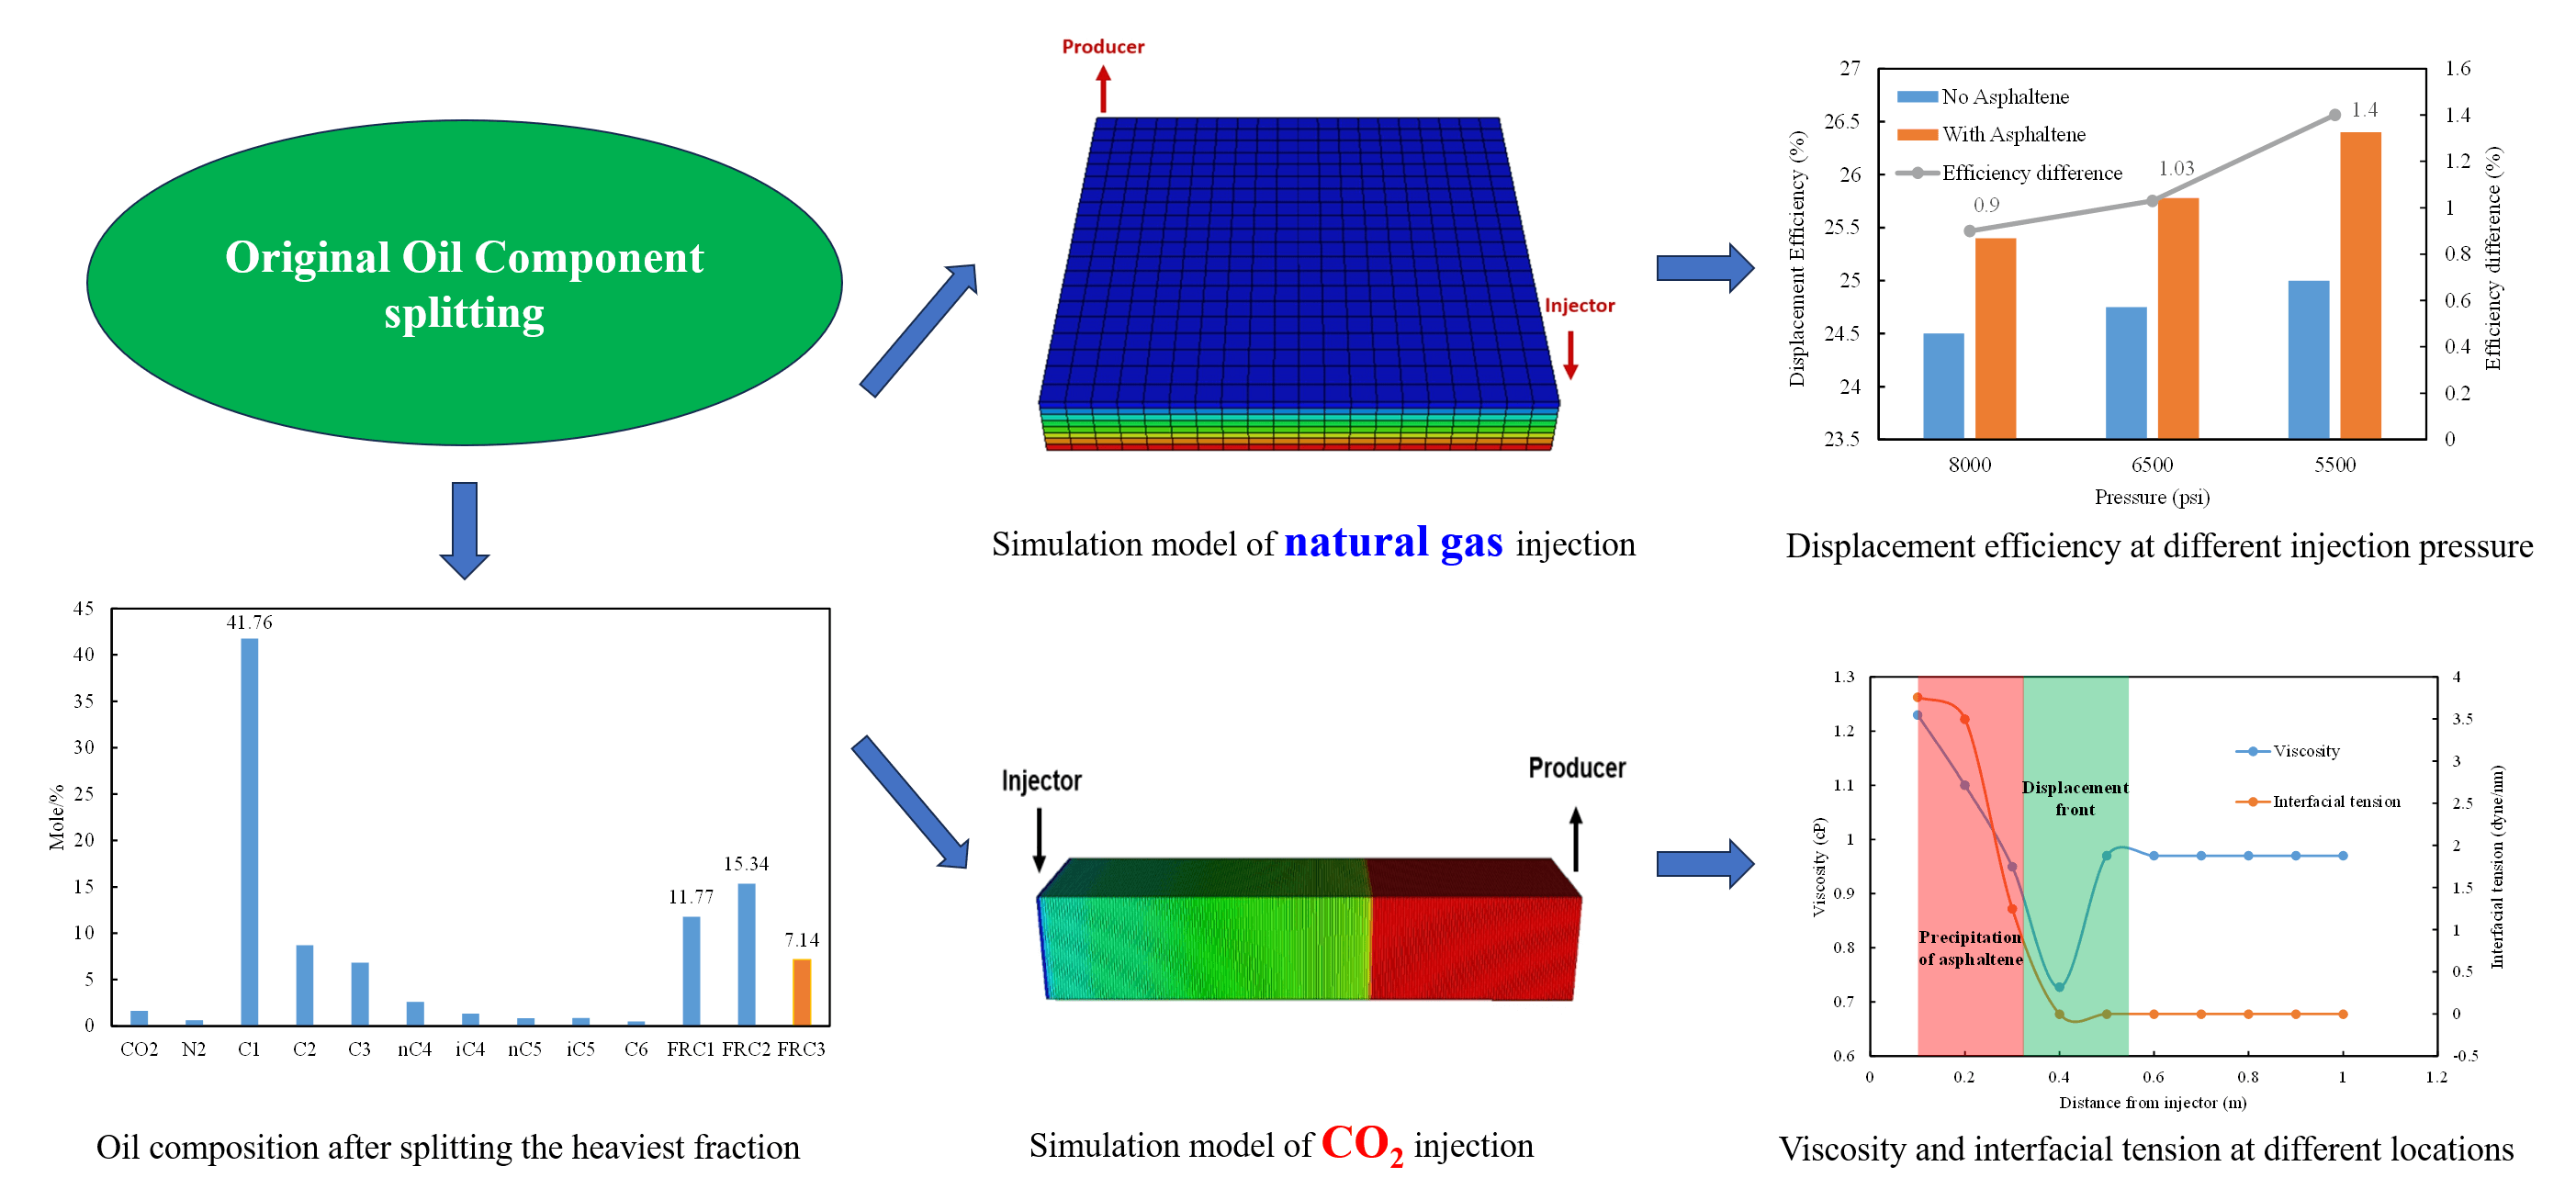
Asphaltene deposition is a significant problem during gas injection processes, as it can block the porous medium, the wellbore, and the involved facilities, significantly impacting reservoir productivity and ultimate oil recovery. Only a few studies have investigated the numerical modeling of this potential effect in porous media. This study focuses on asphaltene deposition due to natural gas and CO2 injection. Predictions of the effect of gas injection on asphaltene deposition behavior have been made using a 3D numerical simulation model. The results indicate that the injection of natural gas exacerbates asphaltene deposition, leading to a significant reduction in permeability near the injection well and throughout the reservoir. This reduction in permeability strongly affects the ability of gas to flow through the reservoir, resulting in an improvement of the displacement front. The displacement efficiency of the injection gas process increases by up to 1.40% when gas is injected at 5500 psi, compared to the scenario where the asphaltene model is not considered. CO2 injection leads to a miscible process with crude oil, extracting light and intermediate components, which intensifies asphaltene precipitation and increases the viscosity of the remaining crude oil, ultimately reducing the recovery rate.Graphic Abstract
Keywords
Nomenclature
| BC | BoChang |
| BHP | Bottom hole pressure |
| EOR | Enhanced oil recovery |
| EOS | Equation of state |
| FRC1/2/3 | Pseudo-components subdivided from the heaviest pseudo-component (C7+) of oil BC |
| MMSCF | Million standard cubic feet per day |
| MW | Molecular weight |
| PV | Pore volume |
| PVT | Pressure-Volume-Temperature |
| API | American Petroleum Institute |
The deposition of asphaltenes is a phenomenon that can occur during every phase of oil production, transportation and processing [1–3]. This phenomenon can lead to blockages in a porous media resulting in irreversible damage to producing formations and plugging of wells, production tubing, and surface facilities [4–6]. During the refining process, blockages in distillation columns may occur, leading to loss of efficiency in heat exchangers, reduction in tank capacity and deactivation of catalyst agents. All these issues result in significant maintenance costs due to the need for chemical and mechanical treatments, which can threaten the profitability of the entire process of oil reserve recovery [7–9].
During primary oil recovery, the oil naturally flows from reservoirs to the wellbore due to the pressure difference [10–12]. However, once the reservoir’s natural energy is depleted, there is still an economically exploitable amount of oil, enhanced oil recovery (EOR) methods are usually applied to increase the recovery of the reservoir [13,14]. Gas flooding is an efficient EOR method, in which CO2 and natural gas injection are the most widely applied techniques [15,16]. However, despite the increased recovery initially offered by those methods, some experimental studies have shown that these methods can result in asphaltene precipitation and deposition due to changes in the initial reservoir fluid composition [17,18].
Many studies have reported on the impact of injected gas on asphaltene deposition [19–21]. For example, Hajizadeh et al. [22] worked on asphaltene precipitation modeling by using a three-phase equilibrium calculation model [23]. A natural depletion scenario was first constructed, then different scenarios were evaluated by injecting miscible gases (rich natural gas, lean natural gas, and N2) into four different crude oil samples to investigate the changes in thermodynamic behavior. Rich gas had a greater effect on precipitation than lean gas and N2 because of the addition of nC5 and nC6, while injecting N2 showed minor difference with lean gas. Khanifar et al. [24] modeled asphaltene precipitation and deposition during a water alternating gas (WAG) (CO2) application by using a full field numerical reservoir model. The main results showed that the asphaltene deposition effect decreased oil recovery by around 14% during natural depletion and 13% in the WAG application. The maximum permeability decreased by around 70% due to the asphaltene deposition in the porous media near producers. Zanganeh et al. [17] compared the effects of CO2, CH4, and N2 on the precipitation and deposition of asphaltene. Both CO2 and CH4 increased the amount of precipitated asphaltene, and the effect of CO2 was much higher than that of natural gas. Gandomkar et al. [25,26] studied the mechanism of nanoparticles used as direct asphaltene inhibitors during CO2 injection. However, research on the impact of precipitation and deposition on crude oil production and changes in crude oil composition during natural gas and CO2 injection is still unclear.
In this study, based on the composition of a crude oil, a fluid model considering asphaltene was constructed as described in Section 2. Then in Section 3, the validation of the fluid model was carried out through the reproduction of an experimental slim tube displacement test in a 1D numerical simulation model. Finally, the effect of injected gas on asphaltene deposition was investigated by a 3D numerical simulation, in which evaluations were carried out at different miscibility conditions, injecting gas at different pressure value.
The fluid sample utilized in this study was obtained from the BoChang (BC) area of a specific oilfield, with its initial composition presented in Table 1. Considering the contents of C1 and C7+, alongside the American Petroleum Institute (API) gravity, this crude oil can be categorized as black crude oil. The asphaltene component is determined based on the premise that the heaviest aromatic constituent may represent an asphaltene liquid phase in the Eclipse asphaltene model. A comprehensive analysis of the aromatic content for the sample BC is presented in Table 2. Consequently, the heaviest pseudo-component (C7+) of oil BC was subdivided into three pseudo-components. Subsequently, the molar fraction of the newly introduced heavier pseudo-component was established to correspond with the percentage linked to the aromatic fraction (20.87%) reported in the aromatic analysis. As depicted in Fig. 1, a total of 13 pseudo-components were derived, and following the partitioning, the mole fraction of the resulting heaviest pseudo-component (FRC3) amounts to 7.14% for sample BC, representing 20.87% of the original fraction (C7+). This third novel pseudo-component was deemed to signify the asphaltene constituent in the fluid model.
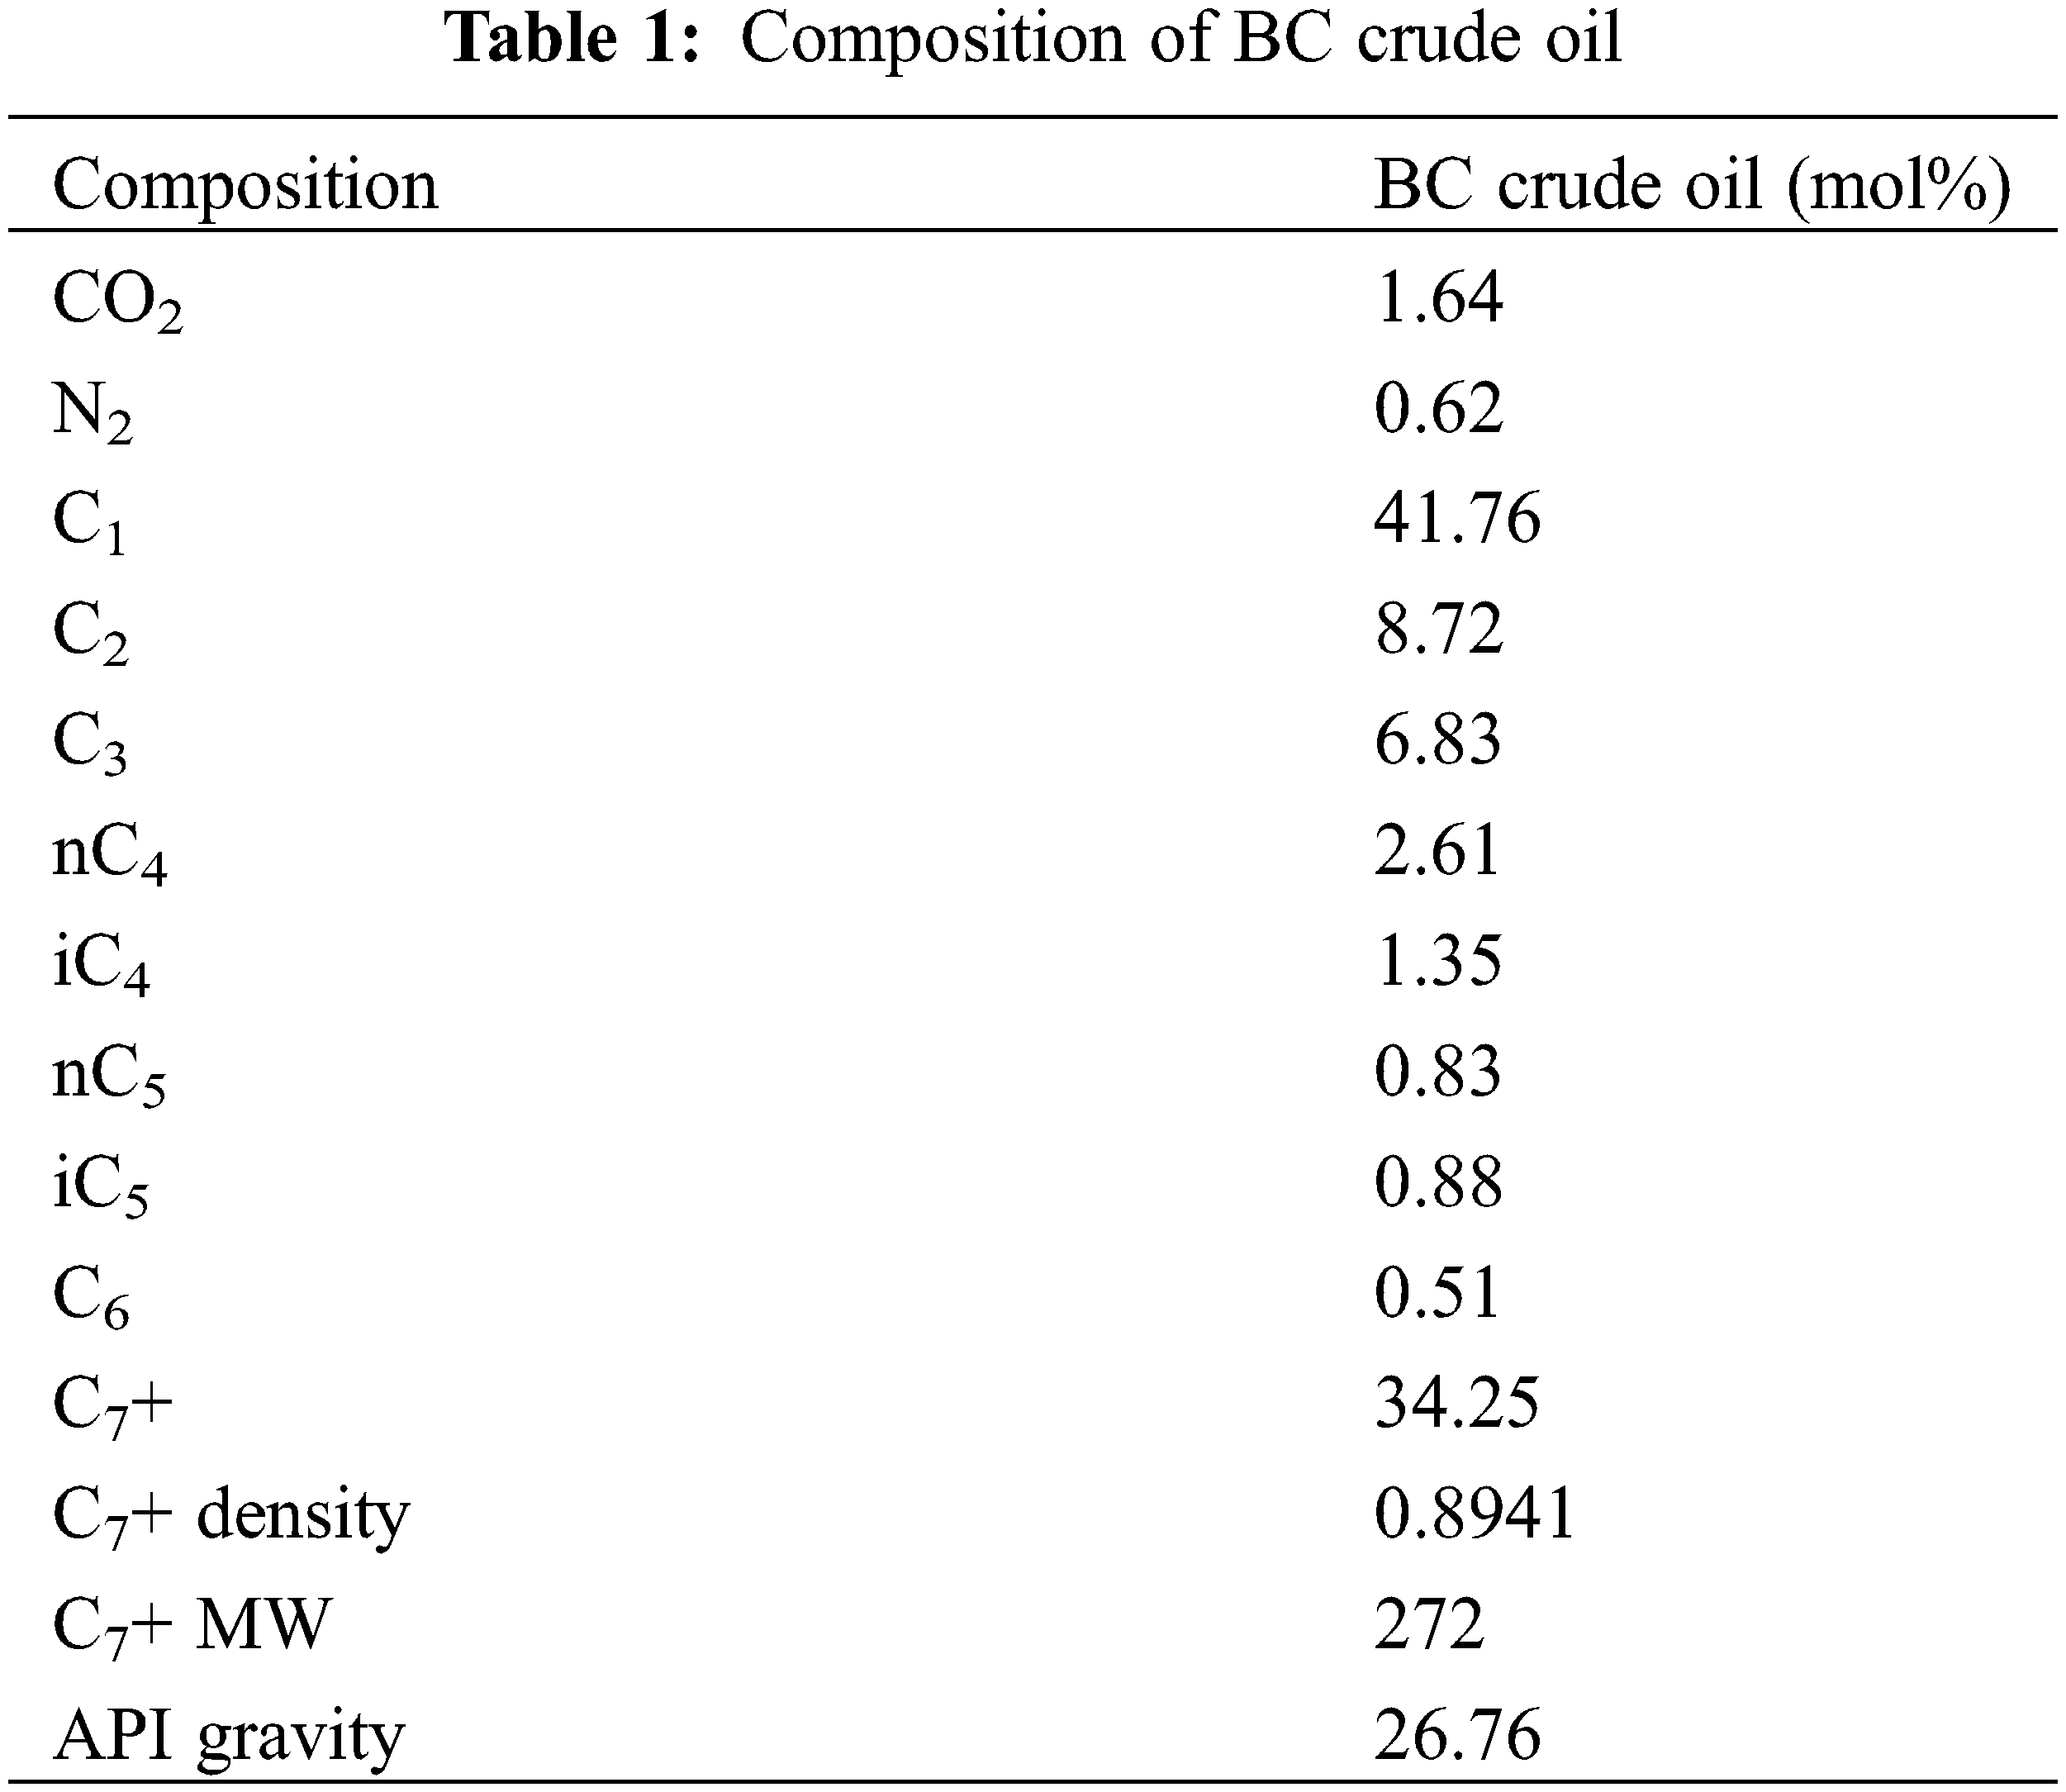
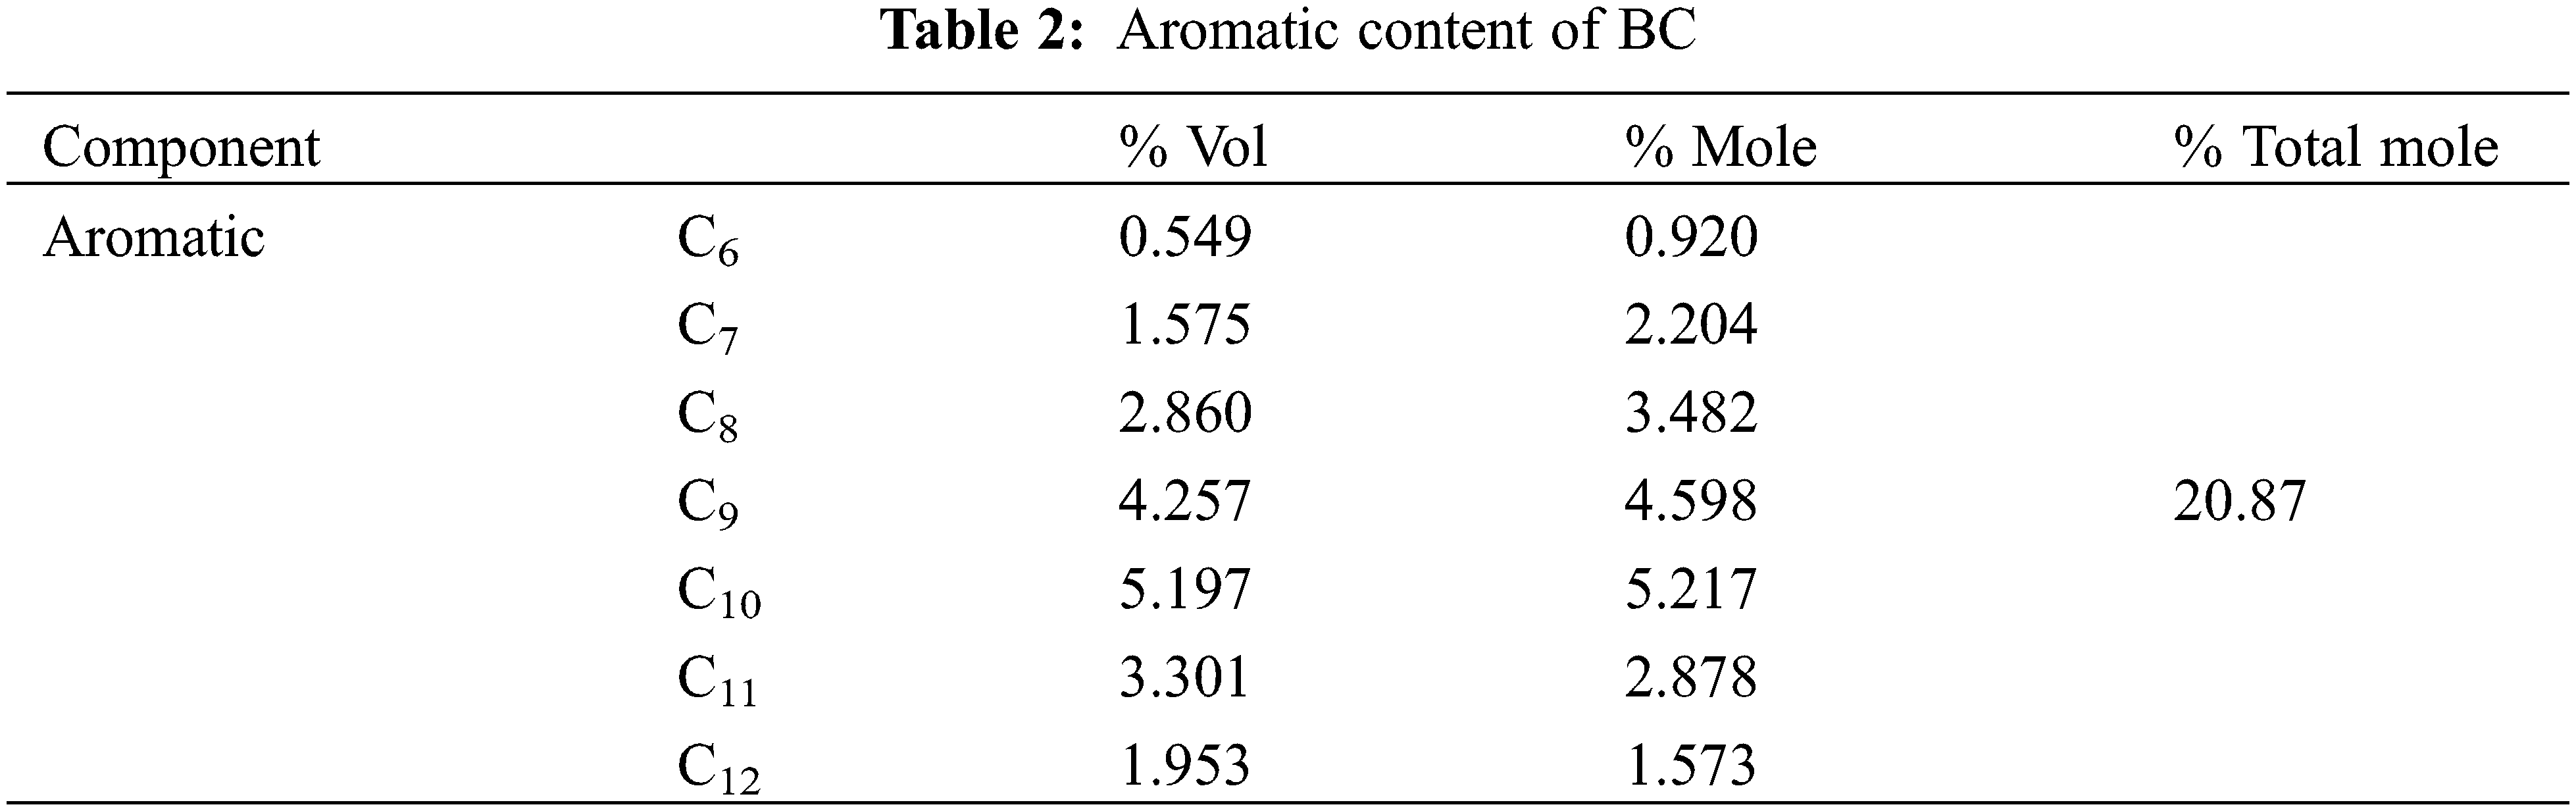
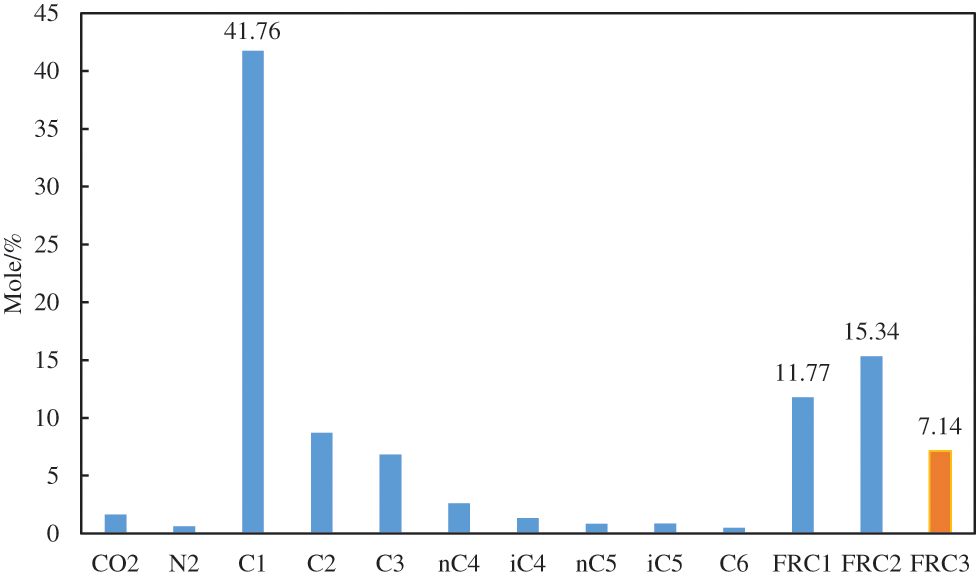
Figure 1: Composition of sample BC after splitting the heaviest fraction
Finally, the main Equation of State (EOS) parameters are tuned to accurately reproduce the fluid properties and their behaviors under various pressure and temperature conditions. In this stage, the EOS calibration was performed using the composition of the selected fluid samples. This study utilized the Peng-Robinson Equation of State with three parameters (see Eq. (1)) due to its relative reliability in modeling near-critical fluids and its ability to reproduce the thermodynamic behavior of hydrocarbons in the oilfield under investigation. The main Pressure-Volume-Temperature (PVT) analysis experiments, including bubble point pressure, constant composition expansion tests, and differential liberation tests, were matched through multiple numerical regressions utilizing the properties of the heaviest pseudo-components. These properties include critical temperature, critical pressure, acentric factors, shift volume, and binary interaction coefficients between the lightest and heaviest components. The liquid viscosity was adjusted using the Pedersen correlation, which enables the determination of the mixture’s viscosity through the following expression:
where μ is the viscosity; Tc is the critical temperature; Pc is critical pressure; MW is the molecular weight; α is the coupling rotation coefficient. Fig. 2 compares experimental tests for the main fluid properties with the simulation results predicted by the EOS after calibrating sample BC. Overall, the predicted results exhibit a good match with an error lower than 10%. As for the saturation pressure, Fig. 3 demonstrates the successful match achieved for sample BC after calibrating the EOS.
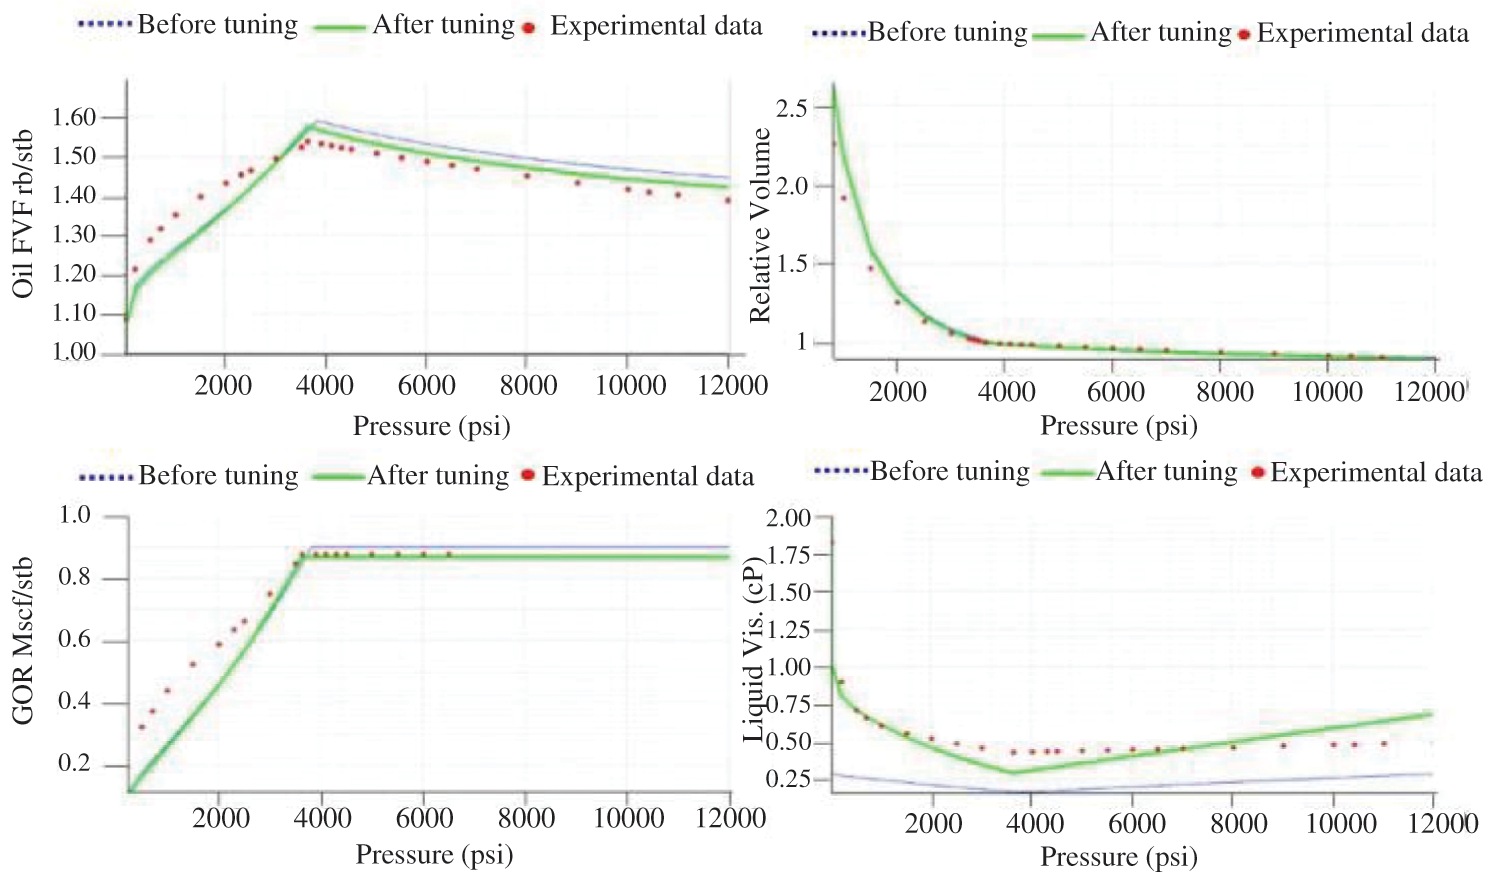
Figure 2: Match of the main PVT parameters for BC sample
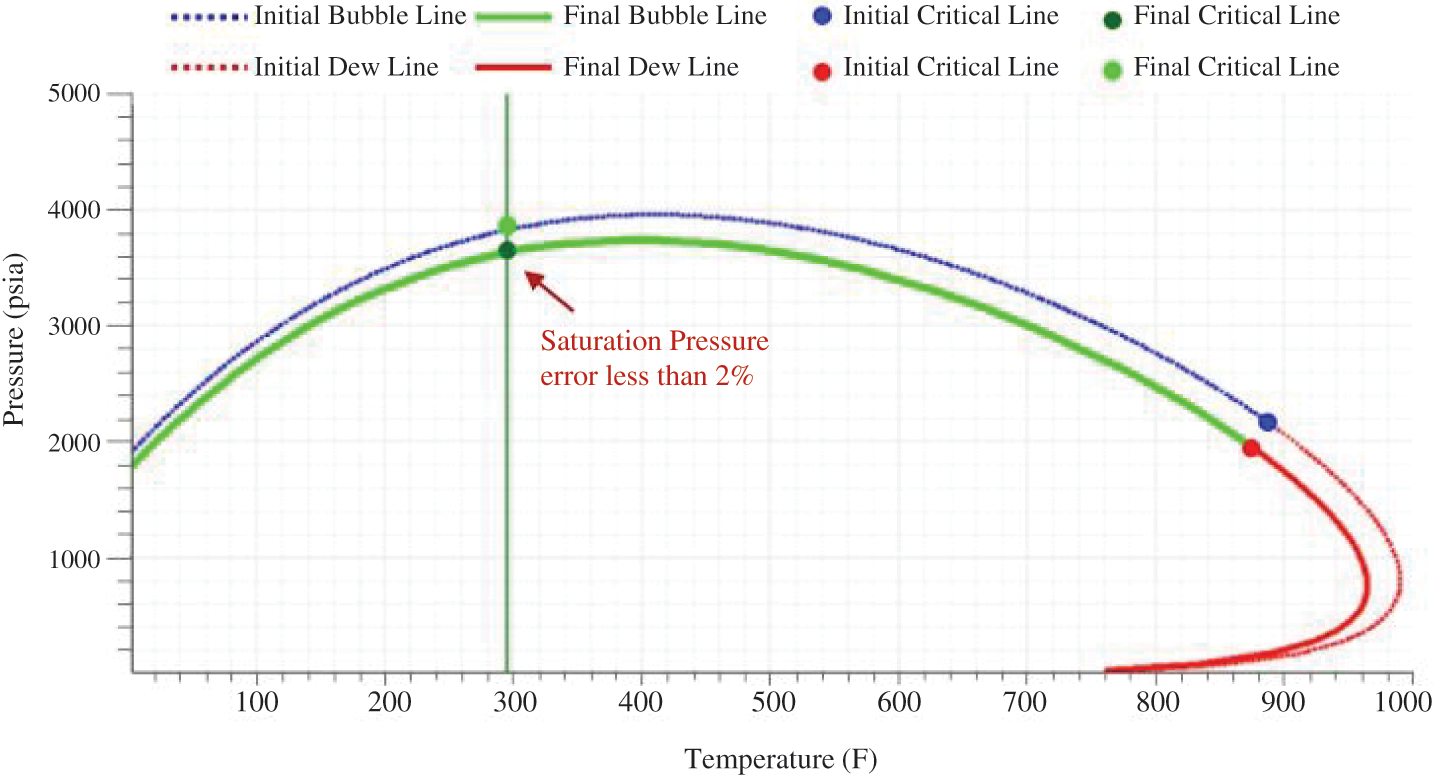
Figure 3: Two-phase envelope after EOS tuning for BC sample
2.2 Validation of the Fluid Model
To validate the fluid model, an experimental gas-oil displacement test was conducted using laboratory-scale equipment, as depicted in Fig. 4. The equipment comprised a slim tube-type displacement device that was initially saturated with BC sample. The natural gas injection process was performed at a constant rate of 0.06 cc/min, while the CO2 injection rate was 0.5 cc/min. The composition of the injected gas is presented indicated in Table 3. Subsequently, a 1D numerical simulation model consisting of 200 cells in the flow direction, with injector and producer wells at each end of the model as illustrated in Fig. 5, was created to replicate the results obtained from the displacement experiment. The results obtained from the numerical simulation are shown in Fig. 6, and demonstrate a good match of the recovery values obtained from the experimental test. This allows for the conclusion that the thermodynamic model built can reproduce the miscibility conditions between the fluids at the different evaluated pressure levels with quite acceptable accuracy.
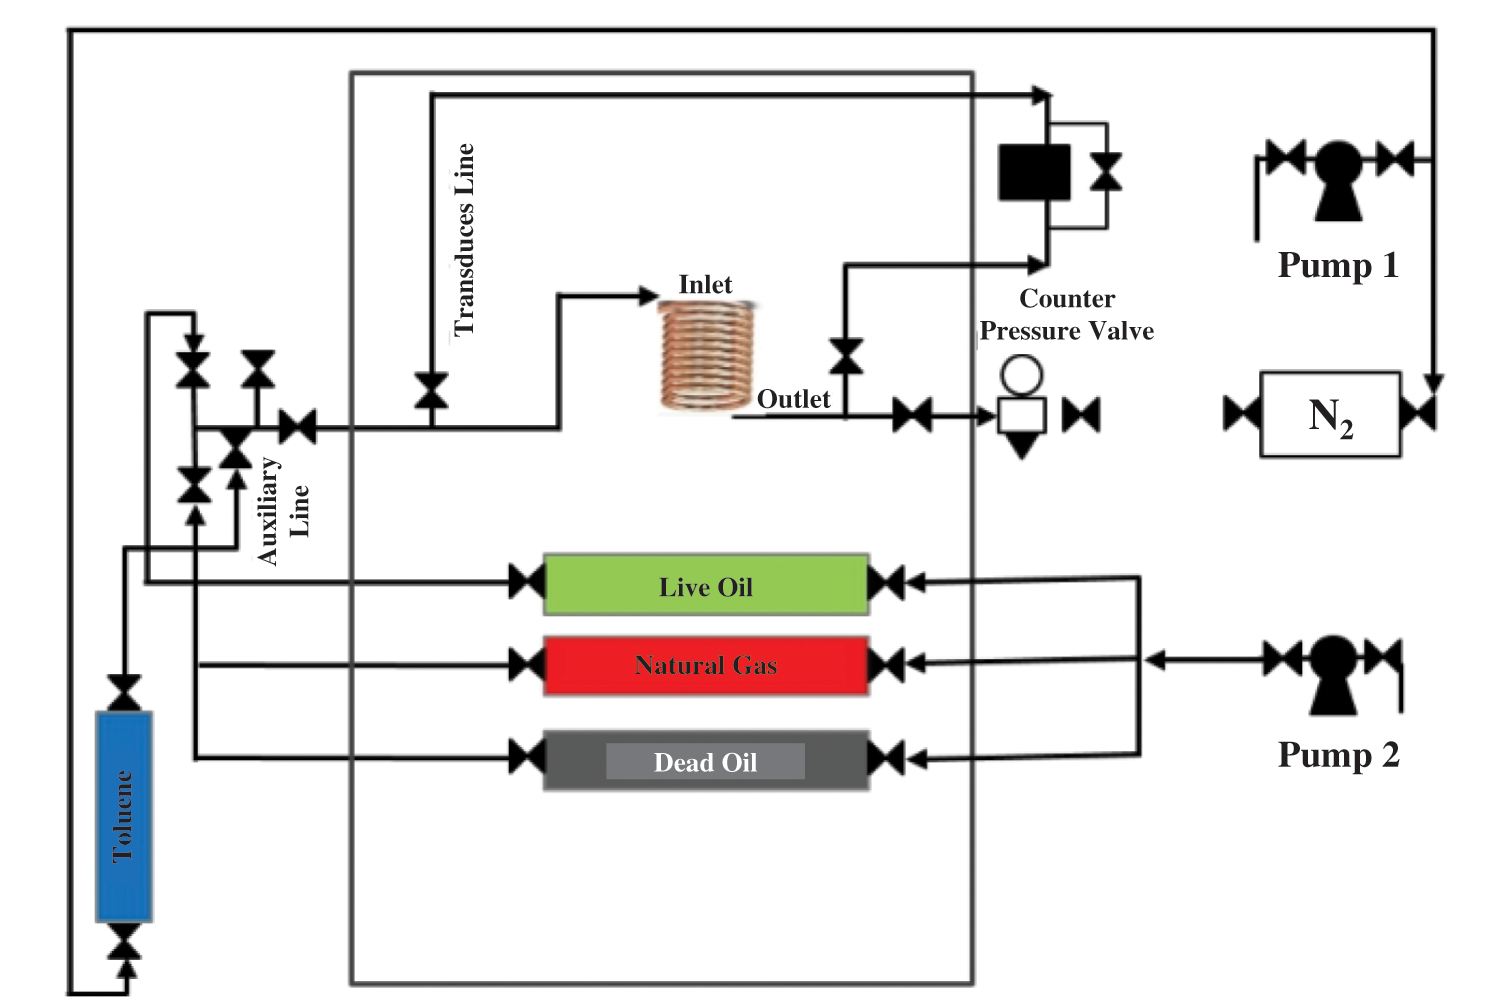
Figure 4: Schematic diagram of the experimental equipment
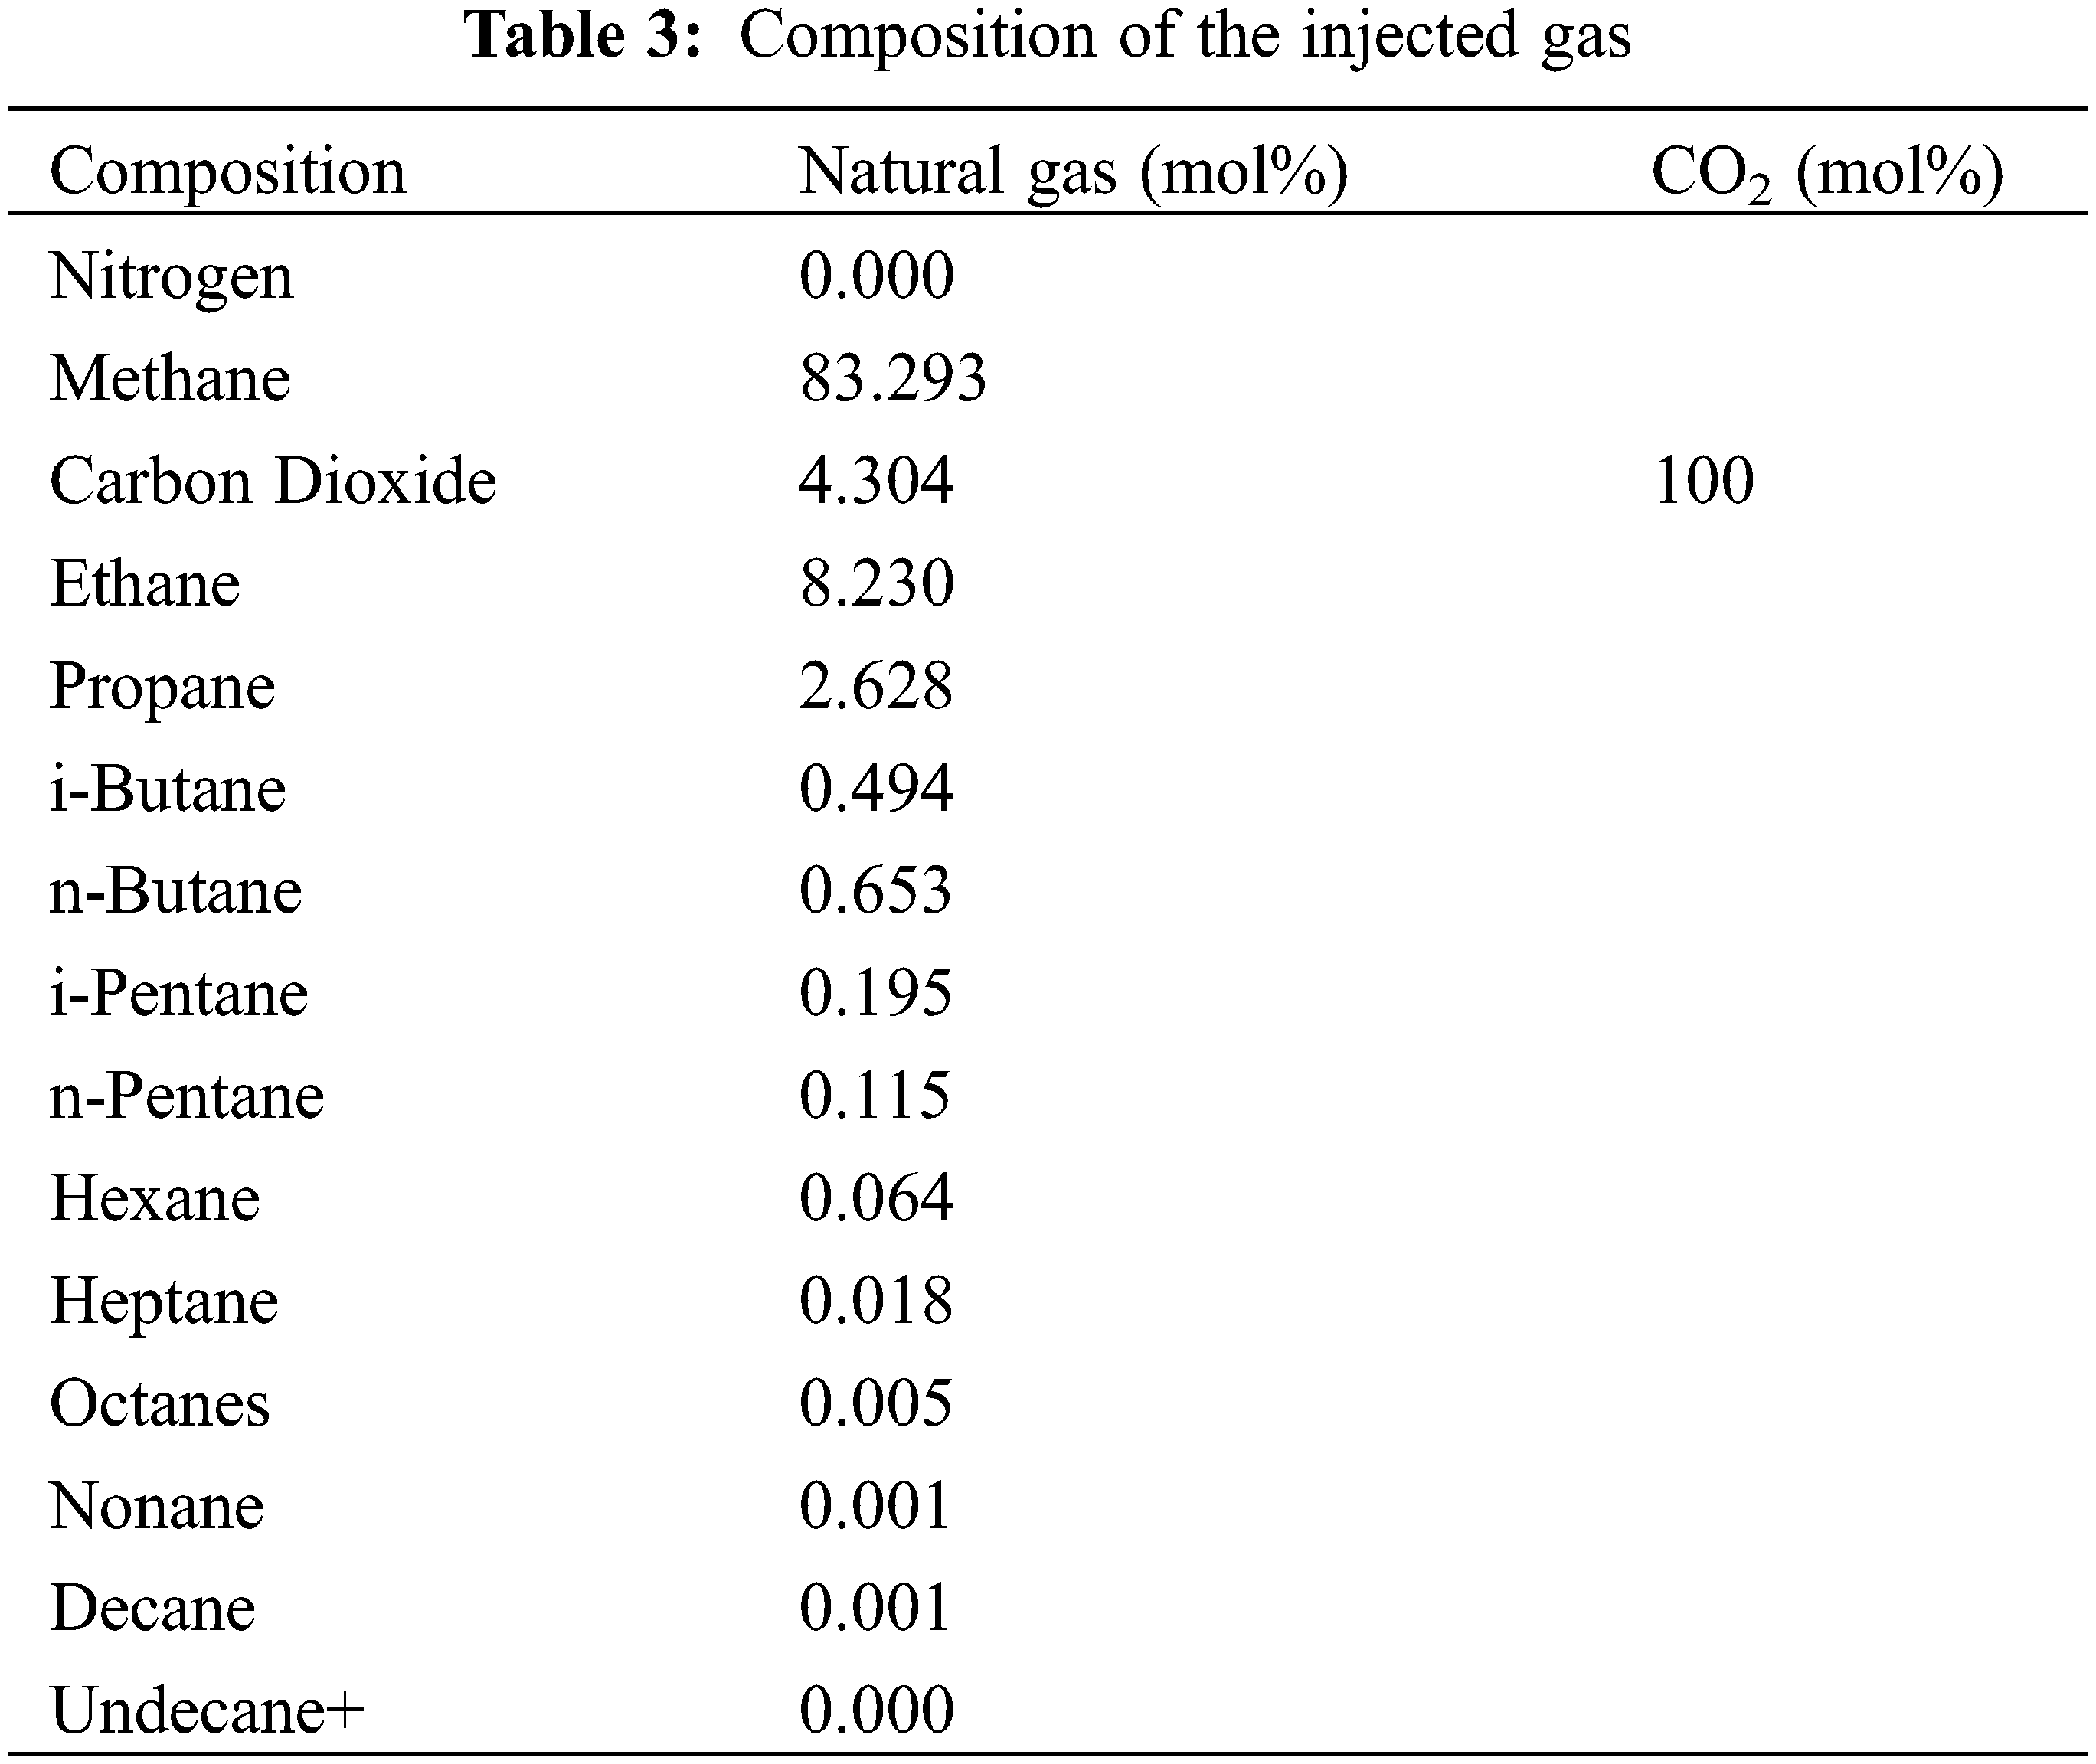
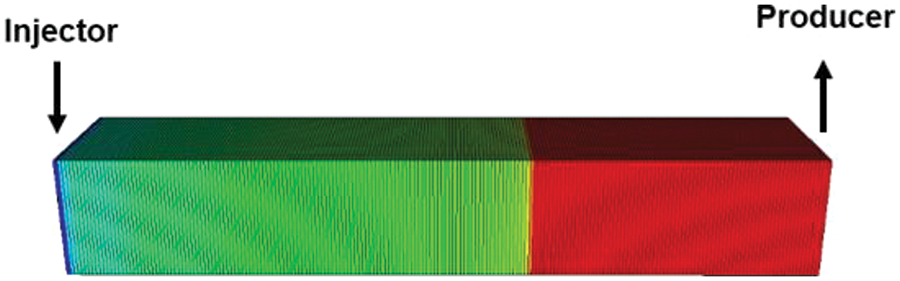
Figure 5: Simulation model of the 1D slim-tube
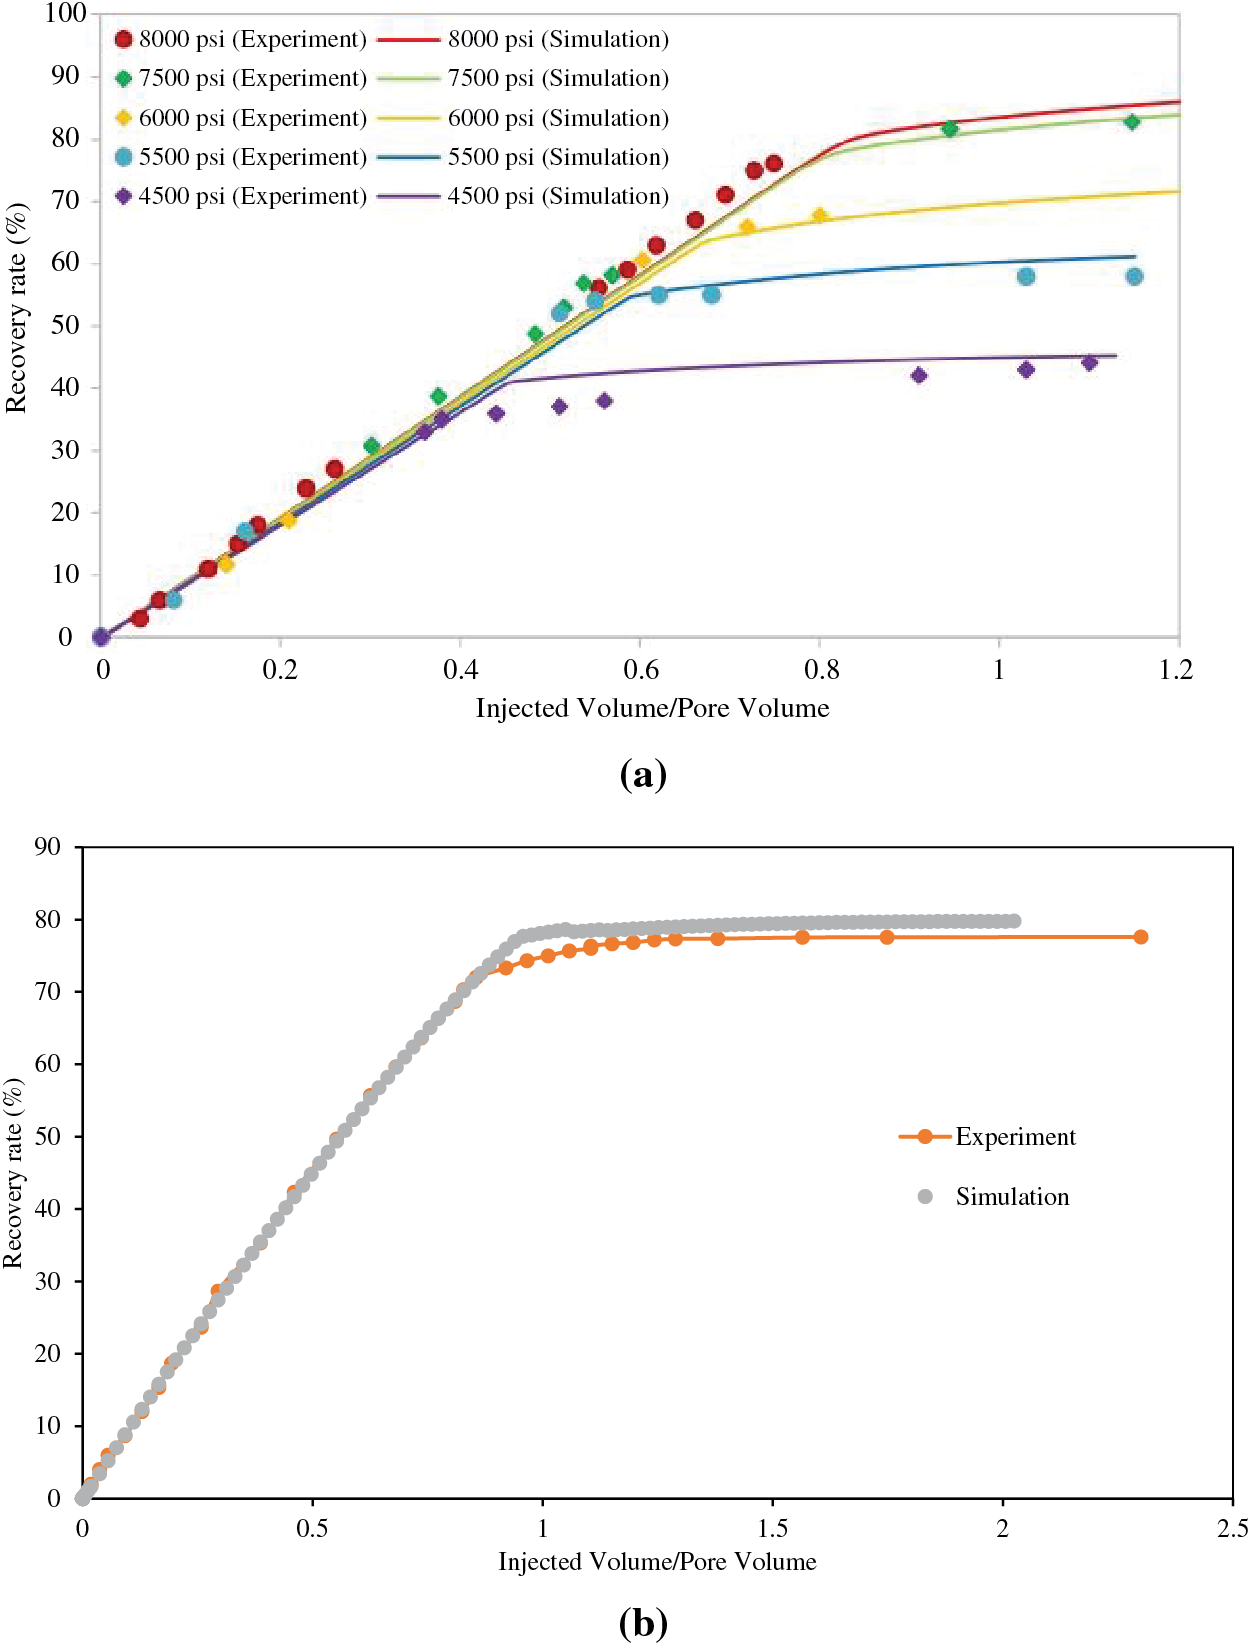
Figure 6: Comparison of the oil recovery rate between the numerical simulation and slim tube experiment using (a) natural gas injection and (b) CO2 injection
2.3 3D Numerical Simulation Modeling
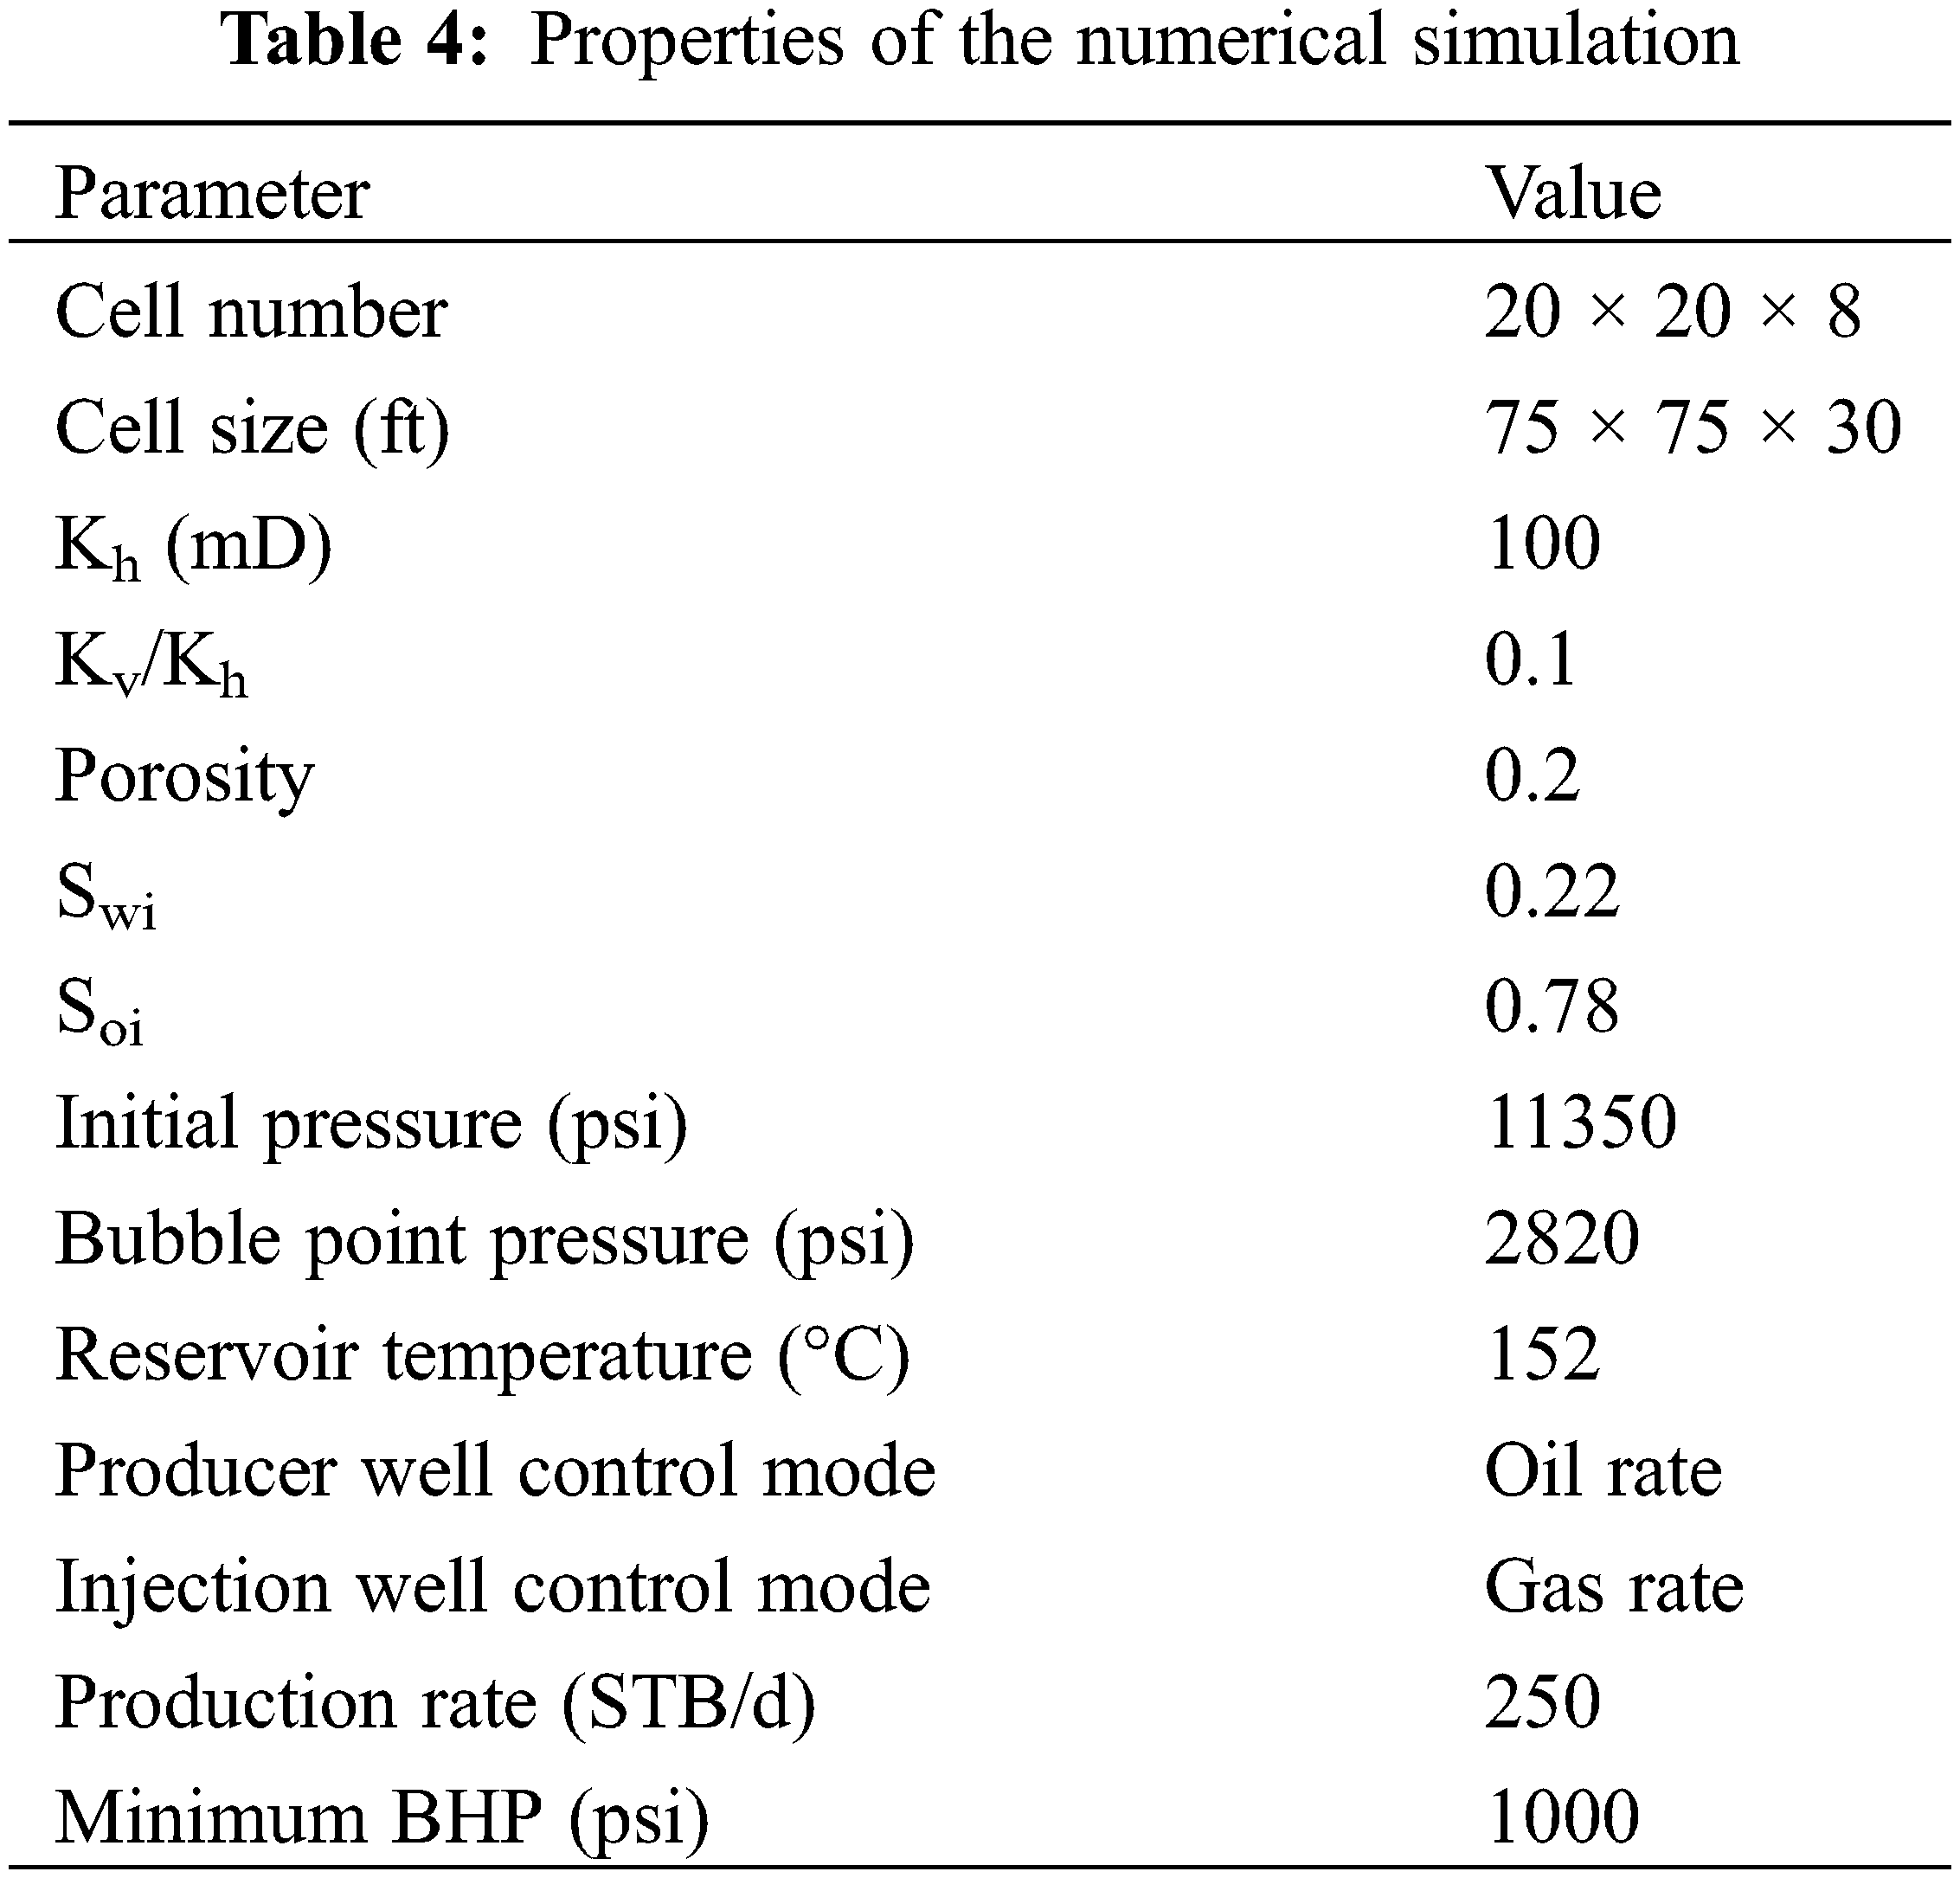
A 3D numerical simulation model was constructed to assess the effect of asphaltene deposition on the behavior of the main production variables of the reservoir during a gas injection scheme. The model, illustrated in Fig. 7, comprised a symmetric Cartesian grid measuring 20 × 20 × 8, with a producer and an injector. Table 4 presents the petrophysical properties and control variables utilized in the study.
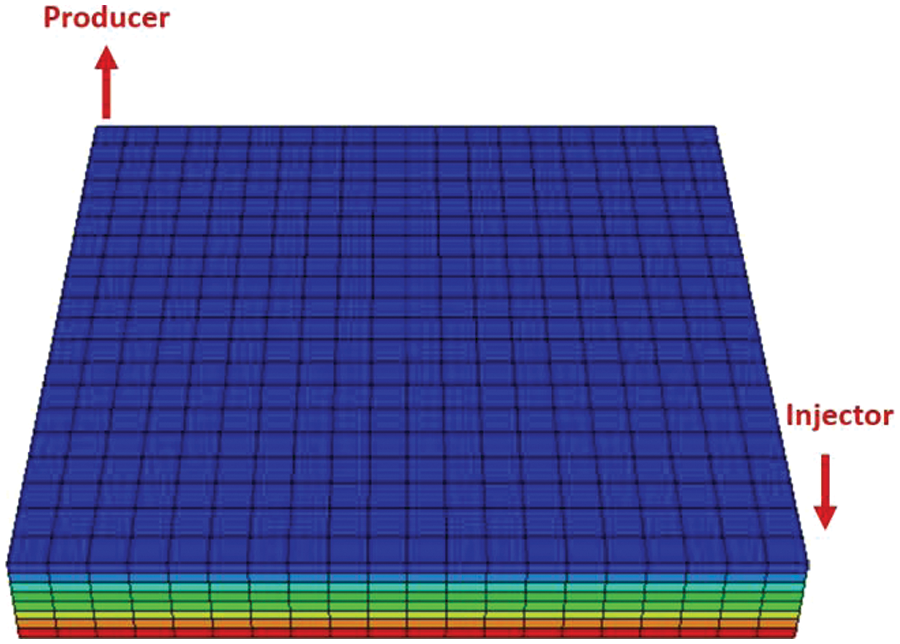
Figure 7: 3D numerical simulation model
3.1 Mechanism of Asphaltene Deposition during Natural Gas Injection
The initial evaluation involved dry gas injection (as specified in Table 3) at a constant rate of 530 MMSCF/D to generate and maintain pressure at 8000 psi. Fig. 8 illustrates the behavior of reservoir pressure in the evaluated scenarios, with a red curve representing the base case, which does not consider the asphaltene deposition, and a black curve representing the case that considers asphaltene deposition in the porous medium. Initially, a pressure decline occurred due to fluid production, followed by pressure maintenance at approximately 8000 psi corresponding to the start of gas injection in the reservoir. This pressure maintenance effect lasted until around 6600 days, after which a pressure decline process began. Despite the pressure decrease in both cases, there was a slight difference in the timing of this decrease, which was attributable to the timing of gas injection, as illustrated in Fig. 9.
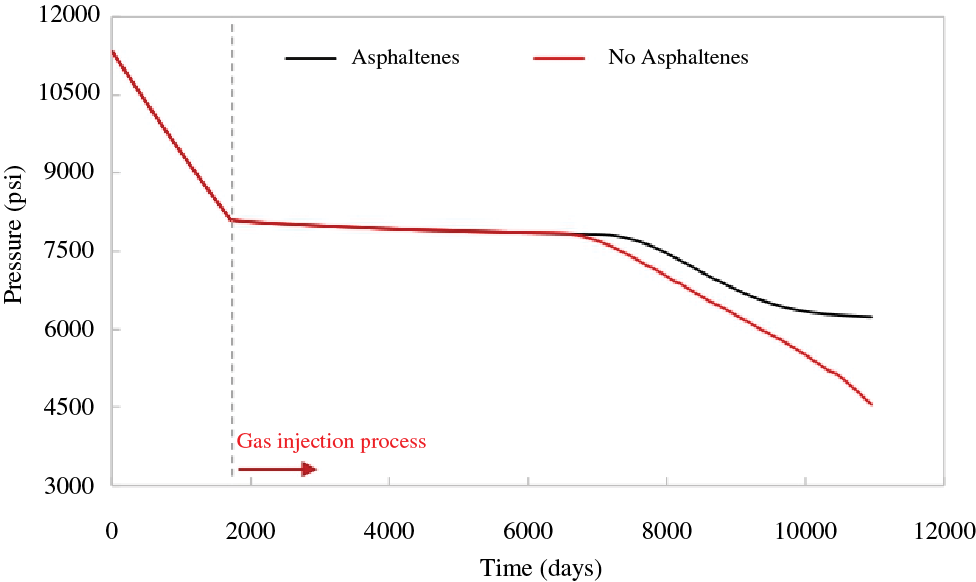
Figure 8: Comparison of the pressure maintenance
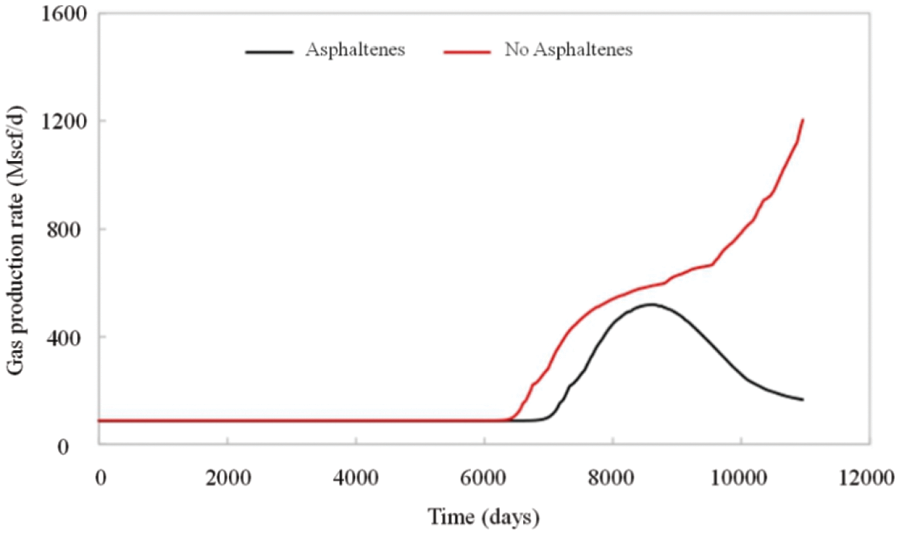
Figure 9: Comparison of the gas production rates
In the simulation of the base case (Fig. 10, right side), where there was no reduction in permeability due to asphaltene deposition, gas mainly flowed through the top layers of the model due to phase segregation, leading to a faster gas breakthrough to the producer. However, when asphaltene deposition in the porous medium was taken into account (Fig. 10, left side), the flow of gas through the top layers was impeded by the precipitation and subsequent deposition of asphaltenes when the injection gas contacts the initial crude oil.
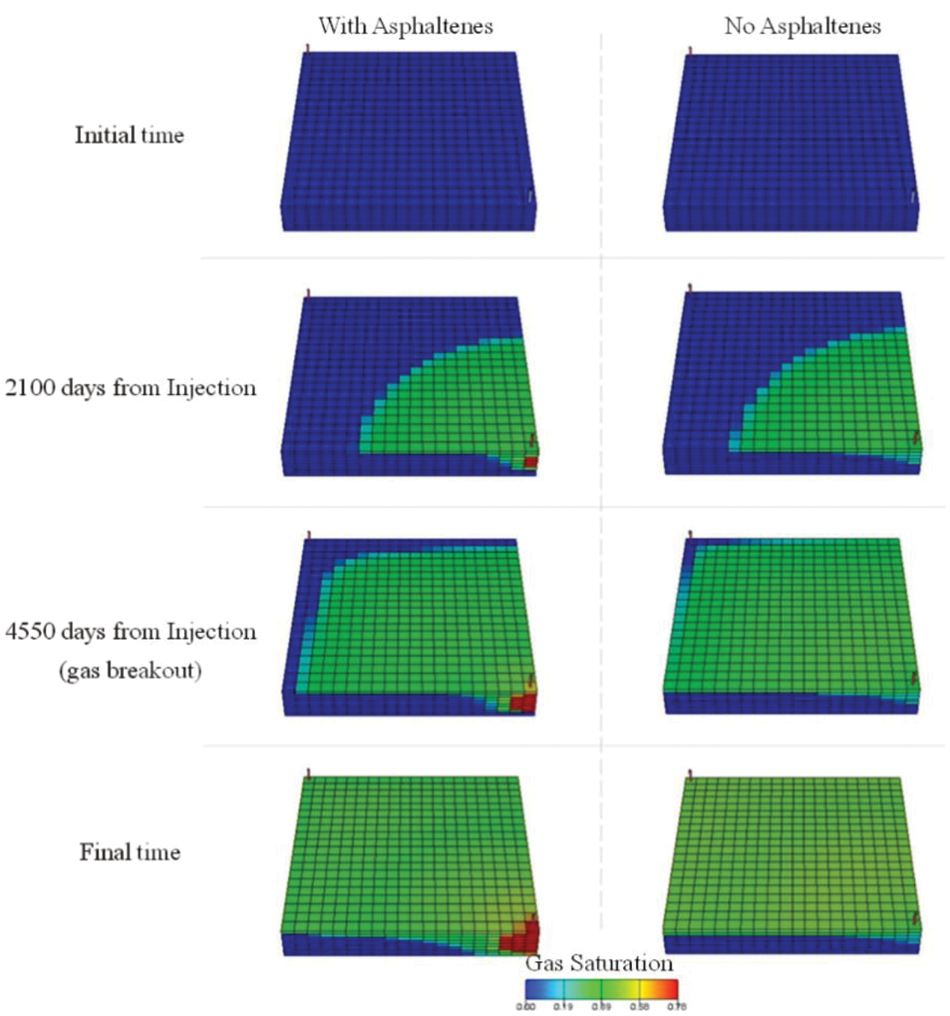
Figure 10: Gas saturation comparison through time, considering asphaltene deposition (left side) and without considering asphaltene deposition (right side)
The cells of the upper layer, which were the first to come into contact with the injection gas, were also the first to be affected by the asphaltene deposition mechanism. This considerably reduced their permeability and created a preferential flow to the lower layers with greater flow capacity. This can be observed in Figs. 11 and 12, which show the decrease in permeability multiplier and asphaltene deposited volume fraction resulting from the gas injection process, respectively. Eventually, the permeability of these lower layers was also be affected when they came into contact with the injection gas, resulting in a much more uniform gas front compared to the base case. This uniform advance of the gas injection front was reflected in an increase in displacement efficiency, as illustrated in Fig. 13. The displacement efficiency of the case considering asphaltene deposition was 0.9% higher than that of the base case.
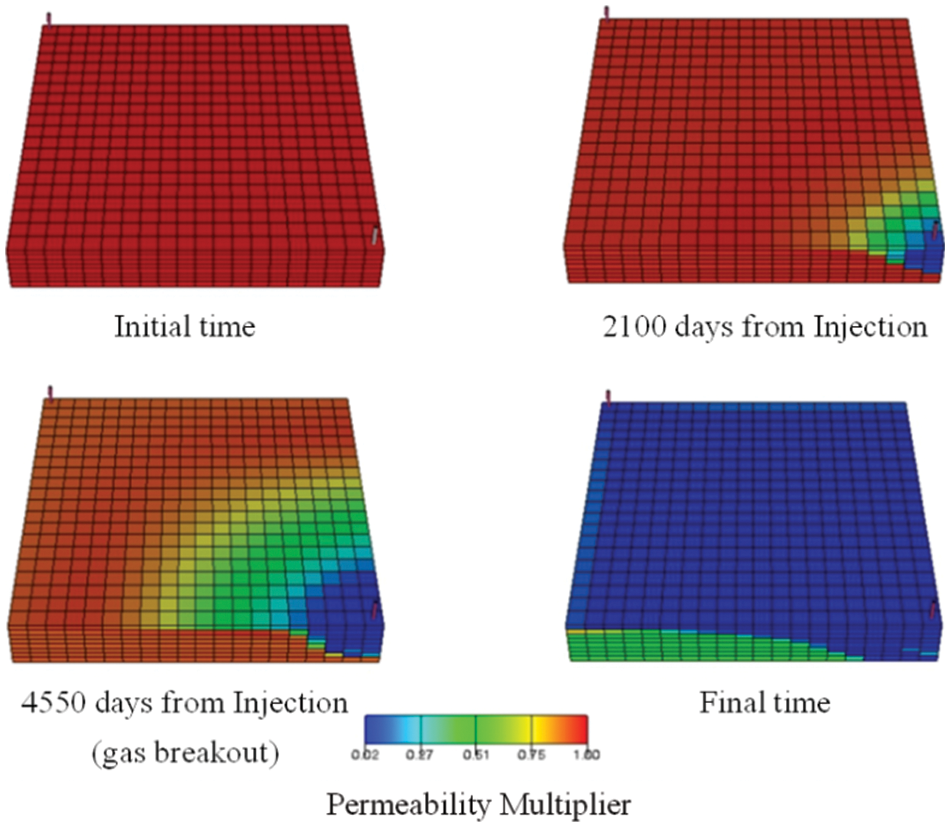
Figure 11: Effect of the gas injection process on the asphaltene permeability multiplier
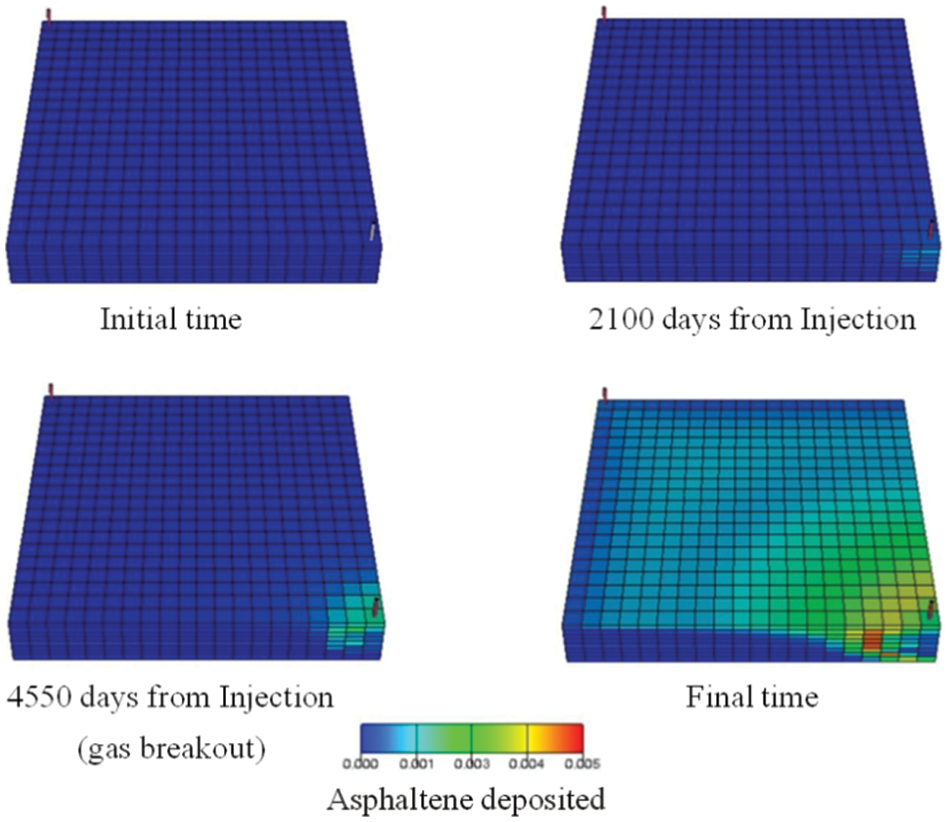
Figure 12: Asphaltene volume fraction deposition
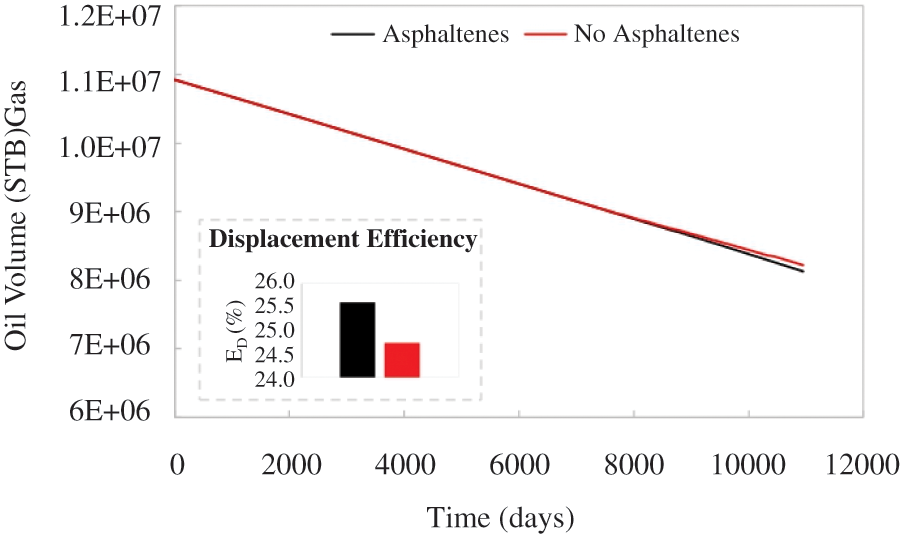
Figure 13: Variation of in-place oil volume and displacement efficiency with time
As shown in Fig. 9, although the gas rate for both cases increased at the same slope after the gas breakthrough, this trend was reversed after 8500 days in the case that did not consider asphaltene deposition. This reversal was due to an increase in oil saturation near the producer, which was caused by two factors. The first factor was the displacement of oil swept by a homogeneous injection front. Due to the simulation being production rate-controlled, this increase in oil saturation near the producing well meant that a smaller volume of gas was needed to achieve the production rate target of 250 STB.
The second factor was related to crude oil vaporization resulting from the miscibility effect between fluids. As depicted in Fig. 14, the homogeneous advance of a injection front enabled the injection gas to contact with a larger volume of oil in the reservoir, leading to an increase in gas richness due to the vaporization effect. This effect was measured by the volume of oil in the gas phase, which not only increased to a greater extent but also persisted for a longer time compared to the base case. In the base case, the efficiency of the process was reduced by early gas breakthrough.
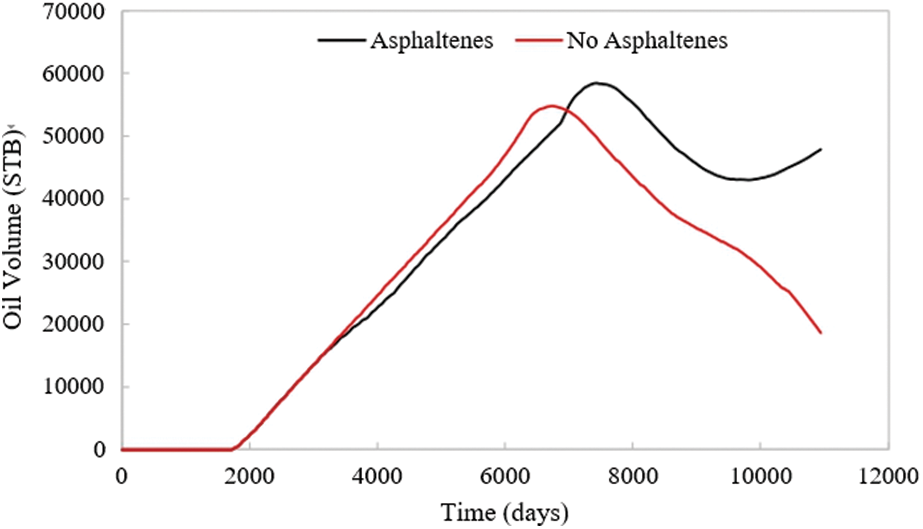
Figure 14: Volume of oil vaporized by the injection gas (oil volume in gas phase) over time
3.2 Evaluation of Asphaltene Deposition at Different Pressure Levels
This section evaluates the effect of gas injection at different maintenance pressure levels (5500, 6500, and 8000 psi) and examines the potential impact of asphaltene deposition mechanisms. Fig. 15 displays simulated reservoir pressure for each evaluated case at varying injection pressures. It is worth noting that a higher gas injection pressure required the injection of a greater volume of gas (at an earlier time) to achieve the pressure maintenance effect of the simulation model, as illustrated in Fig. 16.
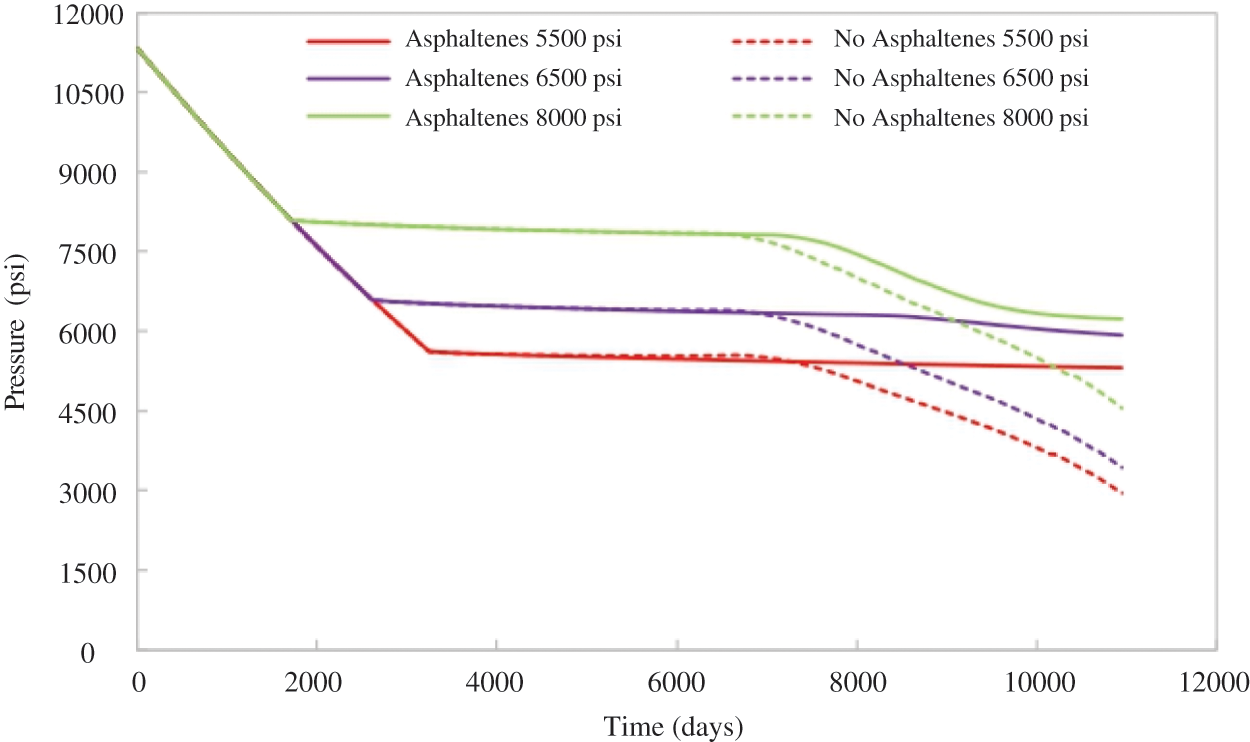
Figure 15: Comparison of the pressure maintenance effect
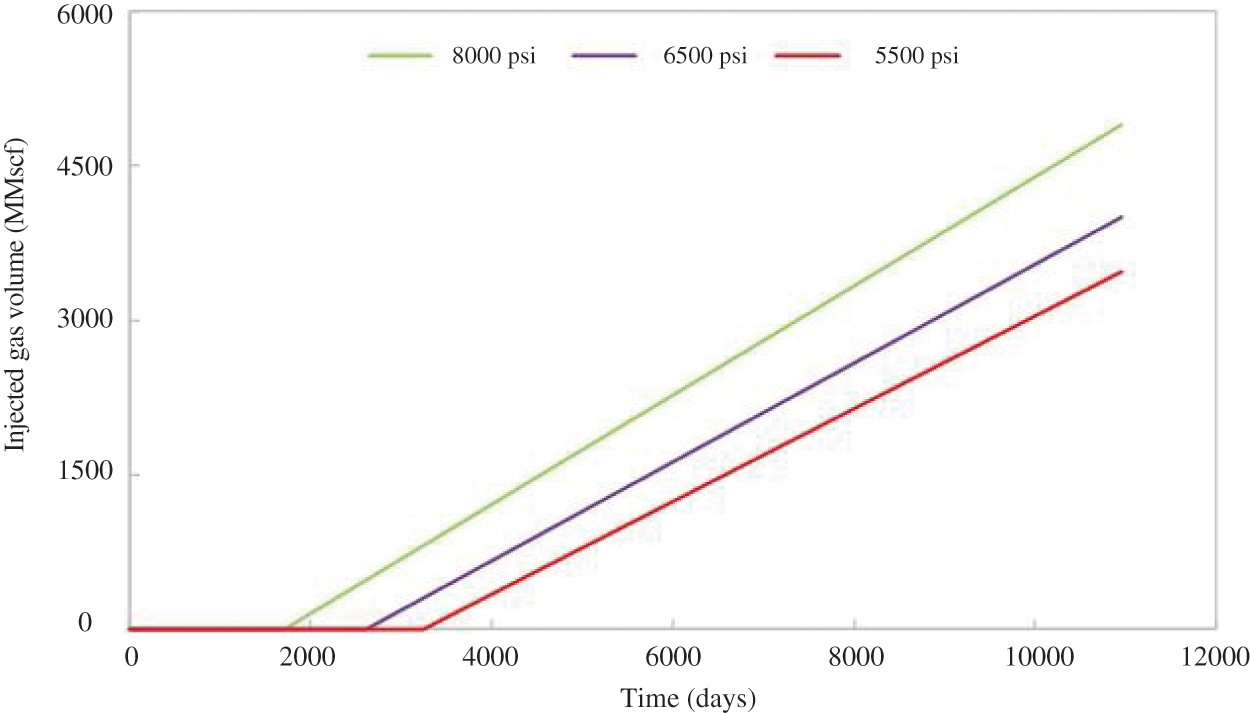
Figure 16: Gas injected volume at different injection pressures
It is important to emphasize that when considering the asphaltene deposition mechanism in the porous medium (continuous lines), the pressure maintenance effect was sustained until the end of the simulation with gas injected at 5500 psi. This contrasts with the pressure behavior observed when gas was injected at 6500 and 8000 psi, where late depletion effect was observed 4500 days after the start of the injection process. This difference in pressure behavior was attributed to the volume of produced gas in each scenario (see Fig. 17). Gas production remained constant throughout the simulation when gas was injected at 5500 psi, indicating that the injection gas never reached the producer.
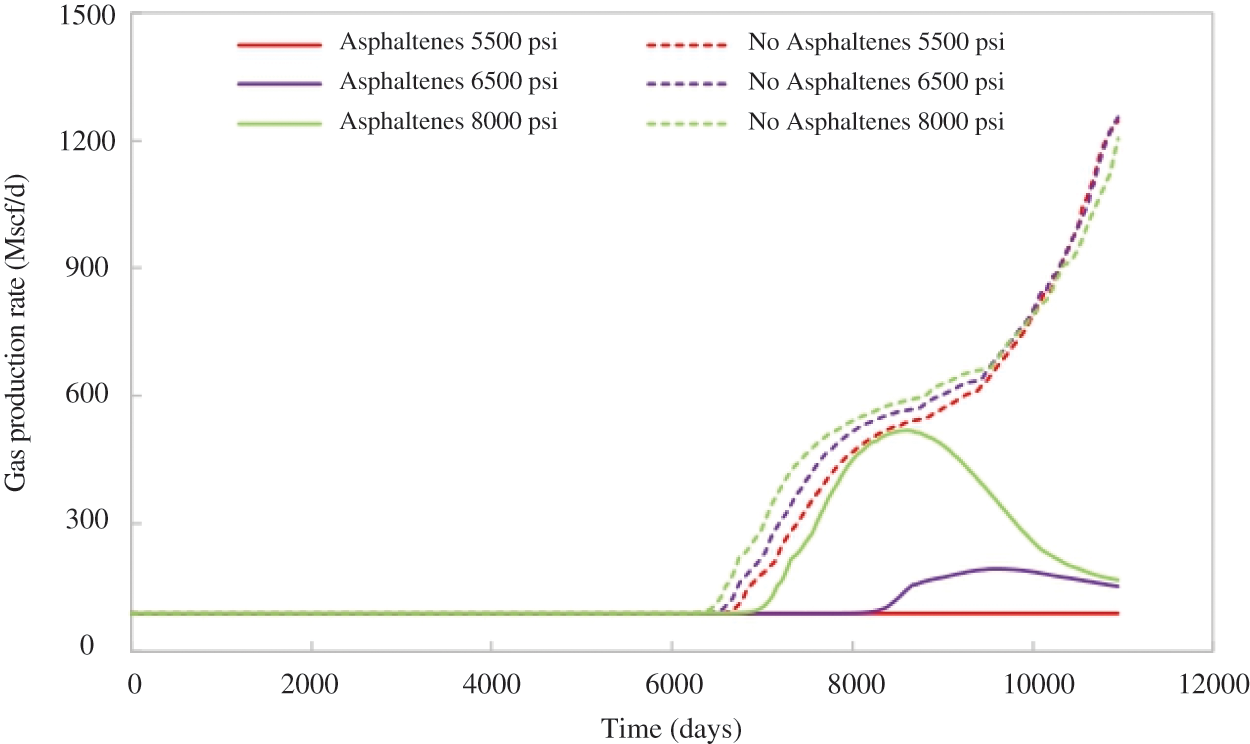
Figure 17: Comparison of the simulated gas production rate at different injection pressures
Figs. 18 and 19 depict the results of the asphaltene deposited volume fraction and the permeability reduction factor resulting from asphaltene deposition, respectively, for each evaluated scenario. There was a clear disparity in the volume of asphaltene deposited and the subsequent permeability reduction correlated with the deposition mechanism. The scenario in which gas was injected at 5500 psi exhibited the most significant permeability reduction throughout the model.
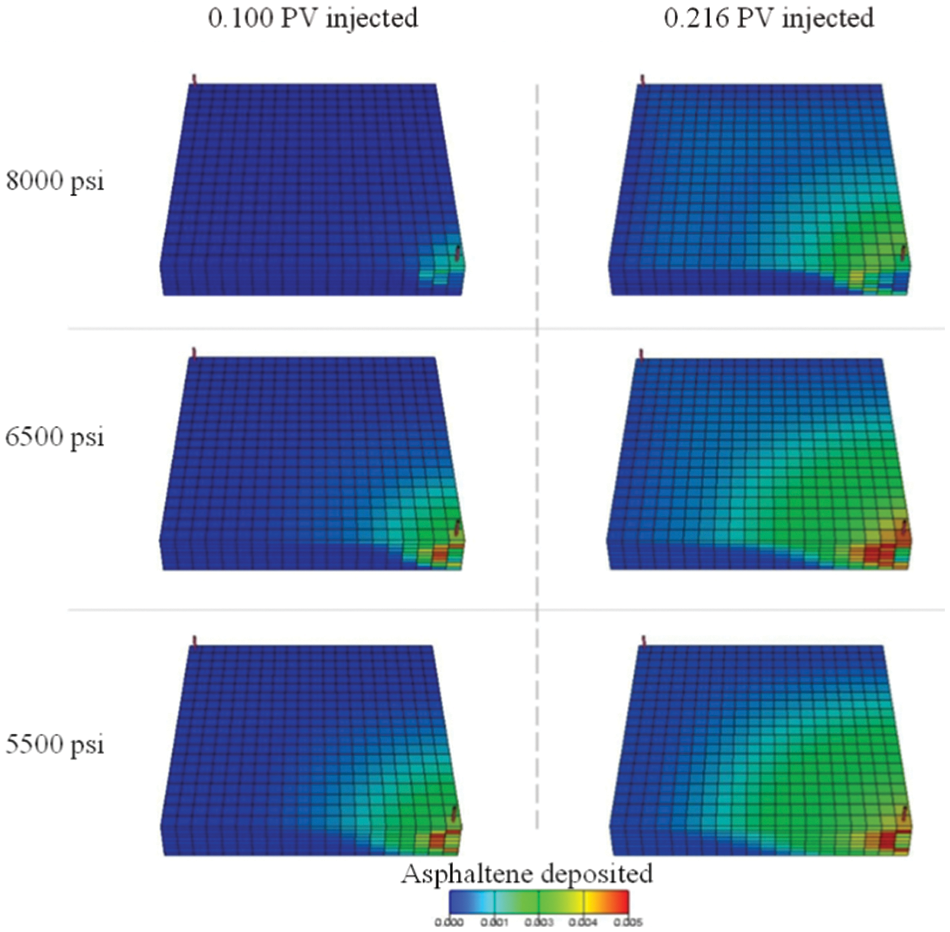
Figure 18: Effect of the gas injection process on the asphaltene deposition volume fraction in the reservoir at different gas injected pore volume (PV) (left-right) and at different injection pressure (up-down)
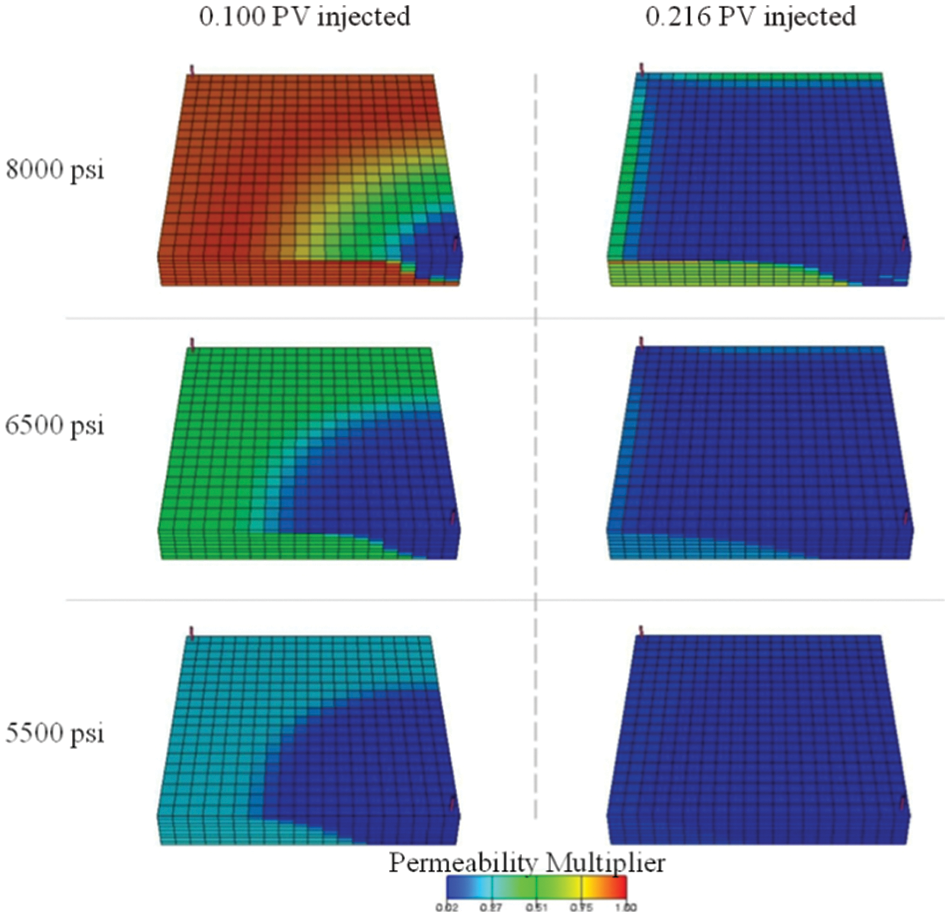
Figure 19: Effect of the gas injection process on the permeability multiplier factor in the reservoir at different gas injected PV (left-right) and at different injection pressure (up-down)
Figs. 20 and 21 illustrate the impact of permeability reduction on the behavior of oil and gas flow for each evaluated injection case at 0.1 (left side) and 0.216 (right side) injection pore volumes. It was evident that even though the decrease in reservoir pressure from 8000 to 5500 psi resulted in a significant reduction of miscibility conditions, reducing the permeability when gas was injected at 5500 psi led to a more uniform displacement of oil. This was because the lower gas injection pressure caused a greater effect of asphaltene precipitation, resulting in a more homogeneous displacement of oil. In volumetric terms, the scenario that experienced the greatest permeability reduction also exhibited a higher displacement efficiency during the injection process, as shown in Fig. 22.
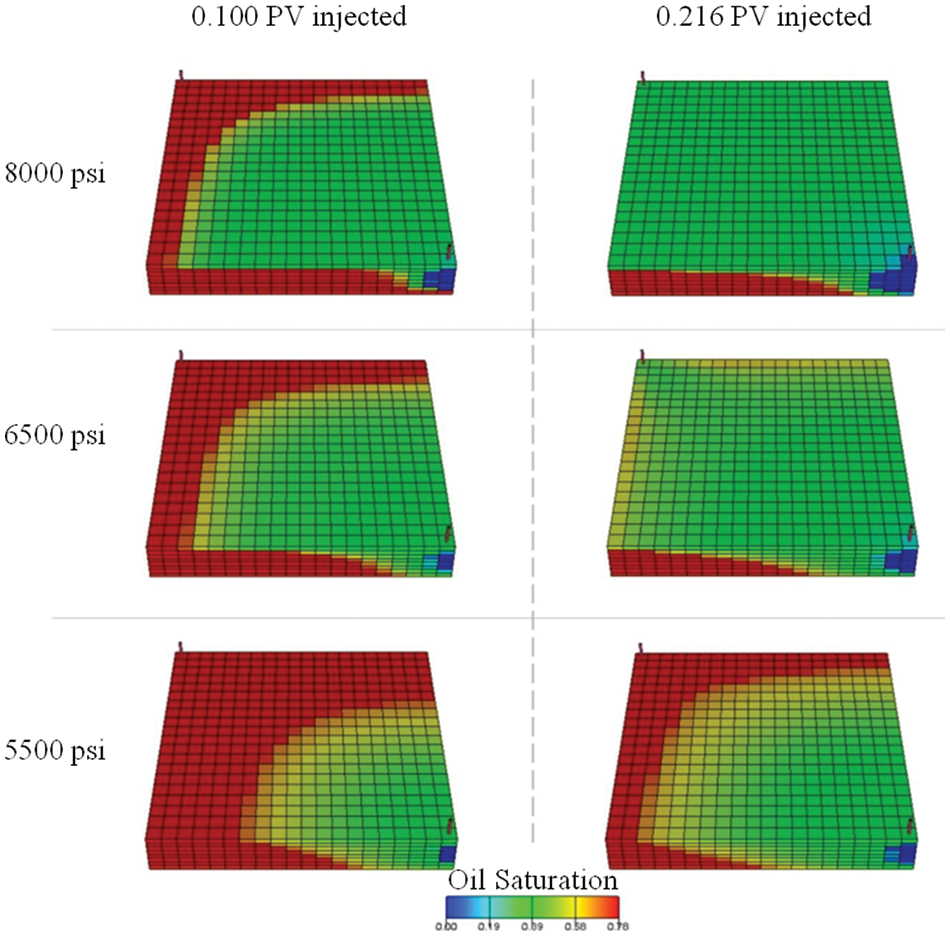
Figure 20: Effect of the permeability reduction on the oil saturation in the reservoir at different gas injected PV (left-right) and at different injection pressure (up-down)
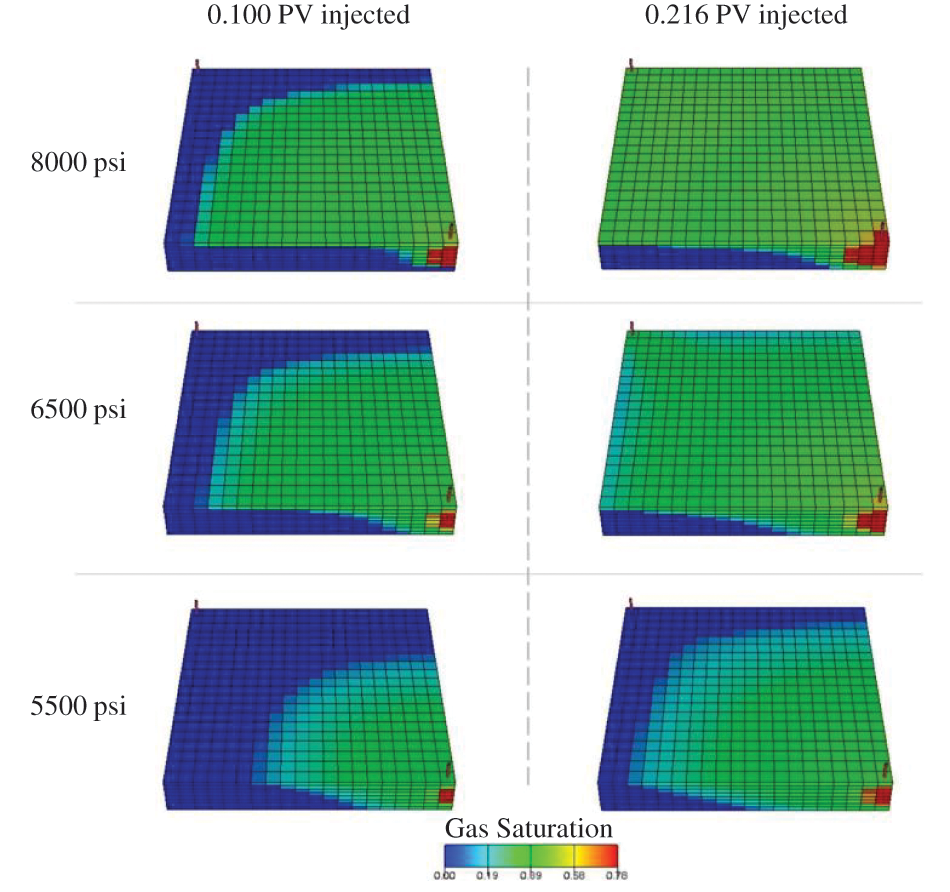
Figure 21: Effect of the permeability reduction on the oil saturation in the reservoir at different gas injected PV (left-right) and at different injection pressure (up-down)
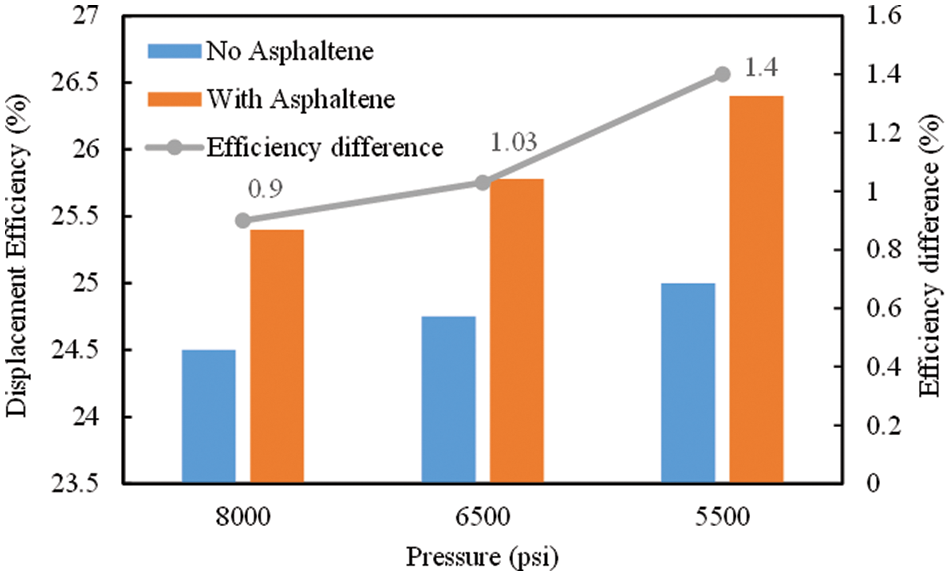
Figure 22: Comparison of displacement efficiency at different injection pressure
3.3 Mechanism of Asphaltene Deposition during CO2 Injection
To analyze the changes in fluid components during CO2 replacement, a long core model depicted in Fig. 5 was utilized. Fig. 23 illustrates the temporal variation of output fluid components. There was a substantial increase in the proportion of intermediate components C4+ and C6+ after CO2 injection, alongside a decrease in the proportion of asphaltene, indicating that superior extraction effect of CO2 on intermediate components during repeated contact with crude oil, leading to easier miscible replacement, while asphaltene precipitated and deposited. Fig. 24 further compares the viscosity and interfacial tension at various locations of the long core model. The findings indicated that at the displacement front, the oil/gas interfacial tension decreased to zero because of miscibility between oil and CO2, resulting in a 25% reduction in crude oil viscosity, thereby enhancing crude oil recovery. On the other hand, in the post-CO2 displacement area, the extraction of CO2 from the light fraction caused a significant increase in crude oil viscosity and surface tension due to the precipitation of asphaltene. Therefore, it is recommended to increase gas injection pressure to expedite the CO2-crude oil miscible process, leading to improved asphaltene displacement effect and recovery rate.
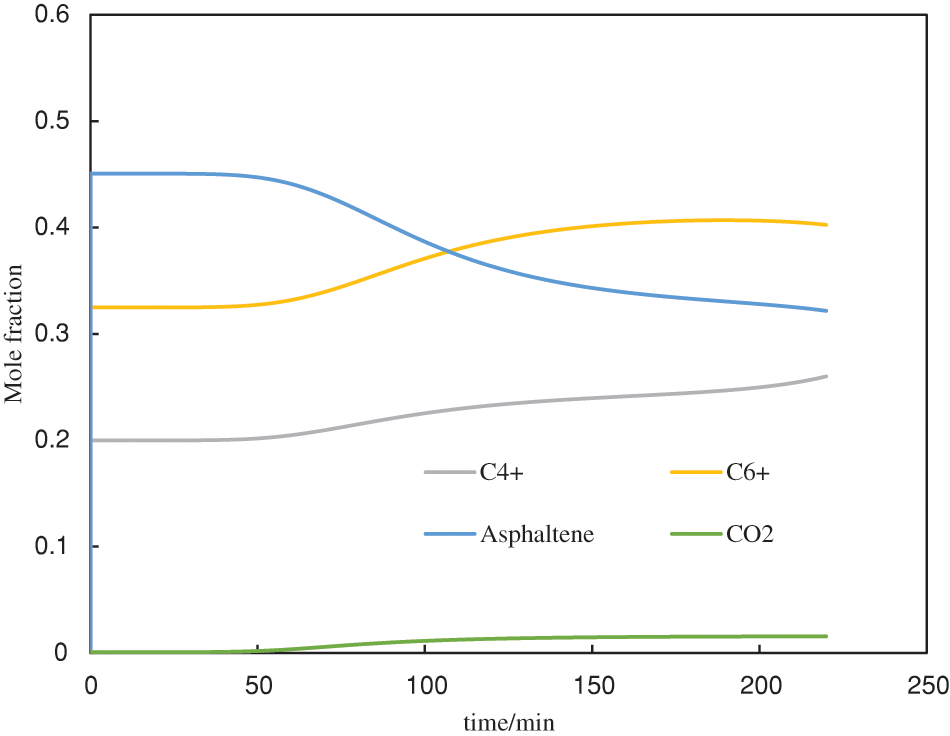
Figure 23: Variation of output fluid components during CO2 injection
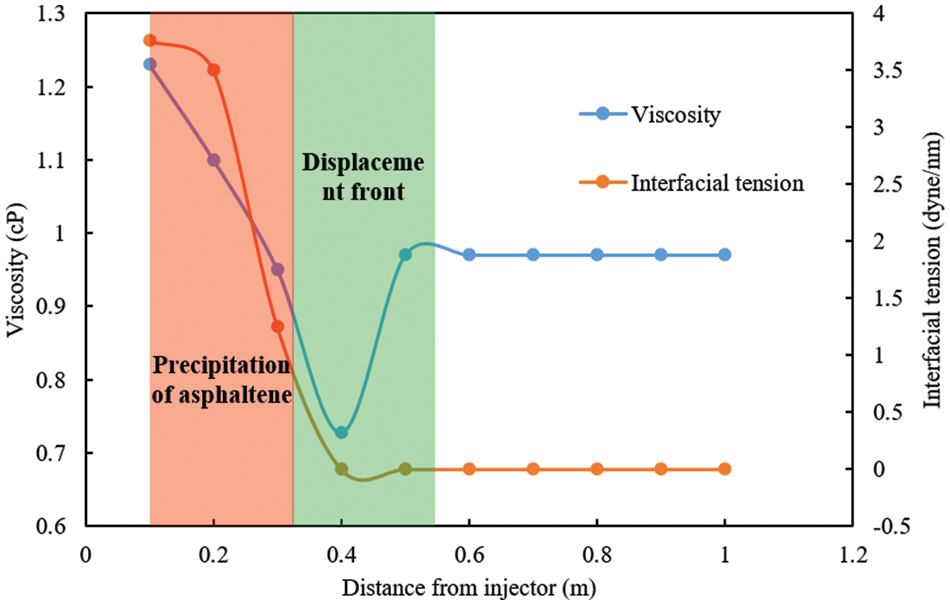
Figure 24: Viscosity and interfacial tension at different locations of the long core model
This paper presents a 3D numerical model that investigated the effects of injected gas on asphaltene deposition and production behaviors. The results showed that without considering asphaltene deposition, the injected natural gas tended to flow preferentially through upper layers due to the gravity segregation effect. However, when the asphaltene deposition model was included, the reduction in permeability experienced by the upper layers restricted gas flow, causing a greater volume of gas to flow through lower layers. This generates a more homogeneous injection front with greater crude oil displacement capacity. When gas was injected at 8000 psi, the displacement front improved, resulting in a 0.9% increase in displacement efficiency compared to the scenario that did not consider asphaltene deposition. The displacement efficiency difference increased to 1.03% and 1.40% when the injection pressure decreased to 6500 and 5500 psi, respectively. After CO2 injection, the miscible process with crude oil extracts light and intermediate components, exacerbating asphaltene precipitation and increasing the viscosity of the remaining crude oil, ultimately reducing the recovery rate. However, this study only focused on whether the differences in parameters such as pressure and recovery efficiency take into account the asphaltene deposition and analyzed the degree of damage from asphaltene deposition caused by CO2 and natural gas injection to the reservoir. Other factors that could affect the phenomenon, such as temperature, pressure and rock properties, were ignored. Our subsequent research will focus on describing the influence of different factors on the asphaltene deposition phenomenon.
Acknowledgement: The authors gratefully acknowledge the support of Nanhai East Petroleum Research Institute. The authors also thank the anonymous reviewers for their valuable comments.
Funding Statement: This research was funded by CNOOC Production Research Project (CCL2022SZPS0076).
Author Contributions: Study conception and design: Shasha Feng; data collection: Yi Liao, Weixin Liu, Jianwen Dai; analysis and interpretation of results: Shasha Feng, Mingying Xie, Li Li; draft manuscript preparation: Shasha Feng, Yi Liao. All authors reviewed the results and approved the final version of the manuscript.
Availability of Data and Materials: Data and materials can be available if required.
Conflicts of Interest: The authors declare that they have no conflicts of interest to report regarding the present study.
References
1. Buckley, J. S. (2012). Asphaltene deposition. Energy and Fuels, 26(7), 4086–4090. [Google Scholar]
2. Xiong, R. Y., Guo, J. X., Kiyingi, W., Xu, H. X., Wu, X. P. (2023). The deposition of asphaltenes under high-temperature and high-pressure (HTHP) conditions. Petroleum Science, 20(1), 611–618. [Google Scholar]
3. Elturki, M., Imqam, A. (2023). Experimental investigation of asphaltene deposition and its impact on oil recovery in eagle ford shale during miscible and immiscible CO2 huff-n-puff gas injection. Energy and Fuels, 37(4), 2993–3010. [Google Scholar]
4. Shen, Z., Sheng, J. J. (2018). Experimental and numerical study of permeability reduction caused by asphaltene precipitation and deposition during CO2 huff and puff injection in Eagle Ford shale. Fuel, 211(1), 432–445. [Google Scholar]
5. Sabet, N., Mohammadi, M., Zirahi, A., Zirrahi, M., Hassanzadeh, H. et al. (2020). Numerical modeling of viscous fingering during miscible displacement of oil by a paraffinic solvent in the presence of asphaltene precipitation and deposition. International Journal of Heat Mass Transfer, 154(1), 119688. [Google Scholar]
6. Yamchi, H. S., Zirrahi, M., Hassanzadeh, H., Abedi, J. (2021). Numerical simulation of asphaltene deposition in porous media induced by solvent injection. International Journal of Heat Mass Transfer, 181(1), 121889. [Google Scholar]
7. Eskin, D., Mohammadzadeh, O., Akbarzadeh, K., Taylor, S. D., Ratulowski, J. (2016). Reservoir impairment by asphaltenes: A critical review. The Canadian Journal of Chemical Engineering, 94(6), 1202–1217. [Google Scholar]
8. Mohammed, I., Mahmoud, M., Husseiny, A., Shehri, D., Garadi, K. et al. (2021). Impact of asphaltene precipitation and deposition on wettability and permeability. ACS Omega, 6(31), 20091–20102. [Google Scholar] [PubMed]
9. Hamadou, R., Khodja, M., Kartout, M., Jada, A. (2008). Permeability reduction by asphaltenes and resins deposition in porous media. Fuel, 87(11), 2178–2185. [Google Scholar]
10. Ahmed, T. (2018). Reservoir engineering handbook. USA: Gulf Professional Publishing. [Google Scholar]
11. Lichinga, K. N., Ntawanga, A. C. (2021). Experimental study on the effect of oil based filtercake on bonding strength at wellbore second interface. Natural Gas Industry B, 8(6), 680–688. [Google Scholar]
12. Solaimany, A. R., Zonnouri, A. (2021). Modeling of asphaltene deposition in oil reservoirs during primary oil recovery. Journal of Petroleum Science and Engineering, 75(3), 251–259. [Google Scholar]
13. Thomas, S. (2008). Enhanced oil recovery–An overview. Oil Gas Science Technology-Revue, 63(1), 9–19. [Google Scholar]
14. Bealessio, B. A., Alonso, N. B., Mendes, N. J., Sande, A. V., Hascakir, B. (2021). A review of enhanced oil recovery (EOR) methods applied in Kazakhstan. Petroleum, 7(1), 1–9. [Google Scholar]
15. Kechut, N. I., Nadeson, G., Ahmad, N., Raja, D. (2001). Evaluation of CO2 gas injection for major oil production fields in malaysia-experimental approach case study: Dulang field. SPE Asia Pacific Improved Oil Recovery Conference, pp. 144–149. Kuala Lumpur, Malaysia. [Google Scholar]
16. Cao, X., Yang, K., Xia, W., Tang, G., Bian, J. (2021). Dissociation experiment and dissociation rate model of CO2 hydrate. Natural Gas Industry B, 8(6), 607–614. [Google Scholar]
17. Zanganeh, P., Dashti, H., Ayatollahi, S. (2018). Comparing the effects of CH4, CO2, and N2 injection on asphaltene precipitation and deposition at reservoir condition: A visual and modeling study. Fuel, 217(1), 633–641. [Google Scholar]
18. Fakher, S., Imqam, A. (2019). Asphaltene precipitation and deposition during CO2 injection in nano shale pore structure and its impact on oil recovery. Fuel, 237(1), 1029–1039. [Google Scholar]
19. Ge, Q., Yap, Y., Vargas, F., Zhang, M., Chai, J. C. (2013). Numerical modeling of asphaltene deposition. Computational Thermal Sciences: An International Journal, 5(2), 102–113. [Google Scholar]
20. Zanganeh, P., Ayatollahi, S., Alamdari, A., Zolghadr, A., Dashti, H. et al. (2012). Asphaltene deposition during CO2 injection and pressure depletion: A visual study. Energy and Fuels, 26(2), 1412–1419. [Google Scholar]
21. Xiong, R., Guo, J., Kiyingi, W., Luo, H., Li, S. (2023). Asphaltene deposition under different injection gases and reservoir conditions. Chemical Engineering Research Design, 12(3), 142–149. [Google Scholar]
22. Hajizadeh, A., Ravari, R. R., Amani, M. (2009). The comparison of effects of injection of natural/nitrogen gases on asphaltene precipitation process. SPE/EAGE Reservoir Characterization & Simulation Conference, pp. 123–130. Abu Dhabi, United Arab Emirates. [Google Scholar]
23. Nghiem, L. X., Kohse, B. F., Ali, S., Doan, Q. (2000). Asphaltene precipitation: Phase behaviour modelling and compositional simulation. SPE Asia Pacific Conference on Integrated Modelling for Asset Management, pp. 265–277. Yokohama, Japan. [Google Scholar]
24. Khanifar, A., Demiral, B., Darman, N. (2012). Modelling of asphaltene precipitation and deposition during WAG application. IPTC 2012: International Petroleum Technology Conference, pp. 345–352. Jiujiang, China. [Google Scholar]
25. Azizkhani, A., Gandomkar, A. (2020). A novel method for application of nanoparticles as direct asphaltene inhibitors during miscible CO2 injection. Journal of Petroleum Science and Engineering, 185(1), 106661. [Google Scholar]
26. Gandomkar, A., Reza, H. (2020). The role of direct asphaltene inhibitors on asphaltene stabilization during gas injection. Fuel, 282(1), 118827. [Google Scholar]
Cite This Article
 Copyright © 2024 The Author(s). Published by Tech Science Press.
This work is licensed under a Creative Commons Attribution 4.0 International License , which permits unrestricted use, distribution, and reproduction in any medium, provided the original work is properly cited.
 Downloads
 Citation Tools