 Open Access
ARTICLE
Effect of NaCl Concentration on the Cumulative Strain and Pore Distribution of Clay under Cyclic Loading
School of Civil Engineering and Architecture, Hubei University of Technology, Wuhan, 430068, China
* Corresponding Author: Xinshan Zhuang. Email:
Fluid Dynamics & Materials Processing 2024, 20(2), 447-461. https://doi.org/10.32604/fdmp.2023.042220
Received 23 May 2023; Accepted 17 August 2023; Issue published 14 December 2023
Abstract
Clay, as the most common soil used for foundation fill, is widely used in various infrastructure projects. The physical and mechanical properties of clay are influenced by the pore solution environment. This study uses a GDS static/dynamic triaxial apparatus and nuclear magnetic resonance experiments to investigate the effects of cyclic loading on clay foundations. Moreover, the development of cumulative strain in clay is analyzed, and a fitting model for cumulative plastic strain is introduced by considering factors such as NaCl solution concentration, consolidation stress ratio, and cycle number. In particular, the effects of the NaCl solution concentration and consolidation stress ratio on the pore distribution of the test samples before and after cyclic loading are examined, and the relationship between microscopic pore size and macroscopic cumulative strain is obtained accordingly. Our results show that as the consolidation stress ratio grows, an increasing number of large pores in the soil samples are transformed into small pores. As the NaCl solution concentration becomes higher, the number of small pores gradually decreases, while the number of large pores remains unchanged. Cyclic loading causes the disappearance of the large pores in the samples, and the average pore size before cyclic loading is positively correlated with the axial cumulative strain after cyclic loading. The cumulative strain produced by the soil under cyclic loading is inversely proportional to the NaCl solution concentration and consolidation stress ratio.Keywords
With the increase in coastal developments, landfill construction, and land salinization, the impact of salt on soil engineering properties has garnered more attention [1]. Particularly, the negatively charged surfaces of clay particles are influenced by variations in the salt content of pore solutions, resulting in changes in the soil’s macroscopic behavior and the emergence of risks such as uneven foundation settlement and slope instability.
Extensive research has been conducted on the effects of NaCl solutions on the mechanical properties of clay. Zhuang et al. [2], for example, investigated the impact of NaCl solution when mixed with expansive soil on the soil’s cumulative deformation and damping ratio. Yu et al. [3] utilized nuclear magnetic resonance (NMR) to explore the influence of different initial water content and NaCl solution concentrations on the volumetric deformation of kaolin clay, finding that a higher initial water content led to changes in the electric double layer thickness, thus altering the expansiveness of the soil. Additionally, Li et al. [4], through scanning electron microscopy and mercury intrusion experiments, analyzed the impact of NaCl solution on the microstructure of clay. They observed a negative correlation between the electric double layer thickness and sodium ion concentration, with a decrease in the electric double layer thickness resulting in a denser soil matrix and reduced compressibility. Moreover, some researchers have suggested that NaCl solutions can modify the liquid limit of soils, with high liquid limit clay experiencing a decrease while low liquid limit clay experienced an increase as the concentration of NaCl increased [5,6]. Currently, research on the characteristics of clay under pore solutions primarily focuses on static loading, whereas investigations on the impact of NaCl solutions on the dynamic properties and pore distribution of clay under cyclic loading remain relatively scarce.
The analysis and prediction of soil settlement deformation mainly involve two methods: theoretical analysis and empirical fitting [7]. The theoretical analysis method establishes a series of soil dynamic constitutive models to simulate the stress-strain hysteresis curve during cyclic loadings, such as the Iwan model and Martin-Finn-Seed model [8,9]. Although these models have clear concepts, a large number of calculations and a comparison of the assumed values with the calculated values are needed, repeated iterations need to be performed, and adjustments need to be made until the results are coordinated. The empirical fitting method is used to analyze and fit the indoor and outdoor test data and establish the function relationship between soil cumulative strain and the number of cyclic loads; Monismith et al. [10] first used an exponential model to fit the cumulative strain. Based on this, Chai et al. and other researchers [11,12] studied the effects of dynamic and static unbalanced stresses, and Zhang et al. [13] examined soil softening and consolidation factors and improved the exponential model. Due to the accurate prediction results and simple calculations of the empirical fitting method, this method has been widely applied.
This article focused on using the British GDS dynamic and static triaxial apparatus and a MicroMicroM12-025VR NMR rock core analyzer to analyze the cumulative strain effect of a NaCl solution and the consolidation ratio on clay from macroscopic and microscopic perspectives. A cumulative strain prediction model was proposed, and the correlation between pore distribution and cumulative strain was determined.
2 Indoor Dynamic Triaxial Testing
The testing equipment used in this experiment was the British GDS dynamic and static triaxial apparatus, as shown in Fig. 1. This equipment could switch between static triaxial and dynamic triaxial testing by replacing parts and modules. The dynamic loading module of the equipment was used in this experiment. The actuator and servo system were controlled by GDSLAB software to accurately apply axial pressure, unidirectional excitation, confining pressure, back pressure, and other loads. The axial strain, volume strain, and pore water pressure data were measured in real-time and with high accuracy using a 0.0001 mm high-precision sensor, meeting the requirements of the experimental study.
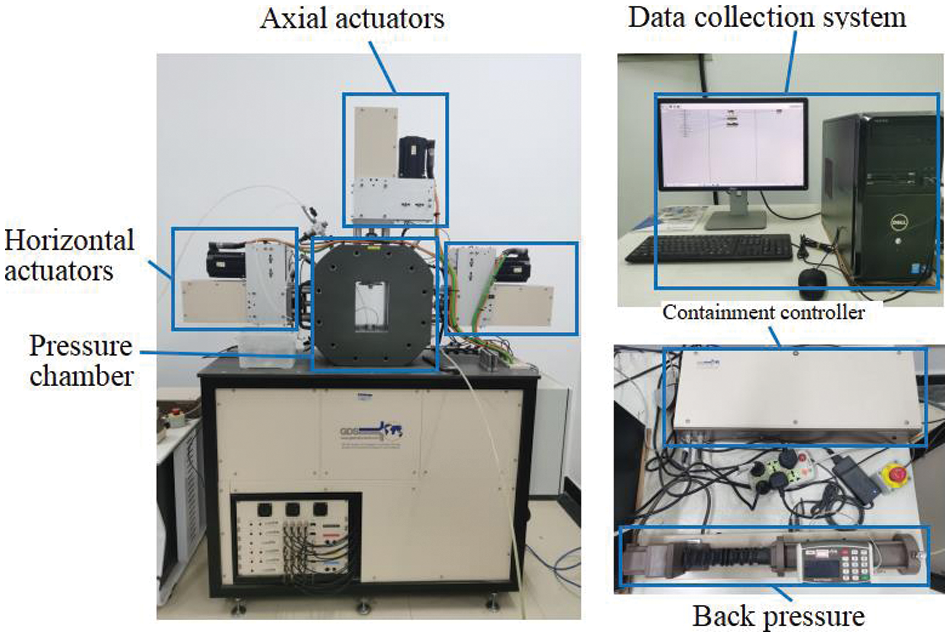
Figure 1: GDS dynamic and static true triaxial instrument and electronic console
The sample used in this experiment was remolded clay taken from a highway project in Honghu City, Hubei Province. The state of the soil was hard plastic. In accordance with the “Standard for Soil Test Methods” (GB/T 50123-2019) [14], indoor compaction tests were carried out to determine the optimal moisture content of the clay, which was 20.3%. X-ray diffraction spectroscopy and X-ray fluorescence emission spectroscopy results showed that the main mineral composition was feldspar (35.19%), quartz (23.19%), muscovite (18.67%), and chlorite (7.67%). The basic physical parameters are presented in Table 1.

The NaCl solution was prepared using 99.5% purity NaCl crystals purchased from CPG Chemicals Co., Ltd. China, and met the GB/T 1266-2006 standard. Deionized distilled water with a pH of 5.8 and conductivity of 1.1 μS/cm was prepared in-house and used as the solvent.
2.3 Experimental Plan for Three-Axis Motion Control
As the civil engineering application of cyclic loads often involves compacted roadbed soils, the clay was crushed, dried, mixed with NaCl solutions of different concentrations (0.25, 0.5, and 0.75 mol/L), and blended at the optimal moisture content to prepare a soil sample with a maximum dry density of 1.6 g/cm³. To ensure that the solution was fully mixed with the clay, it was sealed in a fresh-keeping bag and allowed to stand at room temperature for 24 h. Following the specifications [14], the sample was compacted into five layers with a diameter and height of 50 and 100 mm, respectively, as shown in Fig. 2.
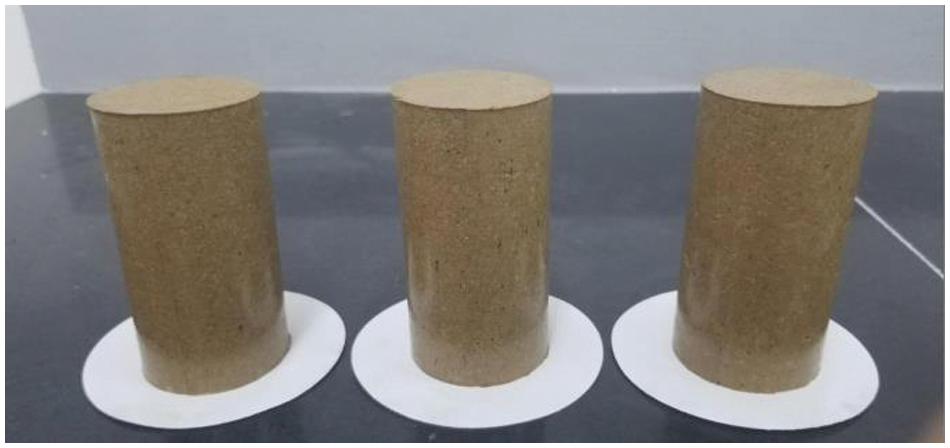
Figure 2: Samples of the tested soil
After preparation, the samples were placed in a vacuum saturation device for 24 h of saturation. To avoid inducing consolidation through penetration, the corresponding NaCl concentration was used during saturation. The samples, wrapped in rubber film, were inserted into the GDS triaxial testing system for back pressure saturation. Throughout this process, it was crucial to maintain a confining pressure that was consistently 20 kPa higher than the back pressure. When the saturation degree reached 0.98 or above, a confining pressure of 100 kPa was applied. To simulate the nonisotropic consolidation state of soil in actual engineering, four consolidation ratios of 1, 1.25, 1.5, and 1.75 were selected for the study. After consolidation, single-stage cyclic loading was conducted with reference to previous research [15] in a set of 5000 cycles. The axial cyclic stress amplitude σd was set at 50 kPa, and the frequency was set at 1 Hz. The consolidated undrained test was conducted according to the test plan shown in Table 2.

As shown in Fig. 3 (using the consolidation ratio of 1.25 for undisturbed soil specimens), the typical stress-strain hysteresis loops of the sample under cyclic loading did not close at the starting and ending points, reflecting the residual strain generated by the soil under cyclic loading. The separation of the loops rapidly decreased during the early stage of loading and tended to be stable in the later stage, indicating a reduction in the rate of increase in the axial strain with increasing cycle number.
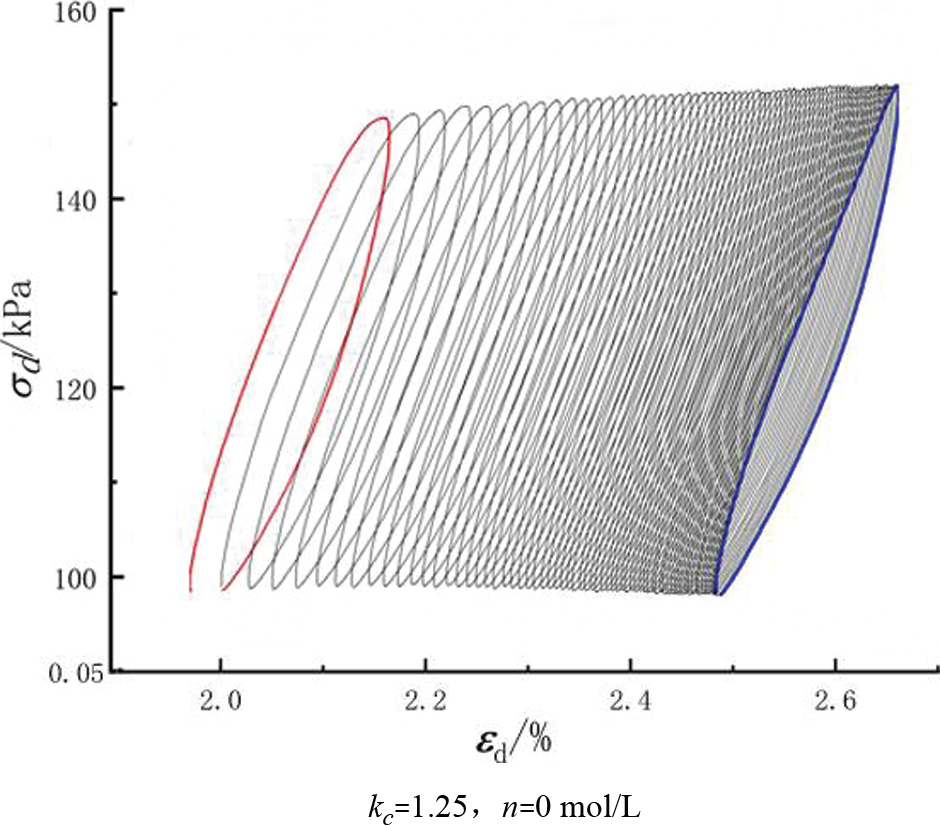
Figure 3: Typical hysteretic curves under single grade loading
Each hysteresis loop consisted of 50 data points, and the average value was used as the cumulative strain for that cycle.
3.2 Effect of the Consolidation Ratio on the Axial Strain
The consolidation ratio kc is an important factor affecting the strain characteristics of saturated clay. The different porosities of specimens with different kc values resulted in different strain characteristics under cyclic loading. Fig. 4 shows the influence of cyclic loading on the cumulative strain of specimens under different consolidation ratios. Under different concentrations of the solution, an increase in the consolidation ratio caused the cumulative strain curve to shift downward as a whole.
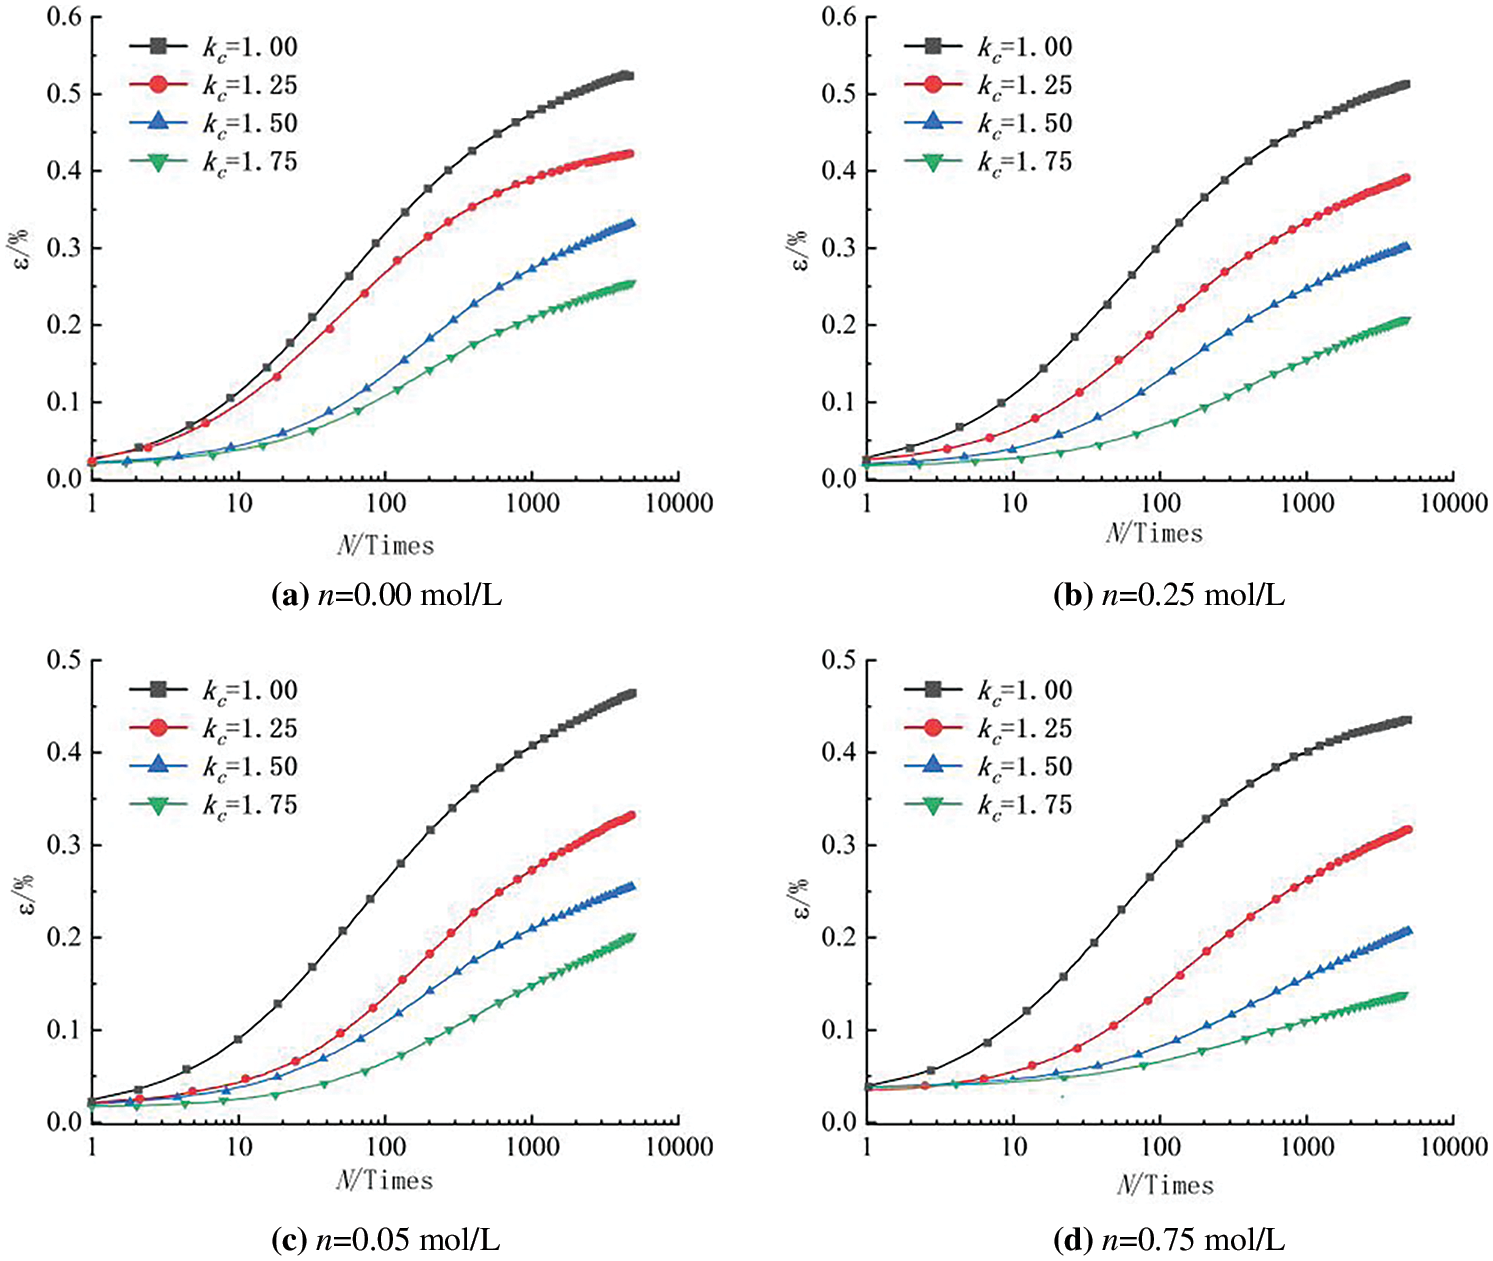
Figure 4: Relationship between the cumulative strain and vibration frequency N under different consolidation ratios
For example, when the consolidation ratio for the sample with a concentration of 0.25 mol/L increased from 1 to 1.25 and to 1.5, the axial strain decreased by 25.04% and 22.95%, respectively, after 5000 cycles of cyclic loading. This occurred because the increase in the consolidation ratio gradually densified the internal pores of the specimen under the action of static deviator stress, improved the overall rigidity of the soil skeleton, and enhanced the ability of the soil to resist cyclic loading. Under the same cyclic loading frequency, a larger consolidation ratio correlated to a smaller axial cumulative strain and slower strain growth rate.
The cumulative strain tended to be stable in the later stage of cyclic loading. The accumulated strain at the end of the test was represented by εmax, and the exponential function (1) was used to describe the relationship between the consolidation ratio and εmax, as shown in Fig. 5. As the consolidation ratio increased, both the maximum accumulated strain εmax and its change rate decreased. This indicated that after the soil reached a higher degree of compaction, the “compression” caused by the increase in the consolidation ratio was weakened. If the consolidation ratio continued to increase, it could exceed the critical value, leading to the failure of the specimen during the cyclic loading stage [15].
where a and b are experimental parameters, and kc represents the consolidation ratio.
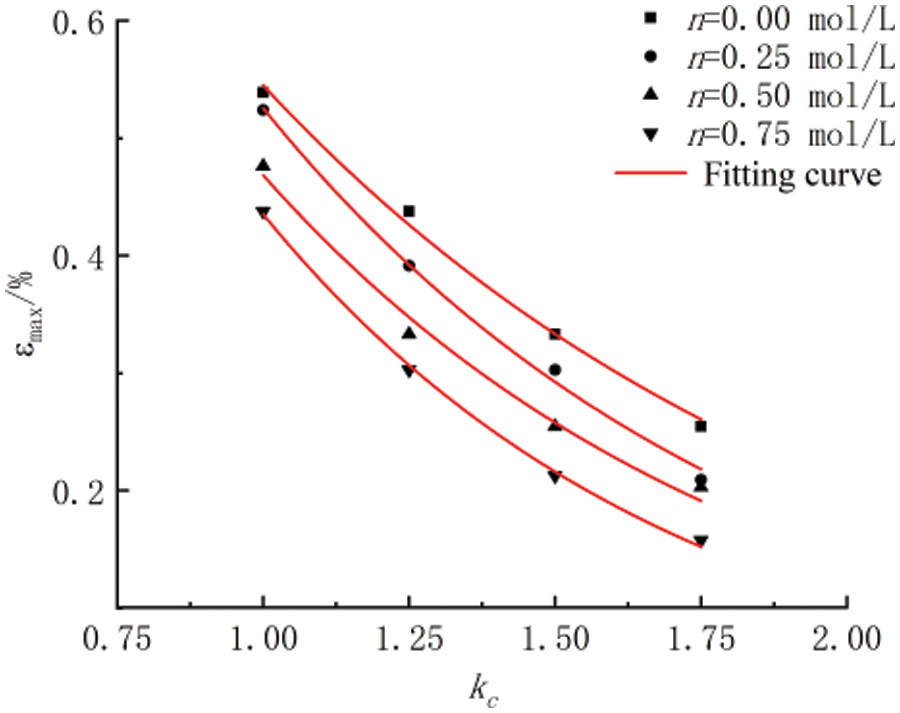
Figure 5: Maximum axial strain accumulations vs. initial consolidation ratios under different concentrations
The fitting degrees R2 of all consolidation ratios were greater than 0.98. The fitting parameters and the fitting degrees are shown in Table 3.

3.3 Effect of Solution Concentration on Axial Strain
Clay particles have a layered silicate structure, and the negative charge between layers can adsorb cations in the solution to form an electric double layer, thereby changing the repulsive force between soil particles and the thickness of the bound water film. Fig. 6 shows the variation in axial strain with cyclic loading frequency for specimens with different solution concentrations. When the solution concentration increased, the axial strain curve shifted downward as a whole, indicating that the ability of the soil to resist cyclic loading increases with increasing cation concentration.
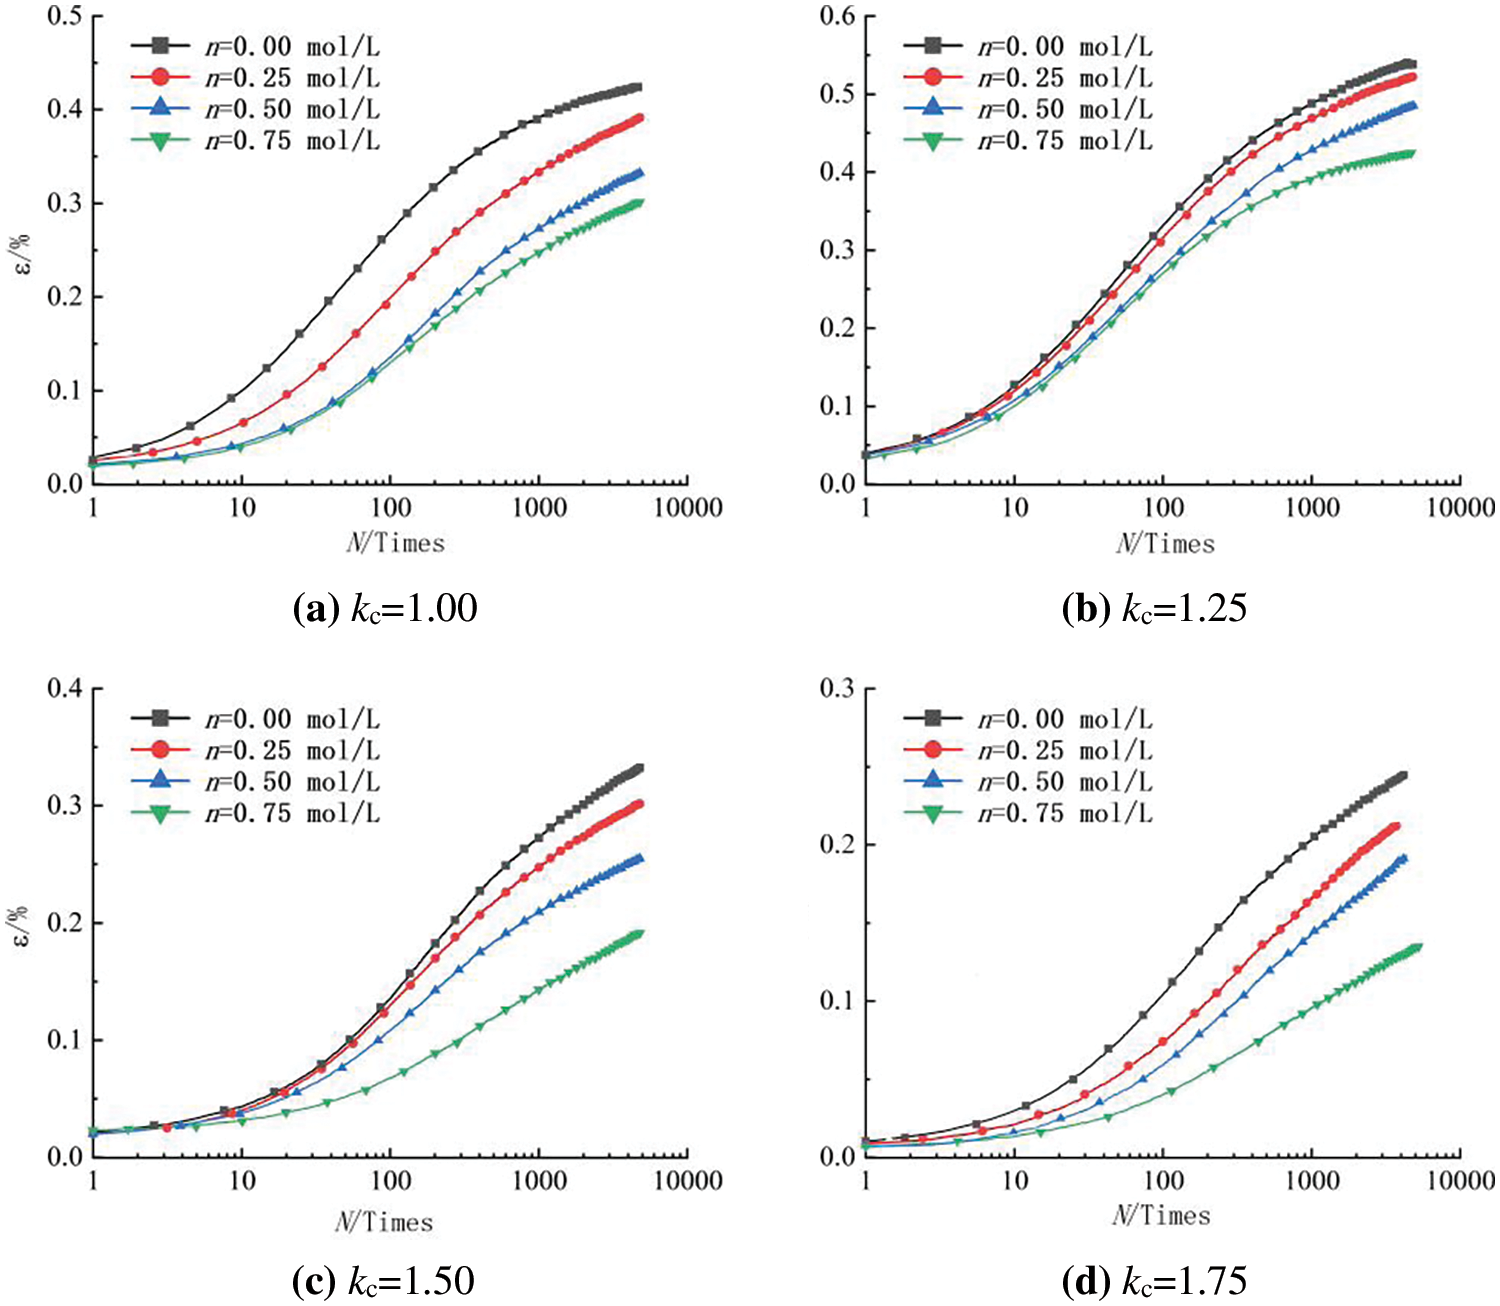
Figure 6: Relationship between the cumulative strain and vibration frequency N under different concentrations
The thickness of the electric double layer is directly related to the concentration of cations in the pore solution, and Eq. (2) expresses the relationship between the two [16].
where 1/K represents the thickness of the double layer; v represents the valence of the ions; T represents the environmental temperature; n represents the concentration of the pore solution; and C represents the dielectric constant of the aqueous solution.
The concentration n is inversely proportional to the thickness 1/K of the double layer. When the NaCl solution concentration increases, more cations are adsorbed onto the clay particles under the action of Coulomb electrostatic force, causing the zeta potential of the surface to decrease, the repulsion to decrease, and the double layer to be compressed, resulting in a decrease in the distance between soil particles. The interaction force between particles is inversely proportional to the distance between particles, and the force can be disregarded when the distance is large. Comparing Figs. 4 and 6 show that the effect of the void ratio was more significant than that of the NaCl solution due to the cation concentration mainly affecting small pores with smaller distances between particles and having a slight effect on the larger pores in the soil.
Fig. 7 shows the relationship between the maximum axial cumulative strain and concentration under different compaction ratios. Both were linearly related, and εmax decreased as the solution concentration increased. The effect of concentration on the maximum vertical cumulative strain was described by the following linear function:
where c and d are the equation parameters. Among them, the intercept of c represents the maximum axial cumulative strain of the undisturbed soil samples at different compaction ratios. When the compaction ratios were 1, 1.25, 1.5, and 1.75, the slopes of d were 0.136, 0.185, 0.187, and 0.098, respectively. R2 was greater than 0.97 in all cases.
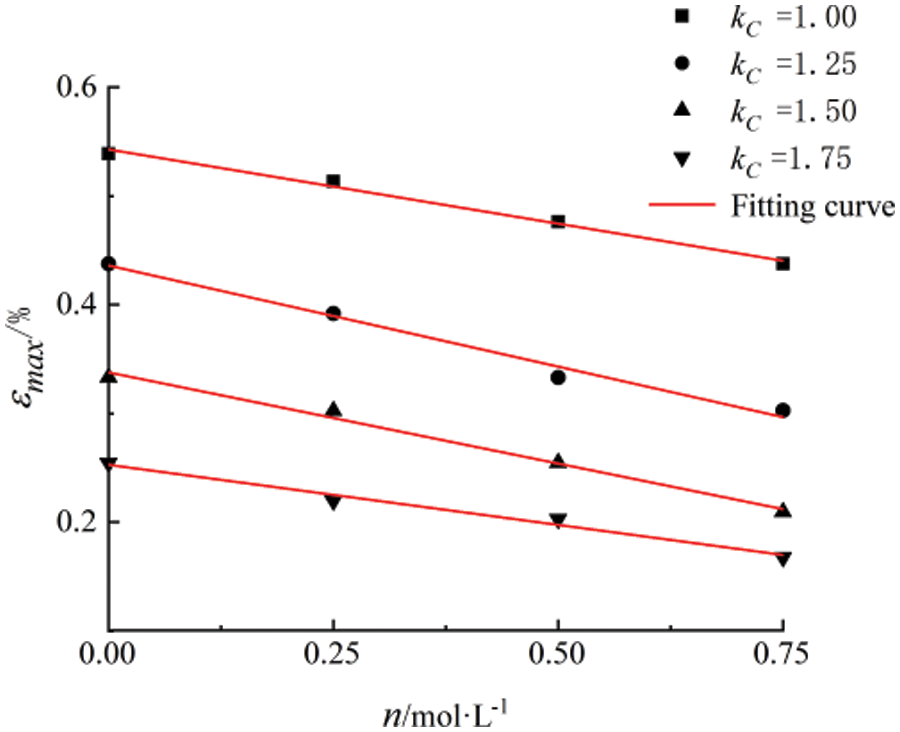
Figure 7: Maximum axial strain accumulations vs. initial consolidation ratios under different consolidation ratios
4 Cumulative Strain Prediction Model
4.1 Establishment of the Predictive Model for Cumulative Strain
Establishing a cumulative deformation prediction model is of great significance for preventing deformation and settlement in actual engineering. Researchers often use exponential models to predict the cumulative strain of soils, such as
where A and B are parameters related to dynamic stress, ε represents the cumulative axial strain, and N represents the number of cycles.
Eq. (4) was proposed by Monismith, but the cumulative strain in the model continuously increased with increasing cycles and did not agree with the actual situation where the cumulative strain tended to be stable. To address this, Zhang et al. [13] improved the exponential model and proposed a fitting model that conformed to the actual trend.
In this study, we referred to the Zhang Yong model and considered the two parameters of NaCl solution concentration and compaction ratio. The following function was proposed to fit the relationship between the axial cumulative strain and the number of cyclic loads.
where kc is the compaction stress ratio; n is the NaCl solution concentration; and j, g, and h are experimentally fitted parameters related to kc and n.
Eq. (5) was used to fit the experimental data, and the results are shown in Fig. 8 (with selected data points labeled). The fitting parameters and coefficients of determination are shown in Table 4.
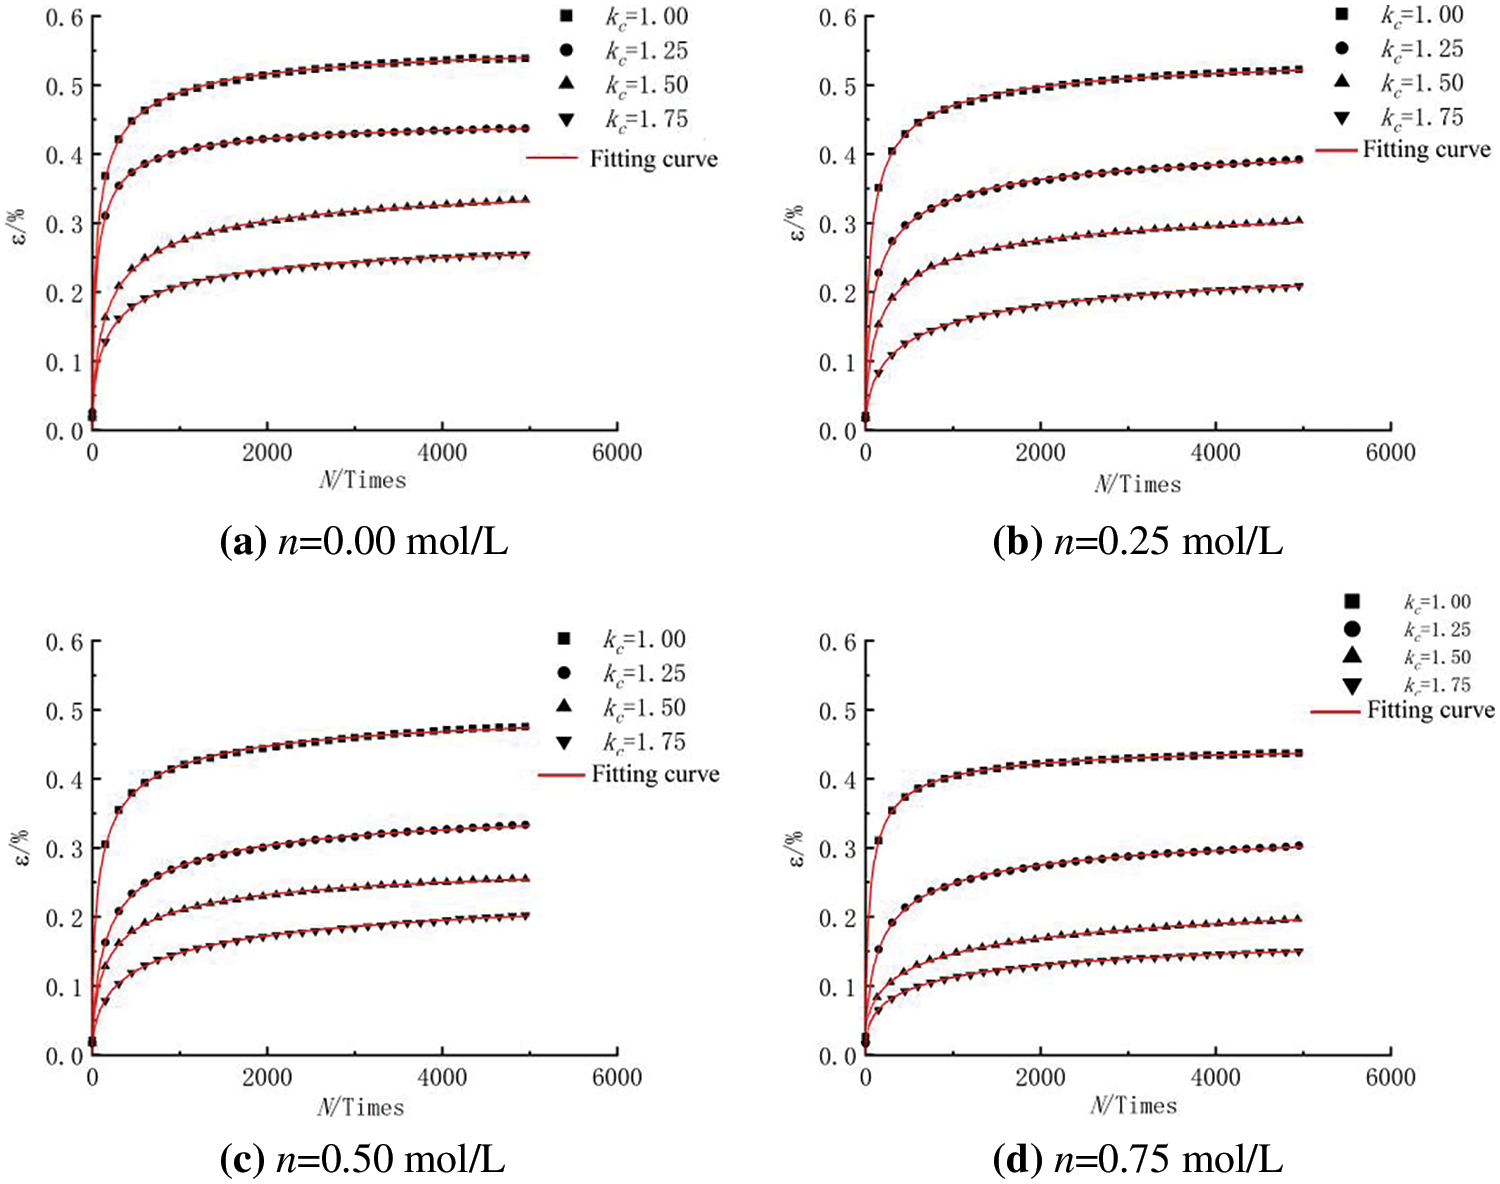
Figure 8: Fitting curves of the axial strain

4.2 Validation of the Predictive Model for Cumulative Strain
To verify the accuracy of the described model, two sets of parallel samples with a compaction ratio of 1.25 and a concentration of 0.25 mol/L were tested, and the experimental data and predicted results are shown in Fig. 9.
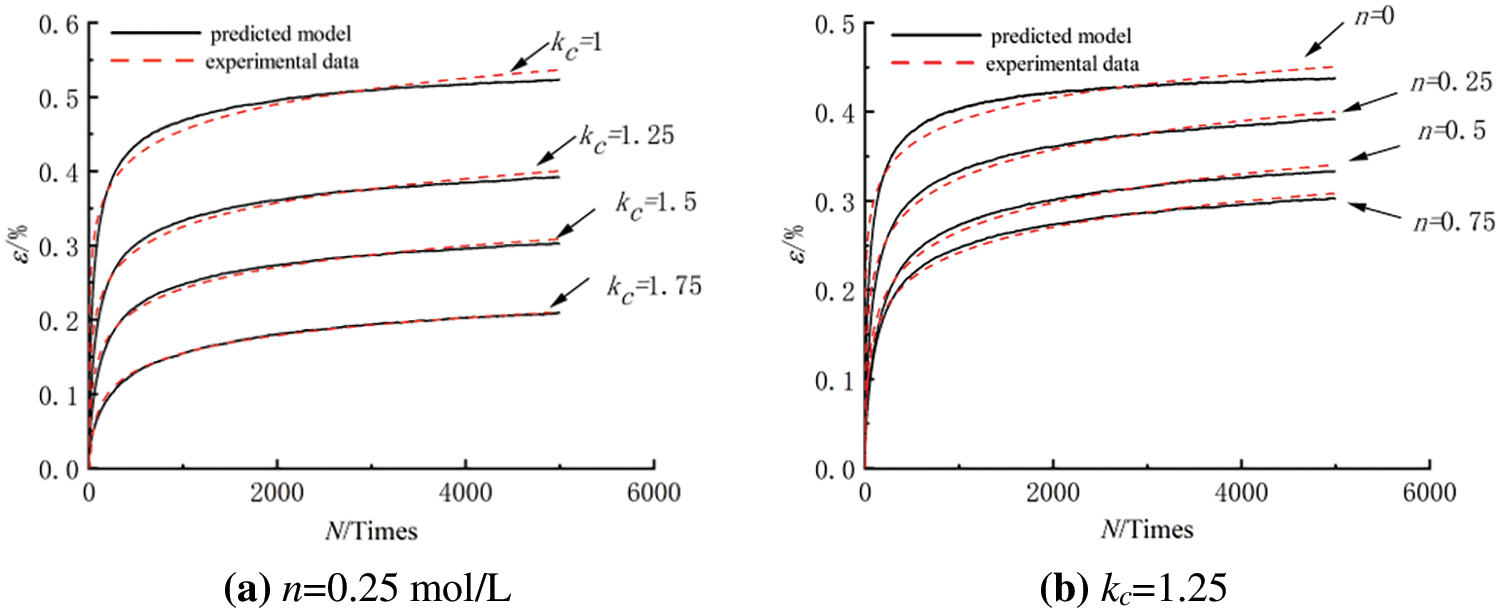
Figure 9: Comparison between the calculated results and experimental data
As shown in Fig. 9, the cumulative axial strain curve obtained by using the predicted model Eq. (5) was generally consistent with the cumulative strain curve obtained by the dynamic triaxial parallel test, indicating that the model was suitable for predicting the cumulative strain of saturated clay considering the NaCl solution concentration and compaction ratio.
4.3 Normalized Cumulative Strain Curve
The relationship between ε/εmax and N/N5000 under conditions of concentrations of 0, 0.25, 0.50, and 0.75 mol/L and compaction ratios of 1, 1.25, 1.5, and 1.75 are shown in Fig. 10.
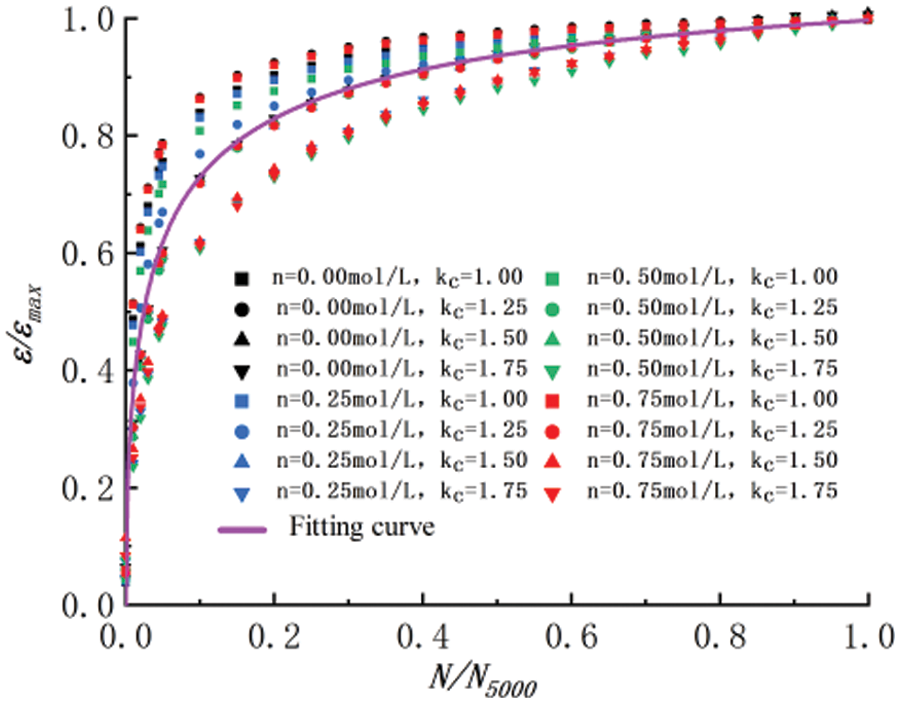
Figure 10: Relationships between ε/εmax and N/N5000 of clayey soil
The sixteen sets of experimental data points were distributed in a band and can be normalized into a curve, as shown in Eq. (6) and the fitted curve in Fig. 10. The fitting correlation coefficient R2 of 0.939 indicated that the fitted curve can be used for settlement prediction within a maximum deviation range of 15.5% and provide a reference for the specific conditions of salt-containing foundations.
The microstructure experiment used the MicroM12-025VR NMR core analyzer produced by Suzhou Newmai Analytical Instrument Co., Ltd. China, NMR scans were performed on the samples before and after cyclic loading to obtain the T2 distribution curve. The basic parameters were as follows: the magnetic field strength was (0.28 ± 0.05) T, the resonance frequency was 12 MHz, and the length of the sampling coil was 25.4 mm.
NMR utilizes pulse excitation of hydrogen nuclei within the sample, collecting signals from the water in the soil. By inverting the signals, an inversion spectrum is obtained, which represents the relationship between signal amplitude and the relaxation time T2 of the pore water in the soil sample. When the soil is saturated and satisfies the assumption of rapid diffusion, the pore size and pore water T2 value satisfy Eq. (7).
where ρ2 is the surface relaxation rate, determined by the material itself and measured via mercury intrusion porosimetry [17]; Spore is the pore surface area; and V is the pore volume.
Assuming the pores in the soil are cylindrical in shape, Eq. (7) can be simplified to Eq. (8).
where D represents the pore diameter.
The pore volume of a certain pore size is expressed by a signal intensity index, which is specifically related to Eq. (9).
where Vi is the total volume of a pore with a certain aperture; Ai is the signal intensity corresponding to a pore with a certain aperture; mw is the total mass of pore water in a saturated sample, and ρw is the density of water, which is 1.0 g/cm³.
5.2 Pore Structure Characteristics
Fig. 11a shows a comparison of the T2 curves before and after cyclic loading. The curve before cyclic loading had a bimodal structure, which was essentially eliminated after cyclic loading. It became unimodal with the maximum peak higher than that before loading. By using Eqs. (7)–(9), the T2 signal intensity curve can be converted to the pore diameter-pore volume curve, as shown in Fig. 11b. The larger pore diameters were mainly distributed at approximately 100.8 μm, and after cyclic loading, most of these larger pores were transformed into smaller pores with diameters of 10−2 to 10−0.5 μm. Numerous studies have shown that there is a typical bimodal pore structure in soil [18]. The bimodal structure has small pores within aggregates and large pores between aggregates in the soil. Cyclic loading causes the small aggregates to combine with each other, resulting in the disappearance of the large pores.
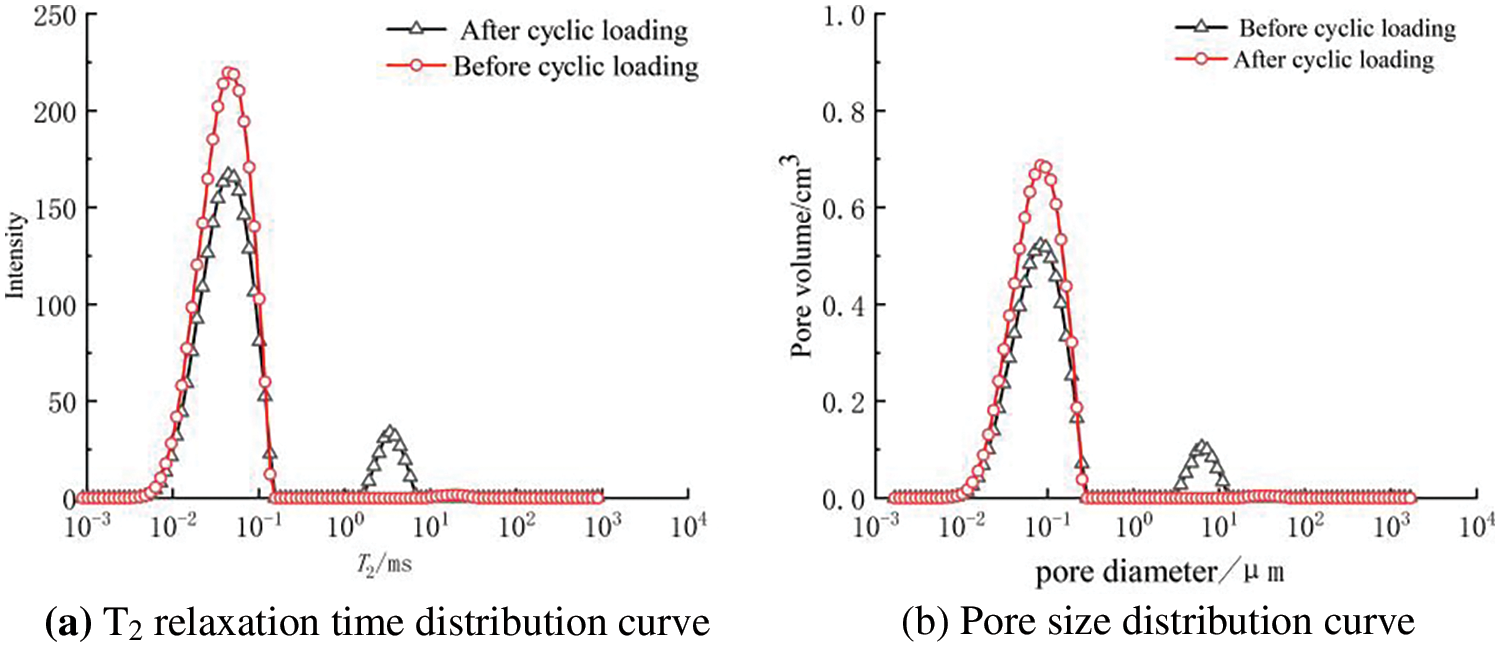
Figure 11: Distribution curves of the T2 time and pore size before and after cyclic loading
5.3 Influence of NaCl Solution and Consolidation Ratio on Pore Distribution
The change in pore size distribution significantly affects various indicators of soil. By comparing the evolution trends of different samples, the microstructure of the soil can be studied more deeply, thus showing the intrinsic mechanism of macroscopic phenomena.
Fig. 12a shows the effect of different consolidation ratios on the T2 time distribution curves at the same concentration. As the consolidation ratio increased, the main peak shifted upward, and the secondary peak shifted downward, indicating a decrease in large pores and an increase in small pores. The area enclosed by the T2 time distribution curve and the abscissa could represent the water content of the soil sample [19,20]; therefore, the ratio of the areas under different curves could be considered the ratio of pore volumes. When the consolidation ratio increased from 1 to 1.25, the changes in the main and secondary peaks were significant; the proportion of small pores increased by 16.2%, and the proportion of large pores decreased by 34.5%. However, when the consolidation ratio increased from 1.5 to 1.75, the degree of curve change significantly decreased; the proportion of small pores increased by only 5.3%, and the proportion of large pores decreased by 2.1%. These results indicated that when the consolidation ratio was small, the pores were sensitive to changes in static shear stress, the cracks gradually disappeared under compaction, the particles slipped and partially broke between the soil particles, and large pores were more easily transformed into small pores. As the consolidation ratio further increased, the change in pore proportion became slighter, and the degree of particle aggregation between the soil particles was significantly stronger than that in the low consolidation state, with a decrease in the proportion of slipping and an increase in the percentage of particle breakage, which was consistent with the results of cumulative strain presented in Section 2.2.
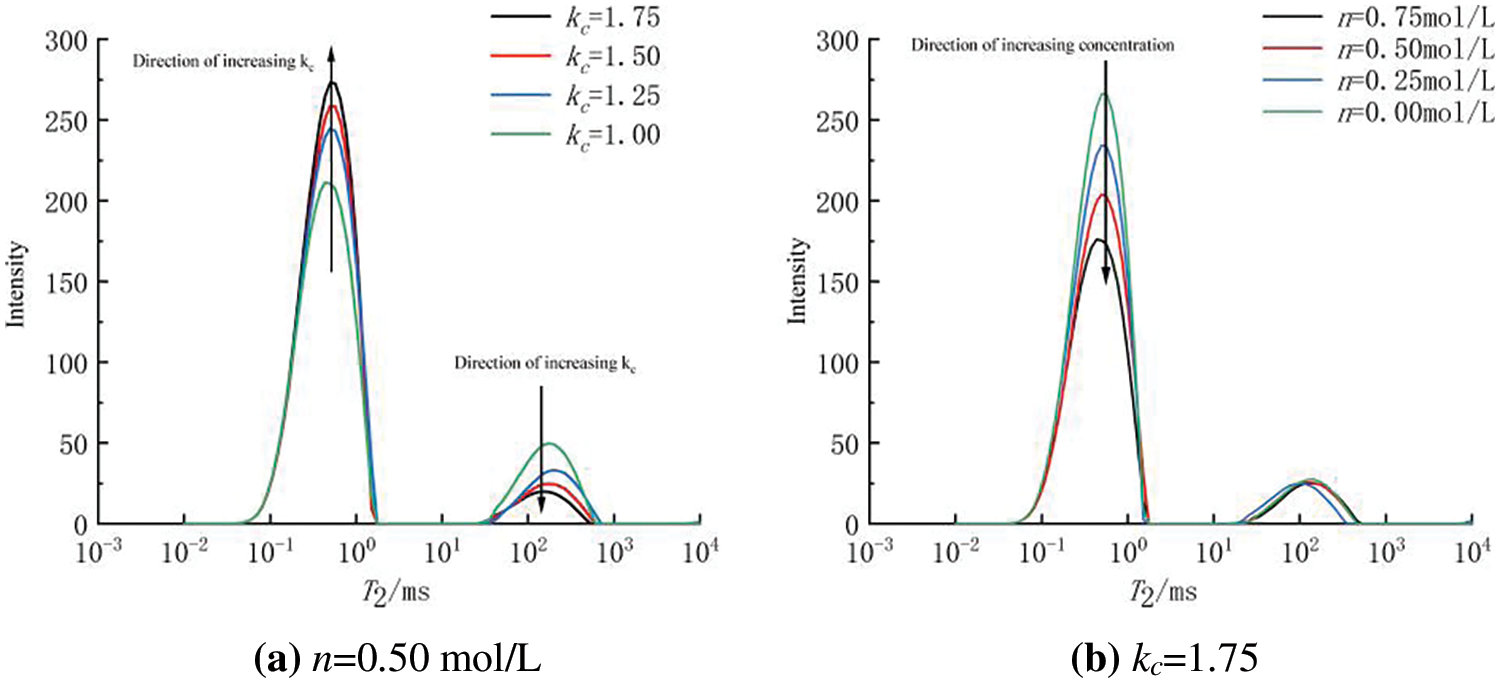
Figure 12: T2 time distribution curve comparison
Fig. 12b shows the effect of changes in NaCl solution concentration on the T2 time curve at the same consolidation ratio. When the solution concentration increased from 0 to 0.75 mol/L, the pore volume of small pores with diameters of 10−2 to 10−0.5 decreased by nearly 32%, while the change in large pores was not sensitive to the concentration. This result indicated that the pore solution mainly affected small pores within the aggregates, causing the soil to be more compact and confirming our deduction from Section 2.3. Mesri et al. [21] believed that an increase in pore solution concentration could cause the shrinkage of clay particle aggregates and lead to a decrease in the volume of internal small pores, which was consistent with the results of this study. Lin et al. [4] also proposed that the increase in sodium ion concentration in the pore solution had a significant agglomeration effect on soil particles. However, when the concentration of NaCl in the solution reached 2 mol/L, long-through pores appeared in the soil, and the impact of this situation on engineering still needs further study.
6 Correlation Between Macroscopic and Microscopic Properties
The ability of soil to resist cyclic loading is closely related to its state before cyclic loading, and there is a certain correlation between the pore size distribution before cyclic loading and the axial cumulative strain after cyclic loading. To quantitatively analyze the relationship between the two, this paper introduces the average pore size, and the calculation formula is as follows:
where
The relationship between the average pore size and the maximum axial cumulative strain before cyclic loading of the sixteen specimens is shown in Fig. 13 with a correlation coefficient R2 of 0.929; a positive correlation was observed between the increase in the average pore size and the gradual increase in cumulative strain. Specimens with larger average pore sizes before cyclic loading were more prone to particle crushing and slipping during loading, resulting in the disappearance of large pores and the generation of small pores; this effect was manifested macroscopically as an increase in axial strain.
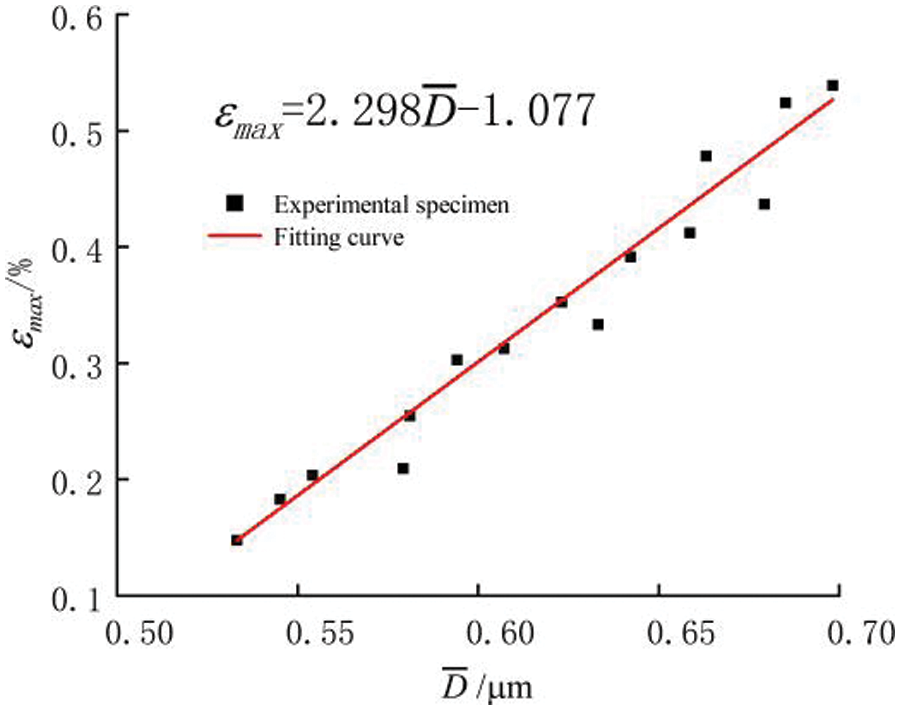
Figure 13: Correlation analysis of pore size and axial strain
(1) The increase in NaCl solution concentration and the consolidation ratio both enhanced the ability of soil specimens to resist cyclic loads; this was manifested as a decrease in the vertical cumulative strain of soil specimens after cyclic loading. The relationships between the NaCl solution concentration and consolidation ratio and the maximum cumulative strain can be described by a linear function and an exponential function, respectively.
(2) A relationship model between strain and cyclic loading times was established, and parallel experiments were conducted to verify the accuracy of the model; good prediction results were obtained. Normalized cumulative strain curves were also plotted.
(3) The consolidation ratio mainly affected the large pores in the soil specimens. An increase in the consolidation ratio compressed large pores and turned them into smaller ones. The NaCl solution concentration mainly affected the small pores, and a thinner electric double layer reduced the number of small pores.
(4) The pore distribution before cyclic loading was positively correlated with the cumulative strain after cyclic loading, indicating that the ability to resist cyclic loading was weaker with an increase in the average pore size.
Acknowledgement: Acknowledgement: We would like to express our sincere gratitude to professors Zhuang Xinshan for their invaluable guidance, patience, and continuous support throughout the completion of this research paper. Furthermore, we extend our appreciation to the academic staff and experts who provided feedback and constructive comments on our work. Lastly, we are thankful to our families and friends for their continuous encouragement and understanding. Without the collective efforts of these individuals, this research would not have been possible.
Funding Statement: The authors received no specific funding for this study.
Author Contributions: Study conception and design: Xinshan Zhuang, Shunlei Xia; data collection: Shunlei Xia; analysis and interpretation of results: Xinshan Zhuang, Shunlei Xia; draft manuscript preparation: Shunlei Xia, Ruijie Pan. All authors reviewed the results and approved the final version of the manuscript.
Availability of Data and Materials: The authors confirm that the data supporting the findings of this study are available within the article.
Conflicts of Interest: The authors declare that they have no conflicts of interest to report regarding the present study.
References
1. Makeen, G. M. H., Awad, S. A., Dilawar, H. (2021). Amelioration of soil expansion using sodium chloride with long-term monitoring of microstructural and mineralogical alterations. Arabian Journal for Science and Engineering, 46(5), 4461–4476. [Google Scholar]
2. Zhuang, X., Zhou, R., Zhou, M., Tao, G., Gin, H. (2022). Expansive soil under cyclic loading of pore solution research on the influence of dynamic characteristics and damping ratio. Rock and Soil Mechanics, 43(S2), 1–10. [Google Scholar]
3. Yu, H., Sun, D., Wei, C., Yan, R. (2019). Characteristics of bentonite with different initial water contents saturated by NaCl solution. Chinese Journal of Geotechnical Engineering, 41(3), 596–600. [Google Scholar]
4. Li, J., Ye, J., Zou, W. (2020). The effect of pore solution on the microstructure of expansive soils. Journal of Huazhong University of Science and Technology (Natural Science Edition), 48(4), 12–17. [Google Scholar]
5. Arasan, S., Yetimoglu, T. (2008). Effect of inorganic salt solutions on the consistency limits of two clays. Turkish Journal of Engineering and Environmental Sciences, 32(2), 107–115. [Google Scholar]
6. Klopp, H., Bleam, W. (2021). The effects of soil solution electrical conductivity and sodium adsorption ratio on soil liquid limit and soil strength. Communications in Soil Science & Plant Analysis, 52(21), 2644–2653. [Google Scholar]
7. Hayashi, H., Yamanashi, T., Hashimoto, H., Yamaki, M. (2018). Shear modulus and damping ratio for normally consolidated peat and organic clay in Hokkaido area. Geotechnical and Geological Engineering, 36(5), 3159–3171. [Google Scholar]
8. Lin, B., Zhang, F., Feng, D. C., Tang, K., Feng, X. (2018). Dynamic shear modulus and damping ratio of thawed saturated clay under long-term cyclic loading. Cold Regions Science and Technology, 145, 93–105. [Google Scholar]
9. Chabot, S., Mercerat, E. D., Glinsky, N., Bonilla, L. F. (2021). An efficient algorithm for sampling the shear-modulus reduction curve in the context of wave propagation using the elastoplastic Iwan model. Geophysical Journal International, 228(3), 1907–1917. [Google Scholar]
10. Monismith, C. L., Ogawa, N., Freeme, C. R. (1975). Permanent deformation characteristics of subgrade soils due to repeated loading. Transport Research Record, 537, 1–17. [Google Scholar]
11. Chai, J., Miura, N. (2002). Traffic-load-induced permanent deformation of road on soft subsoil. Journal of Geotechnical and Geoenvironmental Engineering, 128(11), 907–916. [Google Scholar]
12. Li, D., Sellg, E. T. (1996). Cumulative plastic deformation for fine-grained subgrade soils. Journal of Geotechnical Engineering, 122(12), 1006–1013. [Google Scholar]
13. Zhang, Y., Kong, L., Guo, A. (2009). Cumulative plastic strain of saturated soft clay under cyclic loading. Rock and Soil Mechanics, 30(6), 1542–1548. [Google Scholar]
14. Ministry of Water Resources of the People’s Republic of China (2019). GB/T50123-2019, Standard for soil test methods. Beijing, China: China Planning Press. [Google Scholar]
15. Zhuang, X., Zhao, H., Tao, G., Wang, J., Huang, Y. (2020). Experimental study on cumulative deformation and dynamic strength characteristics of weakly expansive soil under cyclic loading. Rock and Soil Mechanics, 41(10), 3192–3200. [Google Scholar]
16. Mojid, M. A., Cho, H. (2006). Estimating the fully developed diffuse double layer thickness from the bulk electrical conductivity in clay. Applied Clay Science, 33(3/4), 278–286. [Google Scholar]
17. Han, Y., Zhou, C., Fan, Y., Li, C., Yuan, C. et al. (2018). A new permeability calculation method using nuclear magnetic resonance logging based on pore sizes: A case study of bioclastic limestone reservoirs in the A oilfield of the Mid-East. Petroleum Exploration and Development, 45(1), 170–178. [Google Scholar]
18. Kong, B., Ding, Z., He, S., Zhuang, J. (2020). Experimental study on pore features and dynamic behaviors of soft clay under different confine pressures during freezing. Chinese Journal of Rock Mechanics and Engineering, 39(11), 2328–2340. [Google Scholar]
19. Etelvino, H. N., Eduardo, R. A., Gustavo, G., Daniel, M. C., Miguel, C. (2023). Determination of soil pore size distribution and water retention curve by internal magnetic field modulation at low field 1H NMR. Geoderma, 431, 1–15. [Google Scholar]
20. Brax, M., Köhne, M., Kroener, E., Schaumann, G. E. (2019). Potential of NMR relaxometry to unravel the properties of mucilage in several pore sizes. Geoderma, 340, 269–278. [Google Scholar]
21. Mesri, G., Olson, R. E. (1971). Mechanisms controlling the permeability of clays. Clays & Clay Minerals, 19(3), 151–158. [Google Scholar]
Cite This Article
 Copyright © 2024 The Author(s). Published by Tech Science Press.
This work is licensed under a Creative Commons Attribution 4.0 International License , which permits unrestricted use, distribution, and reproduction in any medium, provided the original work is properly cited.


 Submit a Paper
 Propose a Special lssue
 View Full Text
 Download PDF
 Downloads
 Citation Tools