
 Submit a Paper
 Propose a Special lssue
 Open Access
ARTICLE

Fluid-Dynamic Loads on Turbine Blades in Downburst Wind Fields
1 School of Green Energy and Storage, Lanzhou University of Technology, Lanzhou, 730050, China
2 Gansu Provincial Technology Centre for Wind Turbines, Lanzhou, 730050, China
3 School of Energy and Power Engineering, Lanzhou University of Technology, Lanzhou, 730050, China
4 Shanghai Key Laboratory of Mechanics in Energy Engineering, Shanghai Institute of Applied Mathematics and Mechanics, School of Mechanics and Engineering Science, Shanghai University, Shanghai, 200072, China
* Corresponding Author: Yan Wang. Email:
(This article belongs to the Special Issue: Fluid Mechanics & Thermodynamics in Renewable Energy and HVAC Systems)
Fluid Dynamics & Materials Processing 2025, 21(11), 2651-2671. https://doi.org/10.32604/fdmp.2025.070122
Received 08 July 2025; Accepted 20 October 2025; Issue published 01 December 2025
 View Full Text
 Download PDF
Abstract
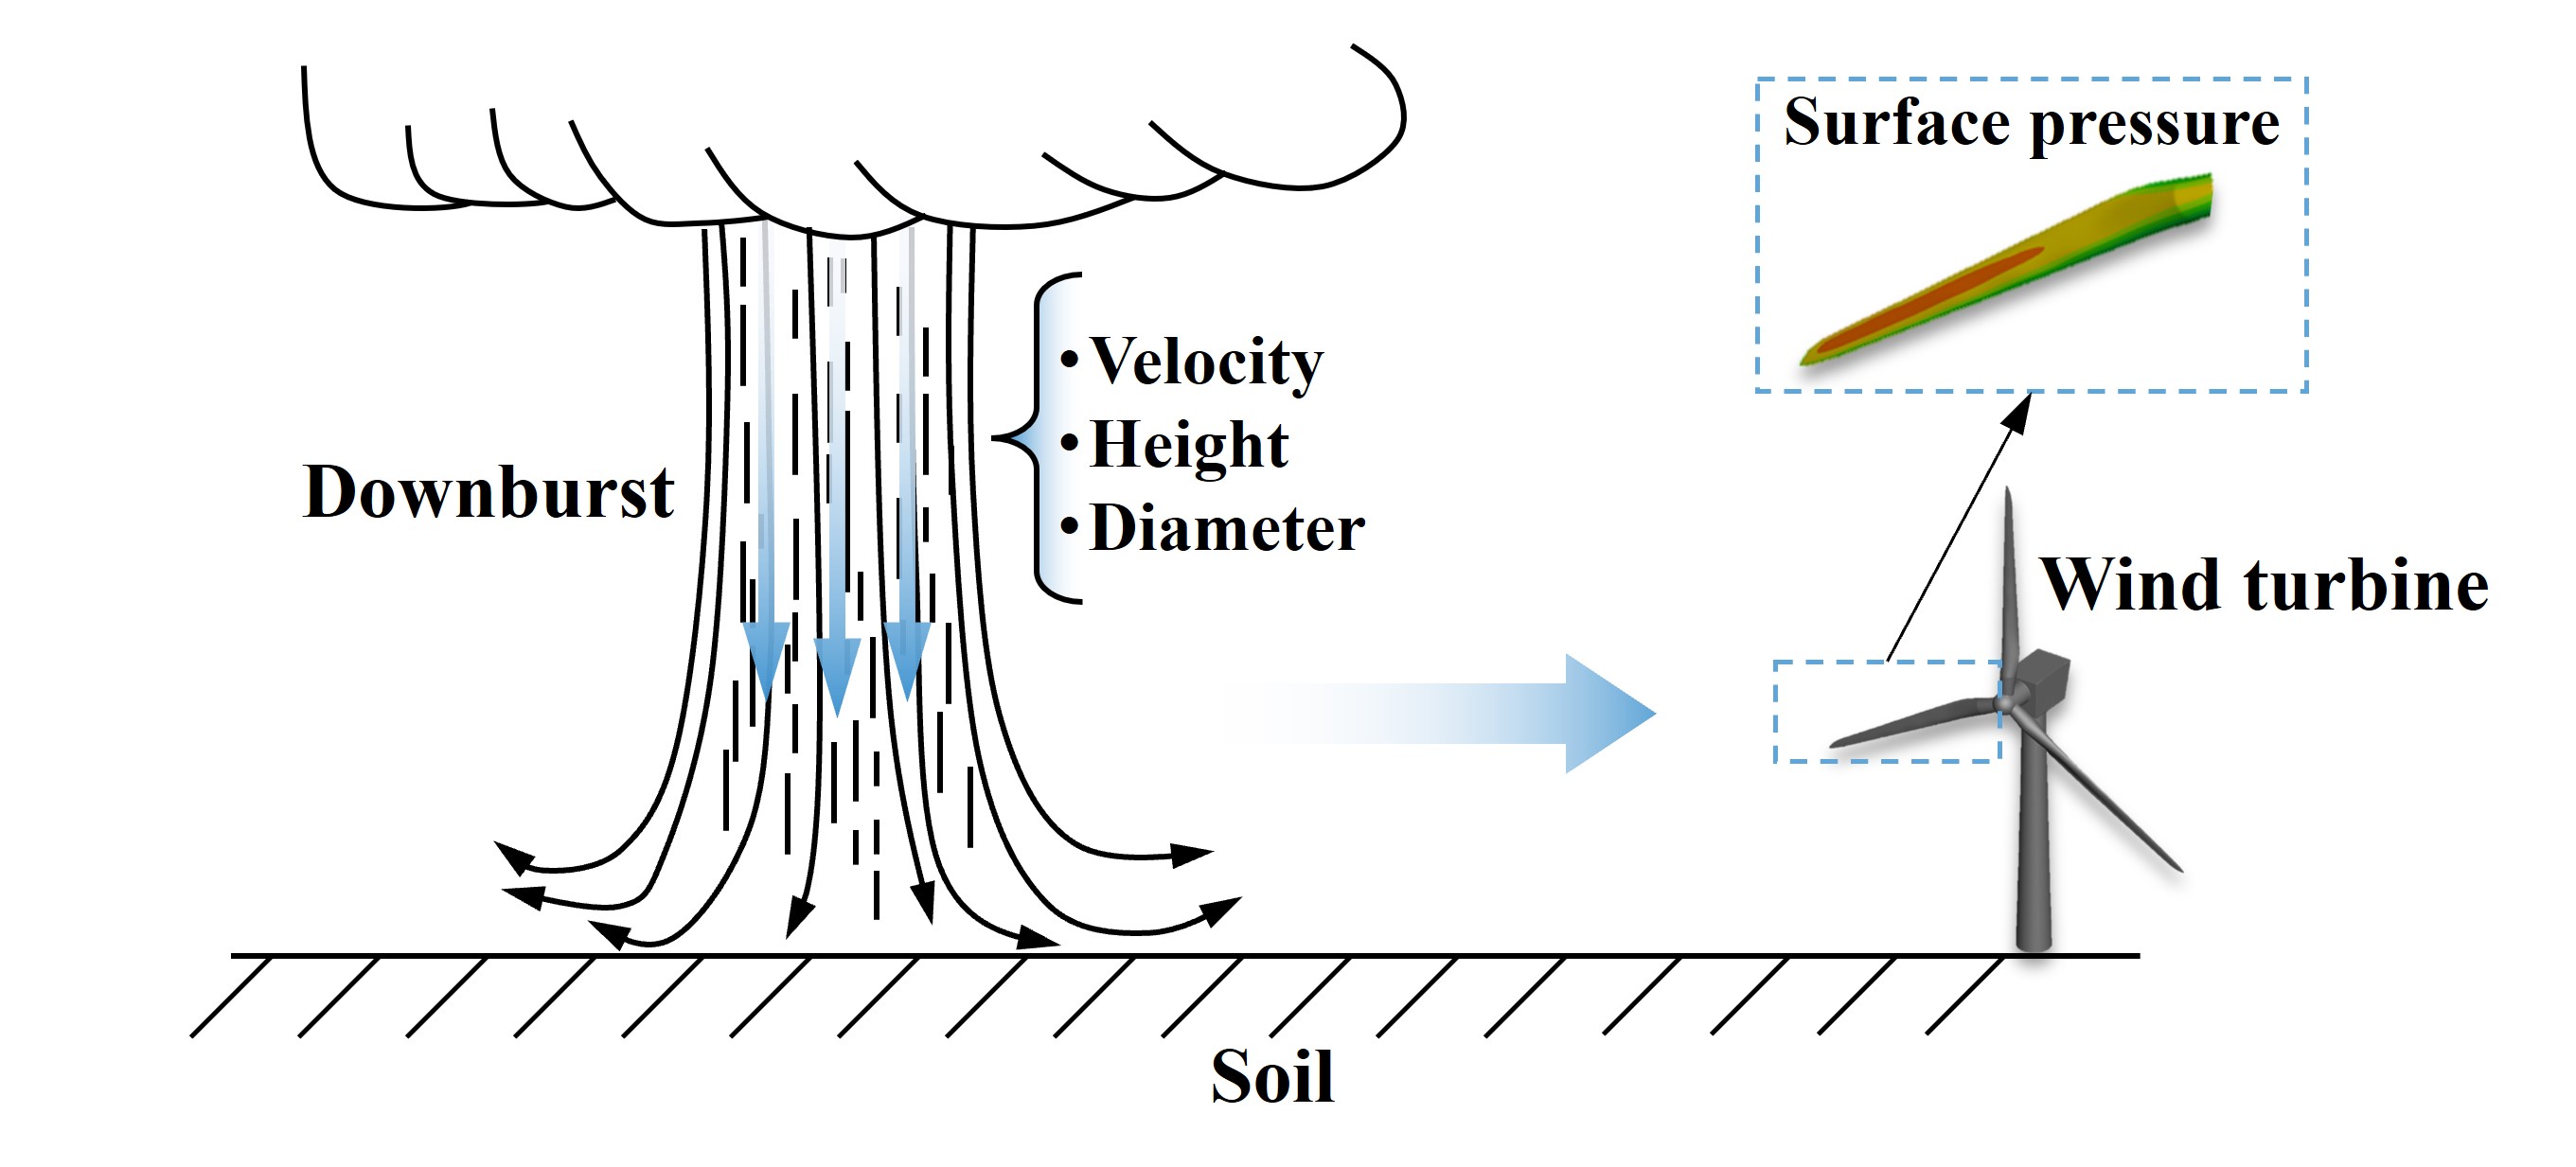
A downburst is a strong downdraft generated by intense thunderstorm clouds, producing radially divergent and highly destructive winds near the ground. Its characteristic scales are expressed through random variations in jet height, velocity, and diameter during an event. In this study, a reduced-scale parked wind turbine is exposed to downburst wind fields to investigate the resulting extreme wind loads. The analysis emphasizes both the flow structure of downbursts and the variations of surface wind pressure on turbine blades under different jet parameters. Results show that increasing jet velocity markedly enhances the maximum horizontal wind speed, while greater jet height reduces the horizontal wind speed and shifts the peak velocity closer to the jet center. Increasing jet diameter primarily affects the radial position of the maximum horizontal wind speed. For the wind turbine, the maximum equivalent stress and blade displacement increase almost linearly with jet velocity, but exhibit the opposite trend with jet diameter. Specifically, as jet velocity rises from 10 m/s to 20 m/s, the surface pressure coefficient at the blade tip increases by approximately 4.5 times. Changes in jet diameter indirectly alter the turbine’s relative position within the wind field, leading to variations in wind load direction and exposure area. Conversely, increasing jet height extends the dissipation path of the downdraft, thereby reducing the intensity of the airflow acting on the blades. For example, when jet height increases from 0.3 m to 1.2 m, the surface pressure coefficient at the blade tip decreases by nearly 50%.Graphic Abstract
Keywords
Downbursts, as severe convective weather phenomena characterized by intense downdrafts, pose substantial threats to wind turbines, low-rise buildings, and power transmission lines because of their abrupt onset and destructive near-surface wind speeds, which can locally exceed 75 m/s [1]. With the increasing size of wind turbine blades, turbines operating within downburst wind fields are exposed to extreme events caused by localized strong winds, often leading to severe structural damage and substantial economic losses in wind farms [2,3]. Early studies have shown that the initial diameter, height above ground, and maximum downward velocity of cumulus clouds during downburst formation vary within specific ranges [4]. This highlights the need for a systematic investigation of downburst wind field characteristics under varying jet parameters.
With the increasing frequency of downburst events, the previous study focused on the wind field structure of downbursts under different jet parameters and the wind pressure characteristics on the surface of wind turbines. The direct method was deployed to obtain the wind profile of a downburst, which mainly focuses on field measurements. Notable measurement projects include the Northern Illinios Meteorological Research on Downburst (NIMROD) project [5], the Microburst and Sever Thunderstorm (MIST) project [6], and the measurement project by Texas Tech University (TTU) [7]. However, the complexity of the external environment makes it difficult to ensure the accuracy of the measured results. Consequently, the development of numerical simulations has played a significant role in the calculation of downburst wind fields [8]. For instance, Canepa et al. [9] studied downburst wind fields using an inclined impinging jet model, finding that variations in jet parameters influence both the maximum horizontal wind speed and its spatial distribution. Chay et al. [10] compared the characteristics of wind profiles under different jet exit velocities and jet diameters. Their results indicated that smaller jet diameters produce lower non-turbulent wind speeds and different jet velocities also alter the state of fluid flow and separation. Chen et al. [11] constructed an experimental platform for simulating downburst effects and proposed a phenomenological model for obtaining wind speed time histories under different impinging wind parameters. Le and Caracoglia [12] developed a multi-blade flow device to simulate non-stationary gust fronts in a small-scale wind tunnel, and the results showed that this system could replicate key features of downburst wind speed distribution, with different operating conditions affecting velocity fluctuations and changes in the wind field structure. Mengistu et al. [13] monitored the wind-excited response of a structure during two downburst events, finding a strong correlation between the square of the mean wind speed and both mean displacement and fluctuating displacement. Iida and Uematsu [14] investigated the effects of storm movement and impinging jets on downburst wind profiles, finding that the movement of the downdraft is strongly related to changes in wind pressure distribution on buildings. The aforementioned studies have revealed that variations in jet parameters can significantly alter the maximum horizontal wind speed and its location within the wind field, as well as substantially modify the wind field structure and the shape of the wind profile.
Most studies have focused on the surface wind pressure characteristics of buildings in downburst wind fields to reveal the wind load under this weather condition. For instance, Jubayer et al. [15] simulated the pressure distribution on low-rise buildings in a downburst environment, they found similarities in the overall trends but differences in average pressure coefficients. This comparison emphasized the importance of studying structural loads under downburst configurations. Romanic et al. [16] studied the pressure distribution on cylinders under downburst-like outflows, finding that the location of the cylinders within the wind field significantly influenced the aerodynamic coefficients, with higher drag observed in atmospheric boundary layer winds compared to downburst conditions, and negative lift during the primary vortex passage near the base. Zhang et al. [17] simulated the wind pressure distribution of high-rise buildings at different positions of wind field and various windward angles, further revealed the feature of surface wind pressure distribution under these conditions. Lombardo et al. [18] studied a downburst event on a full-scale low-rise building. The event showed rapid changes in wind speed, direction, and loading, with atypical vertical wind profiles. Their findings revealed that the maximum positive pressure on the windward surface occurred during the ramp-up and ramp-down phases, with pressure variations similar to those caused by atmospheric boundary layer winds.
Wind turbines have indeed suffered damage under thunderstorm downburst conditions, underscoring the severe economic and safety implications for wind energy infrastructure. Downburst outflows can produce intense, transient wind loads that exceed those seen in normal atmospheric boundary layer winds, with near-surface gusts sometimes surpassing 75–80 m/s, leading to structural failures and costly downtime [19,20]. Such extreme convective wind events have been linked to turbine blade damage and even full tower collapse in rare cases, resulting in not only significant repair and replacement costs but also hazards to personnel and grid reliability. However, conventional design standards (IEC-61400) currently do not adequately account for the unique wind field characteristics of downbursts [21]. This gap between design practice and reality highlights the importance of dedicated downburst-focused research for wind turbines. Indeed, thunderstorm downbursts pose a distinct risk profile for wind farms that demands further investigation and better mitigation strategies [22]. Early work by Kim and Hangan [21] successfully simulated an impinging jet downdraft using Reynolds averaged Navier–Stokes equations and captured a reasonable “ring vortex” wind field structure spreading radially along the ground. Wenz et al. [23] simulated and assessed the surface pressure fluctuations on the tower and blades in both simple and complex terrains, concluding that the pressure fluctuations on the blades primarily occur with the rotational frequency. Wu [24] implemented User-Defined Function (UDF) to specify regional motion, achieving the simulation of moving downbursts, further exploring the wind pressure distribution characteristics of wind turbines in the wind field of moving downbursts under different jet parameters. Nguyen and Manuel [25] conducted simulations of downburst events striking a wind farm and found that the correlated high winds can impose far greater loads on turbines than standard design gusts, raising the probability of tower buckling or blade failure. A series of studies by Nguyen and co-authors in the following years further quantified turbine extreme and fatigue loads under idealized microburst outflows, using both deterministic and Monte Carlo frameworks, and emphasized the inadequacy of treating downburst winds with stationary design models. Additionally, field-inspired case studies like the Buffalo Ridge wind farm downburst event have been simulated, illustrating how a sudden downburst can trigger rapid ramp-down of turbine power and structural alarms [19].
The abovementioned studies indicates that jet parameters significantly influence the wind profile and structure of downburst wind fields, as well as the wind pressure distribution features on wind turbines within the wind field. There are still some limitations should be revealed: (1) existing research has not systematically considered the potential impacts of multiple jet parameters; (2) studies on surface wind pressure under downburst conditions have mainly concentrated on different building shapes; (3) wind turbine surface wind pressure have been limited to single jet parameters, without a systematic consideration of the surface pressure distribution under multiple jet parameters. The feature of surface pressure changes on wind turbines in downburst wind fields with multiple jet parameters have not been evaluated, and the structural deformation of wind turbines under the combined influence of several jet parameters requires further examination.
The present study addresses this gap by providing a systematic analysis of multiple jet parameter combinations and their effects on both the downburst wind field and wind turbine response. In contrast to earlier works that often fixed one or more downburst parameters, here the jet velocity, jet height, and jet diameter are varied across wide ranges in a coordinated parametric framework. This comprehensive approach allows us to evaluate how each parameter influences the radial and vertical wind profiles, and crucially, how these wind field changes translate into pressure loads and structural deformations on a representative wind turbine. By assessing numerous downburst scenarios, our study offers new insights into the worst-case pressure distributions on turbine blades and the resulting stress levels. The innovative contribution lies in clarifying the interdependent impacts of multiple downburst parameters on wind turbine performance—an aspect that has received limited attention in the literature. Ultimately, this work enhances the understanding of downburst-induced wind turbine risks and provides valuable guidance for the design and protection of wind farms against these severe transient wind events.
The numerical simulation of downburst wind fields in this study was performed using the computational fluid dynamics (CFD) approach based on the finite volume method (FVM). The governing equations consist of the continuity equation and the incompressible Navier–Stokes equations, which describe the conservation of mass and momentum in the flow field. These equations are expressed as follows:
The model constants are:
3.1 Calculation Domain and Boundary Conditions
The simulation of downbursts in wind engineering often employs the impinging jet model, which facilitates parametric studies focusing on parameters such as jet diameter and wind speed [29]. To ensure computational feasibility, a reduced-scale model is adopted, the geometric scale is 1:2000 (jet diameter reduced from 600 m to 0.3 m), and the velocity scale is approximately 1:3, consistent with prior downburst studies [30]. This scaling allows representation of a prototypical downburst (jet diameter ~600 m, jet height ~3000 m) within a manageable computational domain of 20Djet × 20Djet × 6Djet, as shown in Fig. 1. However, this entails a Reynolds-number mismatch: the scaled model Re~(O (105), based on 0.3 m diameter and 20 m/s jet velocity) is several orders lower than full-scale values (O (109)). As a consequence, the model flow may develop relatively thicker boundary layers and earlier separation, potentially leading to conservative estimates of peak pressure coefficients. No turbulence-intensification or surface roughness corrections were applied. Nevertheless, previous studies have shown that impinging jet flows are dominated by inertia and the essential outflow structures are well reproduced at reduced scale [31]. Thus, although absolute magnitudes may differ, the parametric trends and flow-field evolution remain reliable.
The mesh used for the numerical simulation in this paper is generated by ICEM, with the O-block splitting technique employed for meshing the calculation domain. The boundary conditions of the computational model are set according to the flow characteristics of downbursts: a velocity inlet is set, the outlet boundary is set as a pressure outlet, the bottom surface is treated with no-slip conditions, and the jet wall is set as a slip wall for simulation calculations. The time step was determined based on the Courant–Friedrichs–Lewy (CFL) condition, with CFL maintained below 1 to ensure numerical stability, which corresponded to a step size of about 0.01 s. With 1500 solution steps, the complete lifecycle of the downburst was captured.
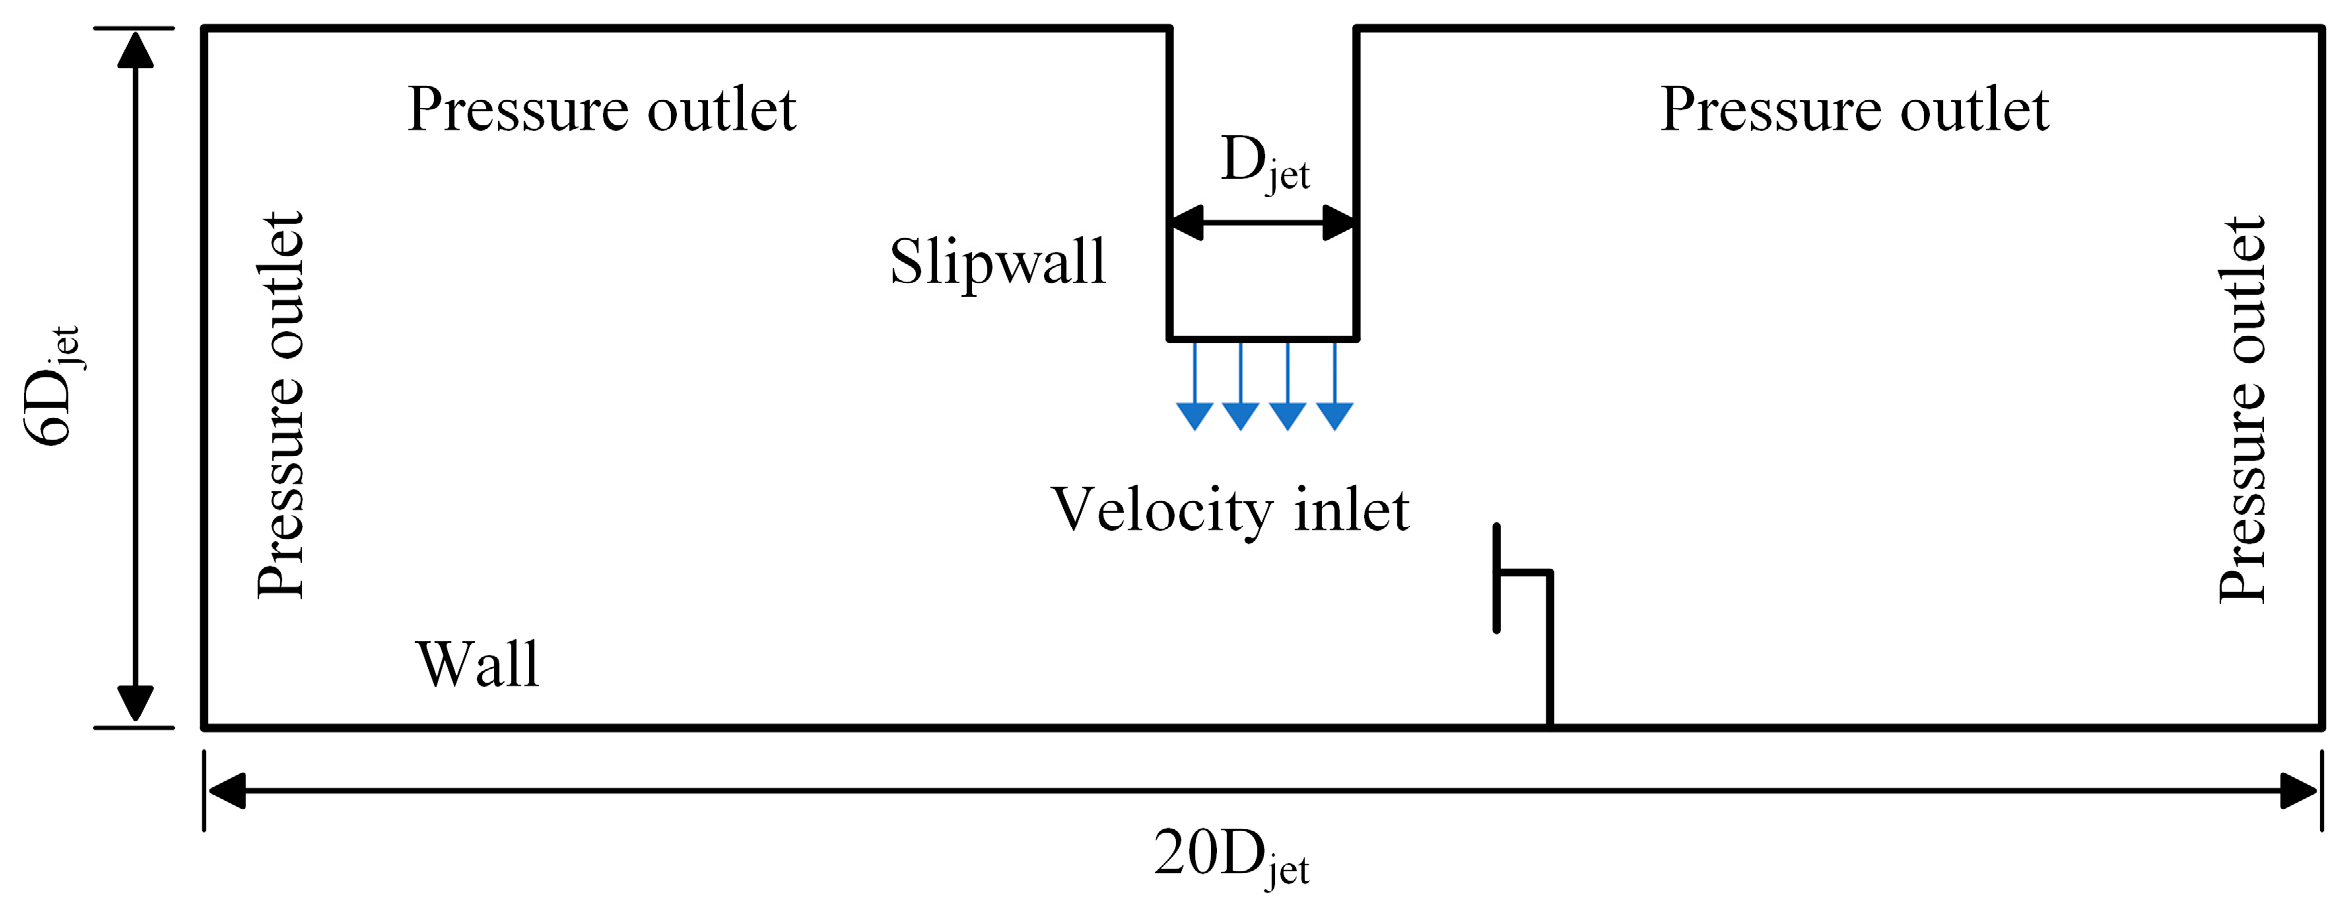
Figure 1: Calculation domain and boundary conditions.
To evaluate the effect of mesh resolution on the accuracy of numerical simulations, a grid independence study was conducted using five different grid densities, namely 0.5 million (case 1), 1.12 million (case 2), 2.28 million (case 3), 4.31 million (case 4), and 6.0 million (case 5) cells. Vertical wind velocity profiles at identical monitoring points were compared across these grids, as shown in Fig. 2. The relative error was calculated with respect to case 5. The results show that once the grid resolution reaches case 3 (2.28 million cells), the relative deviations of the vertical wind speed in the near-ground region (0–0.25 m) and in the interval of 0–0.1 remain nearly unchanged with further grid refinement. The difference between case 3 and the finer grids (cases 4 and 5) is within 2%. Therefore, considering both numerical accuracy and computational efficiency, the grid with 2.28 million cells (case 3) was selected for all subsequent simulations. The global and vertical cross-sectional grid distributions are shown in Fig. 3.
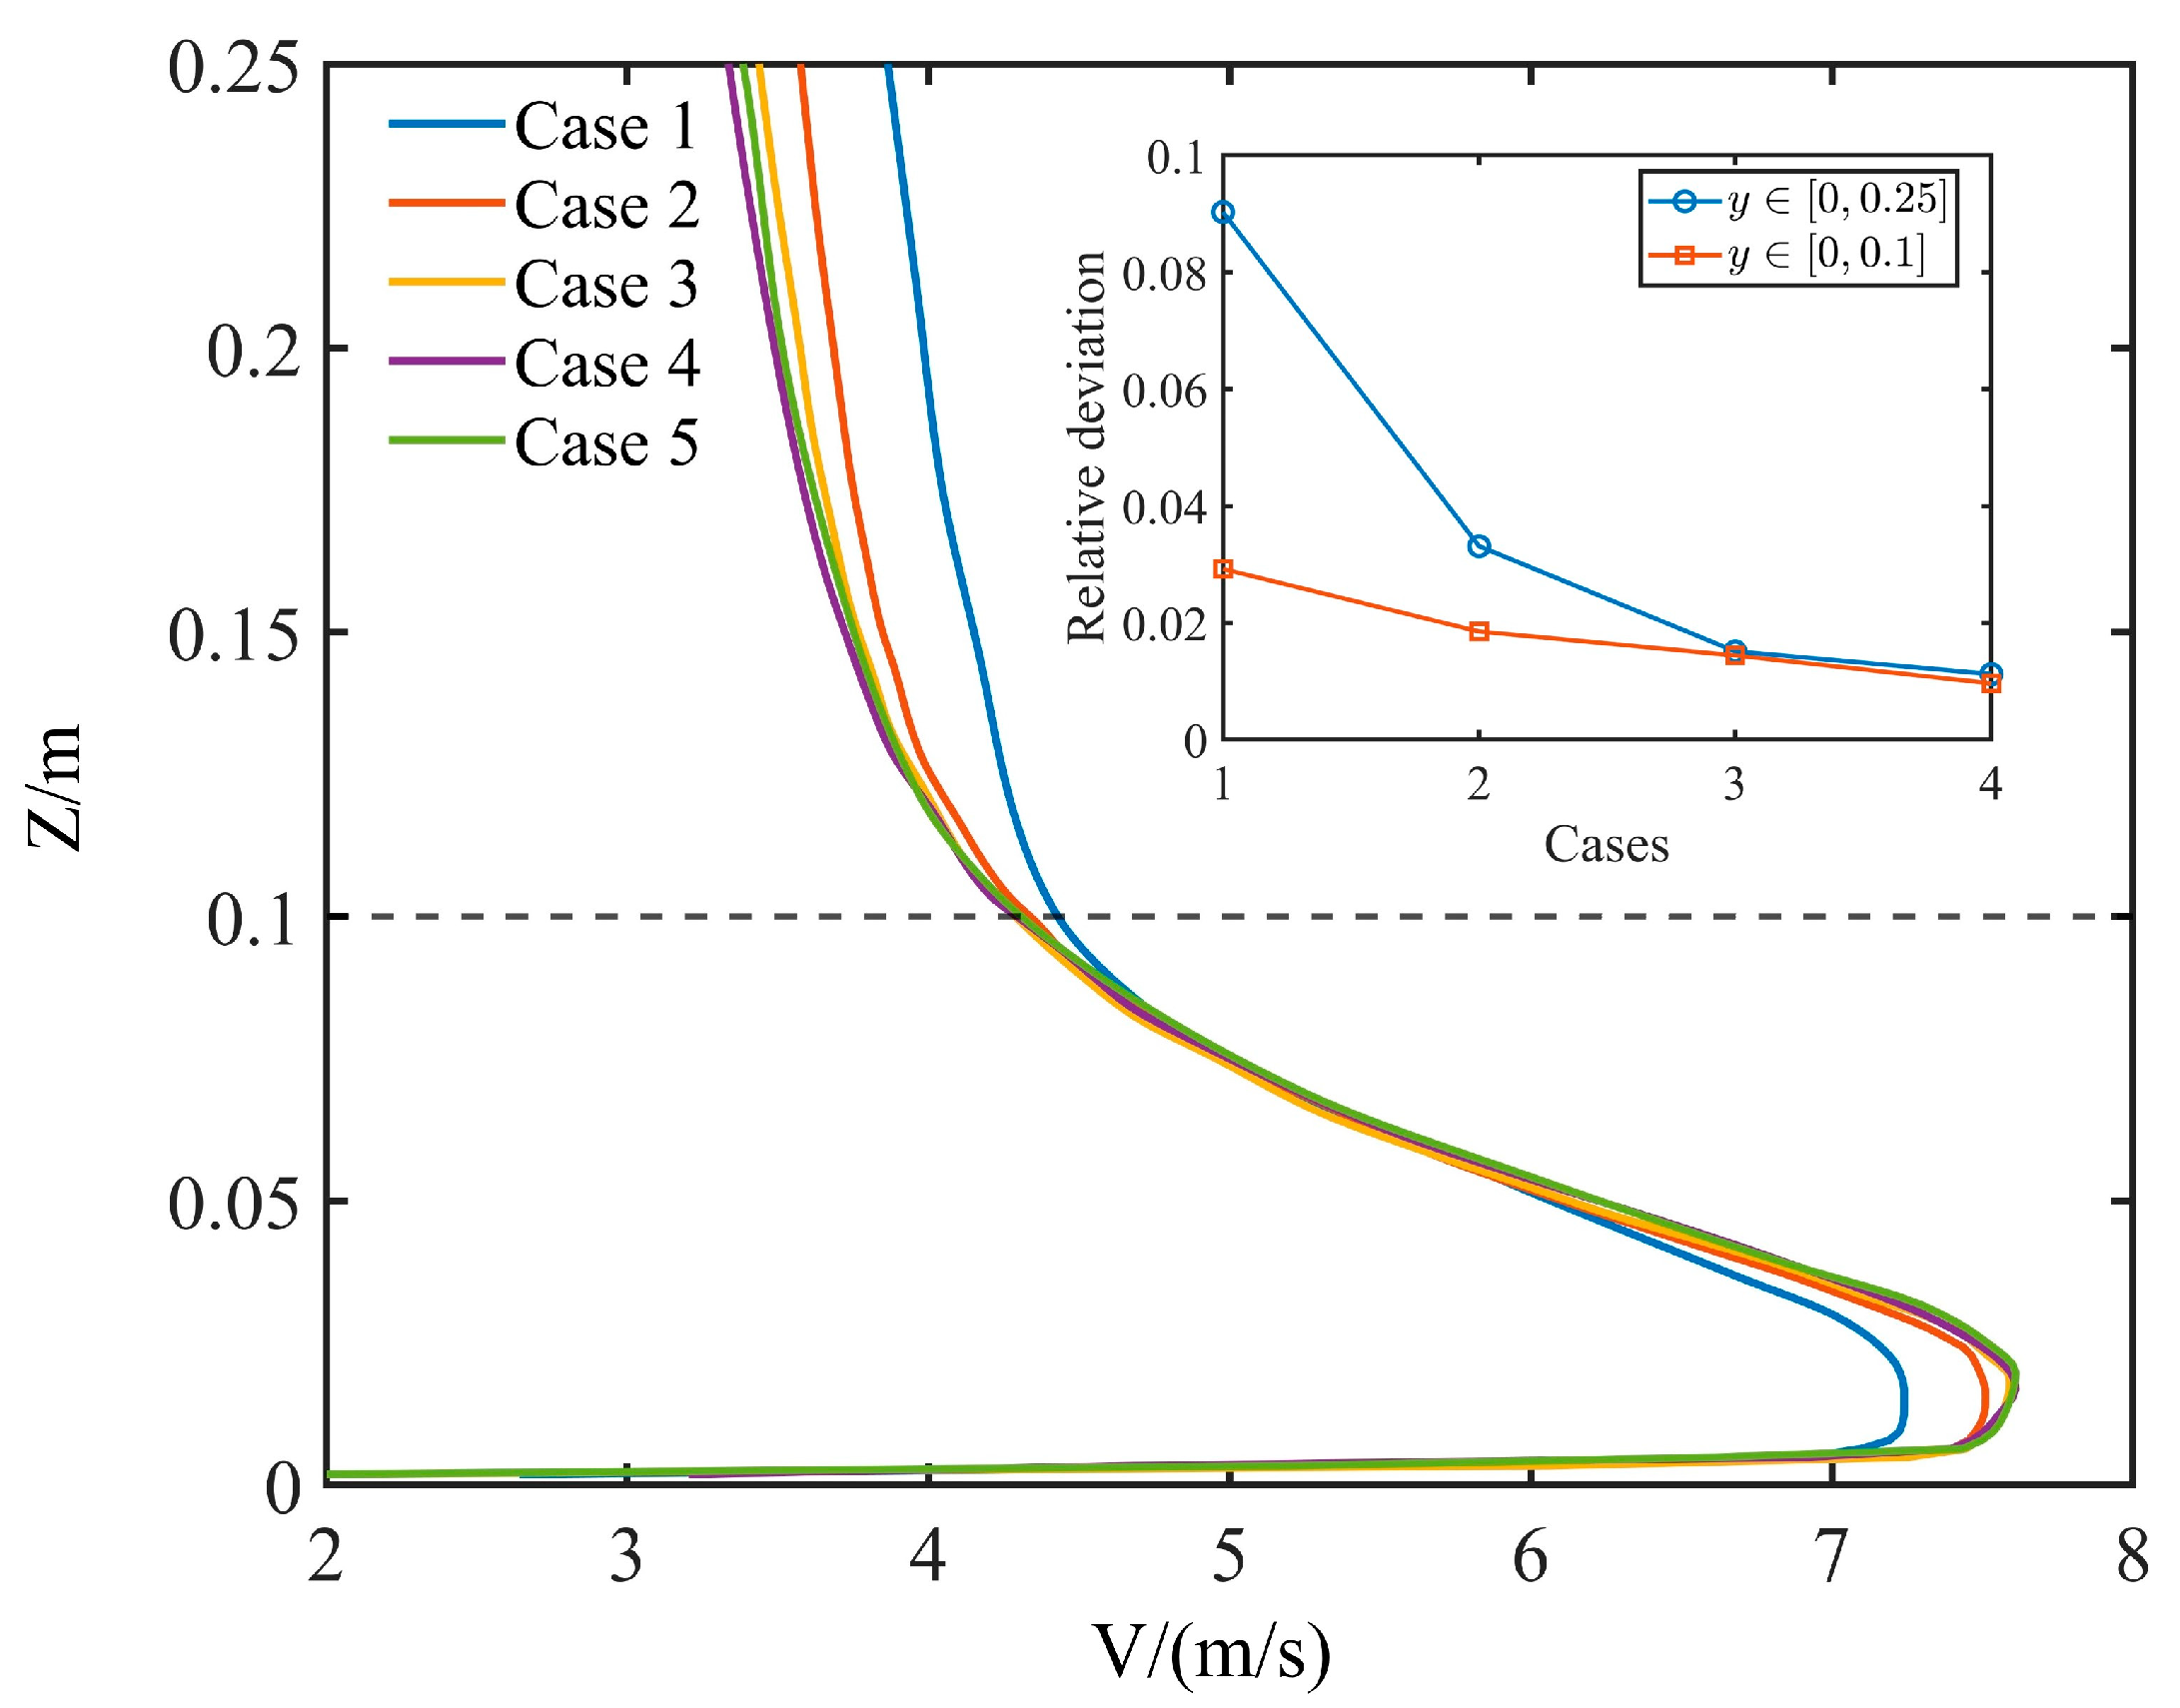
Figure 2: Grid independence verification of vertical wind velocity profiles. The inset shows the relative errors of different grid cases with respect to Case 5, evaluated in two vertical height ranges: 0–0.25 m and 0–0.1 m.
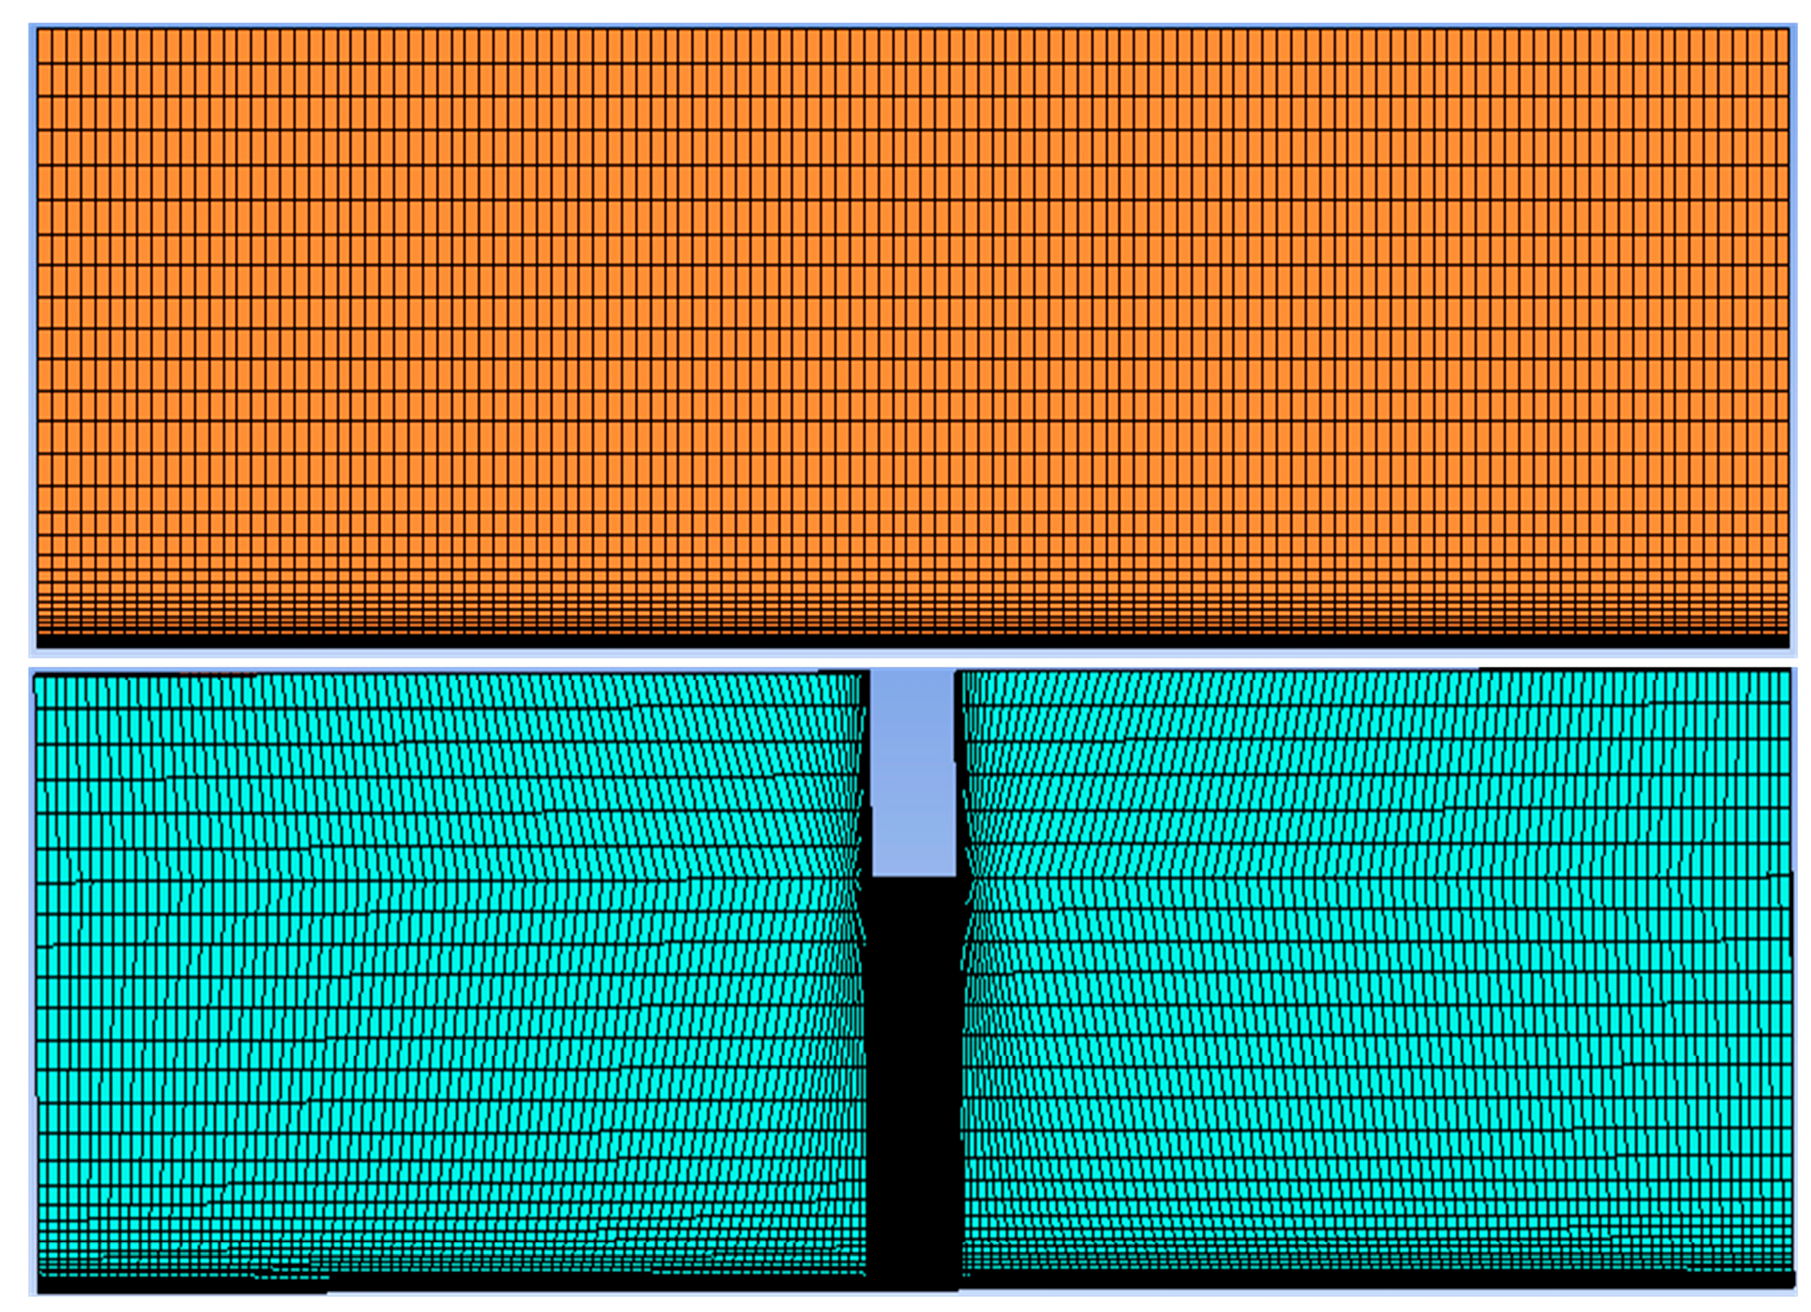
Figure 3: Grid diagram in computational domain.
Based on the measured results of downbursts, and within the range of realistic parameters, the jet diameter, jet velocity, and jet height are varied respectively to study the spatial distribution of wind field velocity under different downburst parameters. Hjelmfelt [4] analyzed multiple sets of field measurements of downbursts and found that the jet diameter ranges from 600 to 1700 m, while the jet height ranges from 2100 to 4100 m, with variations typically between 1500 and 3000 m. Based on these data, different jet parameters were established for simulation calculations by referencing appropriate scaling ratios. The parameter settings are shown in Table 1.
Table 1: Parameter setting.
| Case | Different Velocity | Different Height | Different Diameter | ||||||
|---|---|---|---|---|---|---|---|---|---|
| V (m/s) | H (m) | Djet (m) | V (m/s) | H (m) | Djet (m) | V (m/s) | H (m) | Djet (m) | |
| 1 | 5 | 0.6 | 0.3 | 10 | 0.3 | 0.3 | 10 | 0.6 | 0.3 |
| 2 | 10 | 0.6 | 0.3 | 10 | 0.6 | 0.3 | 10 | 0.6 | 0.45 |
| 3 | 15 | 0.6 | 0.3 | 10 | 0.9 | 0.3 | 10 | 0.6 | 0.6 |
| 4 | 20 | 0.6 | 0.3 | 10 | 1.2 | 0.3 | 10 | 0.6 | 0.75 |
| 5 | - | - | - | - | - | - | 10 | 0.6 | 0.9 |
A comparison between the current CFD simulation results and the existing wind profiles is presented in Fig. 4. As can be seen in Fig. 4a, the vertical wind profiles obtained from the numerical simulation in this paper are compared with those from the Wood’s empirical model [31], Eriksson’s result [32], Zhong’s result [33] and traditional atmospheric boundary layer simulations. It can be observed that the vertical wind profile of the downburst obtained from the numerical simulation in this paper has the same trend as the empirical models and simulation results from previous studies, with basically consistent values. It is also evident that there is a significant difference between the vertical wind profile of the downburst and the traditional atmospheric boundary layer wind profile. The conventional wind profile increases exponentially with height, while the downburst vertical wind profile shows that the wind speed increases from the ground upward, reaches a maximum value at a certain height, and then decreases gradually to zero as the height increases further. Fig. 4b shows the comparison of the radial wind profiles obtained from the numerical simulation in this paper with those from the 1988 field measurement project by Hjelmfelt [4], as well as those obtained by Fang [34], Holmes et al. [35] and Iida et al. [36]. The velocity profiles are basically consistent, with the wind speed first increasing and then decreasing along the radial direction, reaching a peak when r/rmax equals 1. As mentioned above, the model employed in this paper and the simulation results are generally consistent with existing research, verifying the authenticity and validity of the simulation.
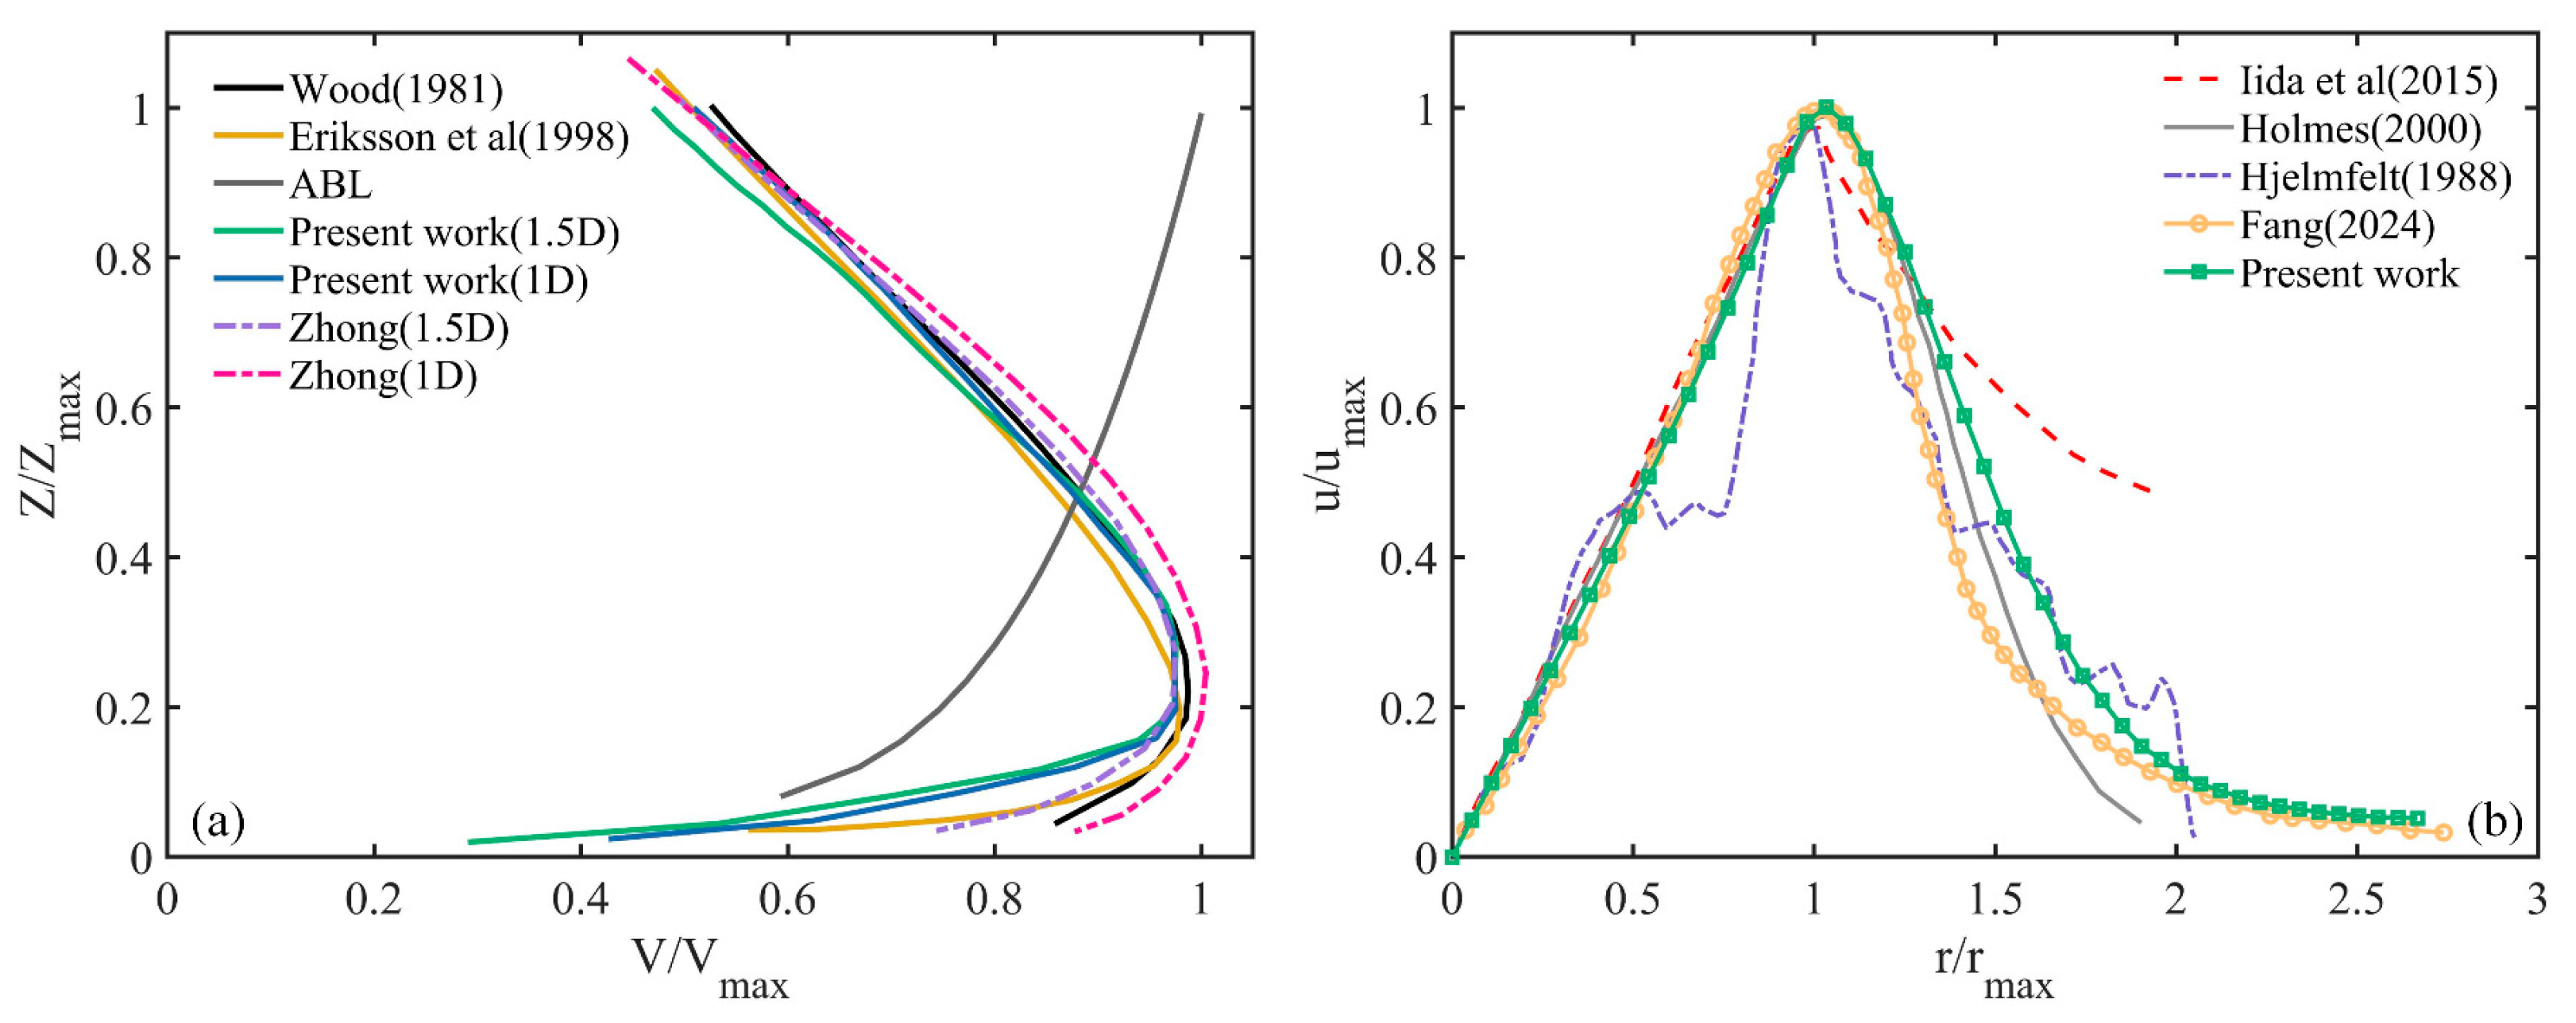
Figure 4: Wind profile verification [4,31,32,33,34,35,36]. (a) Vertical wind profile. (b) Radial wind profile.
4.1 Spatial Distribution of Velocity
The radial velocity profiles at different height planes under four different jet velocities are displayed in Fig. 5a–c. It can be observed that the radial velocity profiles have the same trend: it first increases approximately linearly along the radial direction, reaches a peak value, and then decreases exponentially, reaching a maximum value near the edge of the jet region. As the inlet jet velocity increases, the maximum velocity at the edge of the jet region also increases. The inlet jet velocity impacts the ground and then spreads out. The higher inlet velocity, the greater peak radial velocity at the same radial position, and the closer it is to the jet velocity. From the perspective of height above the ground, the radial wind velocity reaches its maximum value at the z = 0.05Djet plane, which is close to the inlet jet velocity, while it decreases slightly at z = 0.1Djet. At higher positions, due to the dissipation of the airflow, the velocity also decreases. It can also be observed that at the height of z = 0.1Djet, the radial position where the maximum radial wind velocity is reached is closer to the center of the downburst.
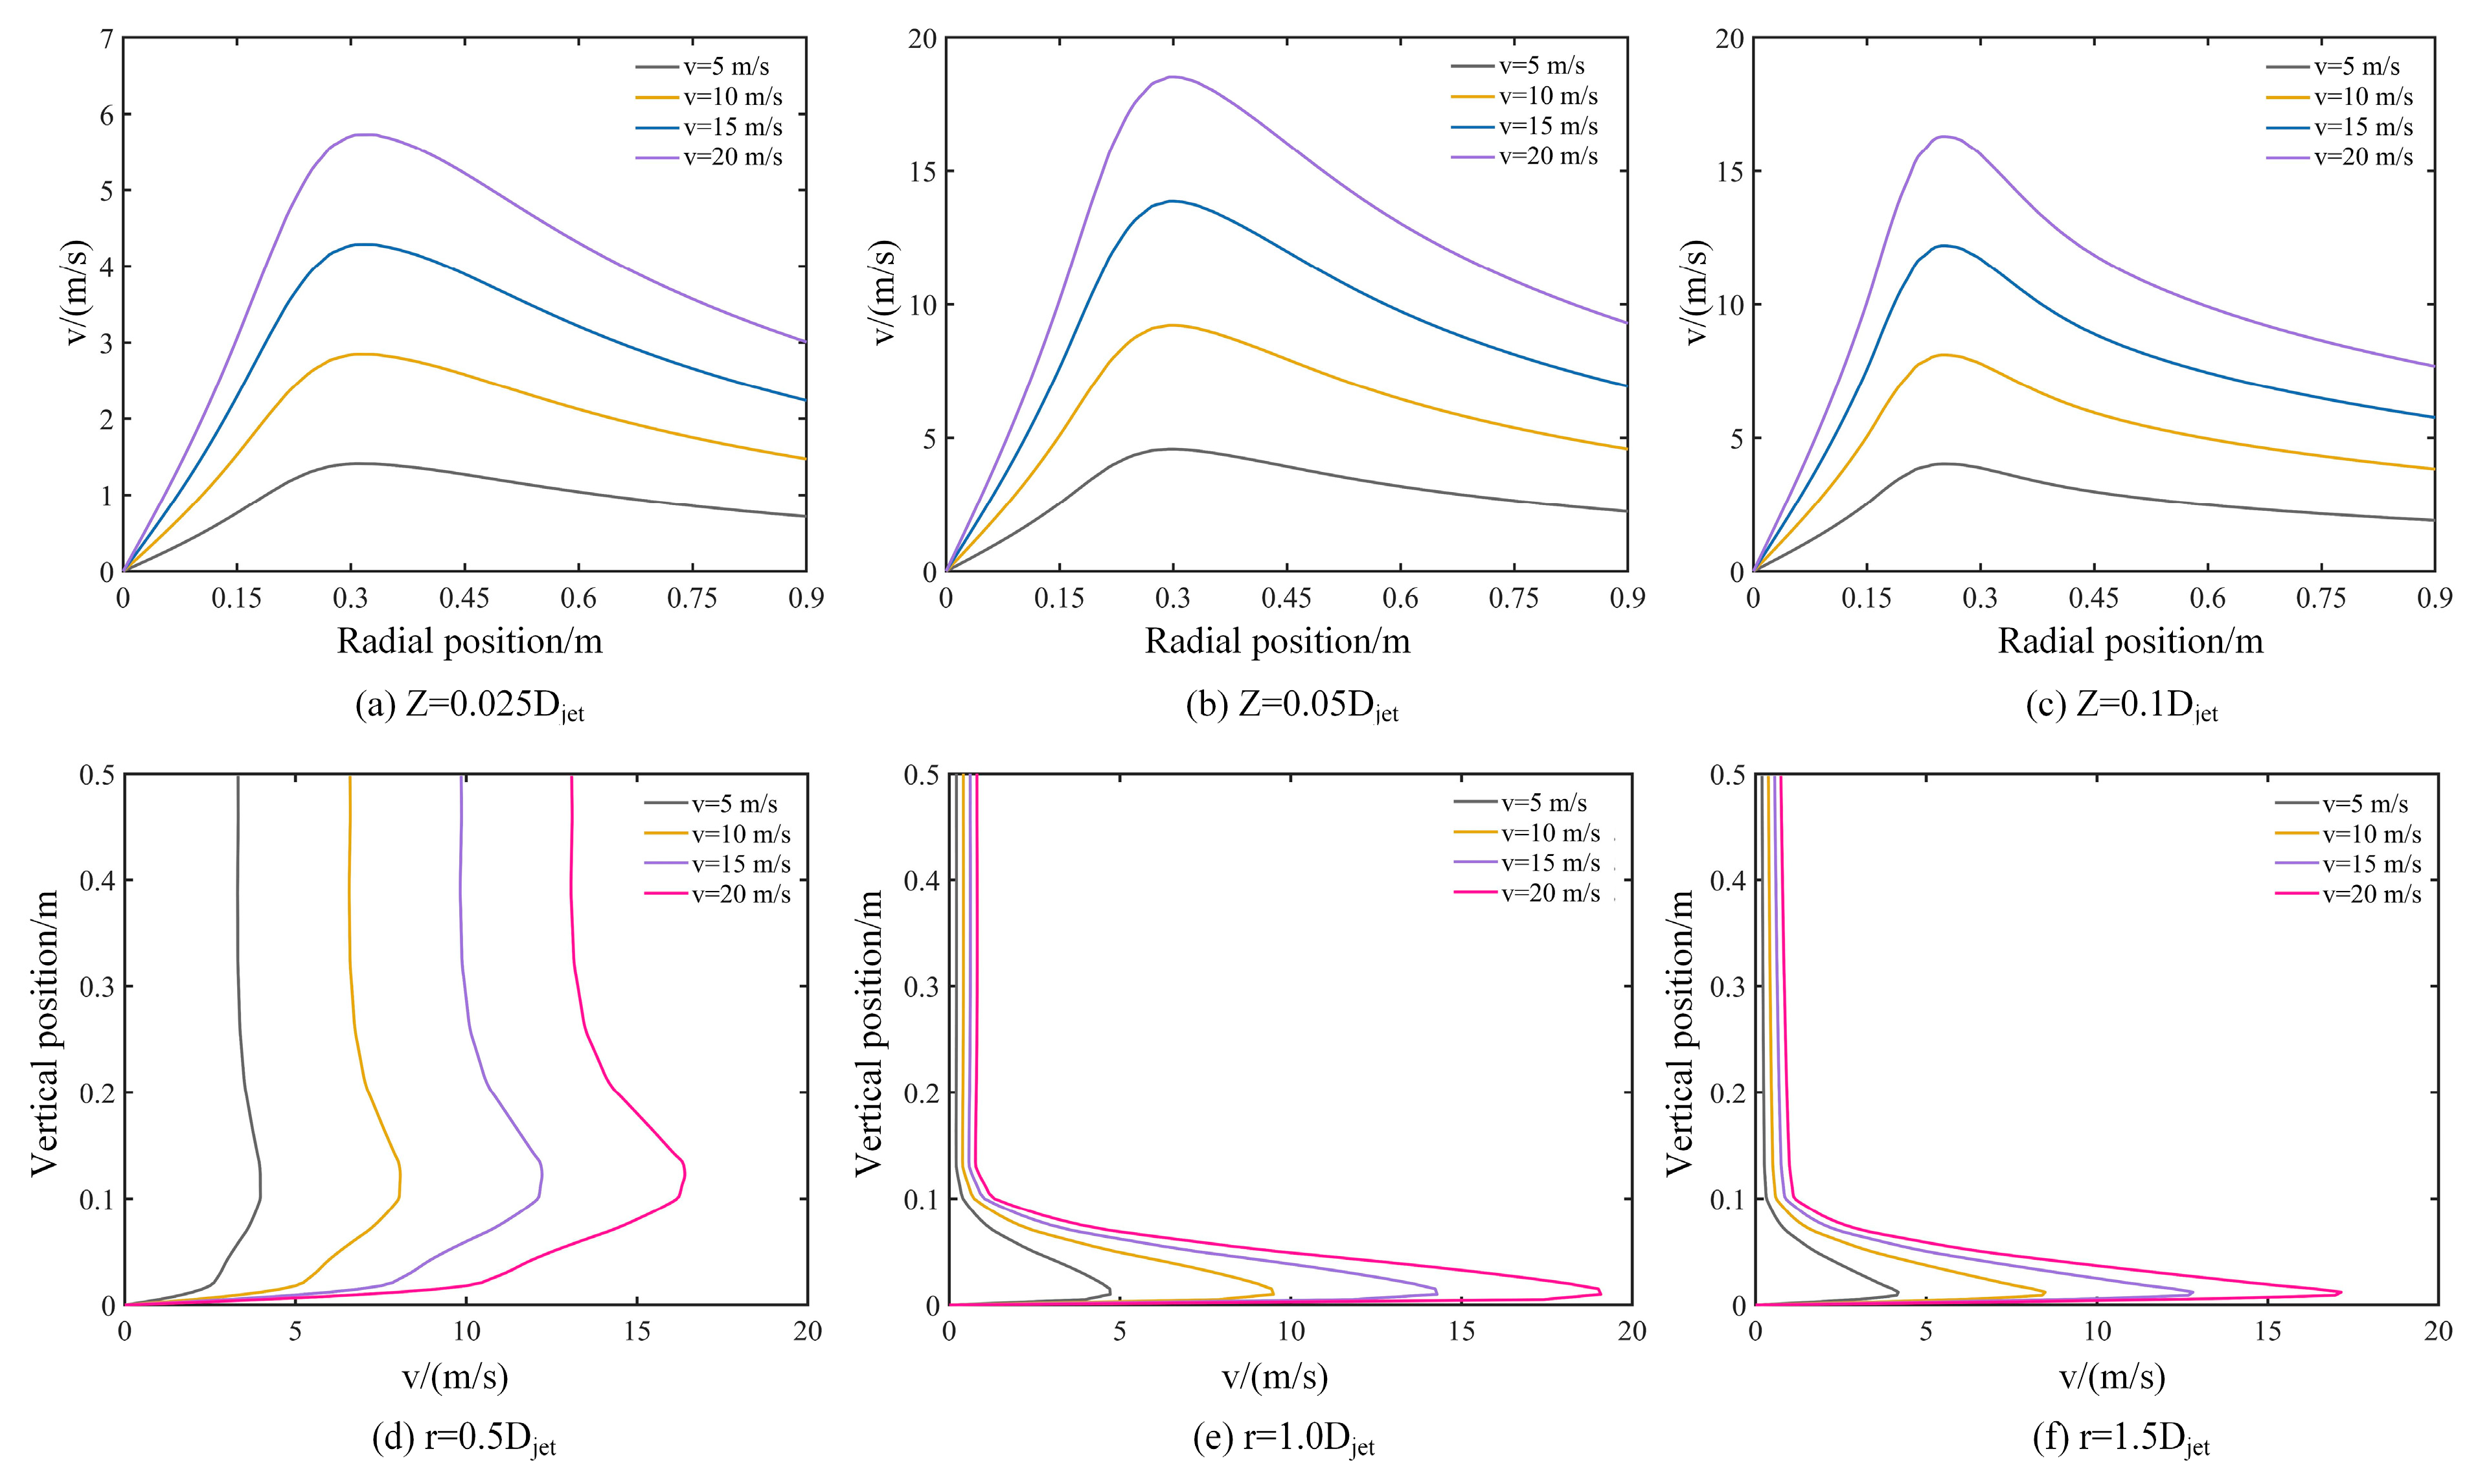
Figure 5: Wind profile at different jet velocity.
Vertical velocity profiles are drawn along the vertical direction at three different radial positions, 0.5Djet, 1.0Djet, and 1.5Djet from the jet center, and the results are shown in Fig. 5d–f. There are significant differences among the vertical velocity profiles at different radial positions. At a radial position of 0.5Djet from the jet center, the vertical distribution of velocity resembles a “nose-shaped” distribution. The maximum vertical velocity increases with the increase of jet velocity, and the height at which the maximum horizontal velocity occurs is around 0.13 m. It can be seen from Fig. 5e that when the radial position is 1.0Djet from the jet center, the height at which the maximum velocity occurs is close to the ground, and the maximum horizontal velocity almost reaches the jet velocity. As the radial position continues to move away from the jet center, at a radial position of 1.5Djet, the maximum horizontal velocity begins to decrease, and the height at which the maximum velocity occurs is also closer to the ground. Moving further away from the jet center, as the downburst develops radially, the velocity decreases near the ground until it reaches zero. At the radial position of r = 0.5Djet, the downdraft impacts the ground and spreads along the surface, which is at the initial position where the velocity begins to dissipate. Here, since the spreading has not yet begun, the vertical influence range is higher. Subsequently, as the airflow spreads along the ground, the velocity development at the surface becomes more complete, and the vertical position at which the maximum velocity occurs is closer to the ground.
The radial velocity profiles of the downburst wind field at various jet heights are depicted in Fig. 6a–c at distances of 0.025Djet, 0.05Djet, and 0.1Djet above the ground. It can be seen that as the jet height increases, the peak velocity decreases, and the radial position at which the peak velocity occurs shifts outward from the jet center. However, at the height of z = 0.025Djet, there is a characteristic that deviates from the above trend. The reason for this phenomenon may be that the airflow is still unstable during the development stage, and the turbulent gas movement causes the wind speed to exhibit a certain degree of irregular variation. The trend of radial velocity over time is clearly illustrated in Fig. 6b,c. At different heights above the ground, the trend of velocity decay is different. On the z = 0.05Djet plane, the radial velocity first increases to a peak value, and then decreases slowly along the radial direction, with a wider range affected by high wind speeds. In contrast, on the z = 0.1Djet plane, the velocity decays more sharply. When the jet height is 0.6 m, 0.9 m, and 1.2 m, the wind speed has already decayed completely at the radial position of r = 0.4 m, and the velocity at more distant radial positions gradually stabilizes. Compared to the z = 0.05Djet plane, the radial range affected by high wind speeds is significantly reduced.
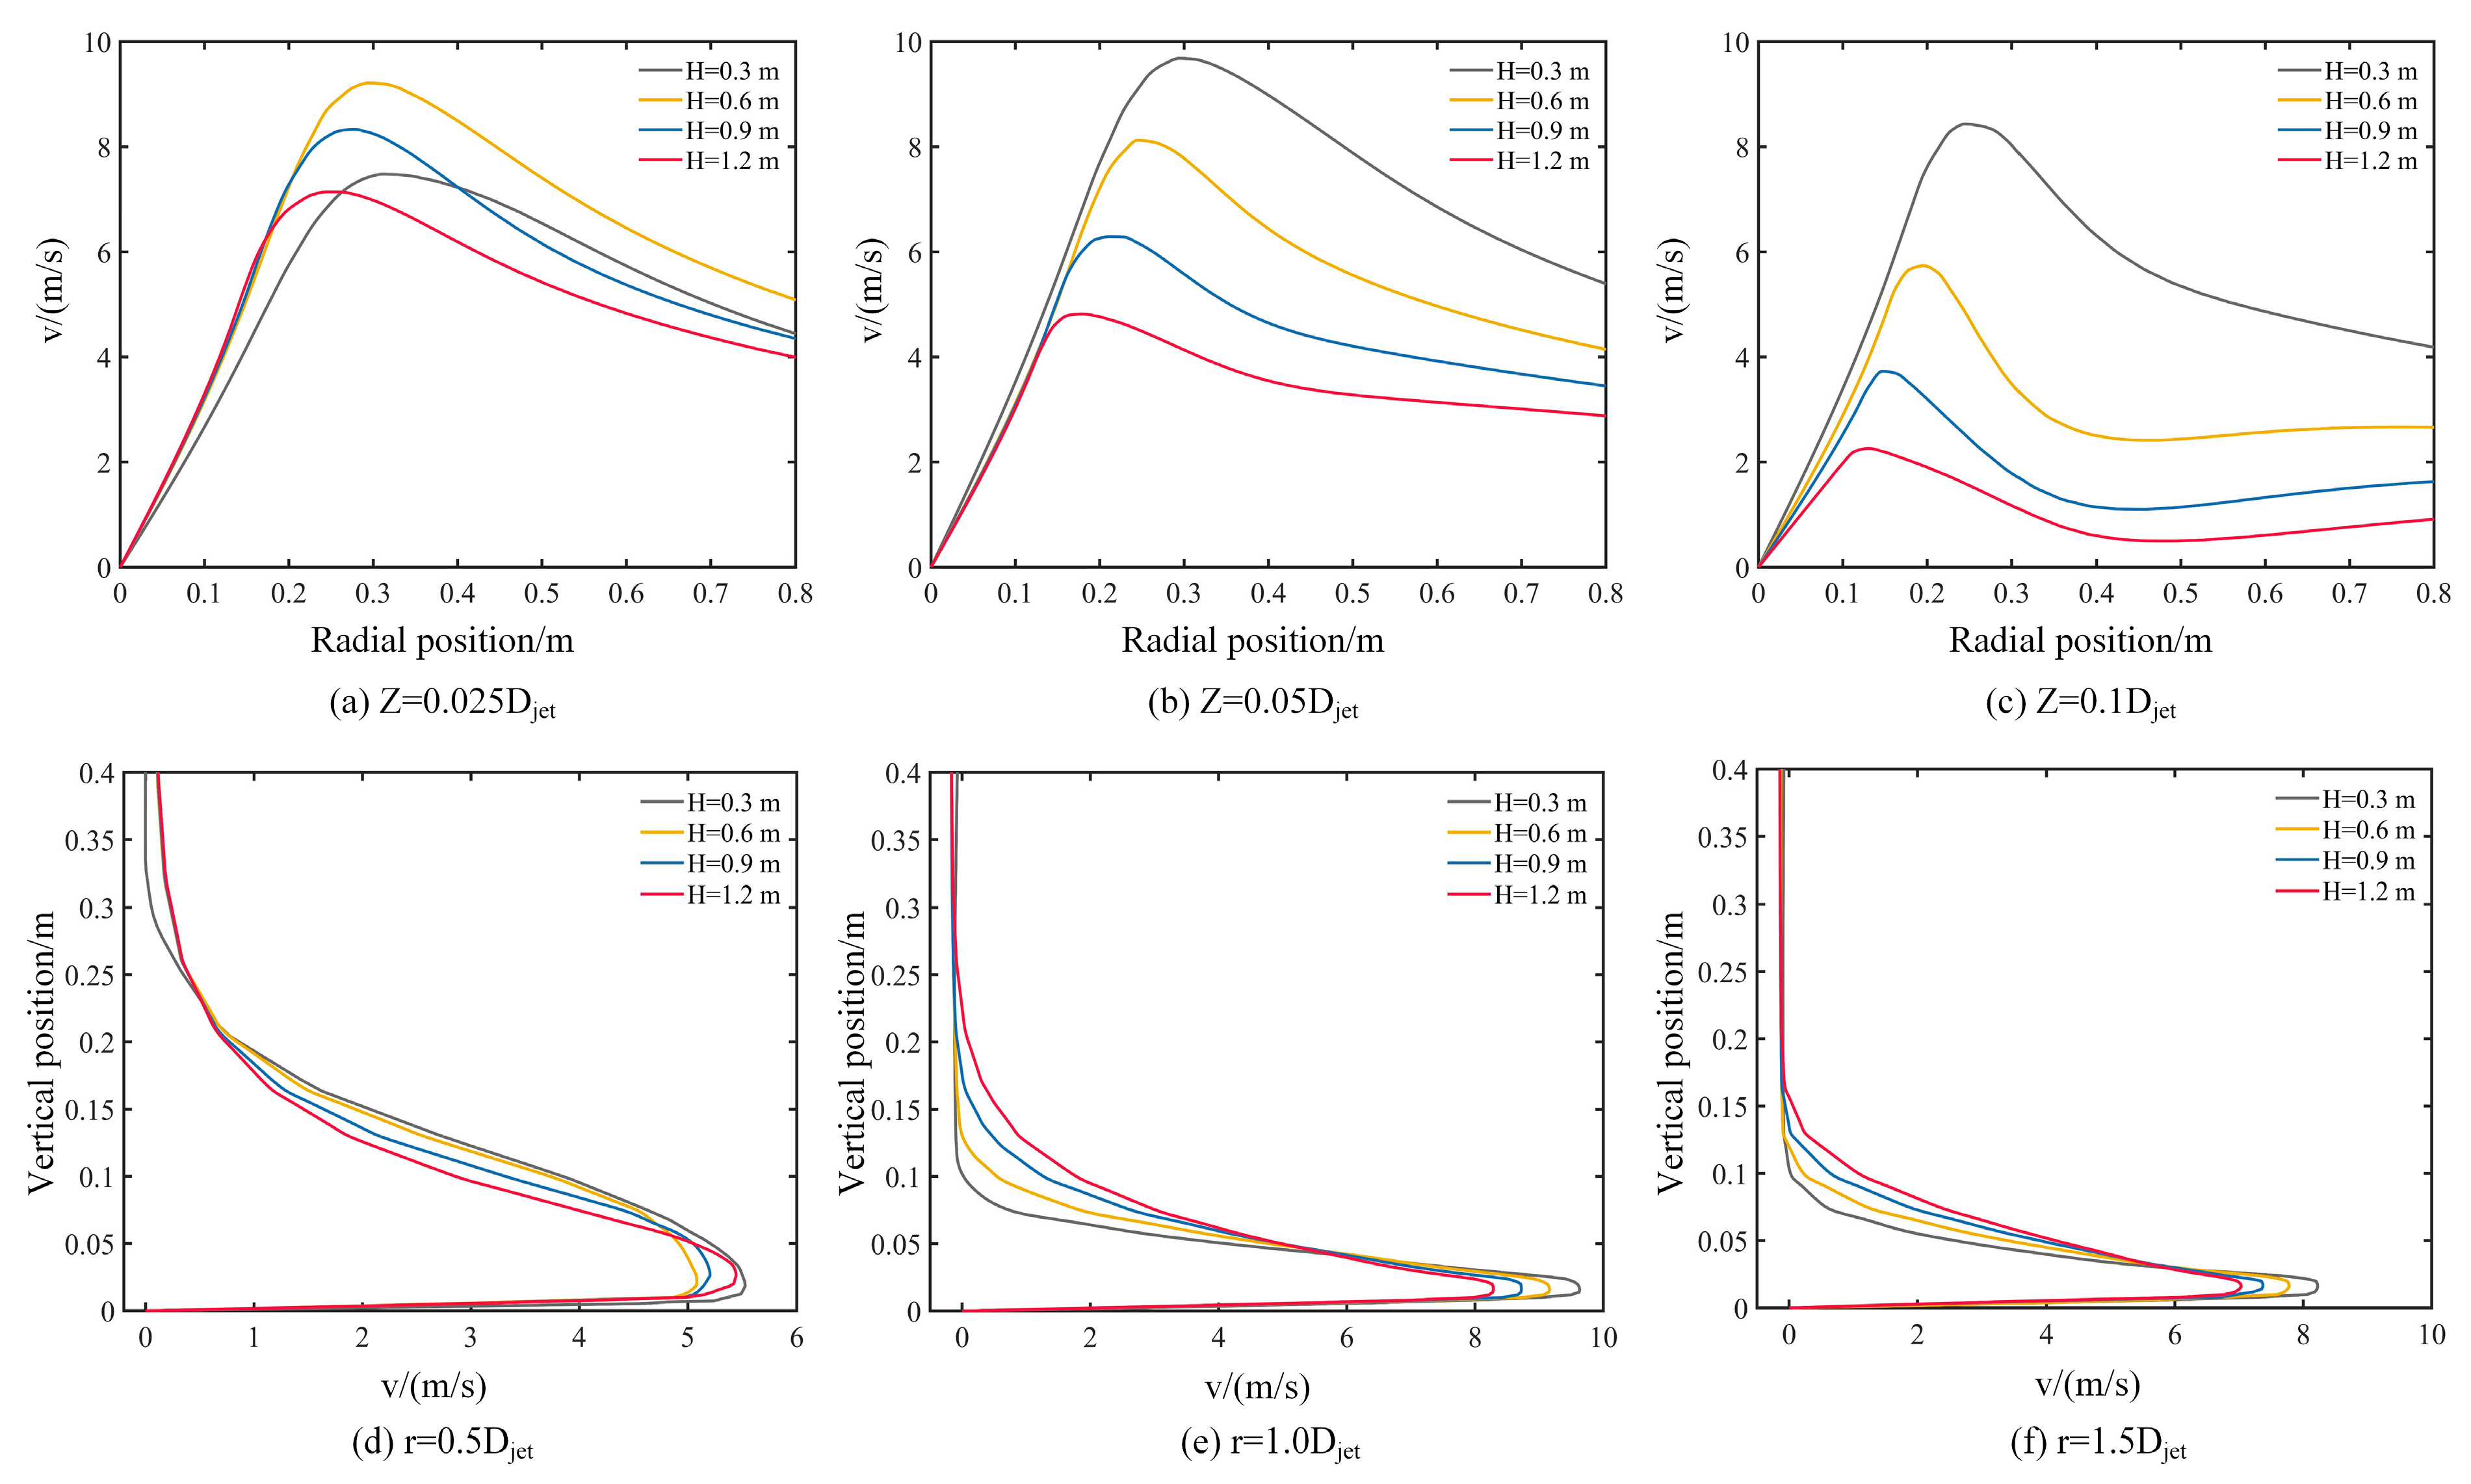
Figure 6: Wind profile at different jet height.
Fig. 6d–f illustrates how the horizontal wind speed is distributed along the vertical direction at various radial positions. It can be seen that the vertical wind profiles approximately follow a “nose-shaped” distribution, with an overall trend of first increasing and then decreasing with height. However, the vertical height at which the maximum wind speed occurs varies slightly. When the radial position is at r = 0.5Djet, the height of the maximum horizontal wind speed is about 0.03 m above the ground, which is approximately 0.1Djet from the ground. For radial positions at r = 1.0Djet and r = 1.5Djet the height of the maximum horizontal wind speed is closer to the ground. Near the center of the downburst, the maximum wind speed is formed under the vortex created by the downdraft impacting the ground, at which point it is not affected by the surrounding air. Subsequently, as the airflow expands and dissipates, it mixes with the surrounding air, resulting in a decrease in intensity. Additionally, changes in jet height significantly affect the rate of wind speed decay with height. As shown in Fig. 6e, when the jet height is 0.3 m, the wind speed tends to zero at a vertical position of 0.12 m, while when the jet height is 1.2 m, the vertical position where the wind speed returns to zero is around 0.28 m. This trend is somewhat weakened at positions farther from the jet center. The reason that a higher jet height results in a reduction of near-surface wind speed in the downburst wind field is due to the resistance from the ground surface and the interaction between airflows. When the jet height increases, the kinetic energy loss of the downdraft during its descent also increases, resulting in a corresponding decrease in the radial wind speed formed upon reaching the ground.
The radial and vertical wind velocity profiles across various height planes for downburst wind fields characterized by different jet diameters are depicted in Fig. 7. It is obvious that the change in jet diameter significantly affects the range of influence of the jet region. The variation trend of radial wind profiles at different heights are consistent, and an increase in jet diameter significantly enhances the peak horizontal velocity, with the maximum horizontal wind speed occurring at radial positions of 1.0–1.2Djet. On the z = 0.03Djet plane, the radial range over which the maximum horizontal wind speed is sustained is broader than on other height planes. At a height of z = 0.1Djet, the wind speed shows a fluctuating trend with changes in jet diameter. This phenomenon can be attributed to the interaction of airflows at higher positions with the upper air, causing a certain degree of disorder in direction and intensity, resulting in the observed fluctuations in wind speed. The vertical wind profiles at different radial positions r = 0.5Djet, r = 1.0Djet, and r = 1.5Djet for downburst wind fields with different jet diameters are shown in Fig. 7d–f. It can be seen that the shape of the vertical wind profiles varies significantly at different radial positions. Near the jet center, the vertical wind profile has an acute angle shape, while it begins to show an approximate “nose-shaped” distribution as it moves away from the jet center. The greater the distance from the jet center, the closer the vertical height with higher wind speeds is to the ground. The maximum horizontal wind speed is reached at r = 1.0Djet, with the peak occurring at a height of approximately z = 0.04Djet. As the jet diameter increases, the maximum horizontal wind speed also increases, and this trend is more pronounced at positions farther from the jet center.
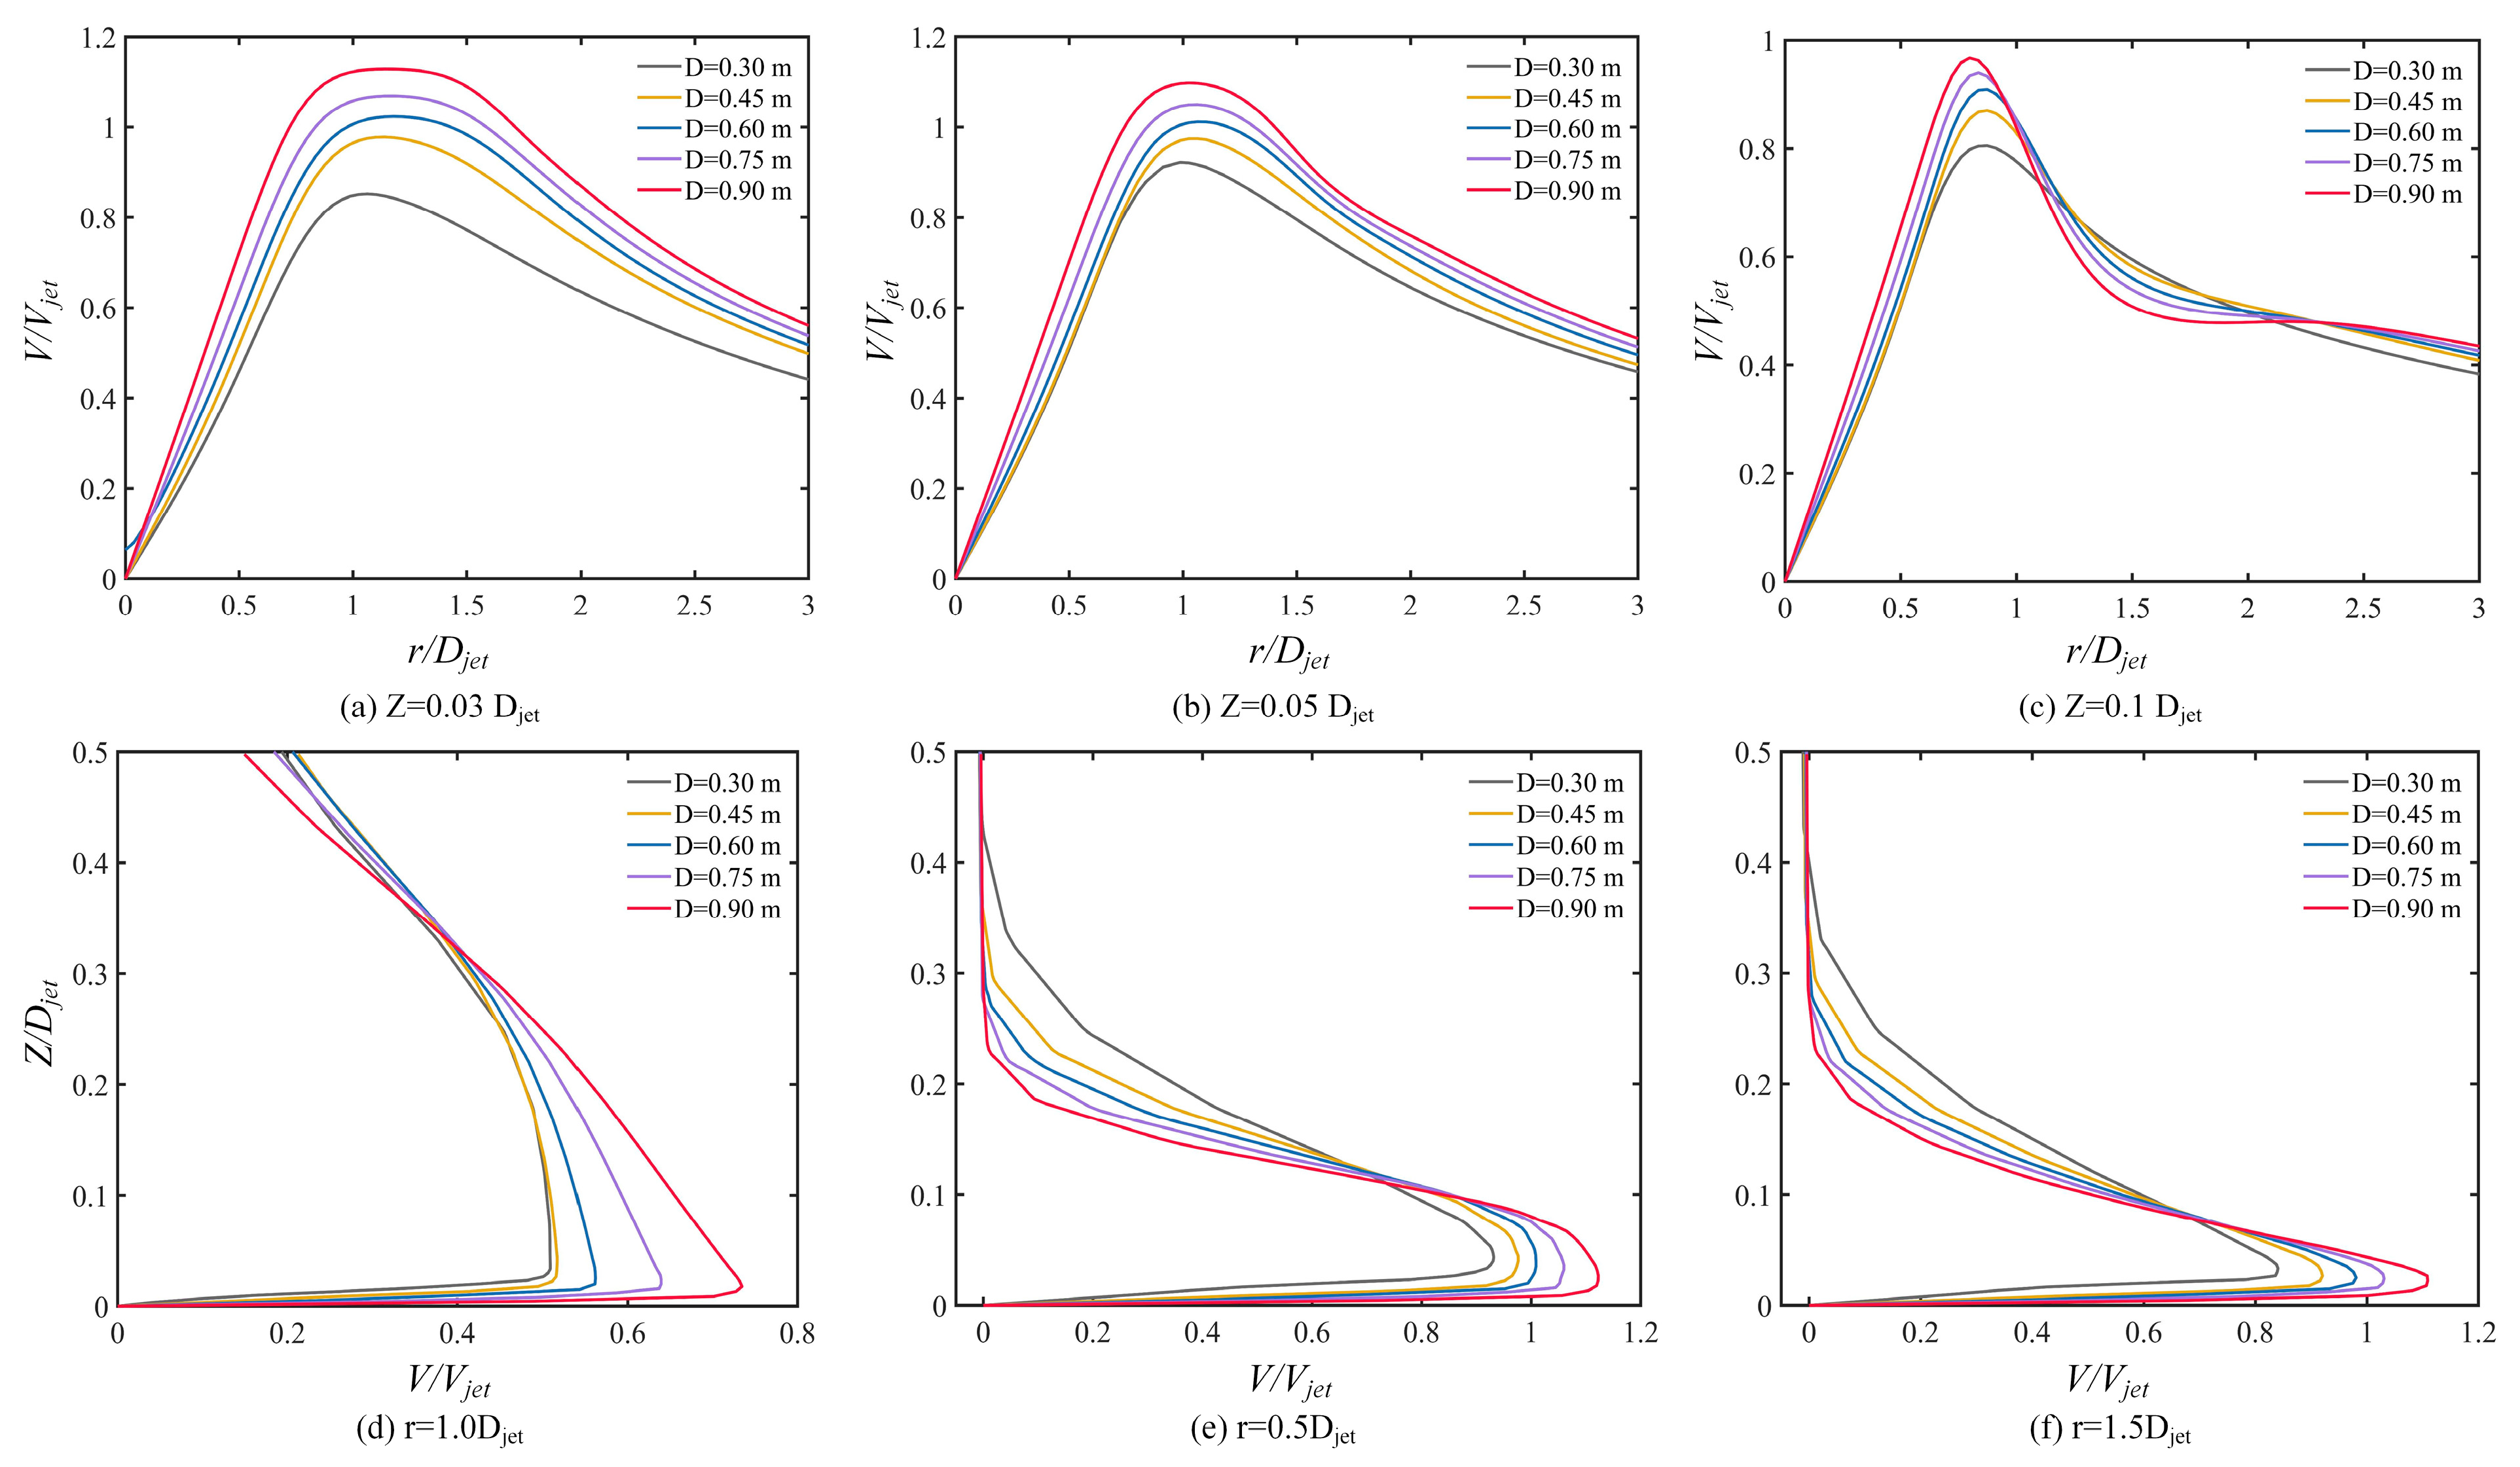
Figure 7: Wind profile at different jet diameter.
Fig. 8 illustrates the radial distribution of pressure within the downburst wind field under varying conditions of jet velocity, diameter, and jet height. Several points located 0.1 m above the virtual ground surface of the downburst wind field are selected for quantitative analysis of the pressure distribution. From Fig. 8a, it can be seen that the high-pressure region is mainly distributed within the jet range, and the pressure value at the jet center increases with the increase of jet velocity, forming a relatively steep “peak”. Fig. 8b clearly shows that the change in jet diameter leads to an expansion of the radial range of the high-pressure region. At the same time, the maximum pressure within the radial range also shows a trend of uniform increase. This indicates that changing the jet diameter has a dual impact on both the high-pressure region and the pressure variation. As can be seen from Fig. 8c, it is evident that the impact of jet height on pressure distribution is much smaller than that of other jet parameters. The radial range of the high-pressure region expands slightly outward along the radial direction as the jet height increases, but the extent is minimal. The pressure peak decreases slightly with the increase in jet height. Overall, the jet diameter affects both the radial range of the high-pressure distribution and the maximum pressure value. An increase in jet velocity only leads to a gradual increase in the pressure peak. To some extent, the influence of jet height on pressure distribution can be considered negligible.
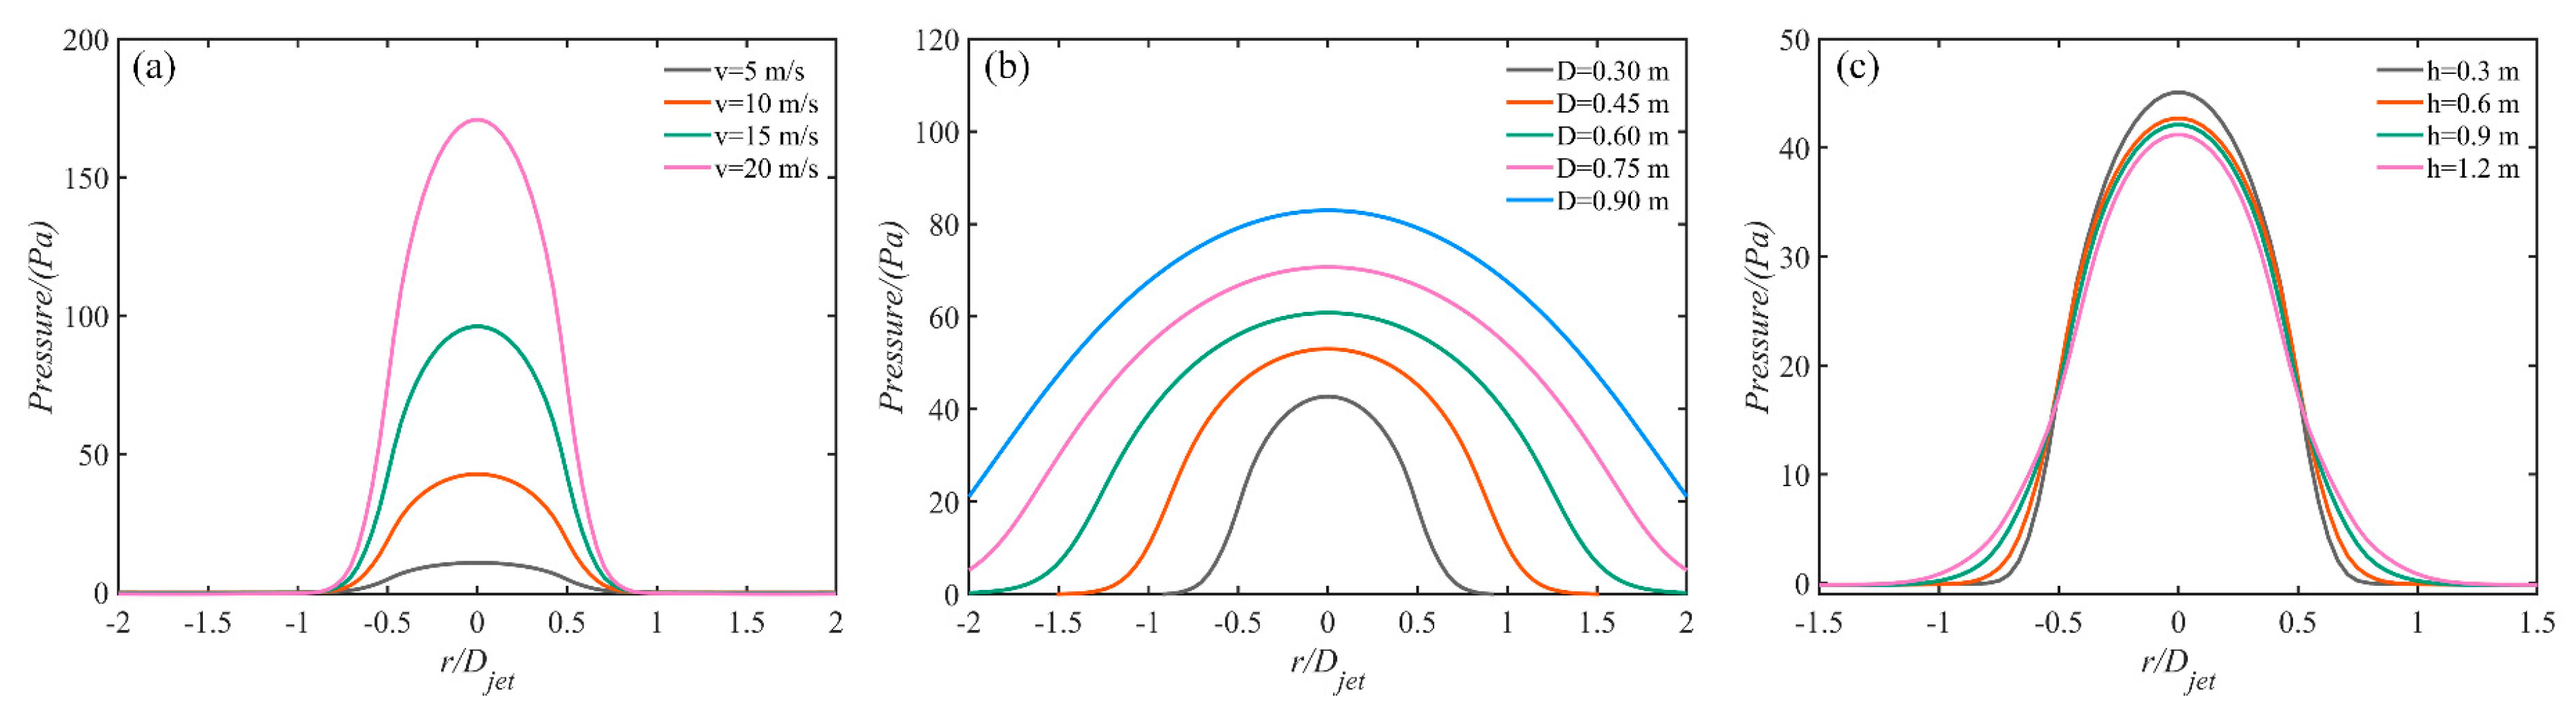
Figure 8: Pressure distribution in downburst wind fields: (a) different velocity. (b) different diameter. (c) different height.
4.3 Wind Pressure Characteristics
A three-dimensional solid model of the NREL 5 MW reference wind turbine blade was first constructed in SolidWorks. In this study, a 1:1000 scaled model was adopted, in which blade rotation was neglected. The scaled turbine was positioned approximately 1Djet from the jet center in the radial direction, with the hub center located 0.1 m above the scaled ground. Around the blade surface, boundary-layer refinement was applied, with a first-layer grid height of 0.56 × 10⁻⁵ m and nine prism layers, as shown in Fig. 9. For the solid domain, the maximum global cell size of the scaled blade and hub was set to 2 × 10⁻⁴ m, with local mesh control on the blade (element size 2 × 10⁻⁴ m, feature clearance size 1 × 10⁻⁵ m, and growth rate 1.5), ensuring adequate mesh quality. The target y+ was 40–80, and the achieved values on blade and tower surfaces were mostly between 51.2 and 102.8. This range lies within the logarithmic law region and is therefore valid for wall-function treatment with the standard k–ε model [21,26]. The nacelle and other small features also exhibited similar y+ values, confirming consistency between mesh resolution and the turbulence model, and ensuring the reliability of near-wall flow predictions. It should be noted that the downburst was scaled at 1:2000 and the turbine at 1:1000, although this causes a Reynolds-number mismatch, similar compromises have been adopted in previous impinging-jet studies [37,38], and the focus here is on relative parametric trends rather than absolute loads.
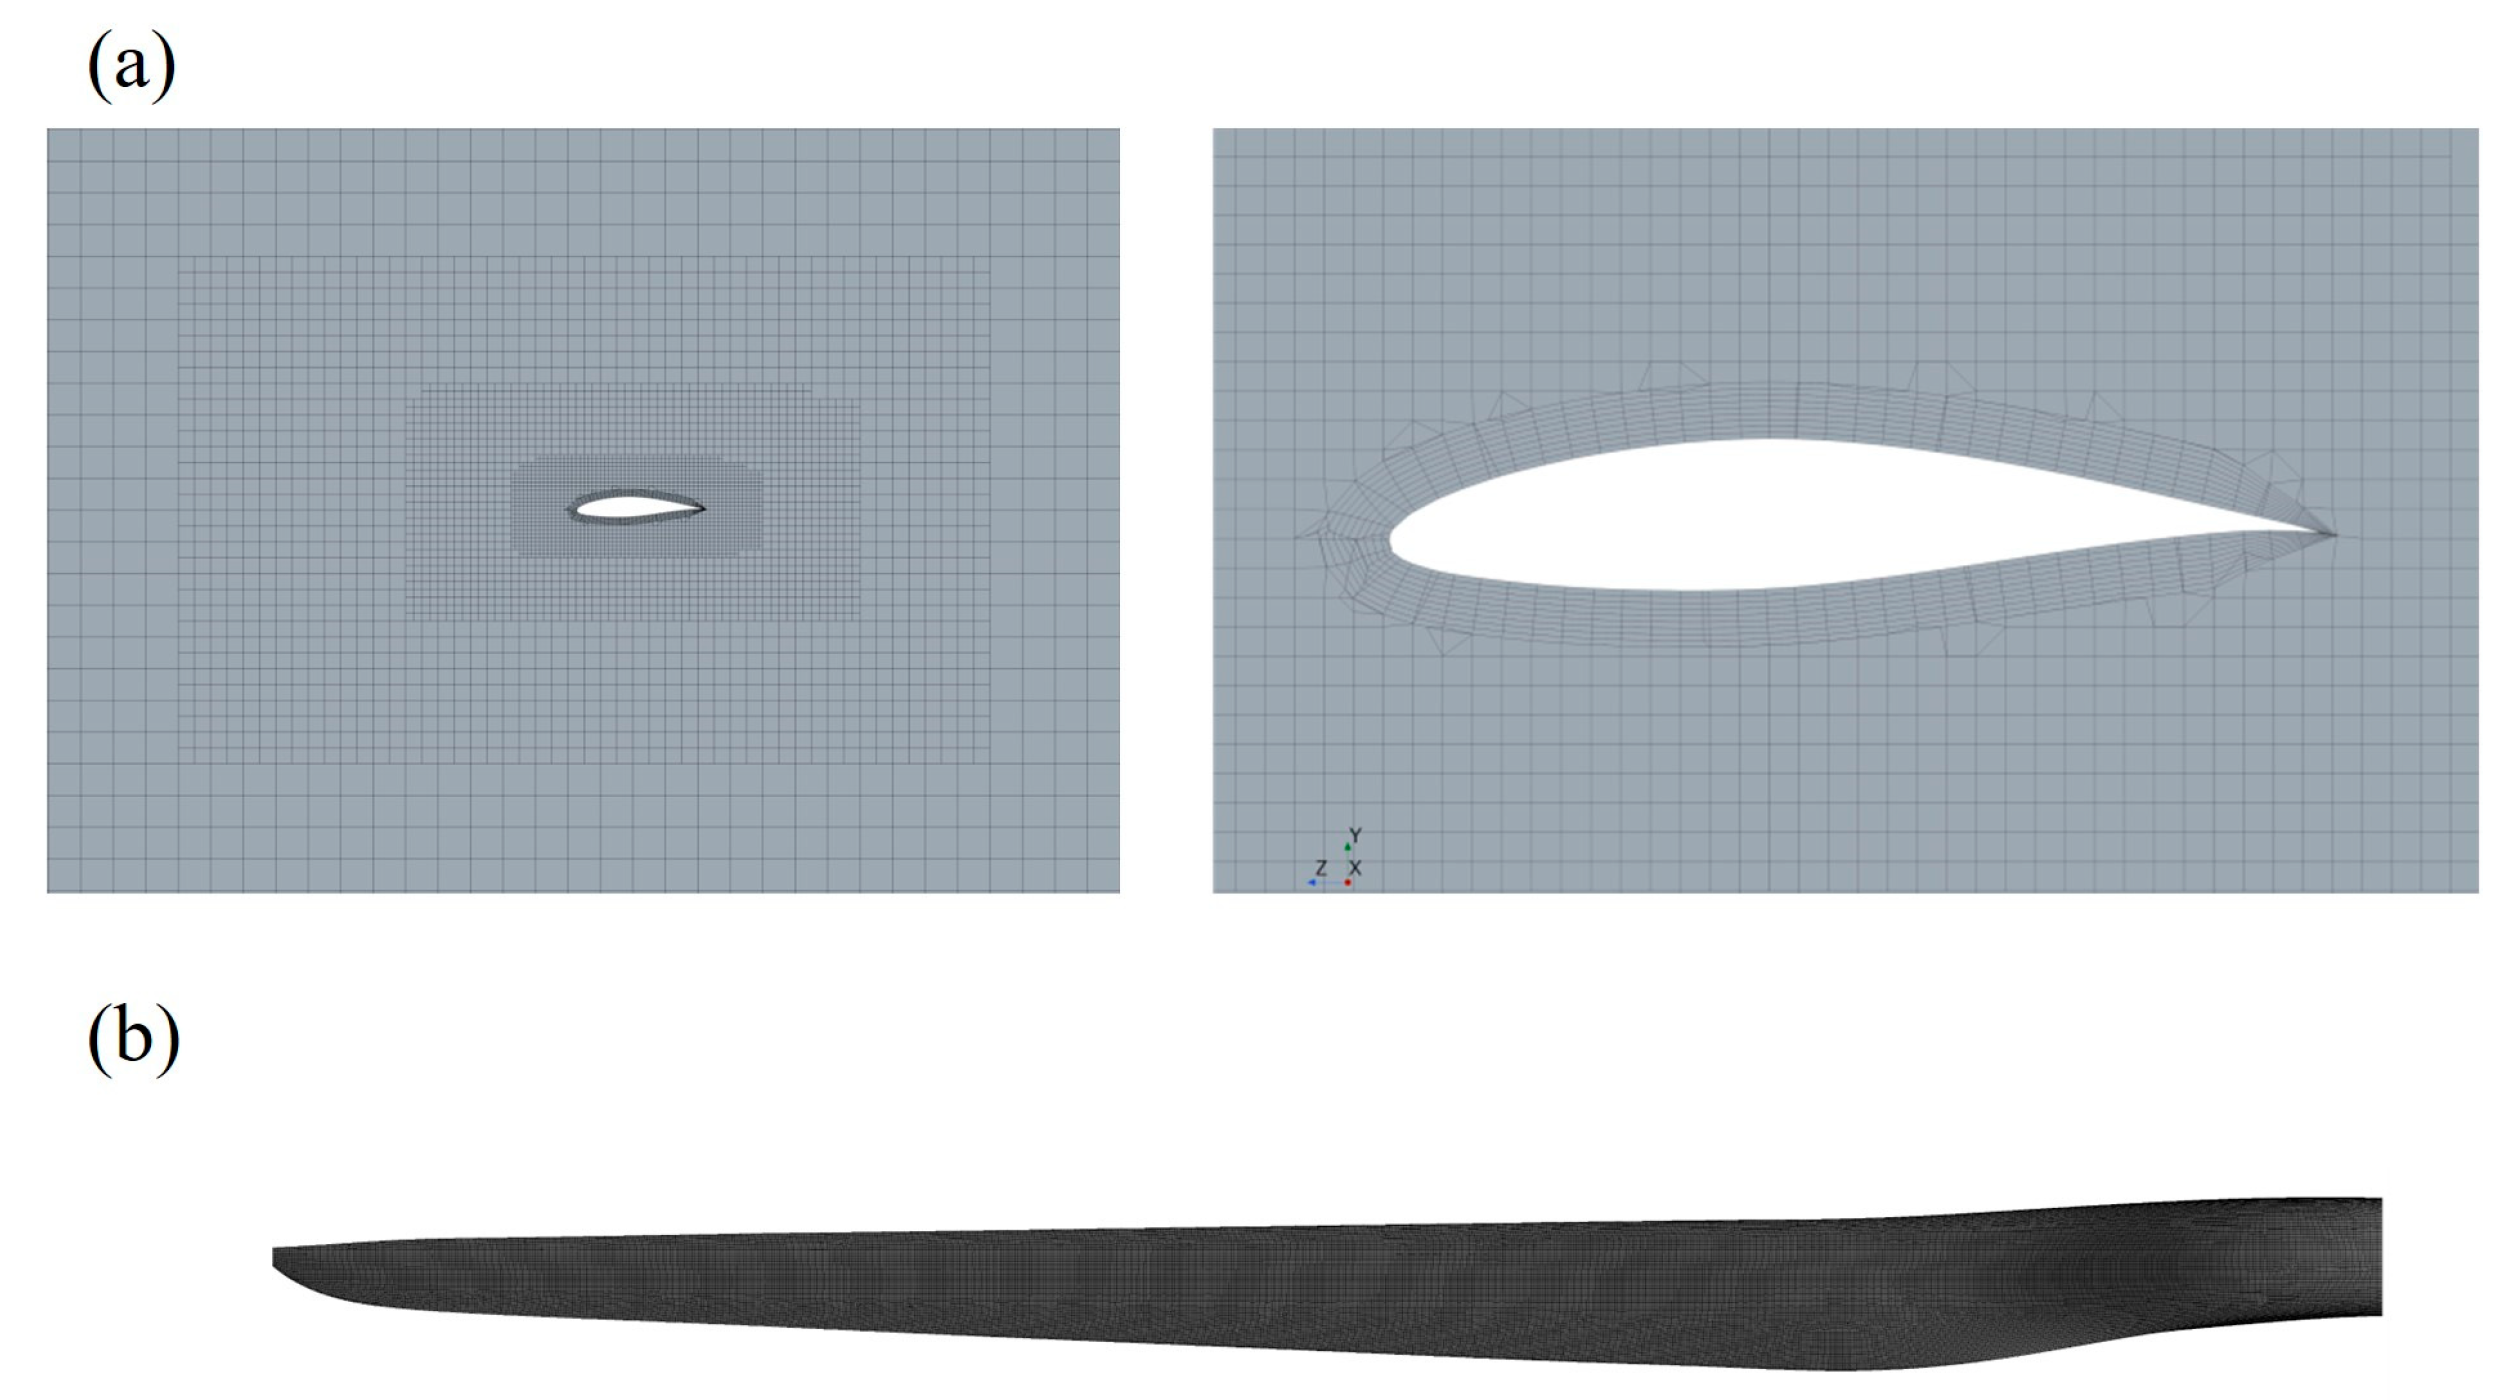
Figure 9: Mesh of blade cross-section (a) and blade surface (b).
The aerodynamic load was derived from CFD simulations, where the maximum surface pressure was mapped as a distributed load on the blade in the ANSYS Workbench Static Structural module. A linear elastic finite element analysis was conducted by assuming small deformations and a linear stress–strain relationship. The von Mises equivalent stress criterion was used to evaluate the stress distribution and to identify critical regions relative to the yield strength. The blade material was assumed to be structural steel, with the corresponding properties summarized in Table 2. This approach follows standard practice for one-way fluid–structure interaction analysis, where CFD-derived pressures are applied to a structural model for static stress evaluation [39,40,41].
Table 2: Structural steel material parameter table.
| Density/(kg/m3) | Young’s Modulus/(Mpa) | Poisson’s Ratio | Bulk Modulus/(Pa) | Shear Moduzlus/(Pa) | Strength Coefficient/(Pa) |
|---|---|---|---|---|---|
| 7850 | 2 × 10¹¹ | 0.3 | 1.67 × 10¹¹ | 7.69 × 10¹⁰ | 9.2 × 10⁸ |
The physically modeled wind turbine is placed in a virtual downburst wind field for simulation calculations, enabling the analysis of surface pressure distribution on the windward and leeward sides under varying jet parameters. The surface pressure coefficient Cp is also calculated, with the expectation of providing theoretical support for the safe operation of wind turbines in randomly occurring downburst wind fields. The dimensionless surface wind pressure coefficient Cp is defined as:
The surface pressure contour of the wind turbine in the downburst wind field under four different jet velocities is illustrated in Fig. 10. It can be clearly seen that the jet velocity has a significant impact on the wind pressure on the surface of the wind turbine, mainly reflected in the high-pressure distribution areas on the surfaces of two wind turbine blades and the tower near the ground. Different jet velocities produce downdrafts of varying intensities, leading to differences in the extent of airflow dispersion at the same position and, consequently, variations in the wind loads experienced by the wind turbine. At a jet velocity of 5 m/s, the high-pressure region is confined to the lower windward side of the tower, resulting in a maximum surface pressure at the blade tip of approximately 10 Pa. As jet velocity increases, the high-pressure region extends upward, gradually affecting the entire tower and the two near-ground blades. At a jet velocity of 10 m/s, the maximum blade surface pressure reaches 45.7 Pa, located roughly at the midsection of the windward side of the blades. At jet velocities of 15 m/s and 20 m/s, the high-pressure region distribution remains largely similar, but the pressure values nearly double. At 15 m/s, the maximum pressure at the midsection of the blade’s windward side is 103.7 Pa, while at 20 m/s, the surface pressure at the same location reaches 180.3 Pa. The surface pressure at the top of the tower increases from 6.5 Pa to 112 Pa. Besides, it is evident to find that when the jet velocity is low, the pressure coefficient across almost all areas of the wind turbine remains extremely low, with only the lower part of the tower exhibiting a noticeably higher pressure coefficient than other areas. When the jet velocity exceeds 10 m/s, negative pressure zones emerge on both sides of the tower’s windward face and the leeward side. This occurs because stronger airflow, upon bypassing the wind turbine surface, undergoes separation, causing the airflow on the leeward side to become turbulent and form a low-pressure zone. This low-pressure zone further attracts surrounding airflow, expanding the scope and intensity of the negative pressure region. It is worth noting that the wind pressure distributions obtained here exhibit similar characteristics to those observed on buildings and transmission towers under downbursts [42], such as positive pressures on the windward side and suction on the leeward side, supporting the physical plausibility of the present results.
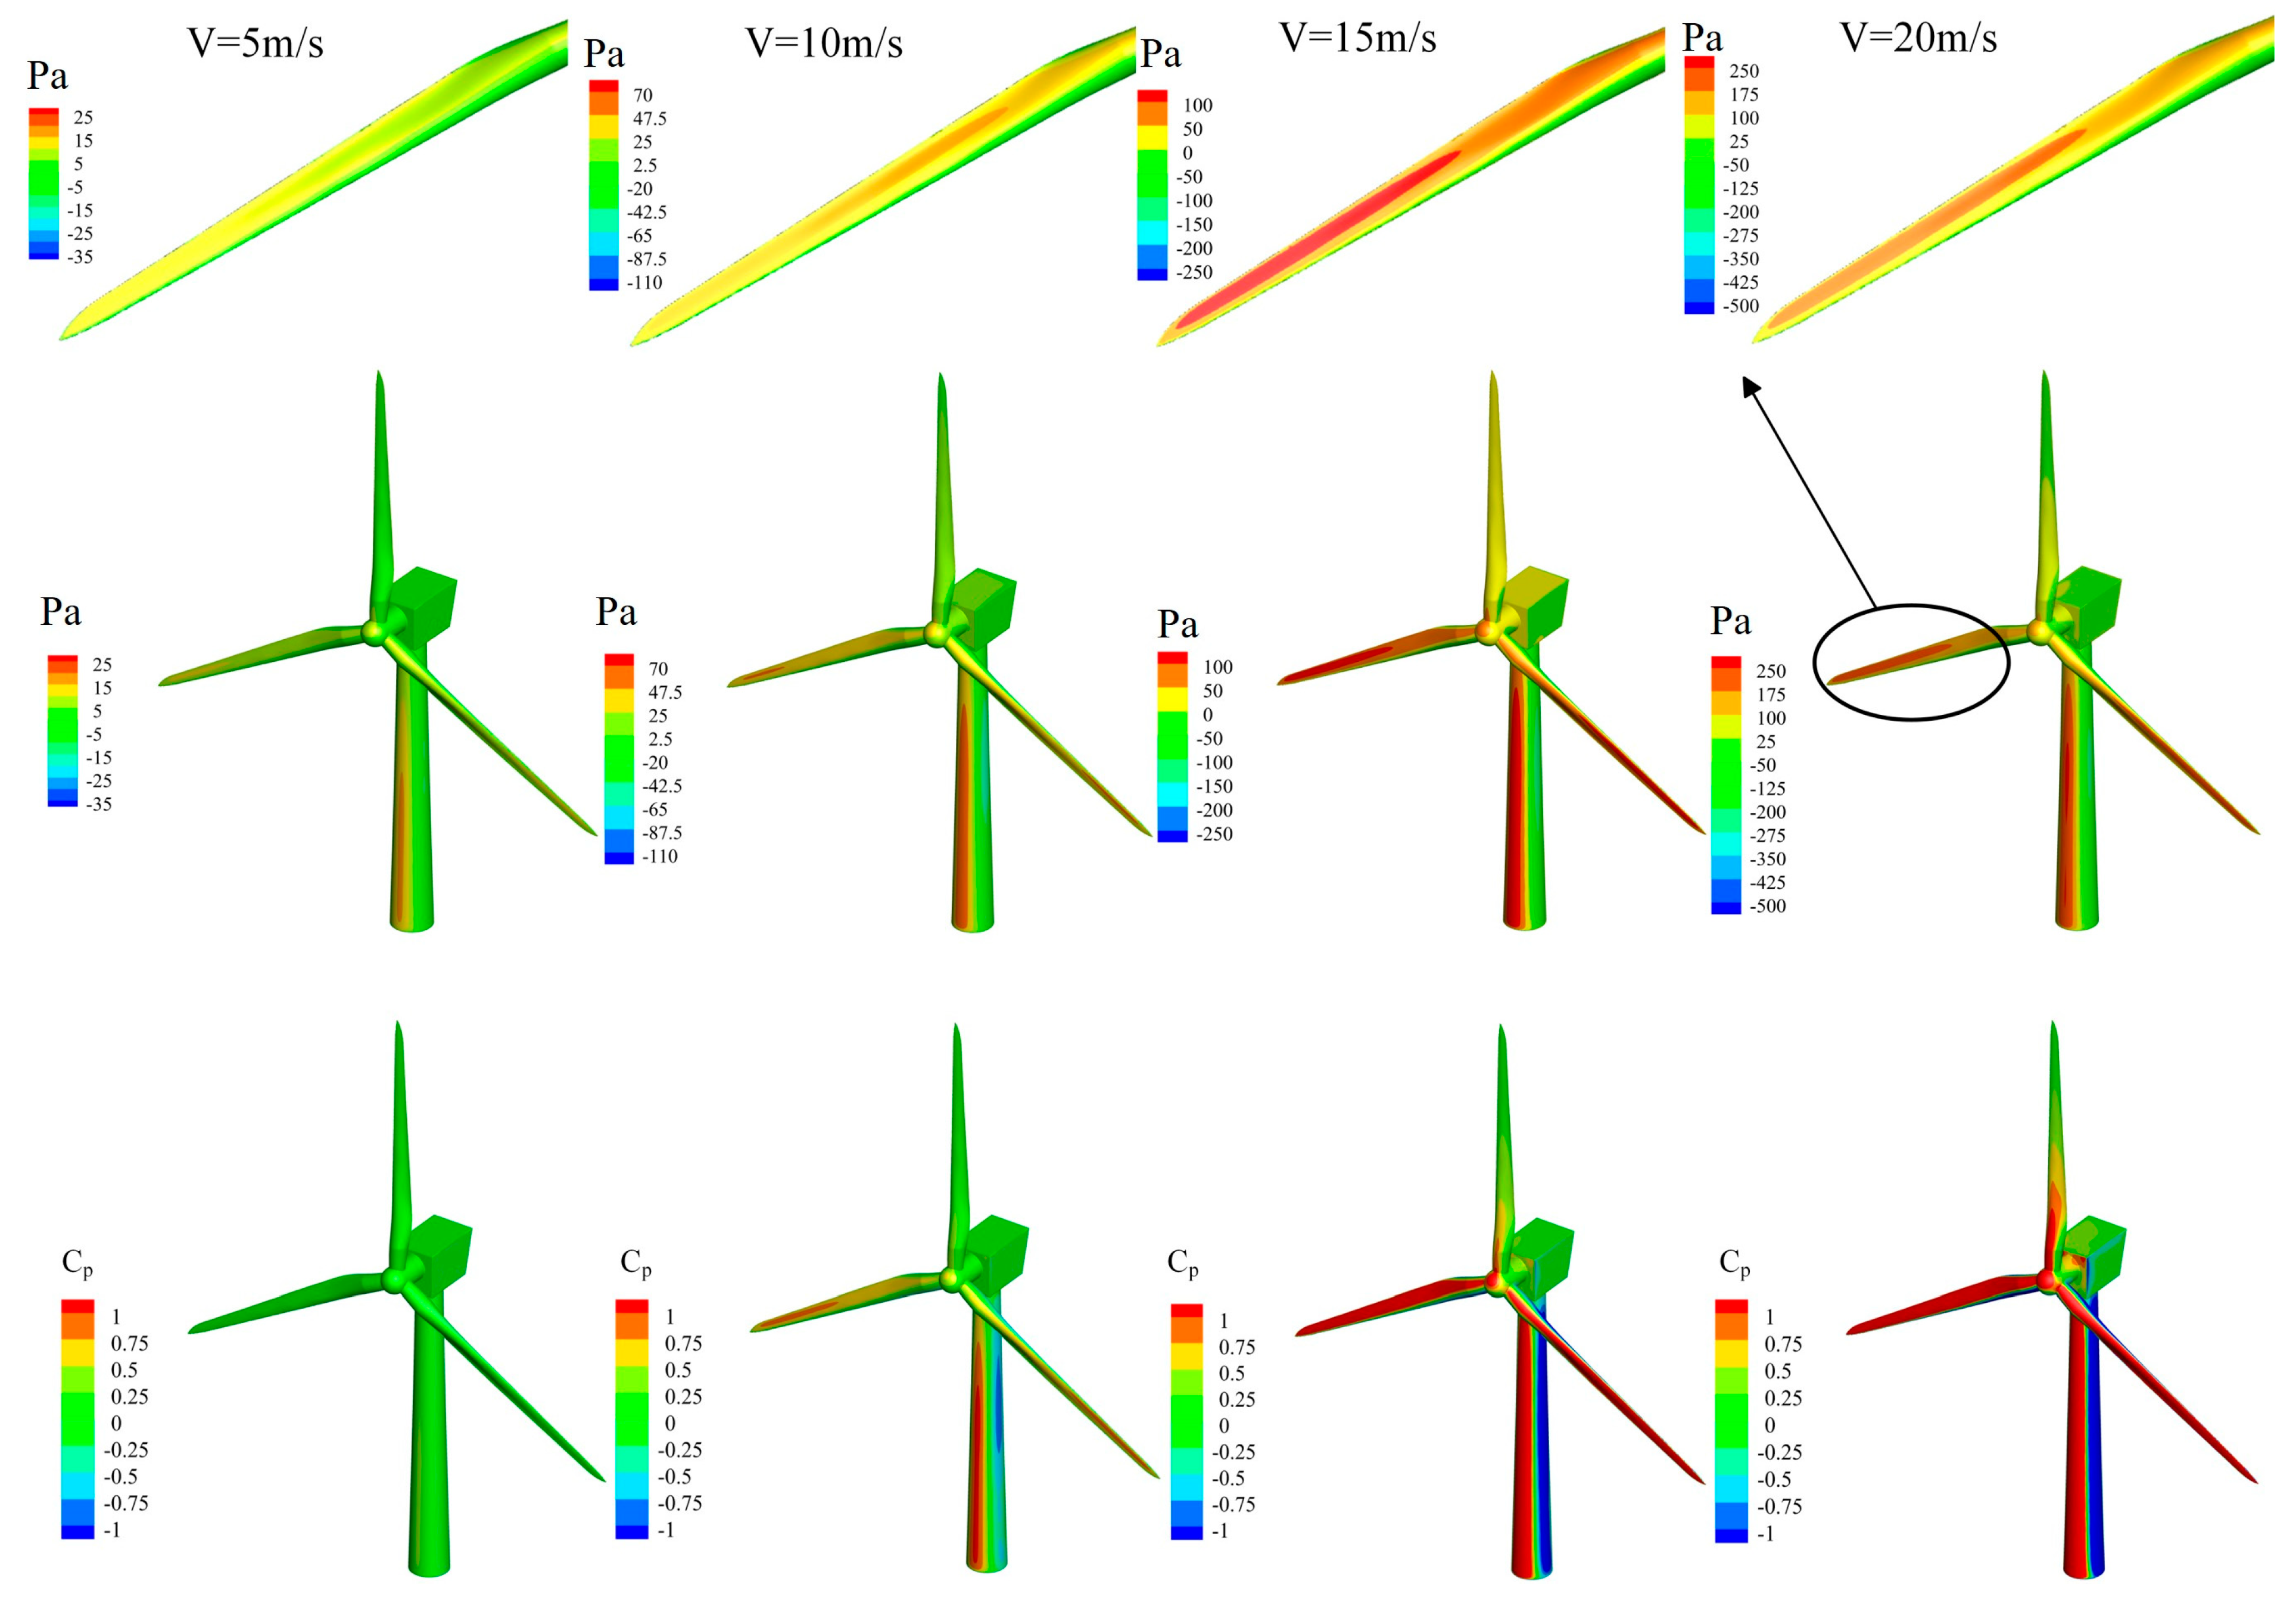
Figure 10: Surface pressure distribution at different jet velocity.
Fig. 11 presents cloud maps of surface pressure and dimensionless pressure coefficient distributions on a wind turbine within a downburst wind field under four different jet heights. It is evident that the surface pressure on the wind turbine varies significantly across different jet heights in the downburst wind field. As jet height increases from low to high, the high-pressure regions on the wind turbine surface show a decreasing trend. At jet heights of 0.3 m and 0.6 m, high-pressure regions are observed on the windward side of the tower and at the tips of the two near-ground blades. However, as jet height further increases, high-pressure regions on the wind turbine surface are confined to the portion of the tower’s windward side below the hub, the loading on the tips of the two blades near the ground is smaller. When the jet height ranges from 0.9 m to 1.2 m, the maximum surface pressure at the blade tips is 32 Pa and 25.6 Pa, respectively. This indicates that once the jet height exceeds a certain threshold, further increases in height have a diminishing effect on blade surface pressure. Airflows of the same intensity, generated at different heights and descending. At greater jet heights, the airflow weakens over a longer distance, significantly reducing its intensity by the time it reaches the ground and spreads to the wind turbine surface. The dimensionless pressure coefficient maps reveal that at jet heights of 0.3 m and 0.6 m, a negative pressure zone appears behind the tower below the hub, with coefficients of −1 near the upper-middle part of the tower and around −0.75 in the surrounding area. The pressure coefficient at the tips of the two near-ground blades and on the windward side of the tower is around 1, gradually decreasing along the surface on both sides of the windward face until negative pressure emerges. At jet heights of 0.9 m and 1.2 m, the negative pressure zone on the rear side of the tower’s mid-section has a pressure coefficient of around −0.25. The pressure coefficient at the blade tips fluctuates around 0.5, the pressure coefficient in the mid-lower section of the tower is approximately 1. An increase in jet height significantly reduces the maximum horizontal wind speed in the wind field, concurrently decreasing the loading on the wind turbine.
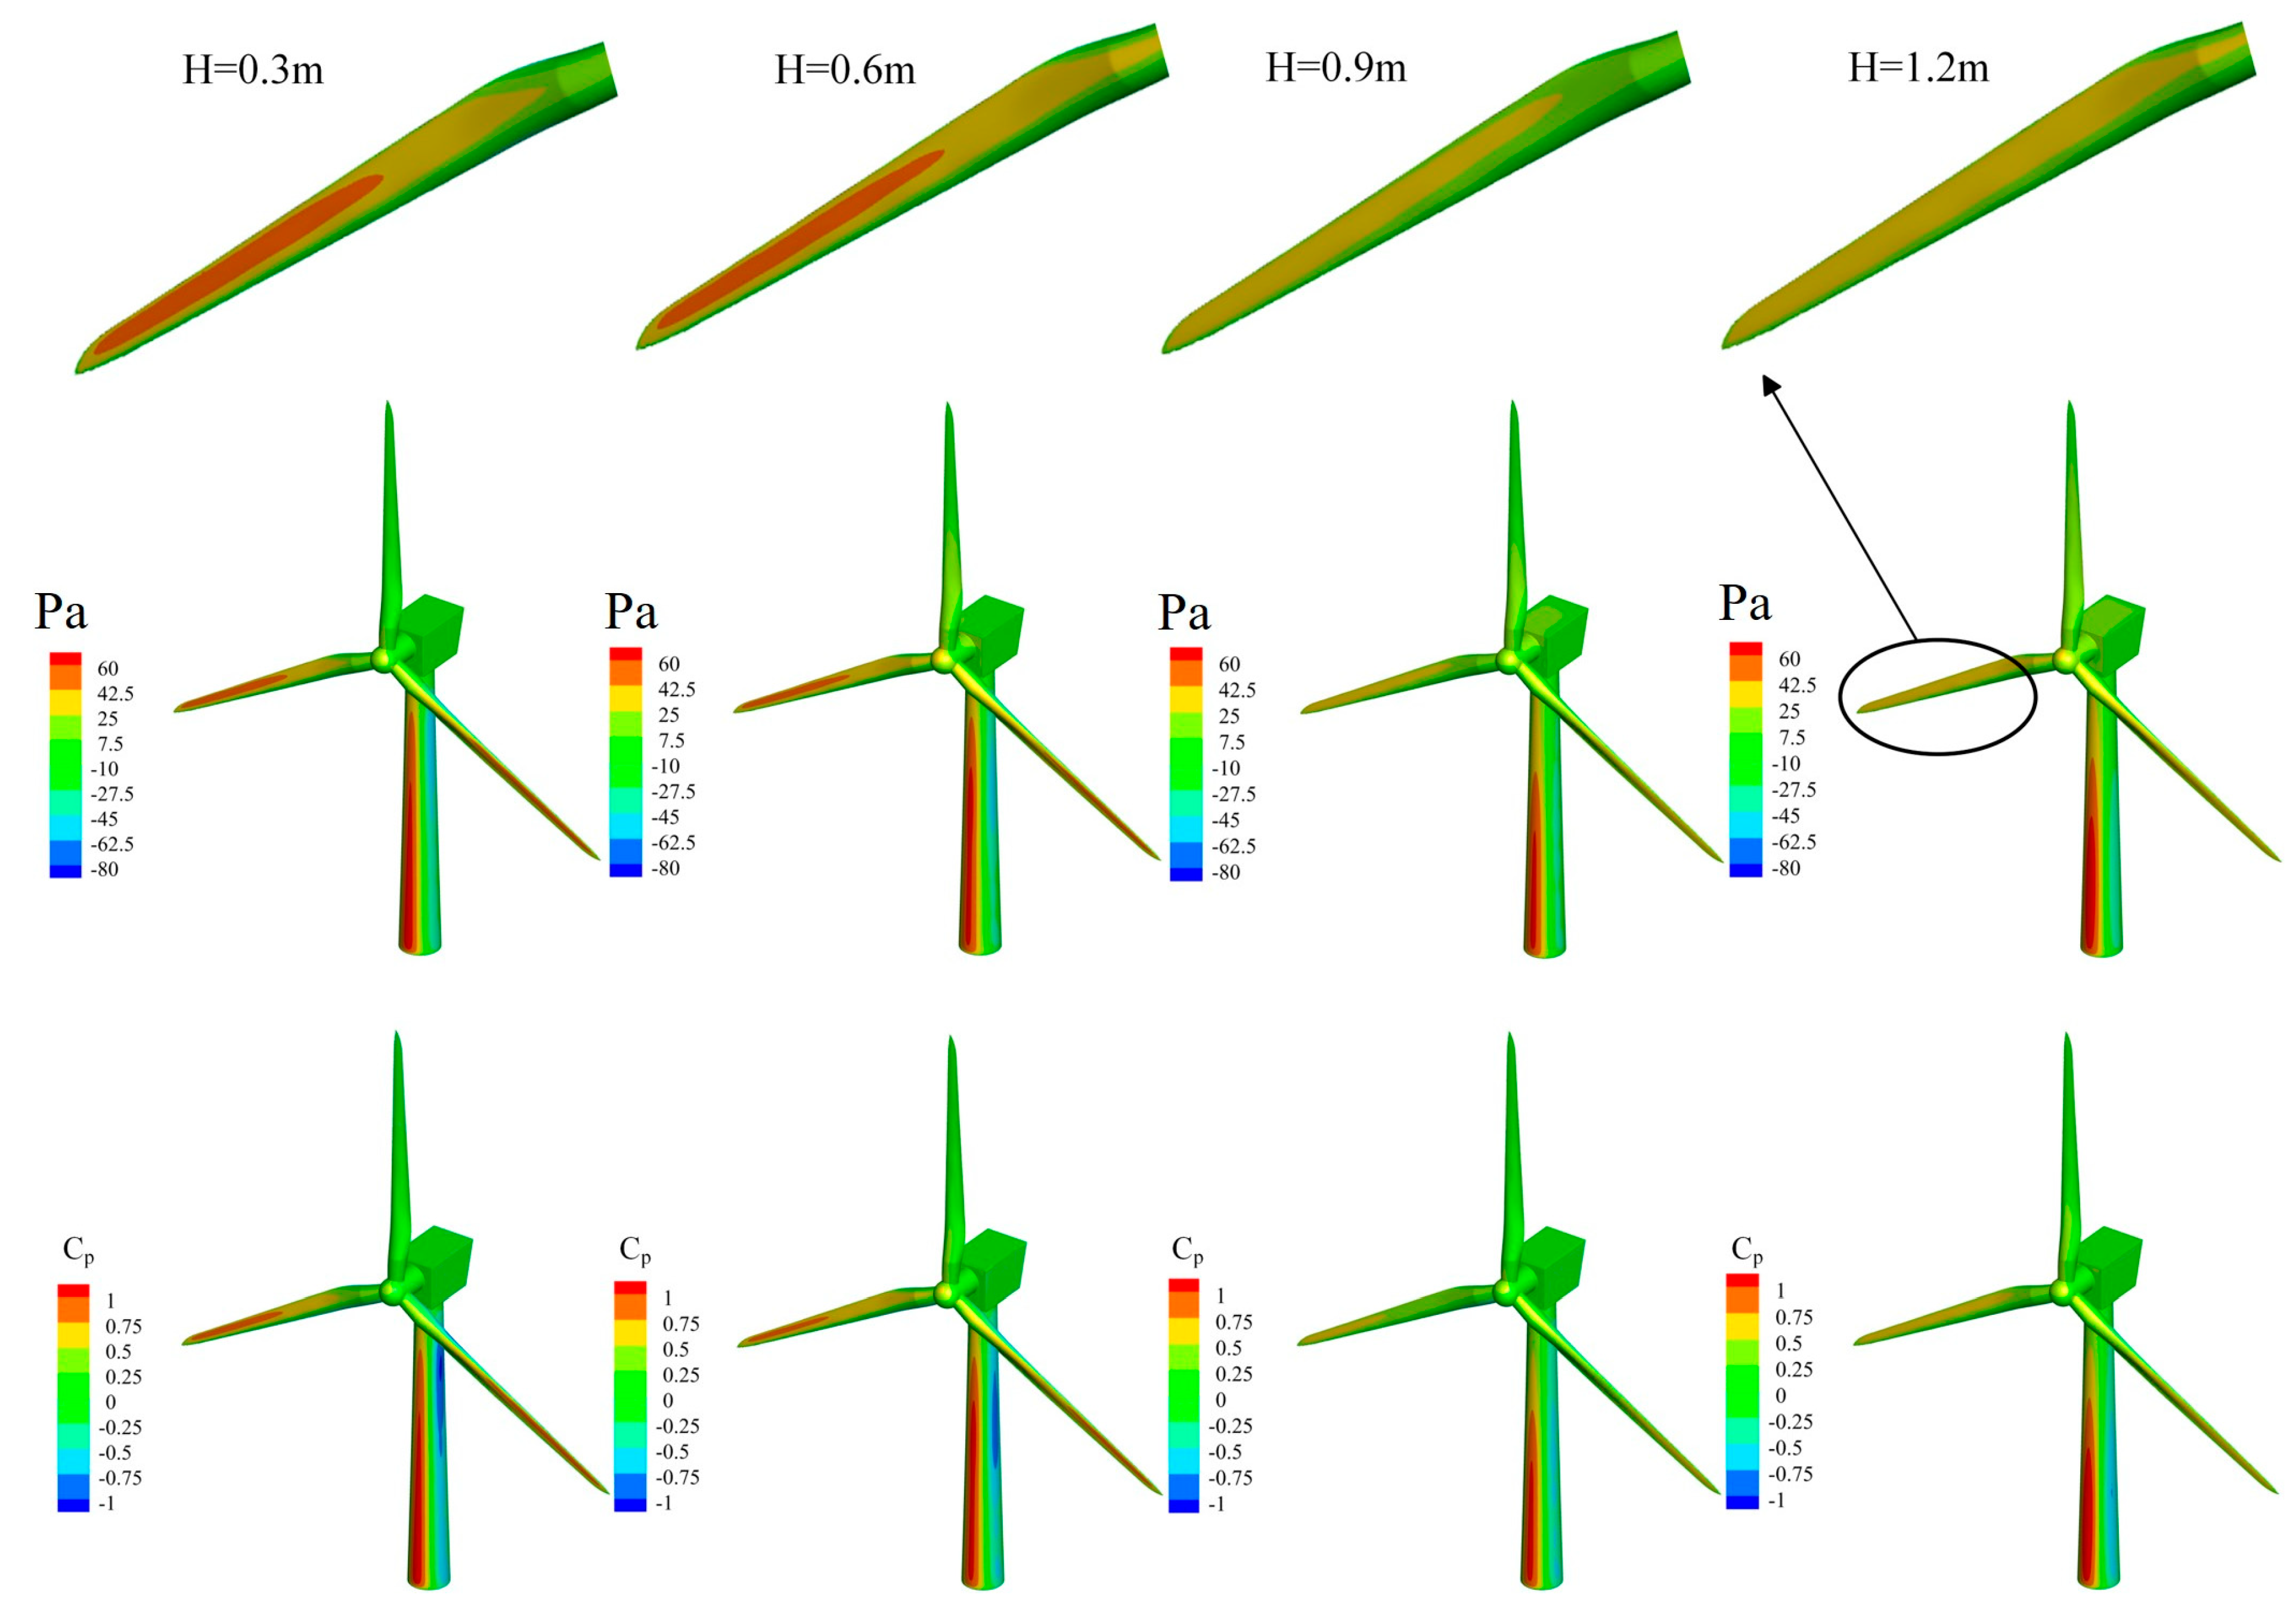
Figure 11: Surface pressure distribution at different jet height.
The cloud maps of surface pressure and dimensionless pressure coefficient distributions for a wind turbine under five different jet diameters is provided in Fig. 12. Changes in jet diameter indirectly alter the position of the wind turbine within the wind field, resulting in markedly different loading conditions for the wind turbine at various locations. When the jet diameter is small, there remains a distance between the radial position of the wind turbine and the jet region. In this case, the wind turbine is subjected to winds generated by the downdraft impacting the ground and subsequently spreading outward along the surface, with the primary loaded areas being the tower and the windward side of the blades. As the jet diameter increases, the radial position of the wind turbine gradually approaches the jet region. Once the jet diameter exceeds 0.4 m, the wind turbine experiences direct impact from the downdraft, leading to significant differences in the direction and intensity of the wind loads it endures. The surface pressure cloud maps reveal that at a jet diameter of 0.3 m, high-pressure regions are predominantly located at the tower and near-ground blade tip positions. A negative pressure zone emerges behind the tower due to flow separation, with the maximum surface pressure at the blade tip reaching 45.7 Pa. When the jet diameter exceeds 0.4 m, high-pressure regions extend across the entire surface of the wind turbine, significantly increasing the loading. The maximum surface pressure on the windward side of the blades ranges from 55 to 65 Pa. The dimensionless pressure coefficient cloud maps indicate that the pressure coefficient at the near-ground blade tip increases progressively from 0.75 to 1.07. The pressure coefficient in the region beside the tower shifts from −0.75 at smaller diameters to 0.81 at a jet diameter of 0.6 m. The dimensionless pressure coefficient directly in front of the tower remains approximately 1. Changes in jet diameter primarily influence the position of the maximum radial wind speed. When the jet region encompasses the radial position of the wind turbine, the wind loads experienced by the turbine are significantly greater.
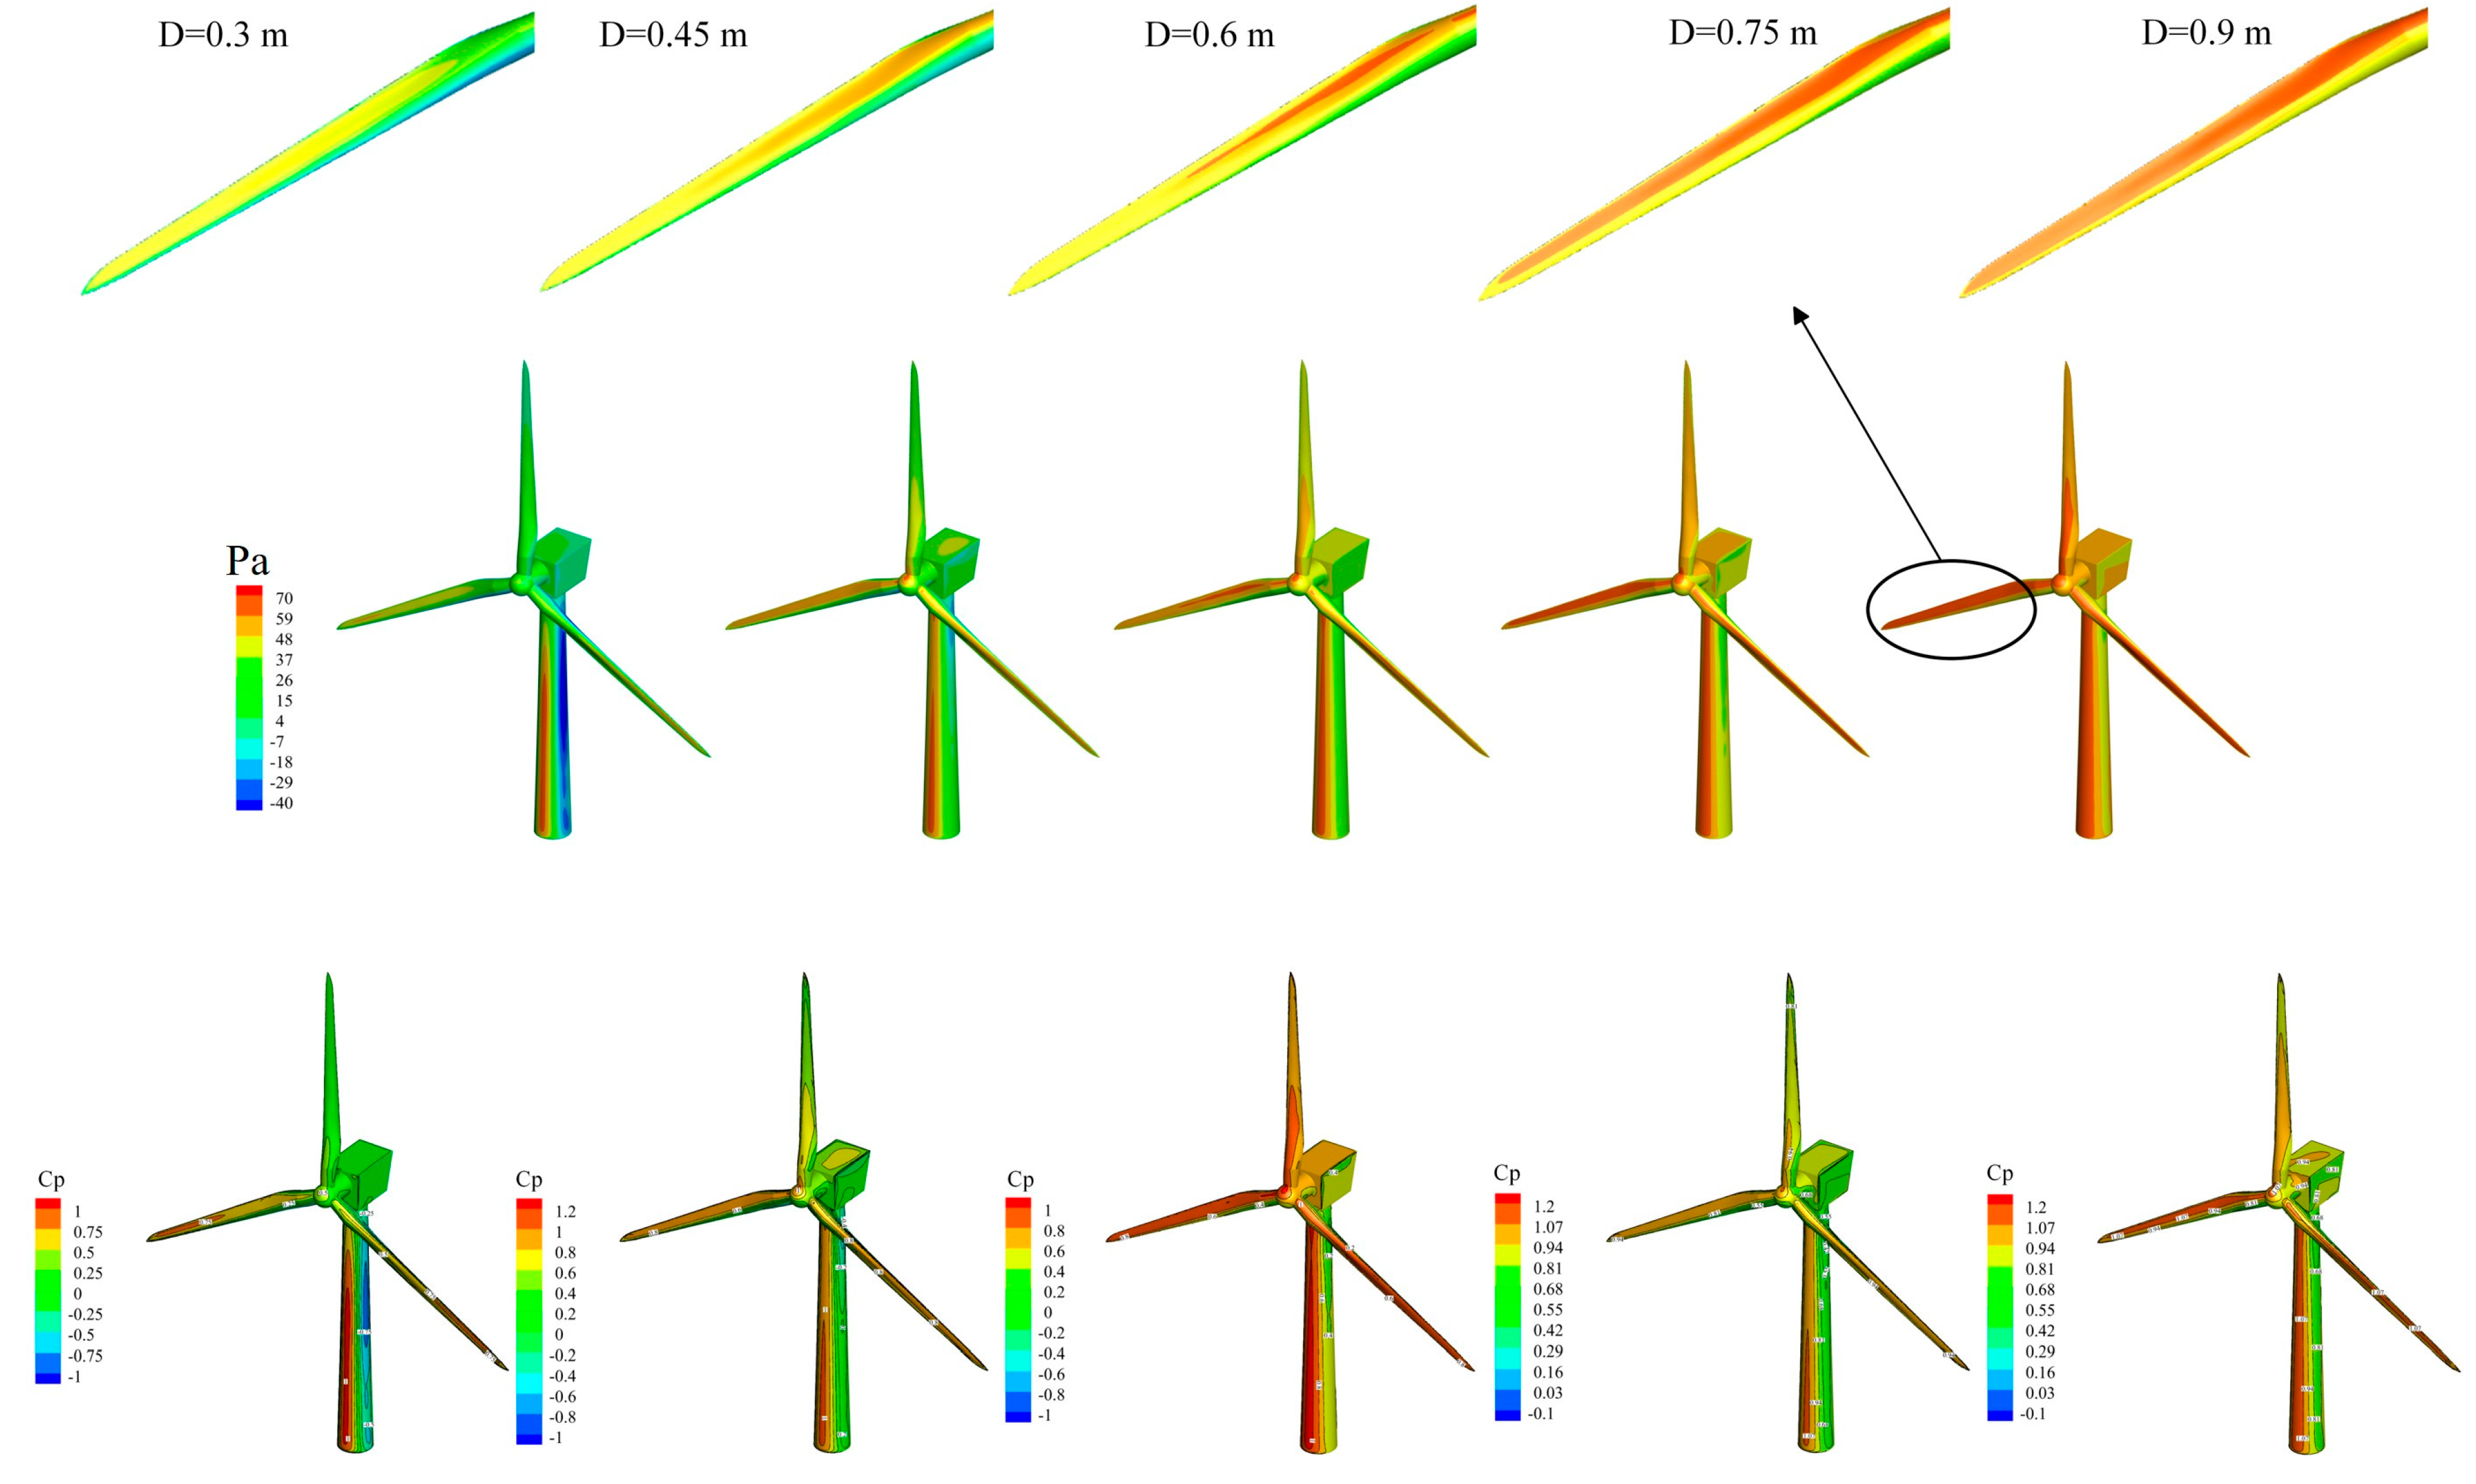
Figure 12: Surface pressure distribution at different jet diameter.
The pressure coefficient values at several specific points on the blade were selected and plotted in a line chart, as illustrated in Fig. 13, where the abscissa is normalized by the blade length. It can be observed that the pressure coefficient at the blade tip is generally higher than at the root, exhibiting a gradually increasing trend along the axial direction. An increase in jet velocity directly enhances the airflow intensity, leading to a substantial rise in the surface pressure coefficient near the blade tip. At a jet velocity of 10 m/s, the surface pressure coefficient is 0.82, whereas at 20 m/s, it reaches approximately 3.73, representing an increase of nearly 4.5 times. Jet height provides a dissipation path for the downdraft, with higher heights resulting in lower surface pressure coefficients and a reduced rate of increase from the root to the tip. As the jet height varies from 0.3 m to 1.2 m, the pressure coefficient at the tip decreases by approximately a factor of 2. When the jet diameter is larger, the blade surface exhibits higher pressure from the root to the tip. However, when the jet diameter exceeds the radial position of the wind turbine, the variation in the surface pressure coefficient becomes less pronounced. As the jet diameter increases from 0.3 m to 0.9 m, the pressure coefficient at the blade root rises by a factor of 5.
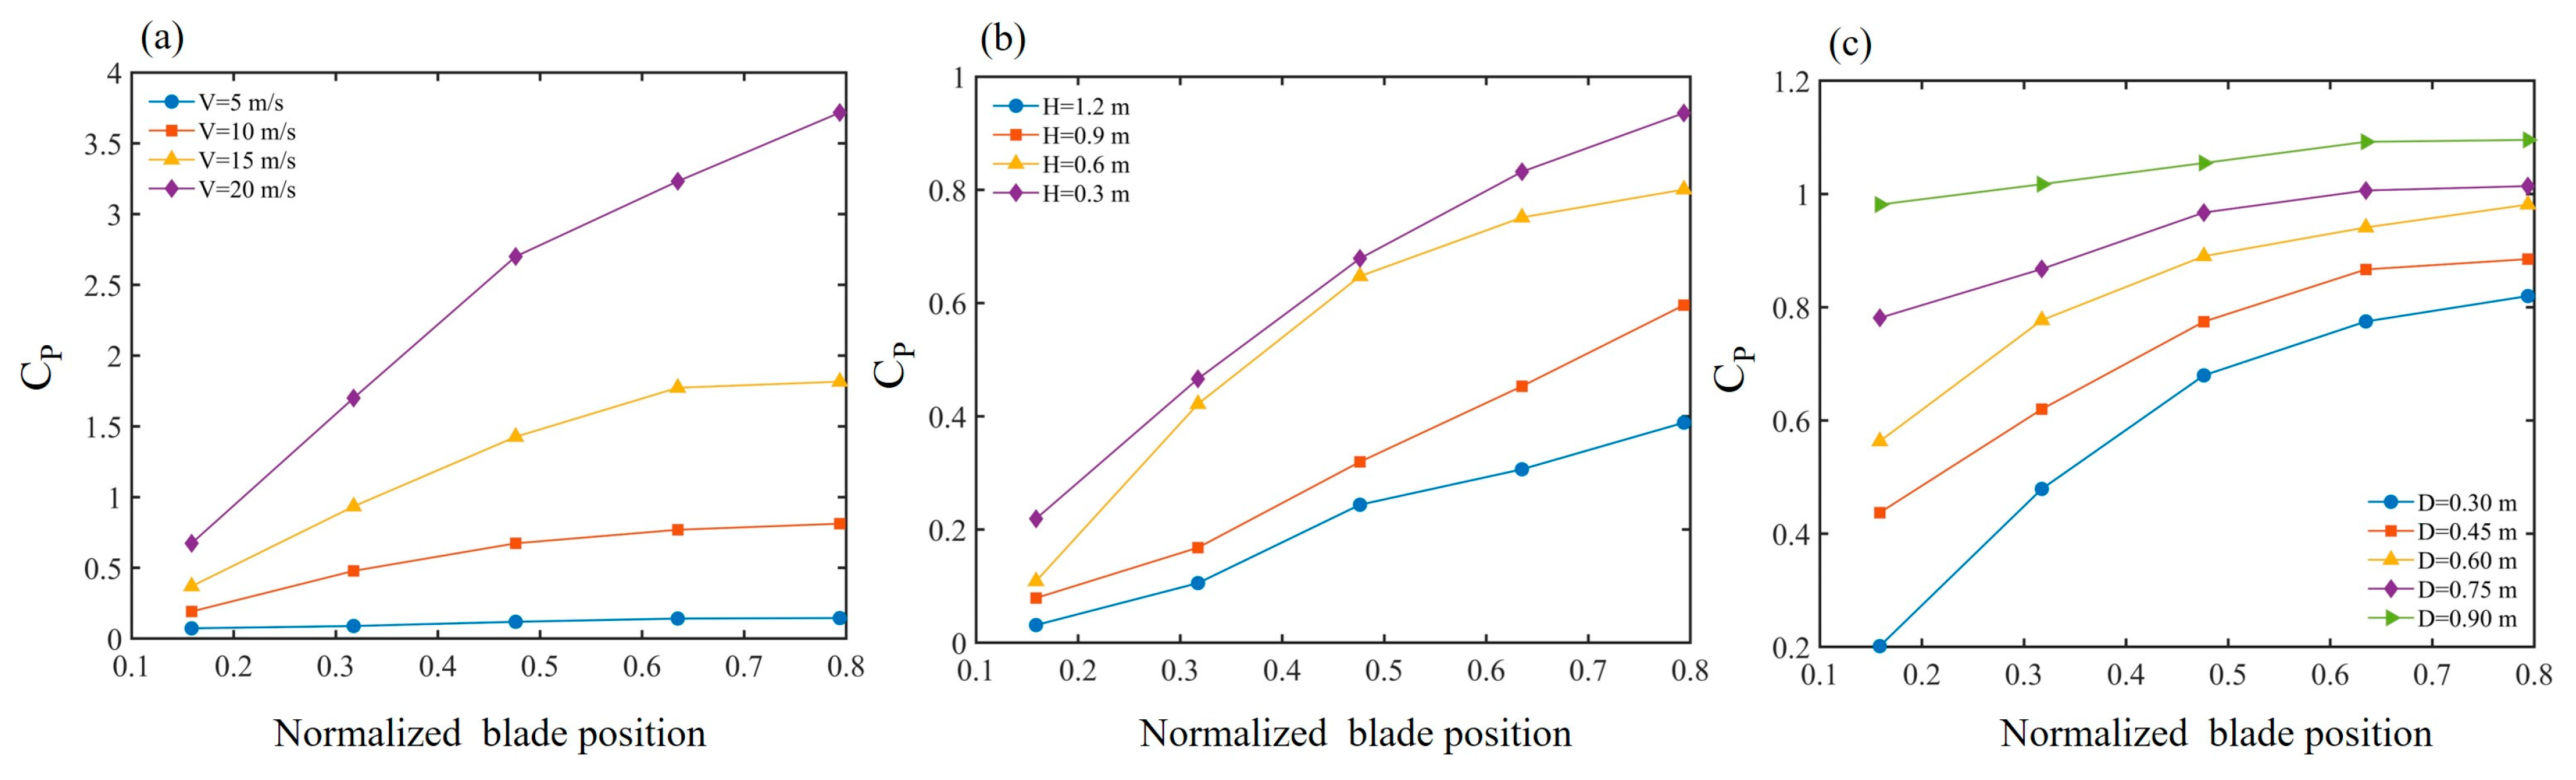
Figure 13: Blade surface pressure coefficient: (a) different velocity. (b) different height. (c) different diameter.
Structural analysis of the blades can provide an overall understanding of the variation patterns of structural stress and strain. By placing the wind turbine in a virtual downburst wind field and applying the pressures obtained from the flow field to the blade surfaces, the deformation and structural dynamic properties such as stress and strain of the wind turbine blades can be solved. The wind turbine is placed at a radial position 1Djet away from the center of the jet in the virtual downburst wind field. The NREL 5 MW wind turbine is taken as the research object, which has a rotor diameter of 126 m, a hub height of 90 m, and a scaled-down model with a ratio of 1:1000 is used in the calculations. The maximum structural deformation and equivalent stress of the wind turbine under different jet parameters are shown in Fig. 14.
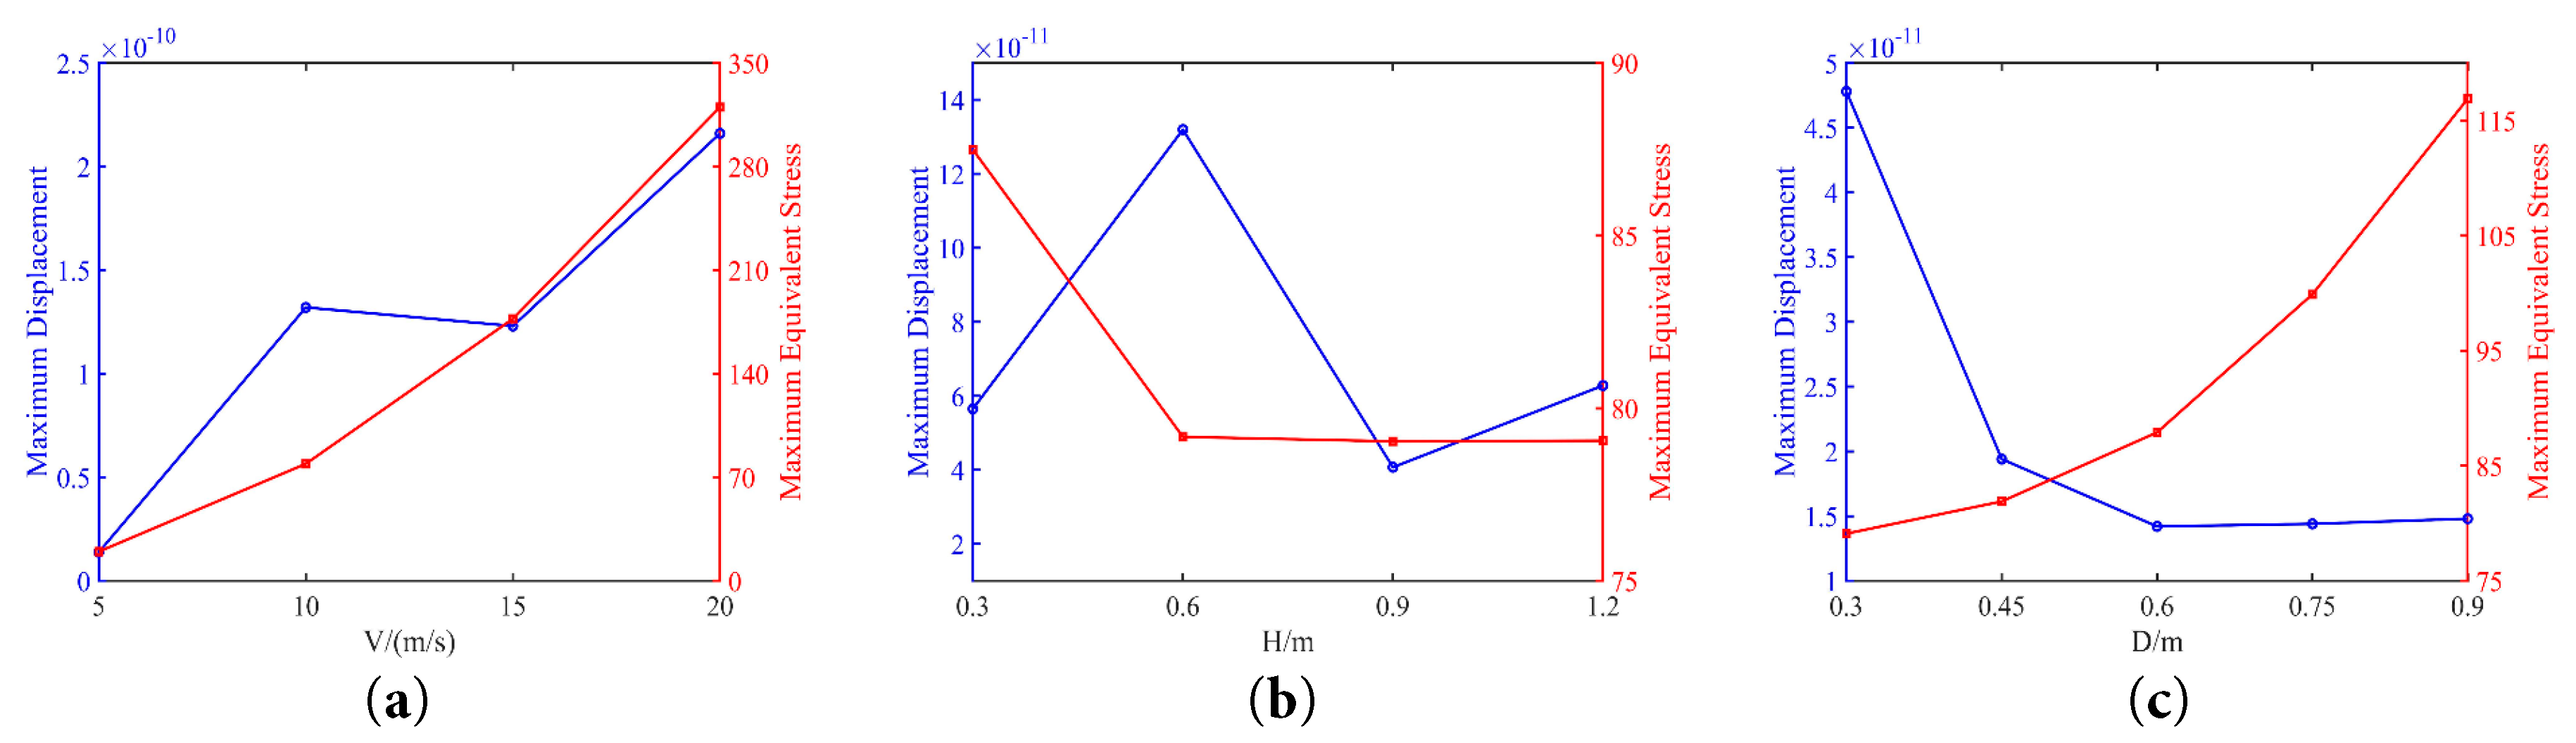
Figure 14: Maximum displacement and maximum equivalent stress: (a) different velocity. (b) different diameter. (c) different height.
It can be seen from Fig. 14a that the maximum equivalent stress increases nearly linearly with rising jet velocity. The maximum displacement increases with jet velocity, with an approximately tenfold increase observed as the jet velocity varies from 0 to 20 m/s. This indicates that both the maximum deformation and maximum equivalent stress of the blades are significantly influenced by jet velocity, rendering the blades susceptible to fracture and damage under extreme wind loads in severe weather conditions. Fig. 14b clearly demonstrates that with jet height increases, the maximum equivalent stress initially decreases, but after reaching a jet height of 0.6 m, it continues to rise and stabilizes at a relatively constant level of approximately 78 MPa. According to Fig. 14c, changes in jet diameter result in a uniform variation of the maximum equivalent stress, which generally follows a quadratic increasing trend with increasing jet diameter, peaking at 117 MPa when the jet diameter reaches 0.9 m. The maximum displacement decreases rapidly as the jet diameter increases from 0.3 m to 0.45 m, after which further increases in jet diameter led to an initial reduction in maximum equivalent stress followed by relative stability. The maximum equivalent stress and the maximum deformation exhibit opposite variation trends as the jet diameter increases. When the diameter of the downburst wind field is larger, localized deformation continues to rise steadily. The broader jet region generates greater localized equivalent stress, making the structure more prone to damage.
Fig. 15 shows the three-dimensional surface plots of the maximum structural deformation and maximum equivalent stress varying with jet diameter and jet velocity. As seen in Fig. 15a, when the wind speed is 5 m/s, an increase in jet diameter leads to a rapid increase in maximum structural deformation, reaching the maximum displacement at a jet diameter of around 0.75 m. The reason for this phenomenon is that the increase in jet diameter causes the gas pressure generated by the high-speed airflow impacting the ground and spreading out to act entirely on the surface of the wind turbine, thereby causing a sharp increase in structural deformation. As the jet velocity continues to increase, a small local protrusion appears at smaller jet diameters. This indicates that when the jet velocity is high, the maximum structural deformation is less affected by changes in jet diameter, possibly because the simultaneous increase in jet diameter and jet velocity affects the location where the high-pressure region is generated. From Fig. 15b, it can be observed that the maximum equivalent stress shows a generally stable trend with changes in jet diameter and velocity, with a relatively small curvature of the three-dimensional surface. It can be approximated as a two-dimensional plane at a certain angle relative to the horizontal reference plane, although the angle of inclination varies at specific locations and is greater when the jet velocity is higher. Under each wind speed, the maximum equivalent stress increases with the increase of jet diameter, and the rate of increase becomes faster as the jet velocity increases. The peak value is reached at a jet velocity of 20 m/s and a jet diameter of 0.75 m. It is evident that the variation of equivalent stress is significantly influenced by both jet diameter and jet velocity. The location of the maximum equivalent stress changes with the increase of jet diameter. When the jet diameter is greater than the radial distance of the wind turbine from the jet center, the maximum equivalent stress occurs on the leeward side of the wind turbine hub.
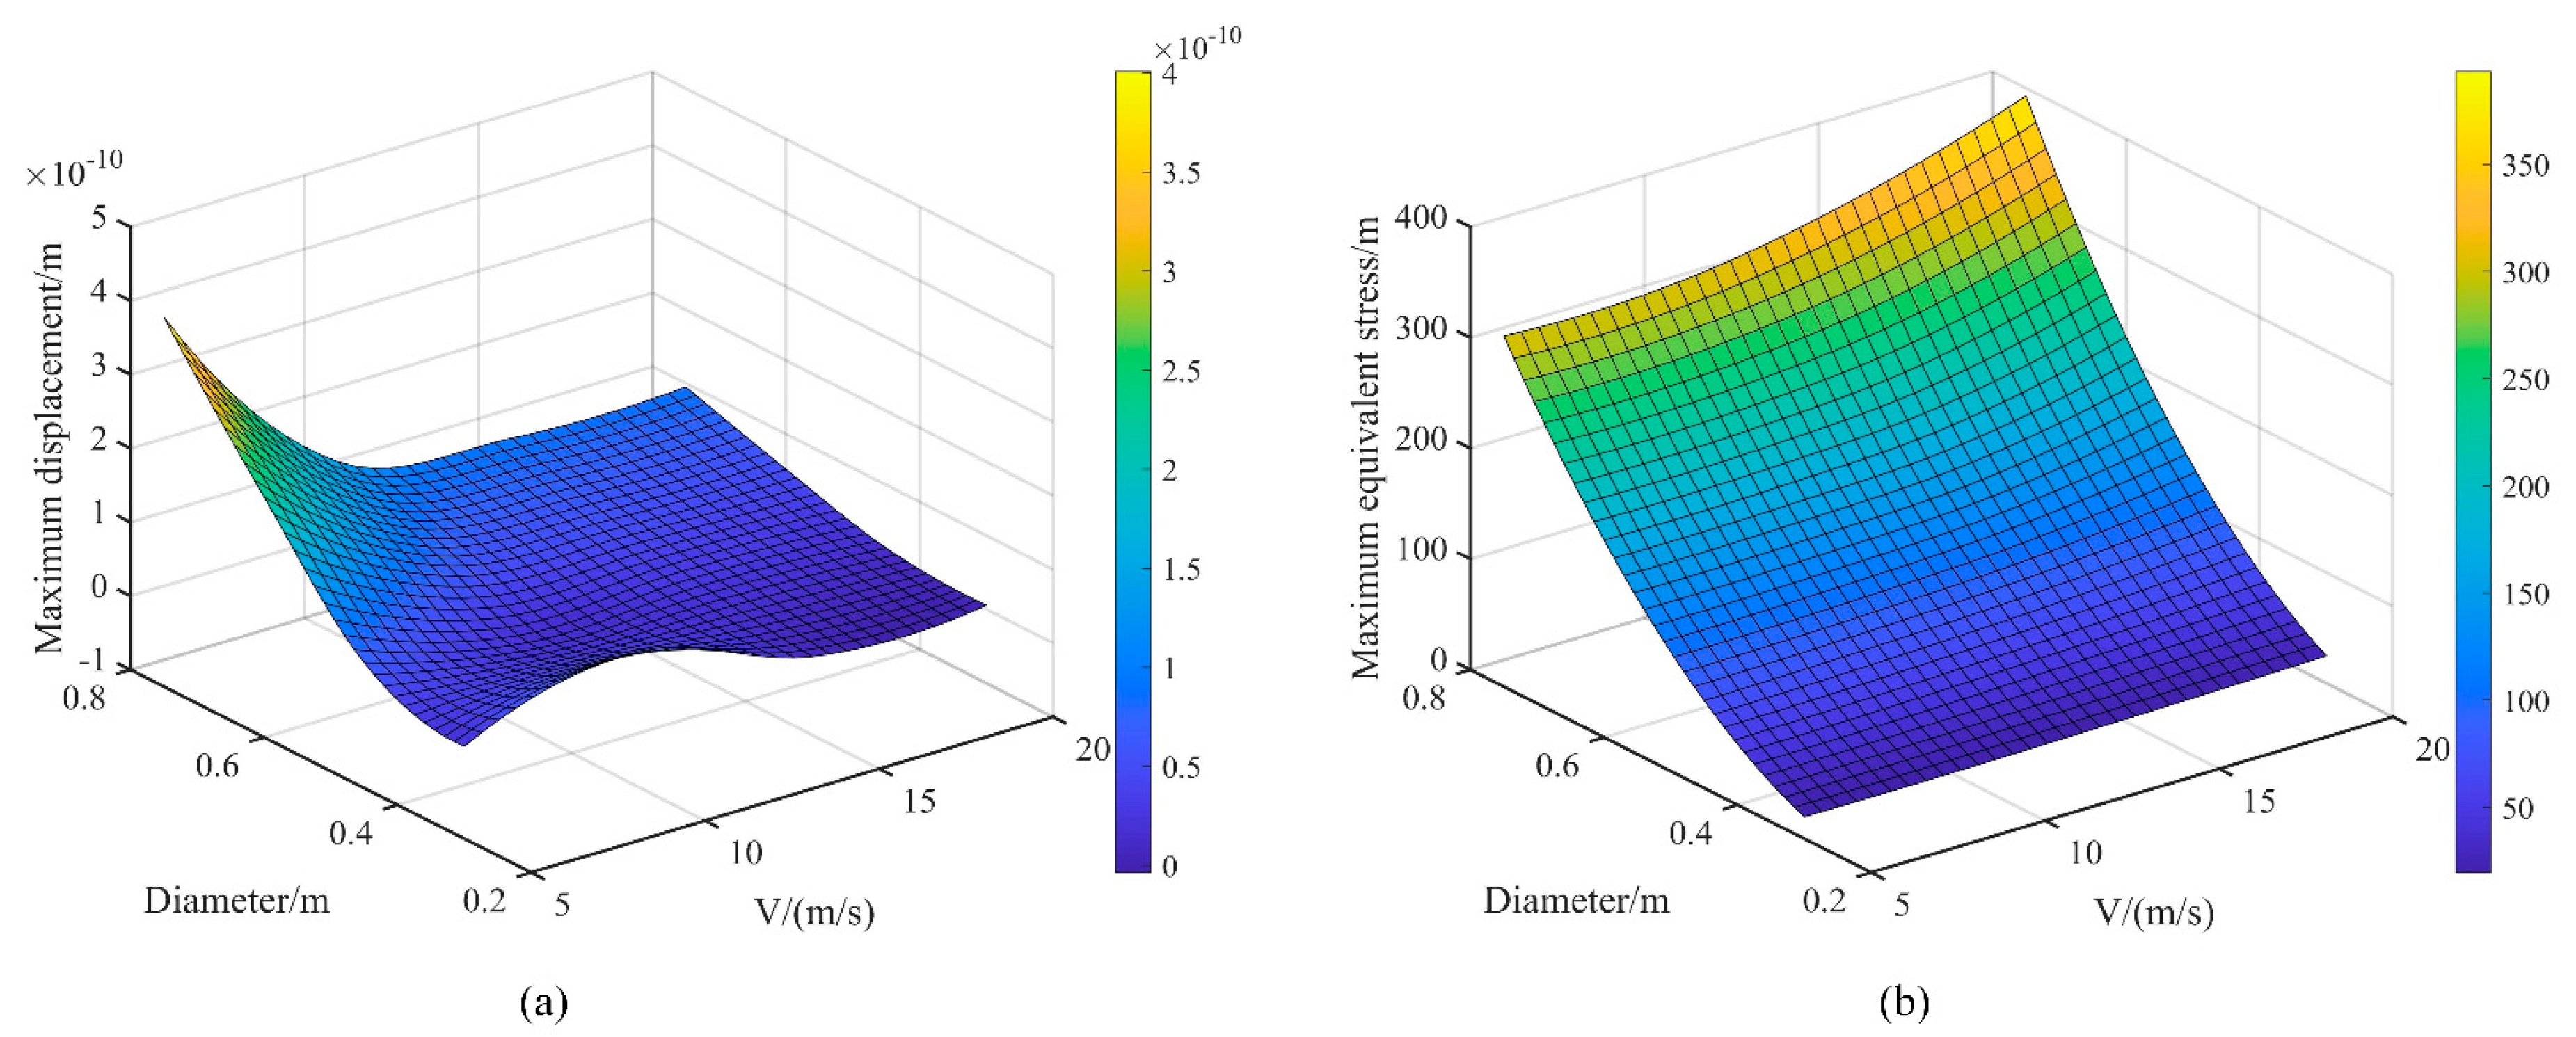
Figure 15: Surface diagram of the coupling effect between jet velocity and diameter: (a) maximum displacement. (b) maximum equivalent stress.
Three-dimensional surface plots depicting the variations of maximum structural deformation and maximum equivalent stress with respect to jet height and jet velocity are presented in Fig. 16. It can be seen that the maximum structural deformation is influenced by both jet height and velocity, exhibiting an overall shape with approximate diagonal symmetry. When both jet velocity and height are either simultaneously low or high, the maximum structural deformation is significantly affected by these parameters, showing pronounced changes and forming a “convex” profile. Conversely, when jet velocity is high and jet height is low, or when jet height is high and jet velocity is low, the overall shape transitions to a “concave” form, with less influence from these factors and slower changes. Jet velocity and height exert opposing effects on the maximum structural deformation. This phenomenon arises because, at low jet velocities and excessive heights, the downward airflow dissipates significantly before impacting the ground, resulting in a lower impact velocity compared to cases with lower jet heights. Consequently, the pressure exerted on the wind turbine blades is reduced, leading to smaller structural deformation. However, at higher jet velocities, a lower jet height alters the radial position of the maximum wind speed, causing the maximum structural deformation to increase more gradually. Fig. 16b illustrates that the equivalent stress varies uniformly with jet velocity and height, forming a two-dimensional plane with a nearly consistent tilt angle. As jet velocity increases, the maximum equivalent stress exhibits minor variations, slightly decreasing at higher velocities. When jet height increases, the equivalent stress rises linearly. Notably, at the same jet diameter, the rate of increase in equivalent stress slows at higher jet velocities, with the maximum equivalent stress peaking at a jet velocity of 5 m/s.
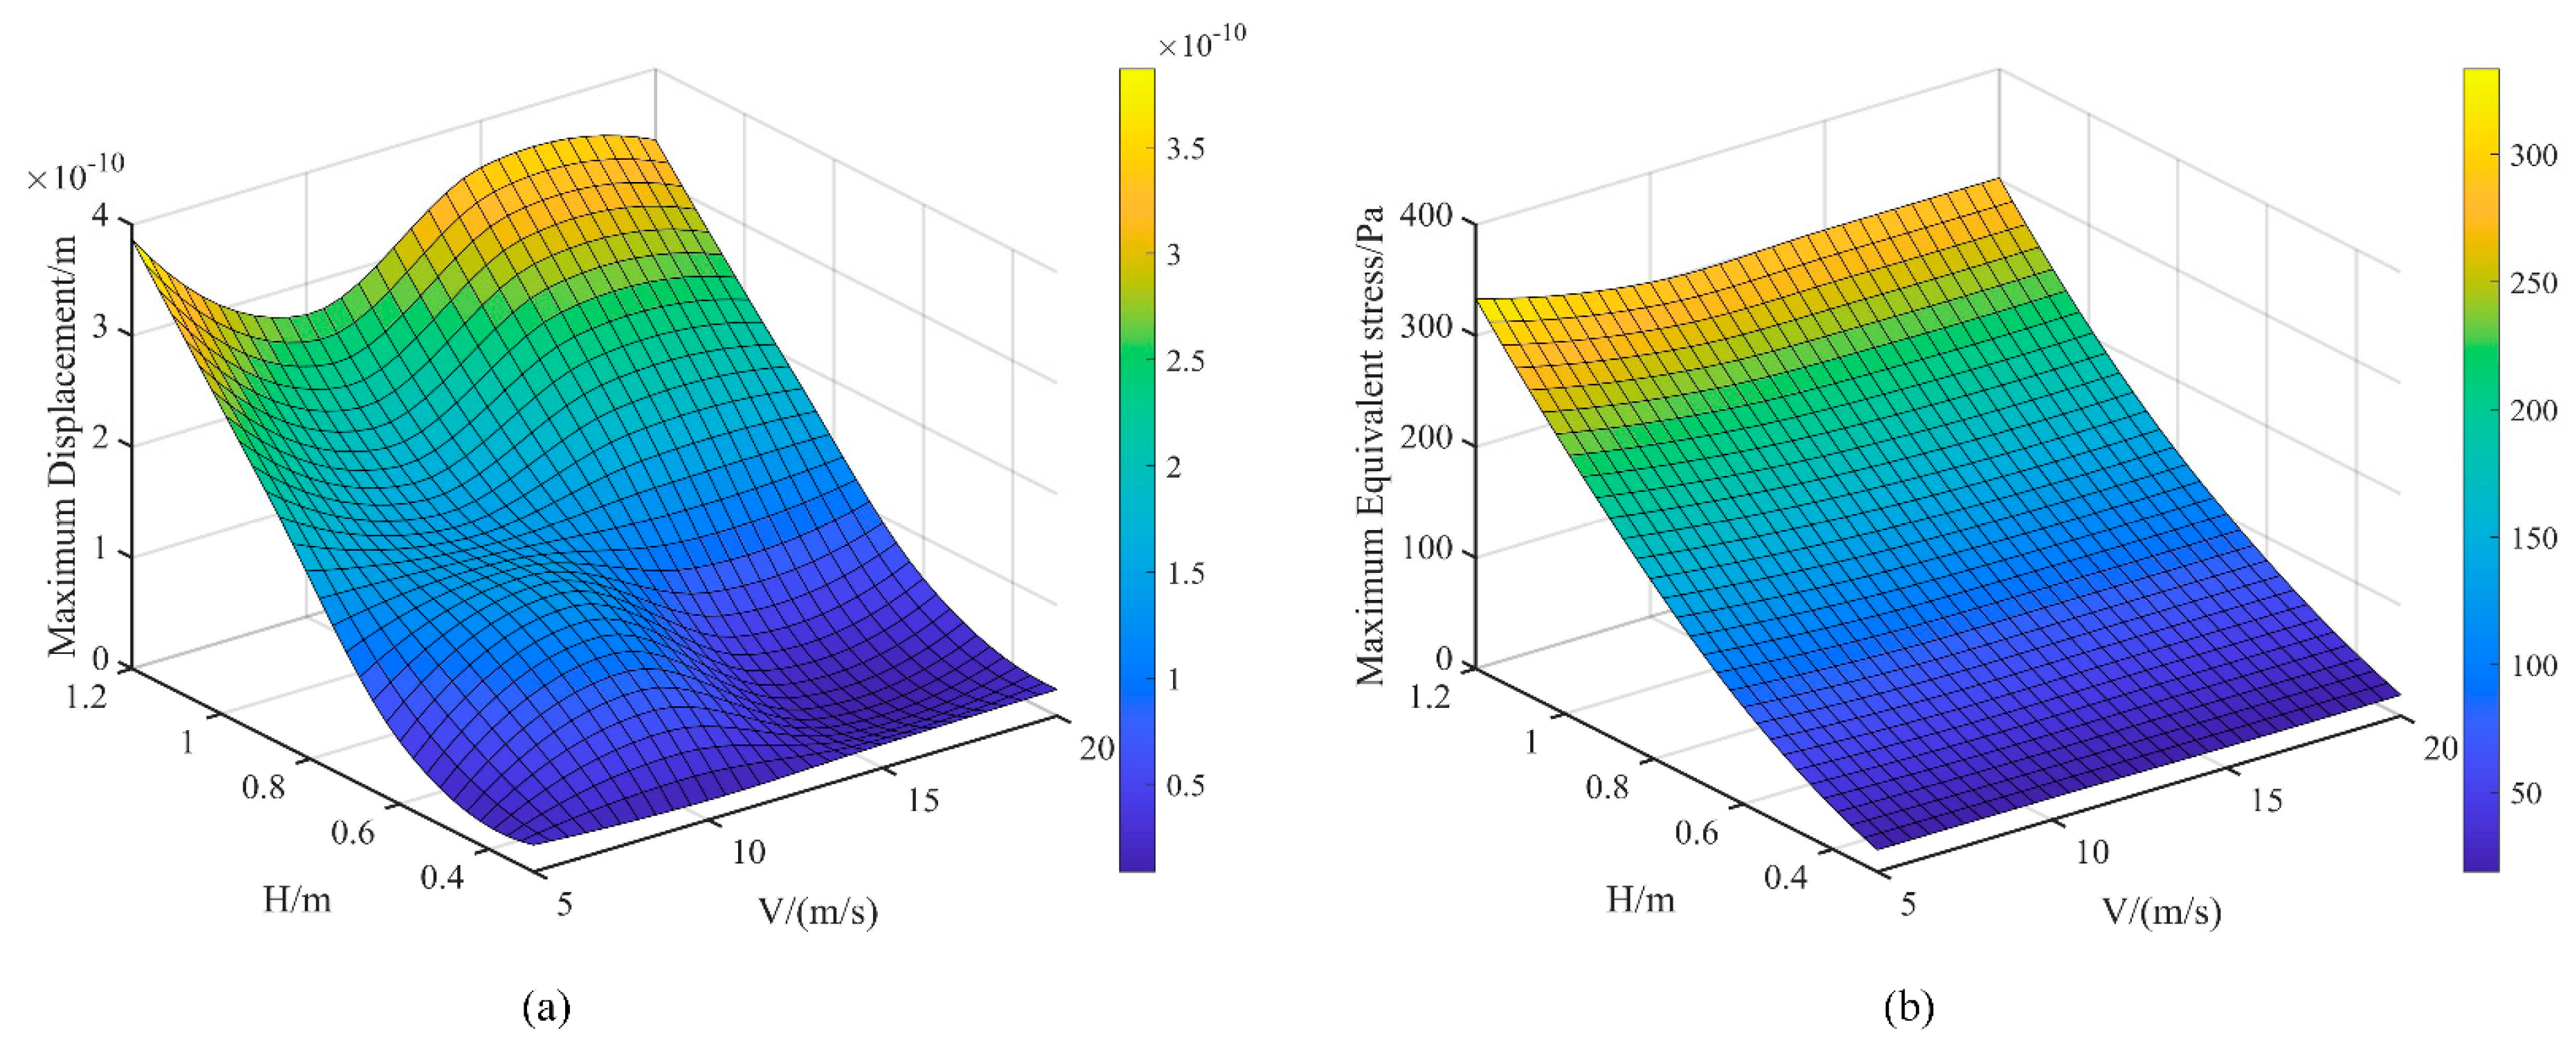
Figure 16: Surface diagram of the coupling effect between jet velocity and height: (a) maximum displacement. (b) maximum equivalent stress.
This study simulates the downburst wind field under different parameters based on the impinging jet model, and compares and analyzes the spatial distribution of velocity and pressure distribution of the downburst wind field under different parameters. It also examines the structural deformation and maximum equivalent stress of the parked wind turbine blades in the virtual downburst wind field, and evaluates the interrelationship between different jet parameters and the structural deformation and maximum equivalent stress of the blades. Finally, the surface wind pressure and dimensionless pressure coefficient of the parked wind turbine in the downburst wind field under different jet parameters are calculated. The main conclusions are as follows:
The results demonstrate that jet parameters exert distinct influences on the downburst wind field and on the surface pressure distribution of the wind turbine. An increase in jet velocity significantly enhances the maximum horizontal wind speed and drives the high-pressure regions to extend upward from the tower base to the hub and near-ground blades. As the jet velocity increases from 10 to 20 m/s, the pressure coefficient at the blade tip rises by about 4.5 times, while the surface pressure at the tower top increases from 6.5 Pa to more than 110 Pa. In contrast, raising the jet height provides a longer dissipation path for the descending airflow, which weakens the downdraft before it impinges on the turbine; when the jet height increases from 0.3 m to 1.2 m, the blade-tip pressure coefficient decreases by nearly half. Variations in jet diameter primarily shift the radial position of the maximum wind speed relative to the turbine. Once the diameter exceeds 0.4 m, the turbine is directly impacted by the downdraft, causing high-pressure zones to extend across almost the entire tower and blades. Under this condition, the pressure coefficient at the blade root increases from 0.2 to 0.95 as the jet diameter changes from 0.3 m to 0.9 m, representing a nearly fivefold rise. Moreover, the surface pressure maps reveal that negative pressure zones emerge behind the tower only when the jet velocity exceeds 10 m/s.
Overall, this study establishes a systematic framework to investigate downburst wind fields with multiple jet parameters and their coupling effects on wind turbines. By combining parametric variations with a scaled turbine model, the results clarify the loading characteristics under different downburst scenarios and provide practical implications for wind-resistant design. Beyond the engineering relevance, the study also advances the scientific understanding of downburst–turbine interaction by revealing the mechanisms that govern the emergence of localized high-pressure regions, the root–tip load disparity, and the conditions leading to potential structural failure. These contributions enrich the knowledge of extreme wind loading and offer a foundation for more accurate disaster prediction and safety assessment of wind turbines exposed to natural downbursts. This study does not include experimental validation involving wind turbines, which would further strengthen the conclusions. Such validation requires dedicated large-scale wind tunnel or field experiments and will be considered in future work.
Acknowledgement:
Funding Statement: This work was supported by the National Natural Science Foundation of China (Grant Nos. 52276197 and 52166014), Gansu Province Key Research and Development Program—Industrial Project (Grant No. 23YFGA0069).
Author Contributions: The authors confirm contribution to the paper as follows: Conceptualization, Yan Wang, Fuqiang Zhang and Long An; methodology, Yan Wang, Fuqiang Zhang and Long An; software, Fuqiang Zhang and Long An; validation, Yan Wang; formal analysis, Fuqiang Zhang and Long An; investigation, Fuqiang Zhang; resources, Yan Wang; data curation, Fuqiang Zhang and Long An; writing—original draft preparation, Yan Wang, Fuqiang Zhang, Long An, Bo Wang and Xueya Yang; writing—review and editing, Yan Wang, Fuqiang Zhang, Long An and Jie Jin; supervision, Yan Wang and Jie Jin; project administration, Yan Wang; funding acquisition, Yan Wang. All authors reviewed the results and approved the final version of the manuscript.
Availability of Data and Materials: The data that support the findings of this study are available from the Corresponding Author, Yan Wang, upon reasonable request.
Ethics Approval: Not applicable.
Conflicts of Interest: The authors declare no conflicts of interest to report regarding the present study.
References
1. Salvatori L , Marra AM , De Stefano M , Spinelli P . Downburst wind loading on bridge decks through an analytical model. Eng Struct. 2024; 319: 118802. doi:10.1016/j.engstruct.2024.118802. [Google Scholar] [CrossRef]
2. Alam M . A review of wind turbine blade morphing: power, vibration, and noise. Fluid Dyn Mater Process. 2025; 21( 4): 657– 95. doi:10.32604/fdmp.2025.060942. [Google Scholar] [CrossRef]
3. Canepa F , Burlando M , Romanic D , Solari G , Hangan H . Experimental investigation of the near-surface flow dynamics in downburst-like impinging jets. Environ Fluid Mech. 2022; 22( 4): 921– 54. doi:10.1007/s10652-022-09870-5. [Google Scholar] [CrossRef]
4. Hjelmfelt MR . Structure and life cycle of microburst outflows observed in Colorado. J Appl Meteorol Climatol. 1988; 27( 8): 900– 27. doi:10.1175/1520-0450(1988)027<0900:SALCOM>2.0.CO;2. [Google Scholar] [CrossRef]
5. Fujita TT . Objectives, operation, and results of Project NIMROD. In: Proceedings of the 11th Conference on Severe Local Storms; 1979 Oct 2–5; Kansas City, MO, USA. Boston, MA, USA: Americae Meteoroloaical Society; 1979. p. 259– 66. [Google Scholar]
6. Dodge J , Arnold J , Wilson G , Evans J , Fujita T . The cooperative Huntsville meteorological experiment (COHMEX). Bull Am Meteorol Soc. 1986; 67( 4): 417– 9. [Google Scholar]
7. Orwig KD , Schroeder JL . Near-surface wind characteristics of extreme thunderstorm outflows. J Wind Eng Ind Aerodyn. 2007; 95( 7): 565– 84. doi:10.1016/j.jweia.2006.12.002. [Google Scholar] [CrossRef]
8. Orf L , Kantor E , Savory E . Simulation of a downburst-producing thunderstorm using a very high-resolution three-dimensional cloud model. J Wind Eng Ind Aerodyn. 2012; 104: 547– 57. doi:10.1016/j.jweia.2012.02.020. [Google Scholar] [CrossRef]
9. Canepa F , Romanic D , Hangan H , Burlando M . Experimental translating downbursts immersed in the atmospheric boundary layer. J Wind Eng Ind Aerodyn. 2023; 243: 105570. doi:10.1016/j.jweia.2023.105570. [Google Scholar] [CrossRef]
10. Chay MT , Albermani F , Wilson R . Numerical and analytical simulation of downburst wind loads. Eng Struct. 2006; 28( 2): 240– 54. doi:10.1016/j.engstruct.2005.07.007. [Google Scholar] [CrossRef]
11. Chen Y , Liu G , Xu T , Yu SC . Time history of horizontal wind velocity of moving thunderstorms and phenomenological model. J Tongji Univ Nat Sci. 2012; 40( 1): 22– 6. doi:10.3969/j.issn.0253-374x.2012.01.004. [Google Scholar] [CrossRef]
12. Le V , Caracoglia L . Generation and characterization of a non-stationary flow field in a small-scale wind tunnel using a multi-blade flow device. J Wind Eng Ind Aerodyn. 2019; 186: 1– 16. doi:10.1016/j.jweia.2018.12.017. [Google Scholar] [CrossRef]
13. Mengistu MT , Orlando A , Repetto MP . Wind and structural response monitoring of a lighting pole for the study of downburst effects on structures. J Wind Eng Ind Aerodyn. 2023; 240: 105447. doi:10.1016/j.jweia.2023.105447. [Google Scholar] [CrossRef]
14. Iida Y , Uematsu Y . Numerical study of wind loads on buildings induced by downbursts. J Wind Eng Ind Aerodyn. 2019; 191: 103– 16. doi:10.1016/j.jweia.2019.05.018. [Google Scholar] [CrossRef]
15. Jubayer C , Elatar A , Hangan H . Pressure distributions on a low-rise building in a laboratory simulated downburst. In: Proceedings of the 8th International Colloquium on Bluff Body Aerodynamics and Applications; 2016 Jun 7–11; Boston, MA, USA. [Google Scholar]
16. Romanic D , Ballestracci A , Canepa F , Solari G , Hangan H . Aerodynamic coefficients and pressure distribution on two circular cylinders with free end immersed in experimentally produced downburst-like outflows. Adv Struct Eng. 2021; 24( 3): 522– 38. doi:10.1177/1369433220958763. [Google Scholar] [CrossRef]
17. Zhang Y , Sarkar P , Hu H . An experimental study on wind loads acting on a high-rise building model induced by microburst-like winds. J Fluids Struct. 2014; 50: 547– 64. doi:10.1016/j.jfluidstructs.2014.07.010. [Google Scholar] [CrossRef]
18. Lombardo FT , Mason MS , de Alba AZ . Investigation of a downburst loading event on a full-scale low-rise building. J Wind Eng Ind Aerodyn. 2018; 182: 272– 85. doi:10.1016/j.jweia.2018.09.020. [Google Scholar] [CrossRef]
19. Ahmed MR , El Damatty A , Dai K . Design load provisions for simulating the critical effect of downbursts on wind turbines. Eng Struct. 2023; 294: 116779. doi:10.1016/j.engstruct.2023.116779. [Google Scholar] [CrossRef]
20. Frulla G , Gili P , Visone M , D’Oriano V , Lappa M . A practical engineering approach to the design and manufacturing of a mini kW bladewind turbine: definition, optimization and CFD analysis. Fluid Dyn Mater Process. 2015; 11( 3): 257– 77. doi:10.3970/fdmp.2015.011.257. [Google Scholar] [CrossRef]
21. Kim J , Hangan H . Numerical simulations of impinging jets with application to downbursts. J Wind Eng Ind Aerodyn. 2007; 95( 4): 279– 98. doi:10.1016/j.jweia.2006.07.002. [Google Scholar] [CrossRef]
22. Ahmed MR , Damatty AE , Dai K , Lu W . Comparison between effects of current wind turbine design loads and downburst loads. In: Proceedings of the Canadian Society of Civil Engineering Annual Conference 2022; 2022 May 25–28; Whistler, BC, Canada. Cham, Switzerland: Springer Nature; 2025. p. 239– 52. doi:10.1007/978-3-031-35471-7_19. [Google Scholar] [CrossRef]
23. Wenz F , Langner J , Lutz T , Krämer E . Impact of the wind field at the complex-terrain site Perdigão on the surface pressure fluctuations of a wind turbine. Wind Energy Sci. 2022; 7( 3): 1321– 40. doi:10.5194/wes-7-1321-2022. [Google Scholar] [CrossRef]
24. Wu XJ . Numerical simulation of moving downburst and its induced wind load on wind turbine [ master’s thesis]. Hefei, China: Hefei University of Technology; 2023. (In Chinese). [Google Scholar]
25. Huy Nguyen H , Manuel L . Thunderstorm downburst risks to wind farms. J Renew Sustain Energy. 2013; 5( 1): 013120. doi:10.1063/1.4792497. [Google Scholar] [CrossRef]
26. Sengupta A , Sarkar P . Experimental measurement and numerical simulation of an impinging jet with application to thunderstorm microburst winds. Wind Eng Ind Aerodyn. 2008; 96( 3): 345– 65. doi:10.1016/j.jweia.2007.09.001. [Google Scholar] [CrossRef]
27. Menter FR . Two-equation eddy-viscosity turbulence models for engineering applications. AIAA J. 1994; 32( 8): 1598– 605. doi:10.2514/3.12149. [Google Scholar] [CrossRef]
28. Montazeri H , Blocken B , Janssen WD , van Hooff T . CFD evaluation of new second-skin facade concept for wind comfort on building balconies: case study for the park tower in antwerp. Build Environ. 2013; 68: 179– 92. doi:10.1016/j.buildenv.2013.07.004. [Google Scholar] [CrossRef]
29. Dang H , Xing G , Wang H , Harmanto D , Yao W . A novel empirical model for vertical profiles of downburst horizontal wind speed. Wind Energy. 2024; 27( 4): 314– 424. doi:10.1002/we.2895. [Google Scholar] [CrossRef]
30. Mason M . Pulsed jet simulation of thunderstorm downbursts [ master’s thesis]. Lubbock, TX, USA: Texas Tech University; 2003. [Google Scholar]
31. Wood GS , Kwok KC , Motteram NA , Fletcher DF . Physical and numerical modelling of thunderstorm downburst. J Wind Eng Ind Aerodyn. 2001; 89( 6): 535– 52. doi:10.1016/S0167-6105(00)00090-8. [Google Scholar] [CrossRef]
32. Eriksson JG , Karlsson RI , Persson J . An experimental study of a two-dimensional plane turbulent wall jet. Exp Fluids. 1998; 25( 1): 50– 60. doi:10.1007/s003480050207. [Google Scholar] [CrossRef]
33. Zhong Y , Yan Z , Wang L , You Y . Large eddy simulation of unsteady downburst outflow based on wall jet model. J Southwest Jiaotong Univ. 2018; 53( 6): 1179– 86. (In Chinese). doi: 10.3969/j.issn.0258-2724.2018.06.013. [Google Scholar] [CrossRef]
34. Fang Z , Wang Z , Huang H , Yang L , Guo Y . Numerical simulations of downburst wind fields: a comparative analysis of stationary and moving storms using the impinging jet model. Phys Fluids. 2024; 36( 8): 0216182. doi:10.1063/5.0216182. [Google Scholar] [CrossRef]
35. Holmes JD , Oliver SE . An empirical model of a downburst. Eng Struct. 2000; 22( 9): 1167– 72. doi:10.1016/S0141-0296(99)00058-9. [Google Scholar] [CrossRef]
36. Iida Y , Uematsu Y , Gavanski E . A study of downburst-induced wind loading on buildings. J Wind Eng. 2015; 40( 2): 40– 9. doi:10.5359/jwe.40.40. [Google Scholar] [CrossRef]
37. Hangan H , Kim JD , Xu Z . The simulation of downbursts and its challenges. In: Structures 2004: building on the past, securing the future. Reston, VA, USA: American Society of Civil Engineers; 2004. p. 1– 8. doi:10.1061/40700(2004)170. [Google Scholar] [CrossRef]
38. Jog A . Numerical modelling of downburst interaction with bluff body [ master’s thesis]. London, ON, Canada: The University of Western Ontario; 2013. [Google Scholar]
39. Jonkman J , Butterfield S , Musial W , Scott G . Definition of a 5-MW reference wind turbine for offshore system development. Washington, DC, USA: U.S. Department of Energy; 2009. Report No.: NREL/TP-500-38060. doi:10.2172/947422. [Google Scholar] [CrossRef]
40. Wang L , Quant R , Kolios A . Fluid–structure interaction modelling of horizontal-axis wind turbine blades based on CFD and FEA. Wind Eng Ind Aerodyn. 2016; 158: 11– 25. doi:10.1016/j.jweia.2016.09.006. [Google Scholar] [CrossRef]
41. Huque Z , Zemmouri F , Lu H , Kommalapati RR . Fluid-structure interaction simulations of wind turbine blades with pointed tips. Energies. 2024; 17( 5): 1090. doi:10.3390/en17051090. [Google Scholar] [CrossRef]
42. Zheng X , Montazeri H , Blocken B . CFD simulations of wind flow and mean surface pressure for buildings with balconies: comparison of RANS and LES. Build Environ. 2020; 173: 106747. doi:10.1016/j.buildenv.2020.106747. [Google Scholar] [CrossRef]
43. Preskett T , Virgilio M , Jaiswal P , Ganapathisubramani B . Effects of pressure-gradient histories on skin friction and mean flow of high Reynolds number turbulent boundary layers over smooth and rough walls. J Fluid Mech. 2025; 1010: A30. doi:10.1017/jfm.2025.320. [Google Scholar] [CrossRef]
Cite This Article
 Copyright © 2025 The Author(s). Published by Tech Science Press.
This work is licensed under a Creative Commons Attribution 4.0 International License , which permits unrestricted use, distribution, and reproduction in any medium, provided the original work is properly cited.
 Downloads
 Citation Tools