
 Submit a Paper
 Propose a Special lssue
 Open Access
ARTICLE

Numerical Analysis of Ice Accretion under Varying Conditions in the Pantograph Region of High-Speed Trains
1 College of Mechanical and Electrical Engineering, Qingdao University, Qingdao, 266071, China
2 CRRC Qingdao Sifang Co., Ltd., Qingdao, 266111, China
* Corresponding Author: Mengge Yu. Email:
Fluid Dynamics & Materials Processing 2025, 21(11), 2795-2814. https://doi.org/10.32604/fdmp.2025.072708
Received 02 September 2025; Accepted 05 November 2025; Issue published 01 December 2025
 View Full Text
 Download PDF
Abstract
High-speed trains operating in freezing rain are highly susceptible to severe ice accretion in the pantograph region, which compromises both power transmission efficiency and dynamic performance. To elucidate the underlying mechanisms of this phenomenon, an Euler–Euler multiphase flow model was employed to simulate droplet impingement and collection on the pantograph surface, while a glaze-ice formation model incorporating wall film dynamics was used to capture the subsequent growth of ice. The effects of key parameters—including liquid water content, ambient temperature, train velocity, and droplet diameter—on the amount and morphology of ice were systematically investigated. The results show that ice accumulation intensifies with increasing liquid water content, decreasing ambient temperature, and rising train speed. In contrast, larger droplet diameters reduce the overall ice mass but promote localized accretion on major structural elements. This behavior arises because larger droplets, with greater inertia, are less susceptible to entrainment by airflow into the pantograph’s base region. During extended operation, substantial ice buildup develops on the pantograph head and upper and lower arms, severely impairing current collection from the overhead line and hindering the pantograph’s lifting and lowering motions.Keywords
When trains operate in freezing rain environments, ice tends to form on the pantograph surface, thereby affecting the pantograph power transmission characteristics. Research on pantograph icing is of vital importance for preventing ice formation on pantograph heads that can impact power transmission. In addition, after pantograph icing, its dynamic performance is compromised, leading to poor contact between the pantograph and the overhead catenary system, and thus affecting the normal operation of trains [1]. When high-speed trains run in cold regions, pantograph icing is often influenced by supercooled large droplets. At present, research on supercooled large droplets is mainly concentrated in the aviation field. Zabaleta et al. [2] have employed the Lagrangian particle method to investigate the impact of large supercooled droplets on aircraft wings. Blake et al. [3] investigate ice adhesion properties and anti-icing applications through simulations of supercooled droplet impact and solidification on cooled substrates. Wang et al. [4] explored the mechanism of supercooled droplet impingement and freezing through experiments. They developed a predictive model, revealed how freezing parameters influence aircraft icing, and offered a foundation for studying the impact of supercooled droplets on icing. Lindner et al. [5] studied the influence of supercooled droplet icing on the aerodynamics of drone wings and tail units. Freschi et al. [6] adopted a 2D formulation of a multi-step stochastic model for in-flight icing simulation, providing new insights into supercooled droplet icing research. Kozelkov et al. [7] employed a three-dimensional numerical simulation approach to investigate the influence of supercooled droplet diameter and other environmental factors on ice accretion morphology over aircraft wings.
In recent years, the icing issue of high-speed trains has gained attention, with research primarily focusing on the icing of bogies. Zhang et al. [8] experimentally investigated the snow and ice accumulation in the bogie area using an ice and snow wind tunnel. WANG et al. studied the influence of wheelset rotation [9] on snow particle accumulation. Du et al. [10] studied the snow accumulation problem in the bogie region by establishing a snow-wind multiphase flow model. Clifton et al. [11] applied salted snow particles to the study of bogie snow accumulation by comparing simulation results with wind tunnel tests. Bae et al. [12] conducted a numerical study on snow accumulation on trains by simulating the saltation of initially moving snow blown from the ground. Kim et al. [13] reduced the ice-snow accretion mass in the bogie region by installing fairings, offering a novel approach for bogie anti-icing research.
Current research on pantograph icing mainly explores catenary icing and anti-icing measures for pantographs, with limited focus on pantograph icing itself. Bruni et al. [14] reviewed the state-of-the-art in pantograph research, providing a theoretical foundation for investigating pantograph icing. Yao et al. [15] analyzed icing using equivalent density and uniform load methods, compared the two approaches, and examined their differences. Zhang et al. [16] created an ice-accretion model based on collision, capture, and freezing rates, investigated ice growth under various climates, monitored icing conditions with route meteorological data, and supported anti-icing technology for pantographs and catenaries to ensure high-speed rail safety. Lotfi et al. [17] developed a novel approach for studying icing on pantograph-catenary systems by simulating ice accumulation mass on different conductors under varying environmental conditions. Ohishi et al. [18] proposed a novel polymeric coating to reduce ice accretion mass on pantograph surfaces, providing new insights for ice mitigation on pantographs.
At present, research efforts are primarily devoted to the study of supercooled liquid droplet freezing on catenary systems, and the wind-snow flow characteristics around bogies along with snow particle accumulation on their surfaces. Nevertheless, there has been a relative paucity of investigation into the icing mechanisms within the pantograph region. Additionally, minimal attention has been directed towards comprehending the impact of ambient air droplet concentration and temperature on the icing processes that occur in the pantograph area. The icing of the pantograph region, which is influenced by supercooled droplets, can lead to a buildup of ice over time. This accumulation can degrade the electrical contact quality between the pantograph and the overhead catenary system, resulting in inefficient power transmission. Additionally, the added ice mass can alter the mechanical properties and dynamic behavior of the pantograph, potentially leading to operational disruptions and affecting the overall performance and safety of the train’s operation. To address these issues, this paper employs the Eulerian multiphase flow model to analyze the distribution of supercooled liquid droplets in the bogie area. Also, a quasi-transient method is used to study the icing of the pantograph region. The impacts of key parameters like the liquid water content in the air, droplet size, ambient temperature, and train speed on pantograph icing are evaluated. This study offers a foundation for understanding and preventing pantograph icing.
The selection of flow field control equations is essential for flow field calculation. As high-speed trains usually run at speeds below 350 km/h, the surrounding air forms a low-speed flow (Ma < 0.3). Hence, the flow field can be regarded as in-compressible. The governing equations for this flow are as follows:
In this paper,
During high-speed train operation, a complex turbulent flow field surrounds the train. Given that the Realizable
The turbulent kinetic energy
The turbulent dissipation rate
For simulating supercooled droplet motion, common methods are the Euler-Lagrange and Euler-Euler approaches. The Euler-Lagrange method, treating supercooled droplets as discrete particles and solving trajectory equations for individual droplets in the airflow, suits sparse droplet groups. The Euler-Euler method, viewing droplets as a continuous pseudo-fluid, supports complex 3D geometries. To improve computational accuracy, this study adopts the Euler-Euler method for supercooled droplet motion analysis [20].
In the Euler-Euler model, the control equations for supercooled droplet motion consist of the mass conservation equation and momentum conservation equation, which are specifically as follows:
To better explain the energy changes during the motion of particles, the thermodynamic process equation for droplet motion is introduced:
2.3 Ice Growth Governing Equation
The majority of icing models employed today are graze ice models that account for water film flow. By mitigating the formation of unrealistic ice angles at icing limits, these models enhance prediction accuracy. The governing equations for mass and energy conservation in icing models are as follows:
The Euler-Euler flow model demands substantial computational resources. To reduce this requirement without altering the model’s fundamental structure, this study employs a computational model comprising the front and rear train heads and the intermediate car body. The pantograph is positioned on the intermediate car body’s top, ensuring the flow field around it matches that of the actual train. The car body has a length of 29.25 m, a width of 3.4 m, and a height of 5.25 m, as shown in Fig. 1a. As shown in Fig. 1b, the pantograph is composed of seven main components: the base frame, insulator, pantograph head, upper arm rod, push rod, upper guide rod, and lower arm rod, which are respectively named as Part 1–7.
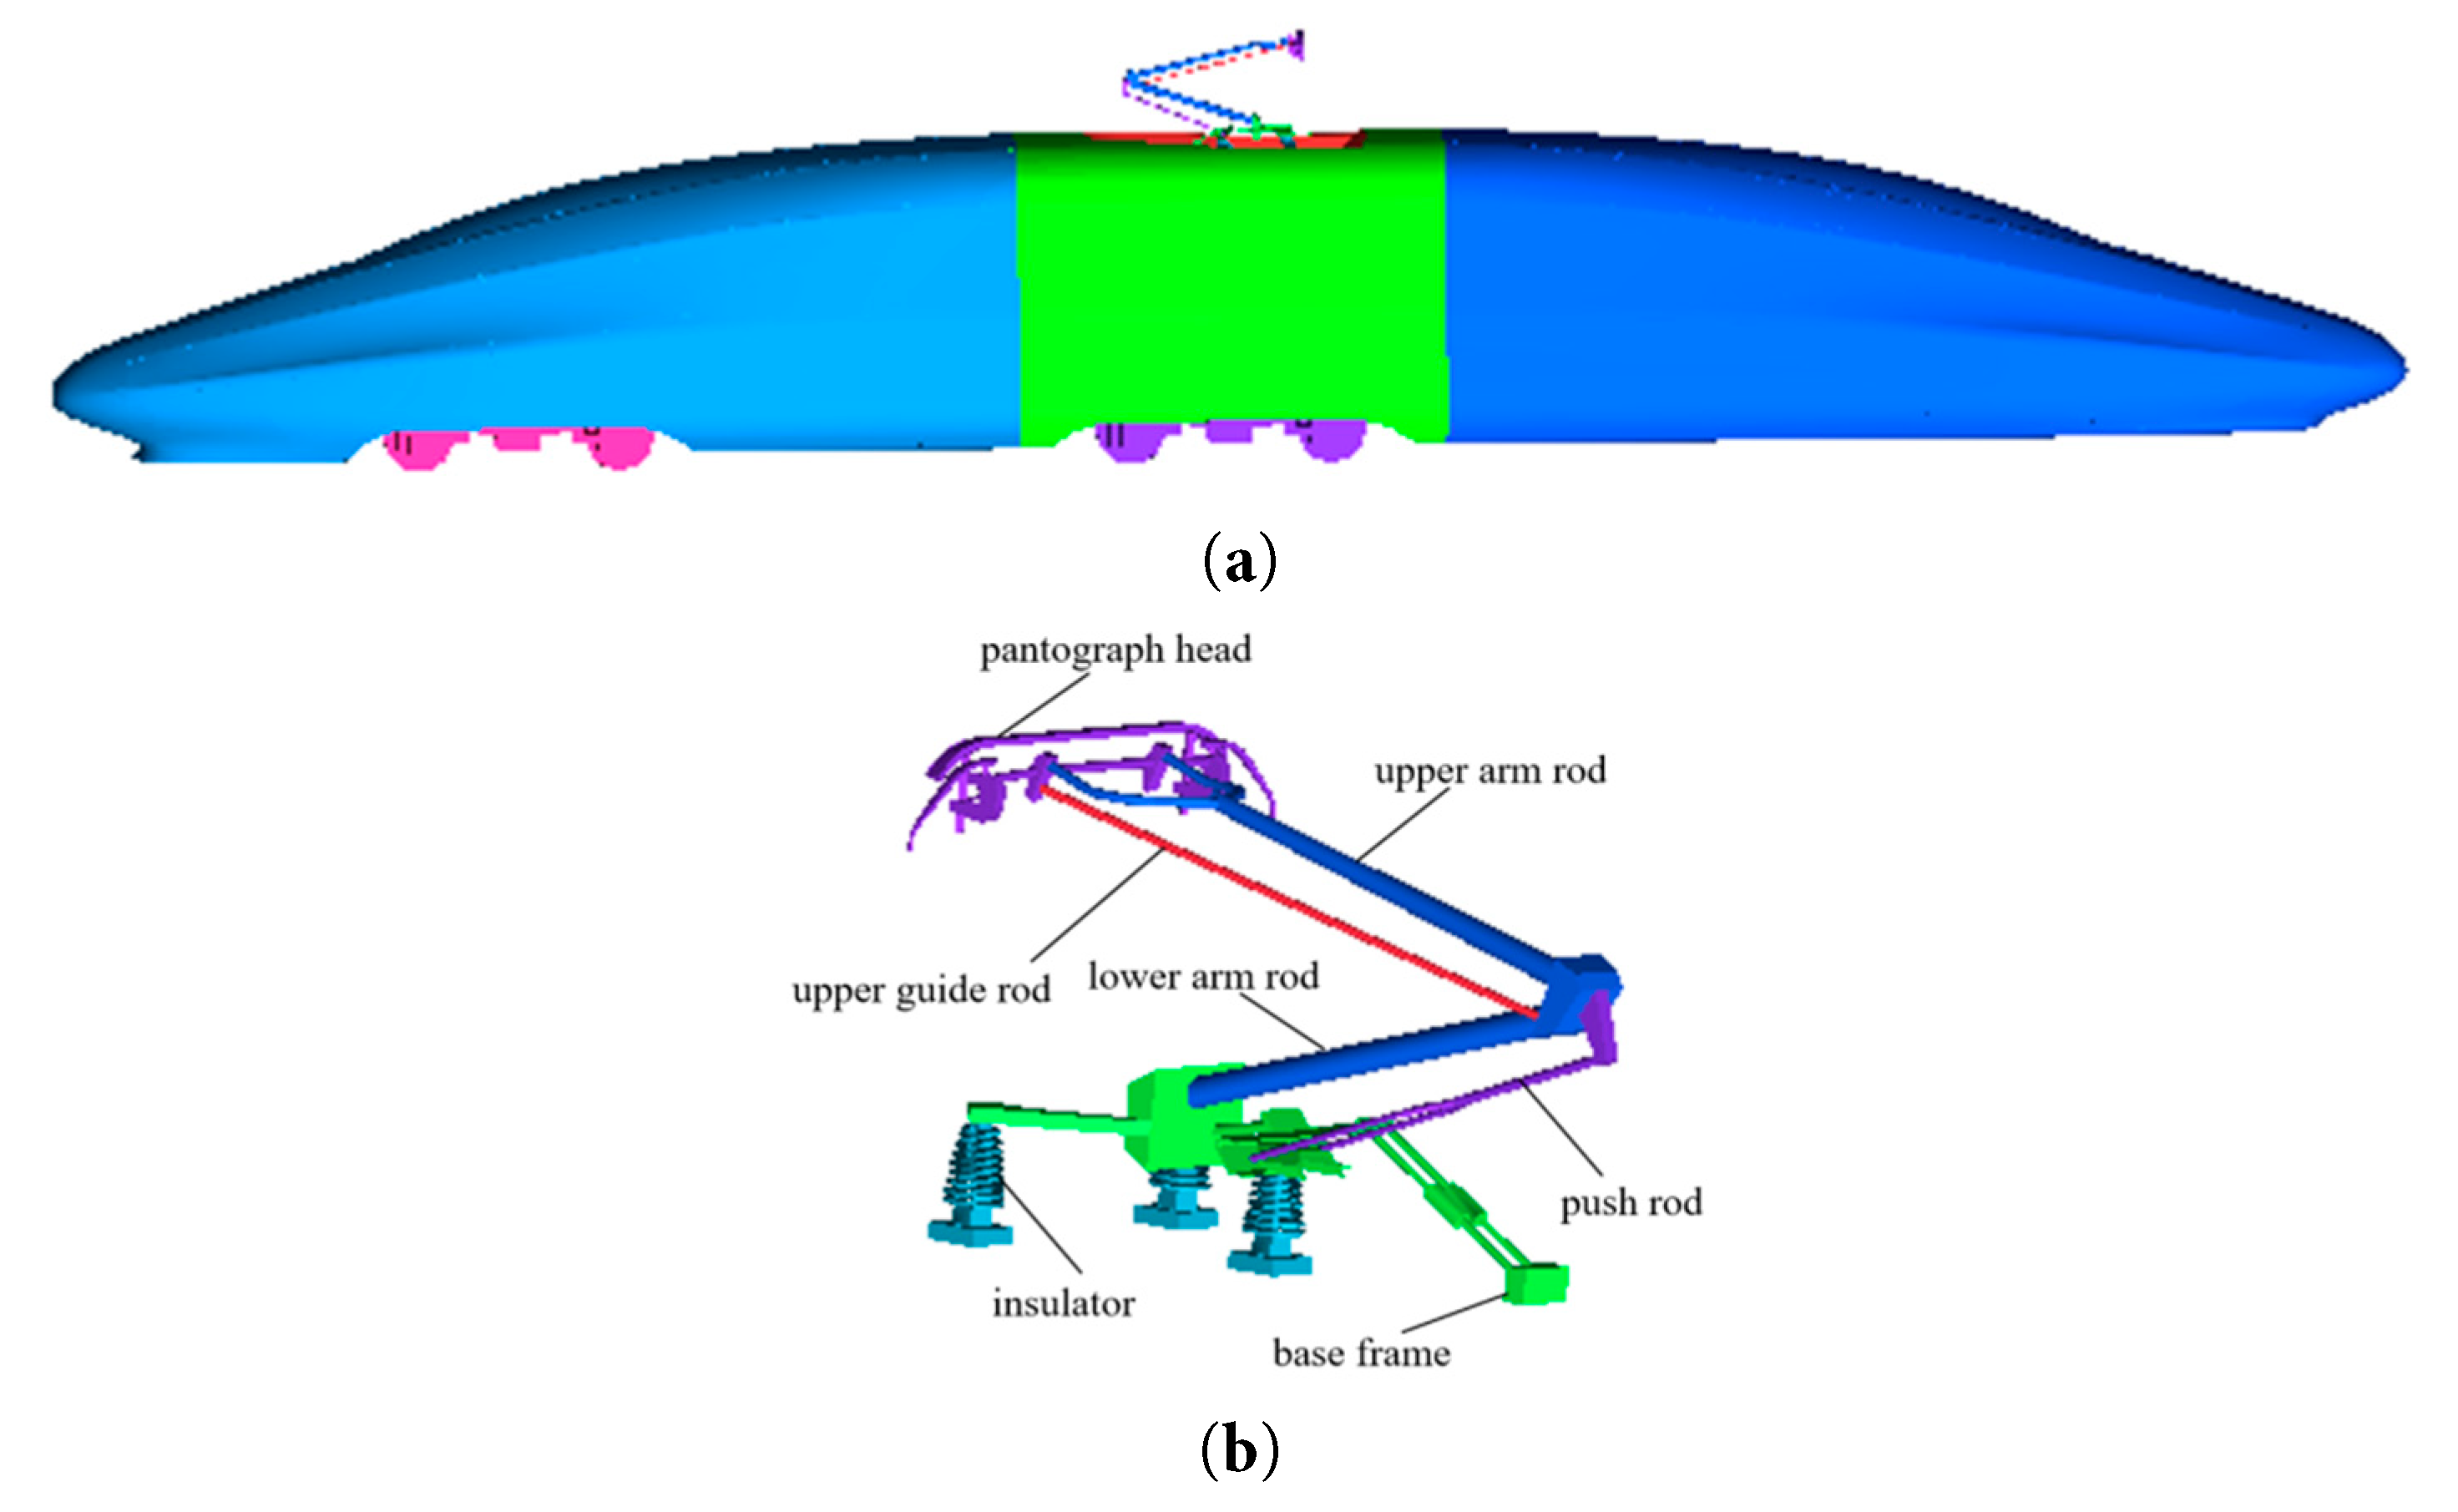
Figure 1: Computation model. (a) Train model. (b) Pantograph model.
3.2 Computational Domain and Boundary Conditions
As shown in Fig. 2, the computational domain has a length, width, and height of 210 m, 80 m, and 40 m, respectively. The bogie is positioned 60 m in front of the velocity inlet, with equal distances to the left and right boundaries. The train body is 0.376 m above the ground, as depicted in Fig. 2. The inlet is designated as a velocity inlet, and the outlet as a pressure outlet. The ground is modeled as a moving wall, while other walls are defined as symmetry boundaries.
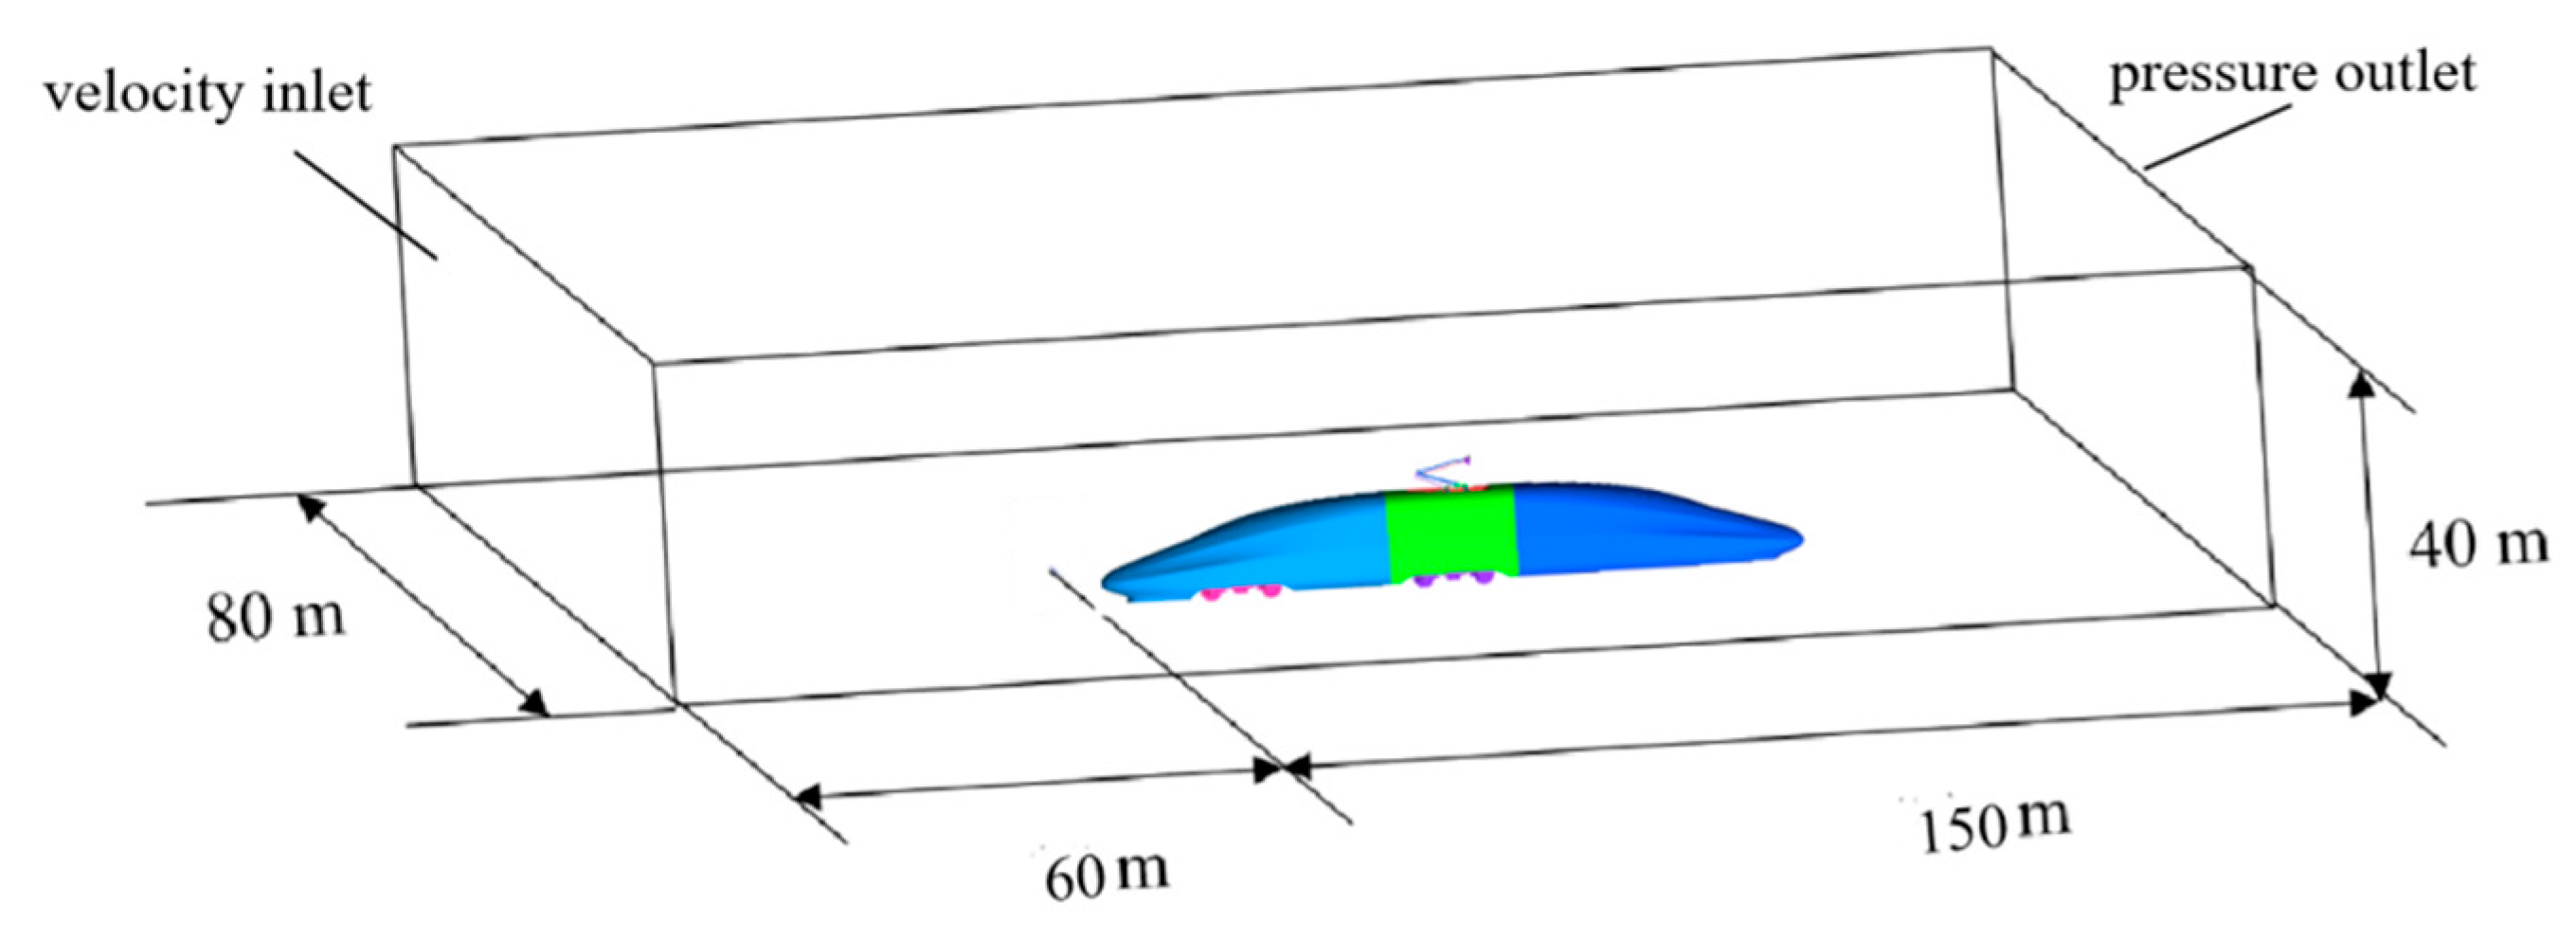
Figure 2: Computational domain.
Train-surface icing is influenced by wall temperature, so varied wall temperatures are set in the computational region for better icing effects, with the pantograph-surface temperature fixed at 273.15 K. Air density is 1.395 kg/m3 [21], specific heat at constant pressure is 1004.68 J/(kg·K), air viscosity μ is 1.68 × 10⁻⁵ kg/(m·s), and thermal conductivity λ is 0.023 W/(m·K).
The flow field was solved using the SIMPLE algorithm. The gradient terms were discretized with a cell-based least squares format, the temporal terms adopted a first-order implicit scheme, while pressure, momentum, turbulent kinetic energy, and turbulent dissipation rate all employed the second-order upwind scheme [22].
A hybrid meshing method was used to generate the mesh. Two encrypted areas around the train body and pantograph were created to better reflect the flow characteristics and improve accuracy. The first refinement zone surrounds the vehicle body, with dimensions of
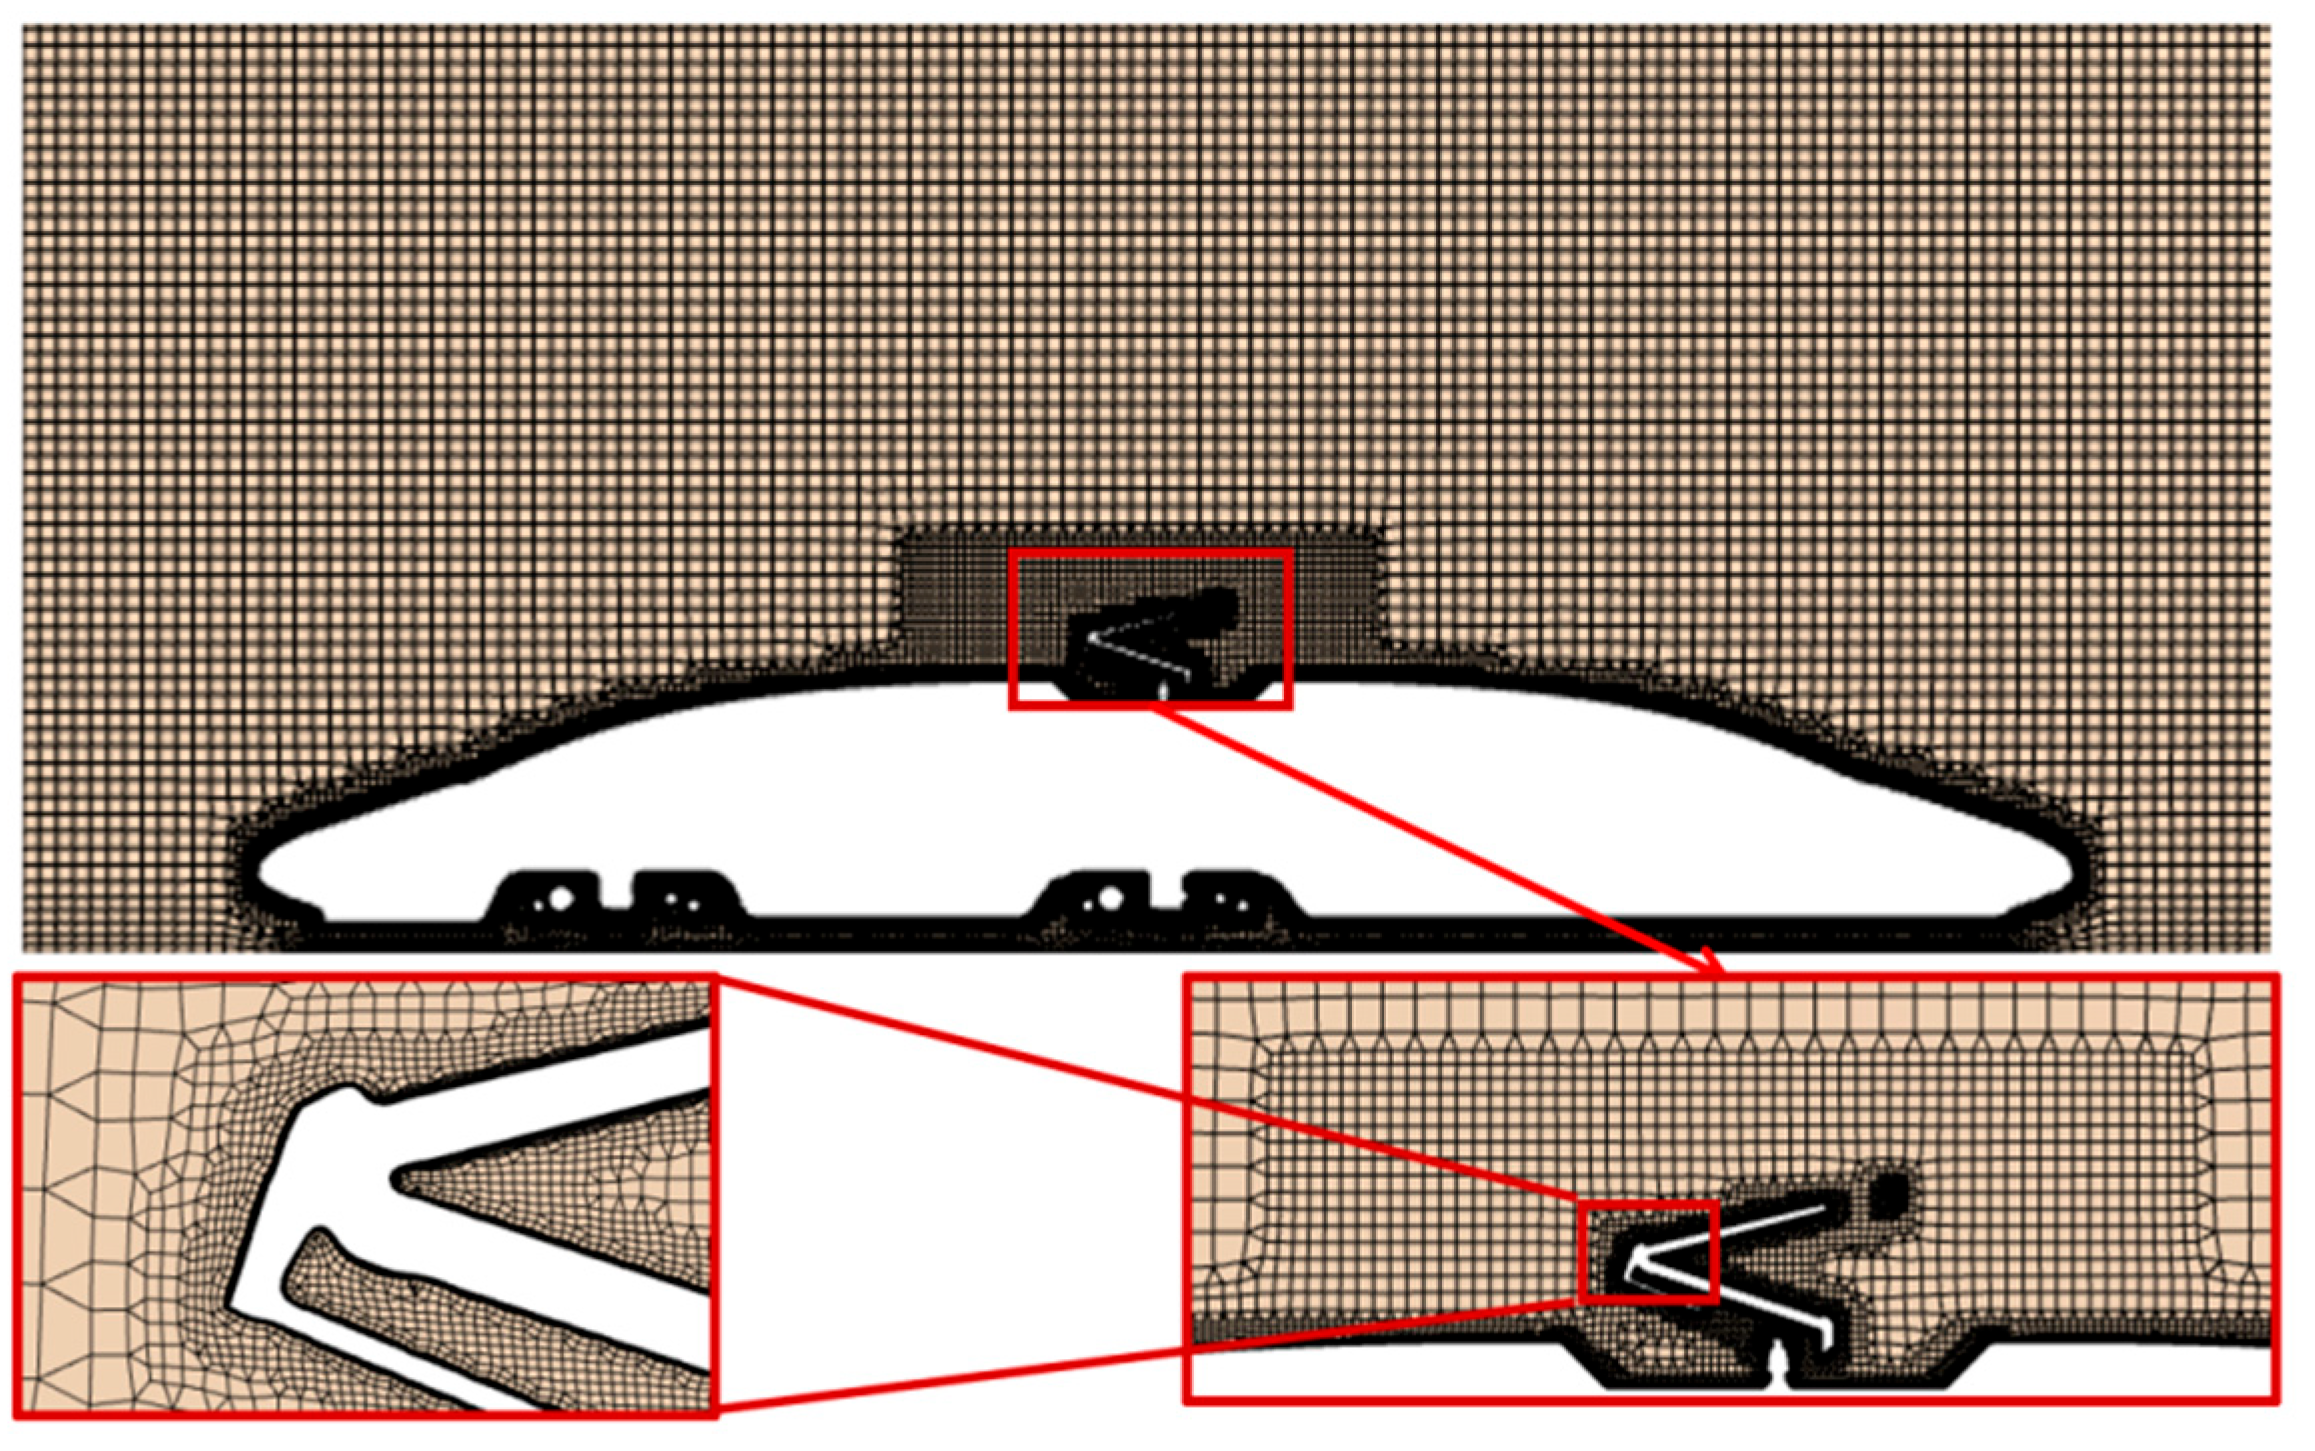
Figure 3: Computational mesh.
To verify the mesh independence and ensure mesh accuracy, three different meshes were created for an independence test. Based on Table 1, the difference in pantograph drag between simulations using 10 million and 14 million meshes is less than 0.1%, while the difference in lift coefficient is below 5%. Both variations fall within the acceptable margin of experimental error. After balancing computational resource requirements with simulation accuracy, this study employs a 10-million-cell mesh configuration for all simulations.
Table 1: Mesh independence verification.
| Computational Mesh | Simplified Train Surface Mesh (mm) | Pantograph Surface Mesh (mm) | Mesh Total (Million) | Drag Coefficient | Lift Coefficient |
|---|---|---|---|---|---|
| Coarse mesh | 58 | 13 | 6 | 1.038 | 0.052 |
| Medium mesh | 45 | 10 | 10 | 1.036 | 0.049 |
| Fine mesh | 34 | 7 | 14 | 1.035 | 0.047 |
3.4 Icing Simulation Method Validation
Few wind-tunnel experiments have been conducted on pantograph icing. Most studies on supercooled droplet icing focus on aircraft wing icing. To validate the computational model’s accuracy, this study performs ice-accumulation simulations on an NACA0012 wing and compares the results with the experimental data from Wright [23]. The experimental parameters are summarized in the Table 2.
Fig. 4a presents the aircraft simulation model, featuring finer meshing at the wing’s leading and trailing edges to enhance computational accuracy. Fig. 4b offers a comparison of the icing shape on the aircraft wing. Due to the wing’s 4° angle of attack, icing primarily forms on the lower half. The comparison between the simulation and wind tunnel curves shows minor differences at z = −0.02 but a largely consistent overall shape, confirming the reliability of the numerical simulation method.
Table 2: Wing icing parameters.
| Parameter | Numerical Value |
|---|---|
| Angle of attack | 4° |
| Aircraft chord length | 0.5334 m |
| Droplet diameter | 20 μm |
| Air velocity | 102.8 m/s |
| Ambient temperature | 250.73 K |
| LWC | 0.00055 kg/m3 |
| Icing duration | 420 s |
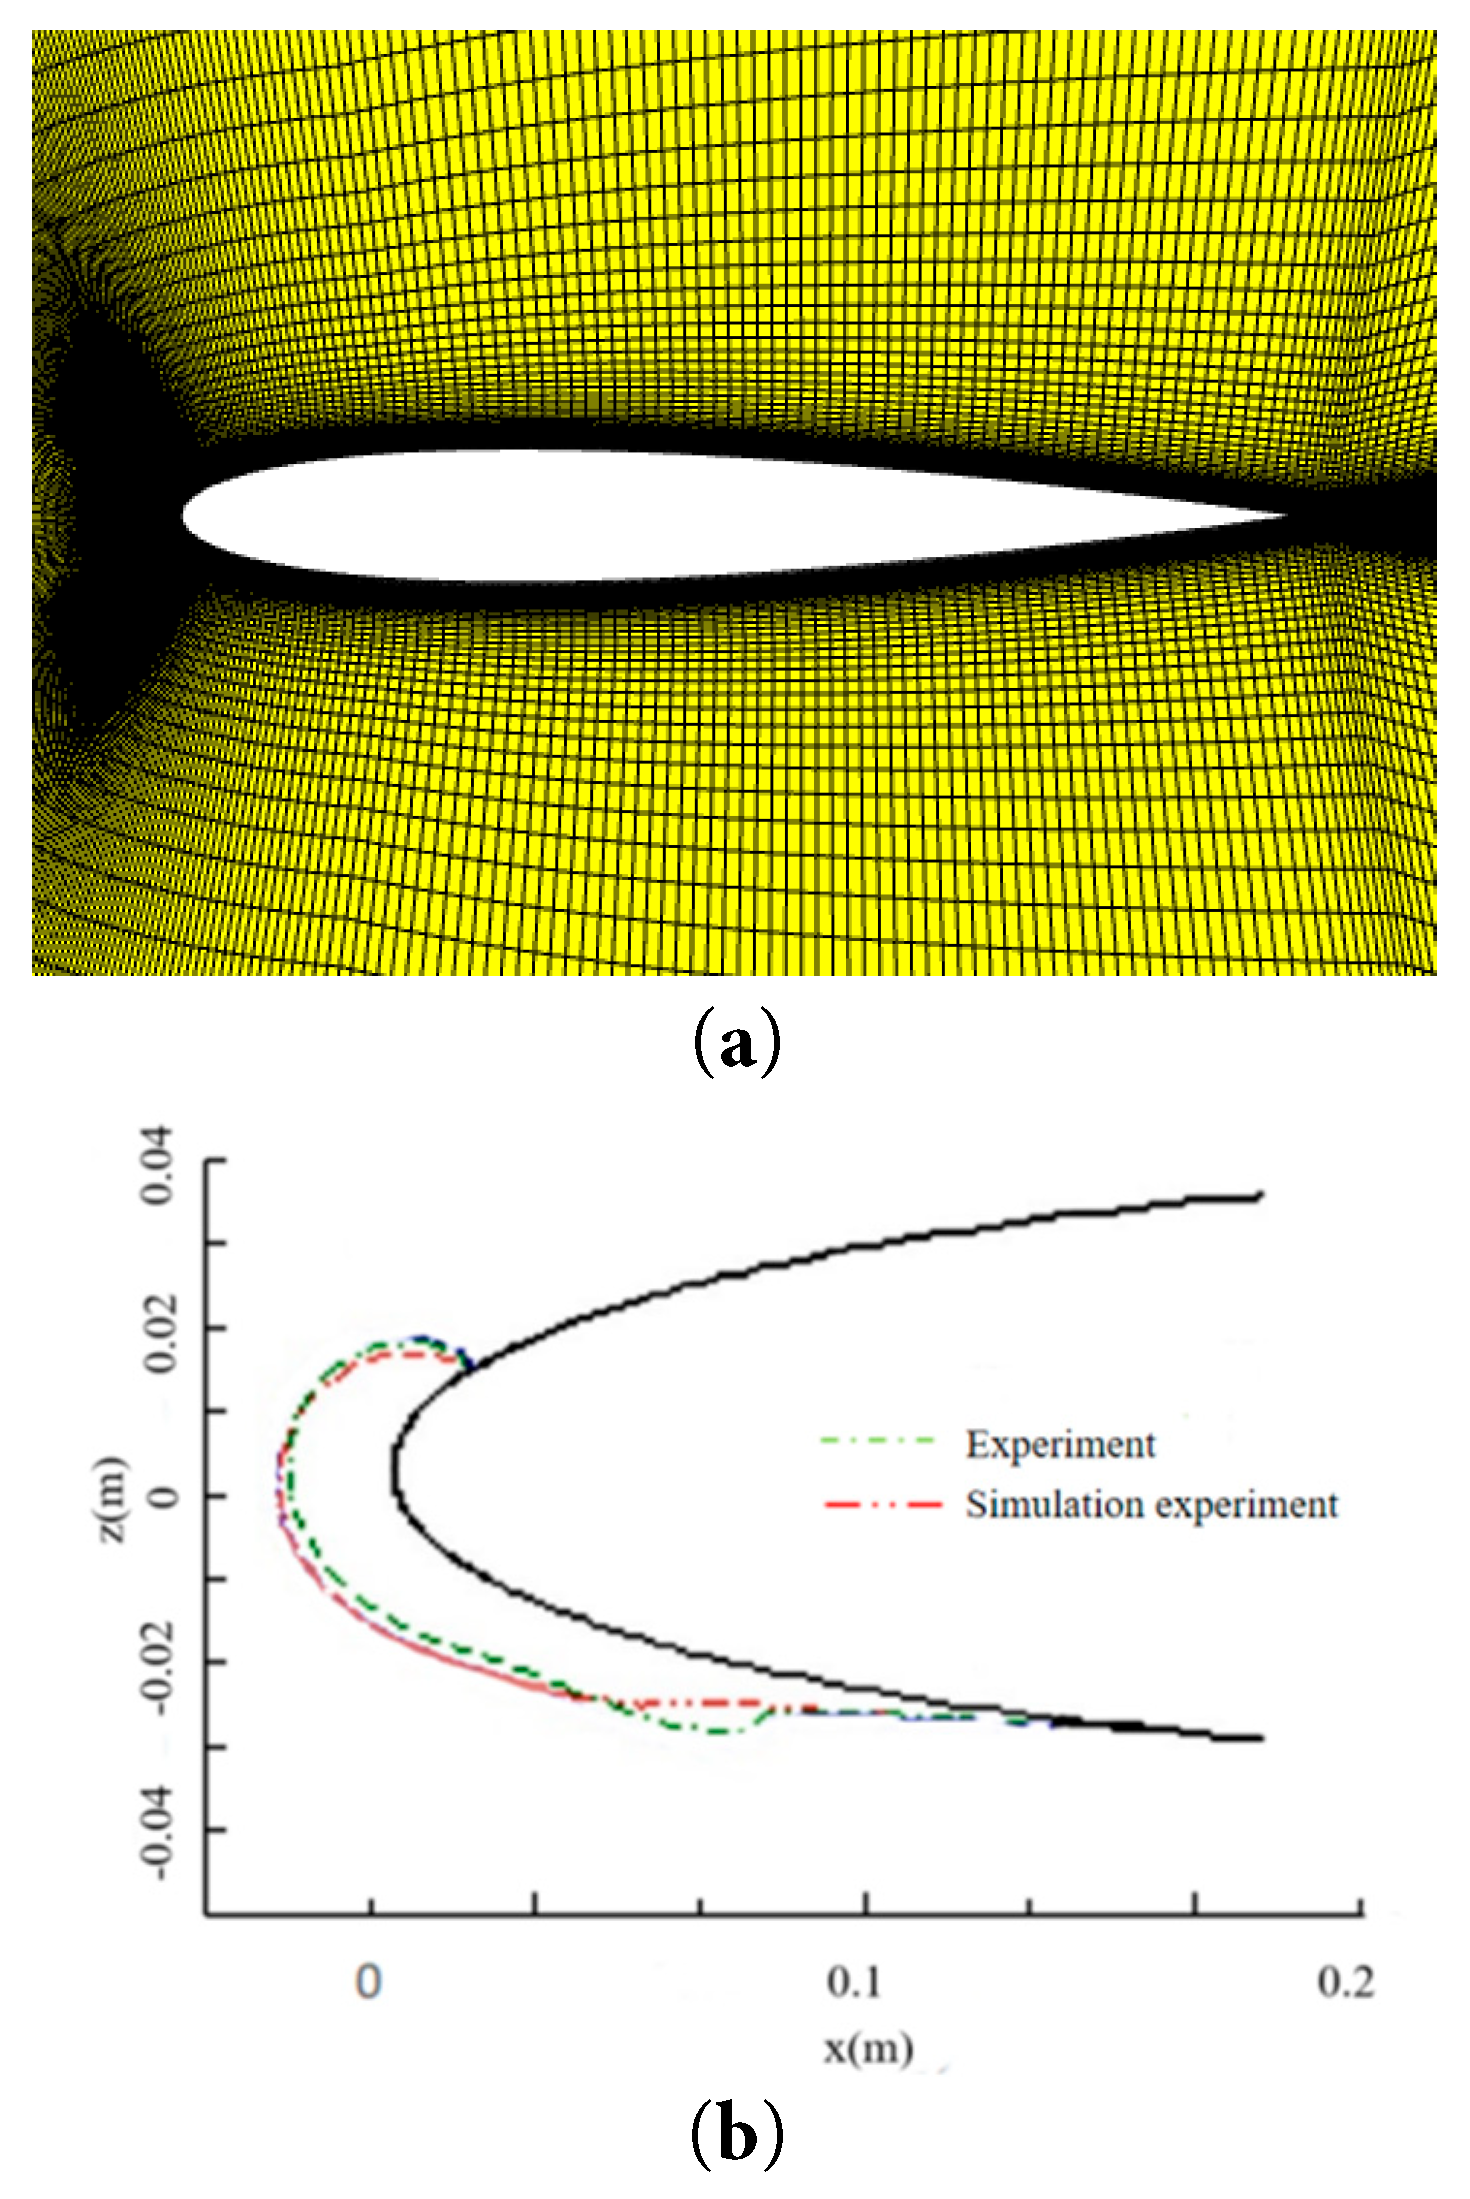
Figure 4: Model validation. (a) Wing model. (b) Wing icing shape.
4 The Flow Field around the Pantograph Region
To understand the motion of supercooled liquid droplets in the pantograph region, the flow field around the pantograph region must be analyzed first, with special attention given to the pressure distribution on the pantograph surface.
Fig. 5 presents the streamlines around the pantograph at different train speeds. As the train speed increases, so does the flow velocity in the pantograph region. In the pantograph base area, higher speeds make the under-pantograph vortices more turbulent. This causes supercooled droplets to accumulate more readily, increasing ice formation there.
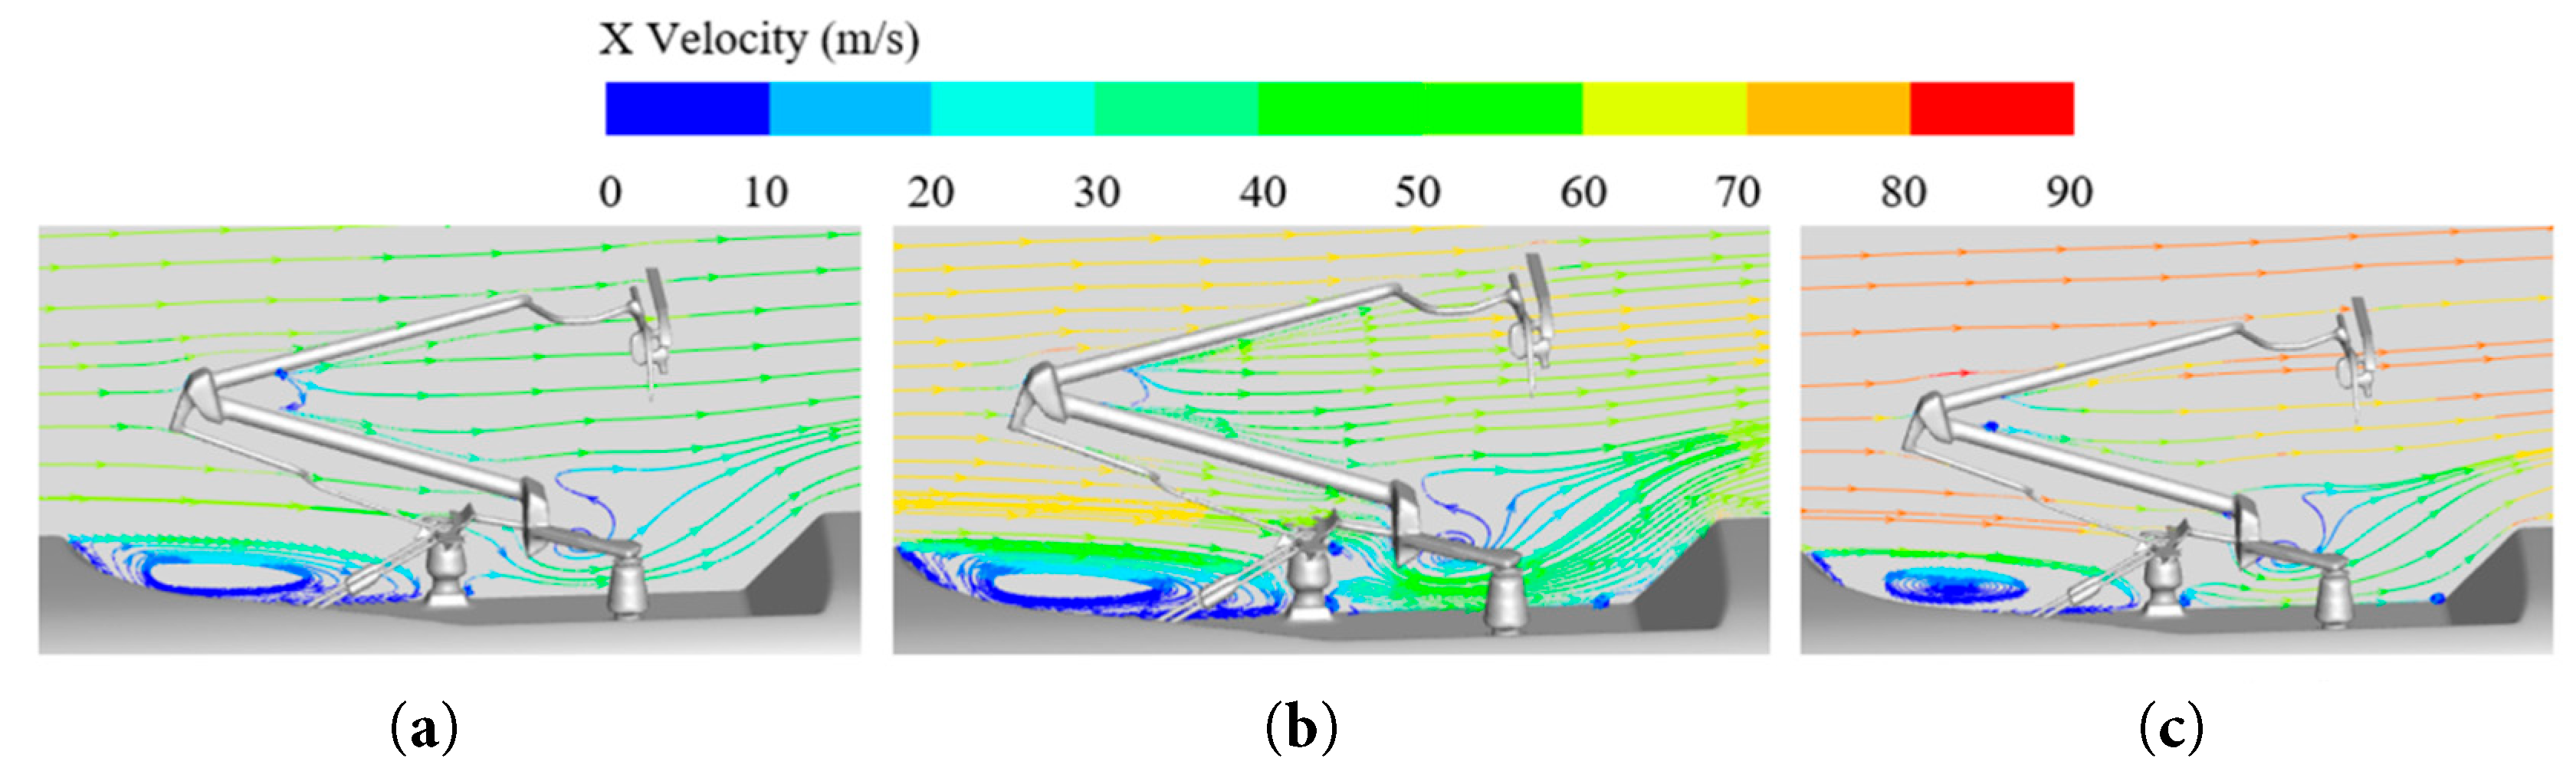
Figure 5: Streamline plots around pantograph at different train speeds. (a) V = 200 km/h. (b) V = 250 km/h. (c) V = 300 km/h.
Fig. 6 presents a pressure contour plot on the pantograph surface. As train speed rises, the pressure on the windward side of the pantograph increases. When supercooled droplets in the airflow hit the pantograph surface, their collision kinetic energy grows. This can break up the droplets, causing splashing. Driven by the flow field, some droplets may move to the back of the pantograph, affecting its surface icing.
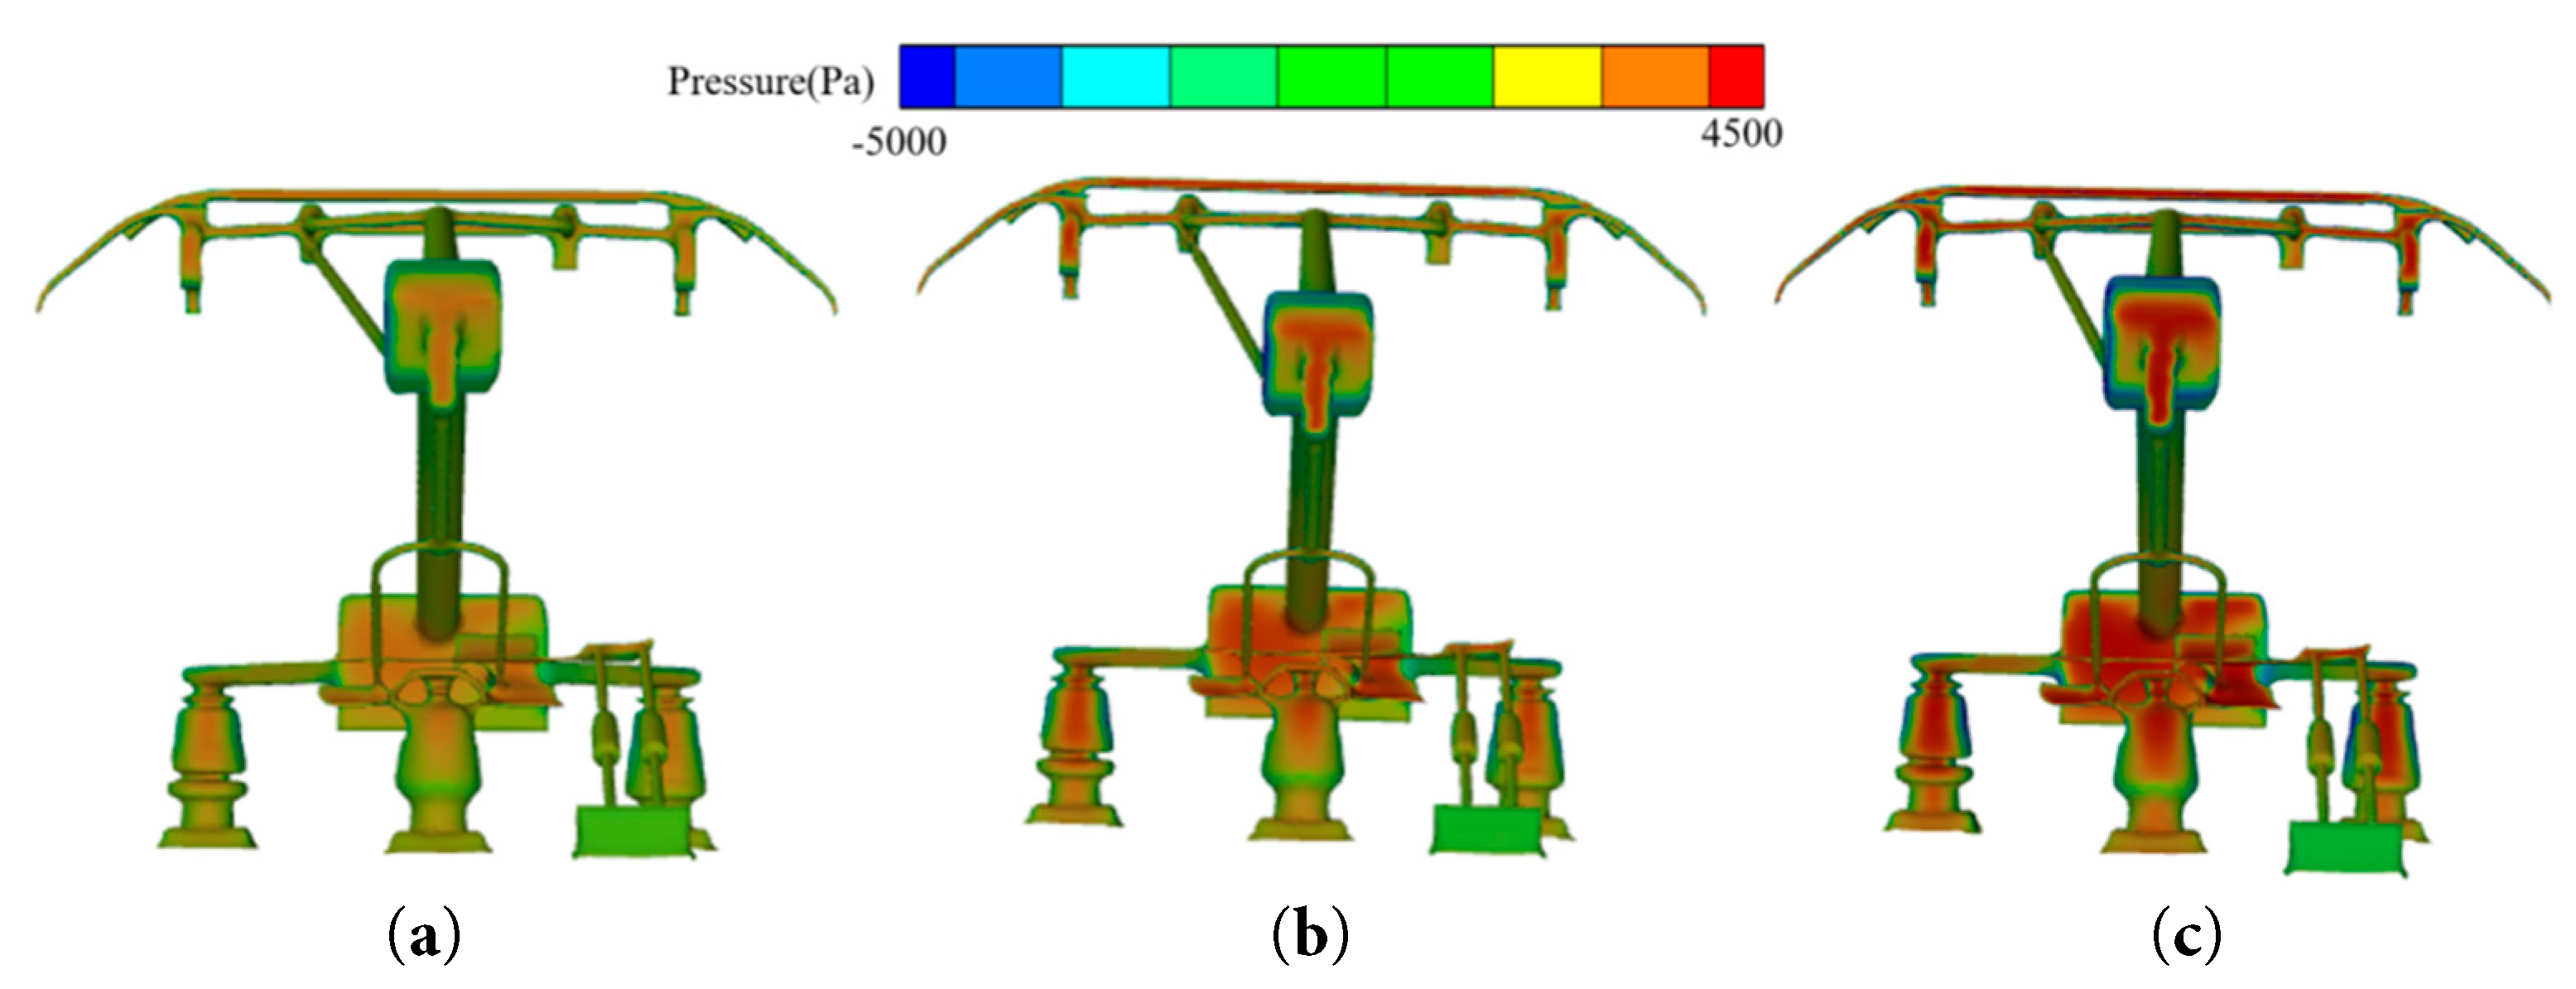
Figure 6: Pressure contour plot on the pantograph surface. (a) V = 200 km/h. (b) V = 250 km/h. (c) V = 300 km/h.
5 The Impact of Droplet Concentration and Diameter on Icing
5.1 The Impact of Droplet Concentration on Pantograph Icing
This section explores the impact of liquid water content in the air on pantograph icing. The train speed is set to 200 km/h, the ambient temperature is −5°C, and the droplet diameter is 100 μm. Based on the liquid water content reference for droplet icing [24], the LWC values are set at 0.5, 1, 1.5, and 2 g/m3, with an icing duration of 1200 s.
Fig. 7 shows the droplet concentration distribution on the pantograph surface. As the environmental droplet concentration increases, so does the concentration on the pantograph surface. This is because more supercooled droplets in the air adhere to the pantograph when they collide with it. The most significant increases are on the windward sides of the pantograph head and the upper and lower arms. If not addressed, this can compromise icing quality and may even affect the pantograph’s raising/lowering and current-collection functions.
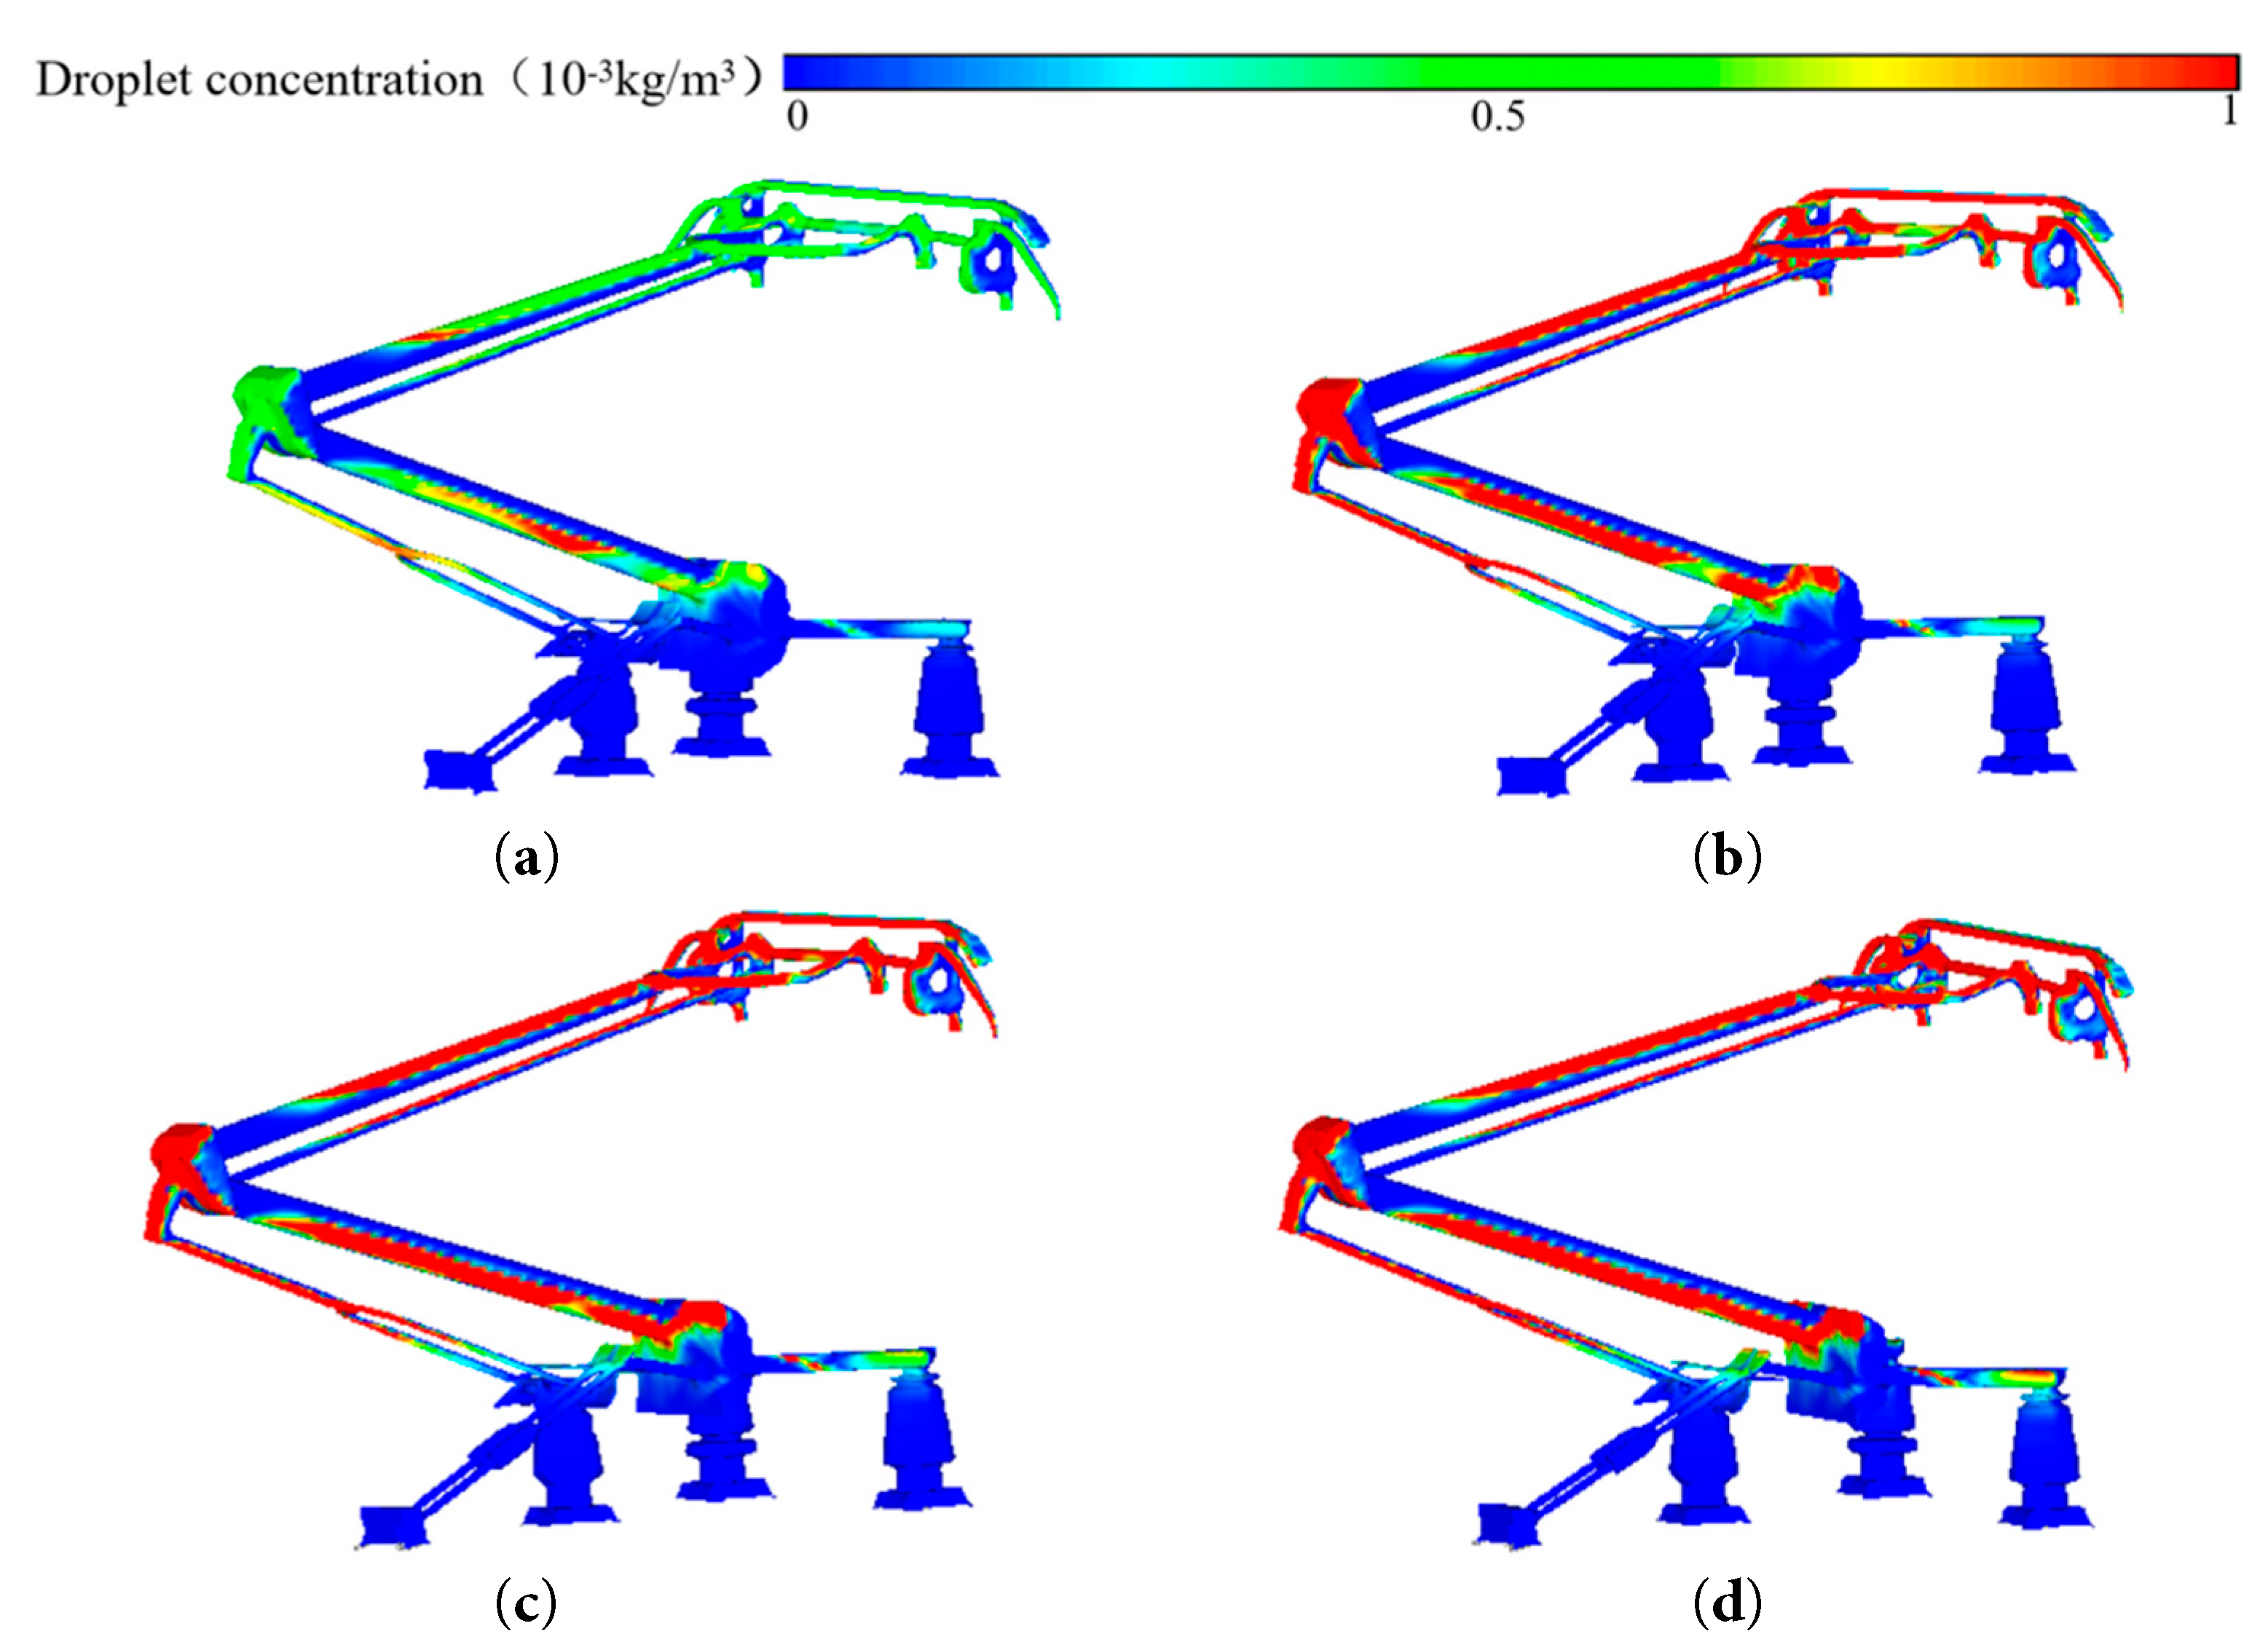
Figure 7: Pantograph surface droplet concentration distribution map. (a) LWC = 0.5 g/m3. (b) LWC = 1 g/m3. (c) LWC = 1.5 g/m3. (d) LWC = 2 g/m3.
Fig. 8 schematically shows the droplet collection coefficient on the pantograph surface. As the environmental liquid water content increases, the overall droplet collection coefficient of the pantograph shows an increasing trend. This is because when the droplet diameter is 100 μm, the Stokes number (St ≈ 1.2) is in the inertial collision efficient zone. At this time, the droplet trajectory is weakly affected by the air flow entrainment effect, and the probability of droplets colliding with the surface increases linearly with the concentration. In addition, the increase in concentration leads to droplet clusters disturbing the airflow and promoting the spread of droplets towards the surface. As a result, the area of droplet distribution on the pantograph surface increases, further affecting the ice distribution on the pantograph surface. It can be seen from the figure that the components with a larger droplet collection coefficient are the windward surfaces of the pantograph head, upper and lower arm rods, push rod, and guide rod. These components are also the main ice-forming positions and can affect the performance of the pantograph.
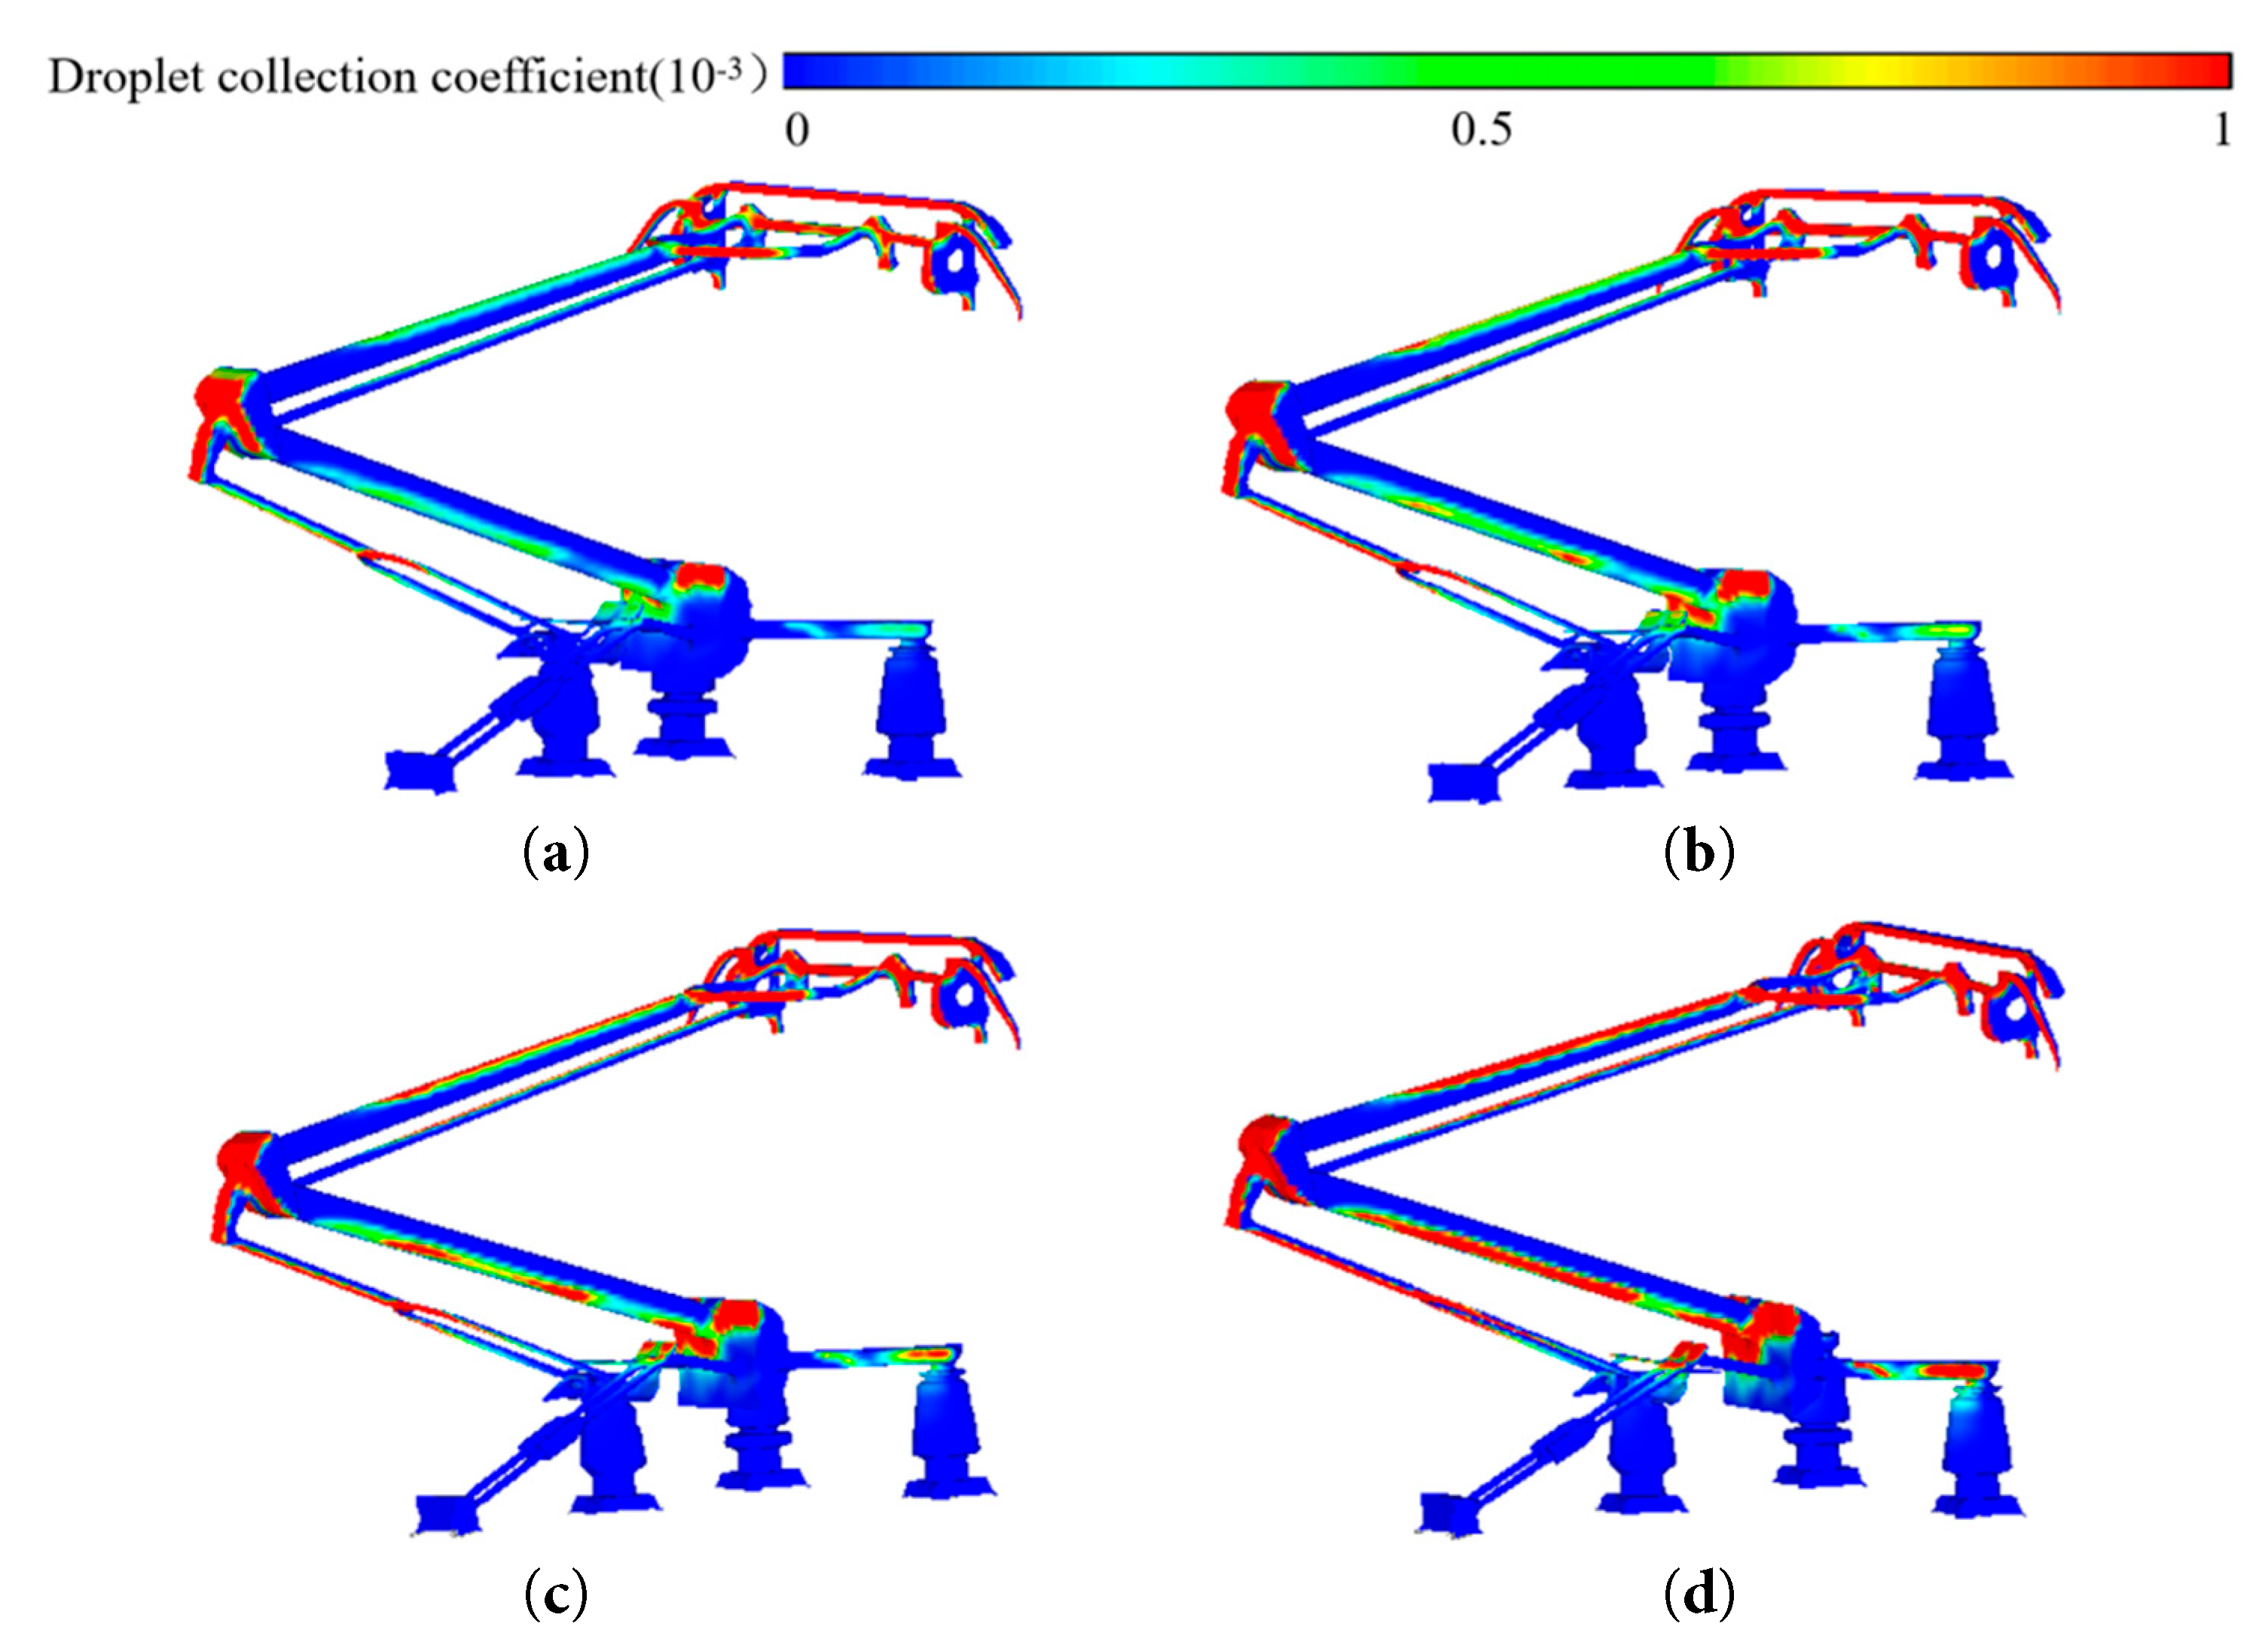
Figure 8: Droplet collection coefficient distribution on pantograph surface. (a) LWC = 0.5 g/m3. (b) LWC = 1 g/m3. (c) LWC = 1.5 g/m3. (d) LWC = 2 g/m3.
Fig. 9 schematically shows the ice-accumulation rate on the pantograph surface. As the environmental droplet concentration increases, the ice-accumulation rate on the pantograph surface also increases. This is because a higher droplet concentration in the environment increases the droplet concentration and collection efficiency on the pantograph surface. When supercooled droplets collide with the pantograph surface, they quickly freeze. The pantograph head is the area with the most obvious change in ice-accumulation rate. So variations in droplet concentration significantly affect ice formation here.
Fig. 10 shows the icing of the pantograph at different LWC. When a train runs in a supercooled environment, the pantograph head is covered with ice, affecting power supply. In extreme cases, it can fail to supply power. Under the four conditions, the pantograph icing mass is 7.94 kg, 11.88 kg, 14.13 kg, and 15.47 kg. As ice mass gradually increases, the ice accretion rates decrease to 49.62%, 18.94%, and 9.48%, respectively. High droplet concentrations may temporarily raise the substrate temperature, reducing subsequent droplet supercooling and slowing freezing. As shown in Fig. 11, the most ice forms on the pantograph head, upper and lower arms, guide rod, and push rod. Under increasing LWC, the icing mass was recorded as follows: on the panhead, 2.52 kg, 3.07 kg, 3.36 kg, and 3.61 kg; on the lift rod, 1.01 kg, 1.30 kg, 1.41 kg, and 1.49 kg; and on the lower arm rod, 1.59 kg, 2.51 kg, 2.97 kg, and 3.33 kg, respectively. In the raised state, these parts are directly exposed to supercooled droplets, so they accumulate more ice.
Figure 9: Schematic of ice-accretion rate on pantograph surface. (a) LWC = 0.5 g/m3. (b) LWC = 1 g/m3. (c) LWC = 1.5 g/m3. (d) LWC = 2 g/m3.
Figure 10: Schematic of ice formation on pantograph surface. (a) LWC = 0.5 g/m3. (b) LWC = 1 g/m3. (c) LWC = 1.5 g/m3. (d) LWC = 2 g/m3.
Figure 11: Statistics of pantograph component icing mass under different LWC conditions.
5.2 The Influence of Droplet Diameter on Pantograph Icing
When a high-speed train runs in a supercooled environment, the droplet diameter affects the pantograph’s icing. Based on the experimental conditions of maintaining a vehicle speed of 200 km/h, an ambient temperature of −5°C, and an LWC of 1 g/m3, this section investigates the impact of droplet diameters at 50 μm, 100 μm, and 150 μm [25,26] on pantograph icing.
Fig. 12 illustrates the droplet concentration distribution around the pantograph under varying droplet diameter conditions. As the droplet diameter increases, the droplet concentration in both the pantograph bogie region and the insulator area progressively decreases, as clearly shown in the close-up view of Fig. 12. This phenomenon occurs since larger droplet diameters reduce the droplets’ flow-following capability. Consequently, airborne droplets cannot readily penetrate into the pantograph bogie region, leading to the observed reduction in droplet concentration within these specific areas.
Fig. 13 presents the contour maps depicting the droplet collection coefficient on the pantograph surface under varying droplet diameters. As illustrated in the figure, the droplet collection coefficient manifests a decreasing trend with increasing droplet diameter. This phenomenon occurs due to the fact that as the droplet diameter increases, the inertial force (proportional to the square of the diameter) causes an imbalance in the ratio between the adhesive force and the shear force exerted by the high-speed airflow. This imbalance prevents complete adhesion upon impact, leading to droplet detachment. The close-up view in Fig. 13 reveals that regions exhibiting higher droplet collection coefficients are primarily located at the pantograph head and the upper/lower arm rods. Consequently, these specific areas are predisposed to greater ice accretion mass.
Figure 12: Droplet concentration distribution on pantograph surface for different droplet diameters. (a) D = 50 μm. (b) D = 100 μm. (c) D = 150 μm.
Fig. 14 illustrates the ice accretion rates on the pantograph surface under varying droplet diameters. As shown, increasing droplet diameter reduces the ice accretion rate across the pantograph surface, with the most significant decline observed on the panhead, as clearly highlighted in the close-up view of Fig. 14. This occurs because larger droplet diameters reduce internal heat transfer rates, slowing droplet solidification. Furthermore, prior simulation results indicate that increased droplet diameter decreases both LWC and collection coefficient on the pantograph surface, thus further suppressing ice accretion rates.
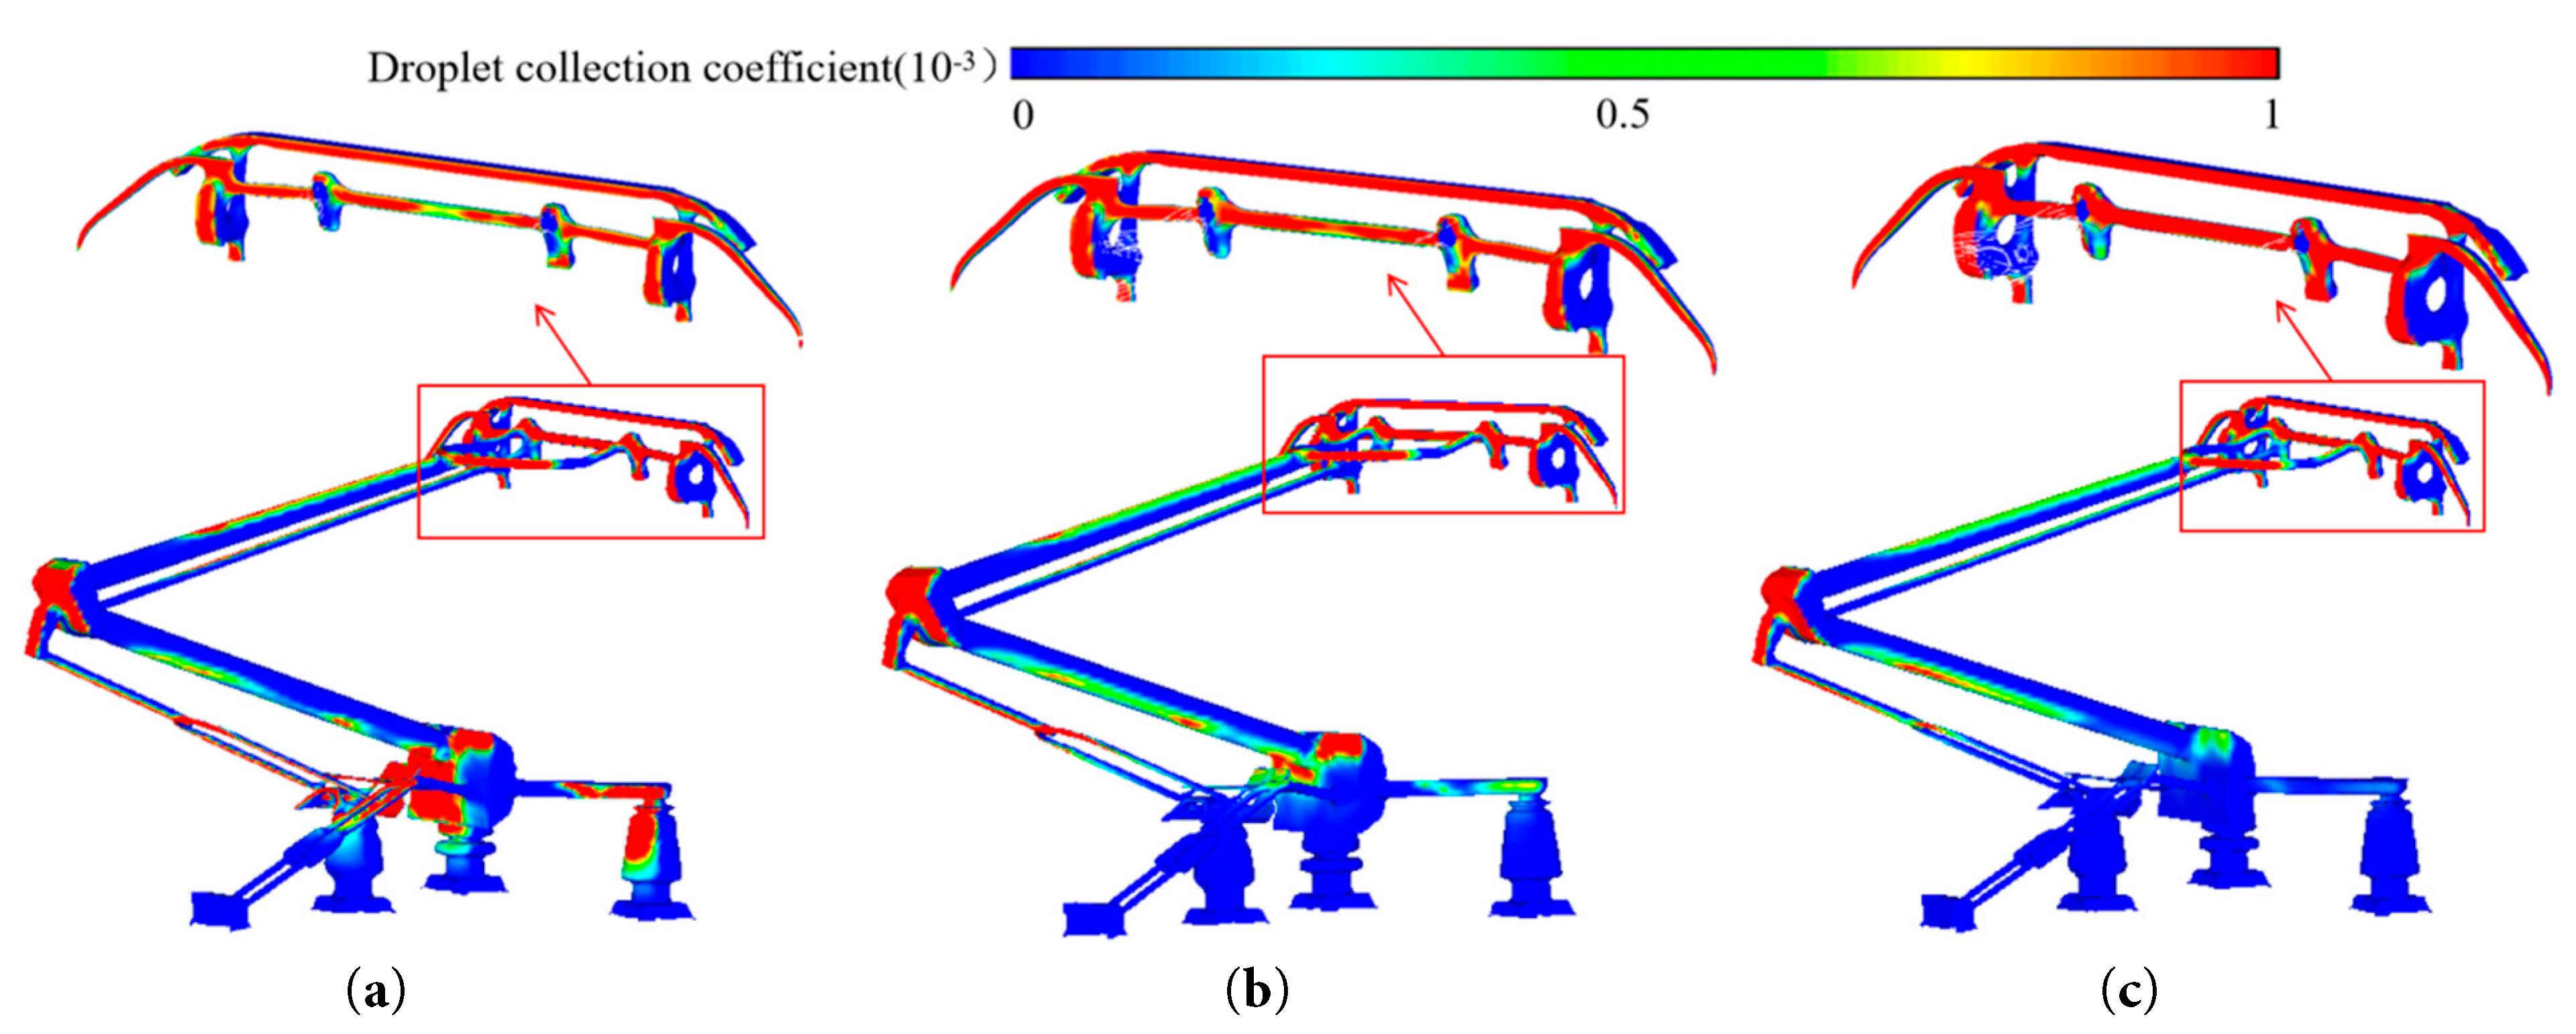
Figure 13: Schematic of droplet collection coefficient on pantograph surface for different droplet diameters. (a) D = 50 μm. (b) D = 100 μm. (c) D = 150 μm.
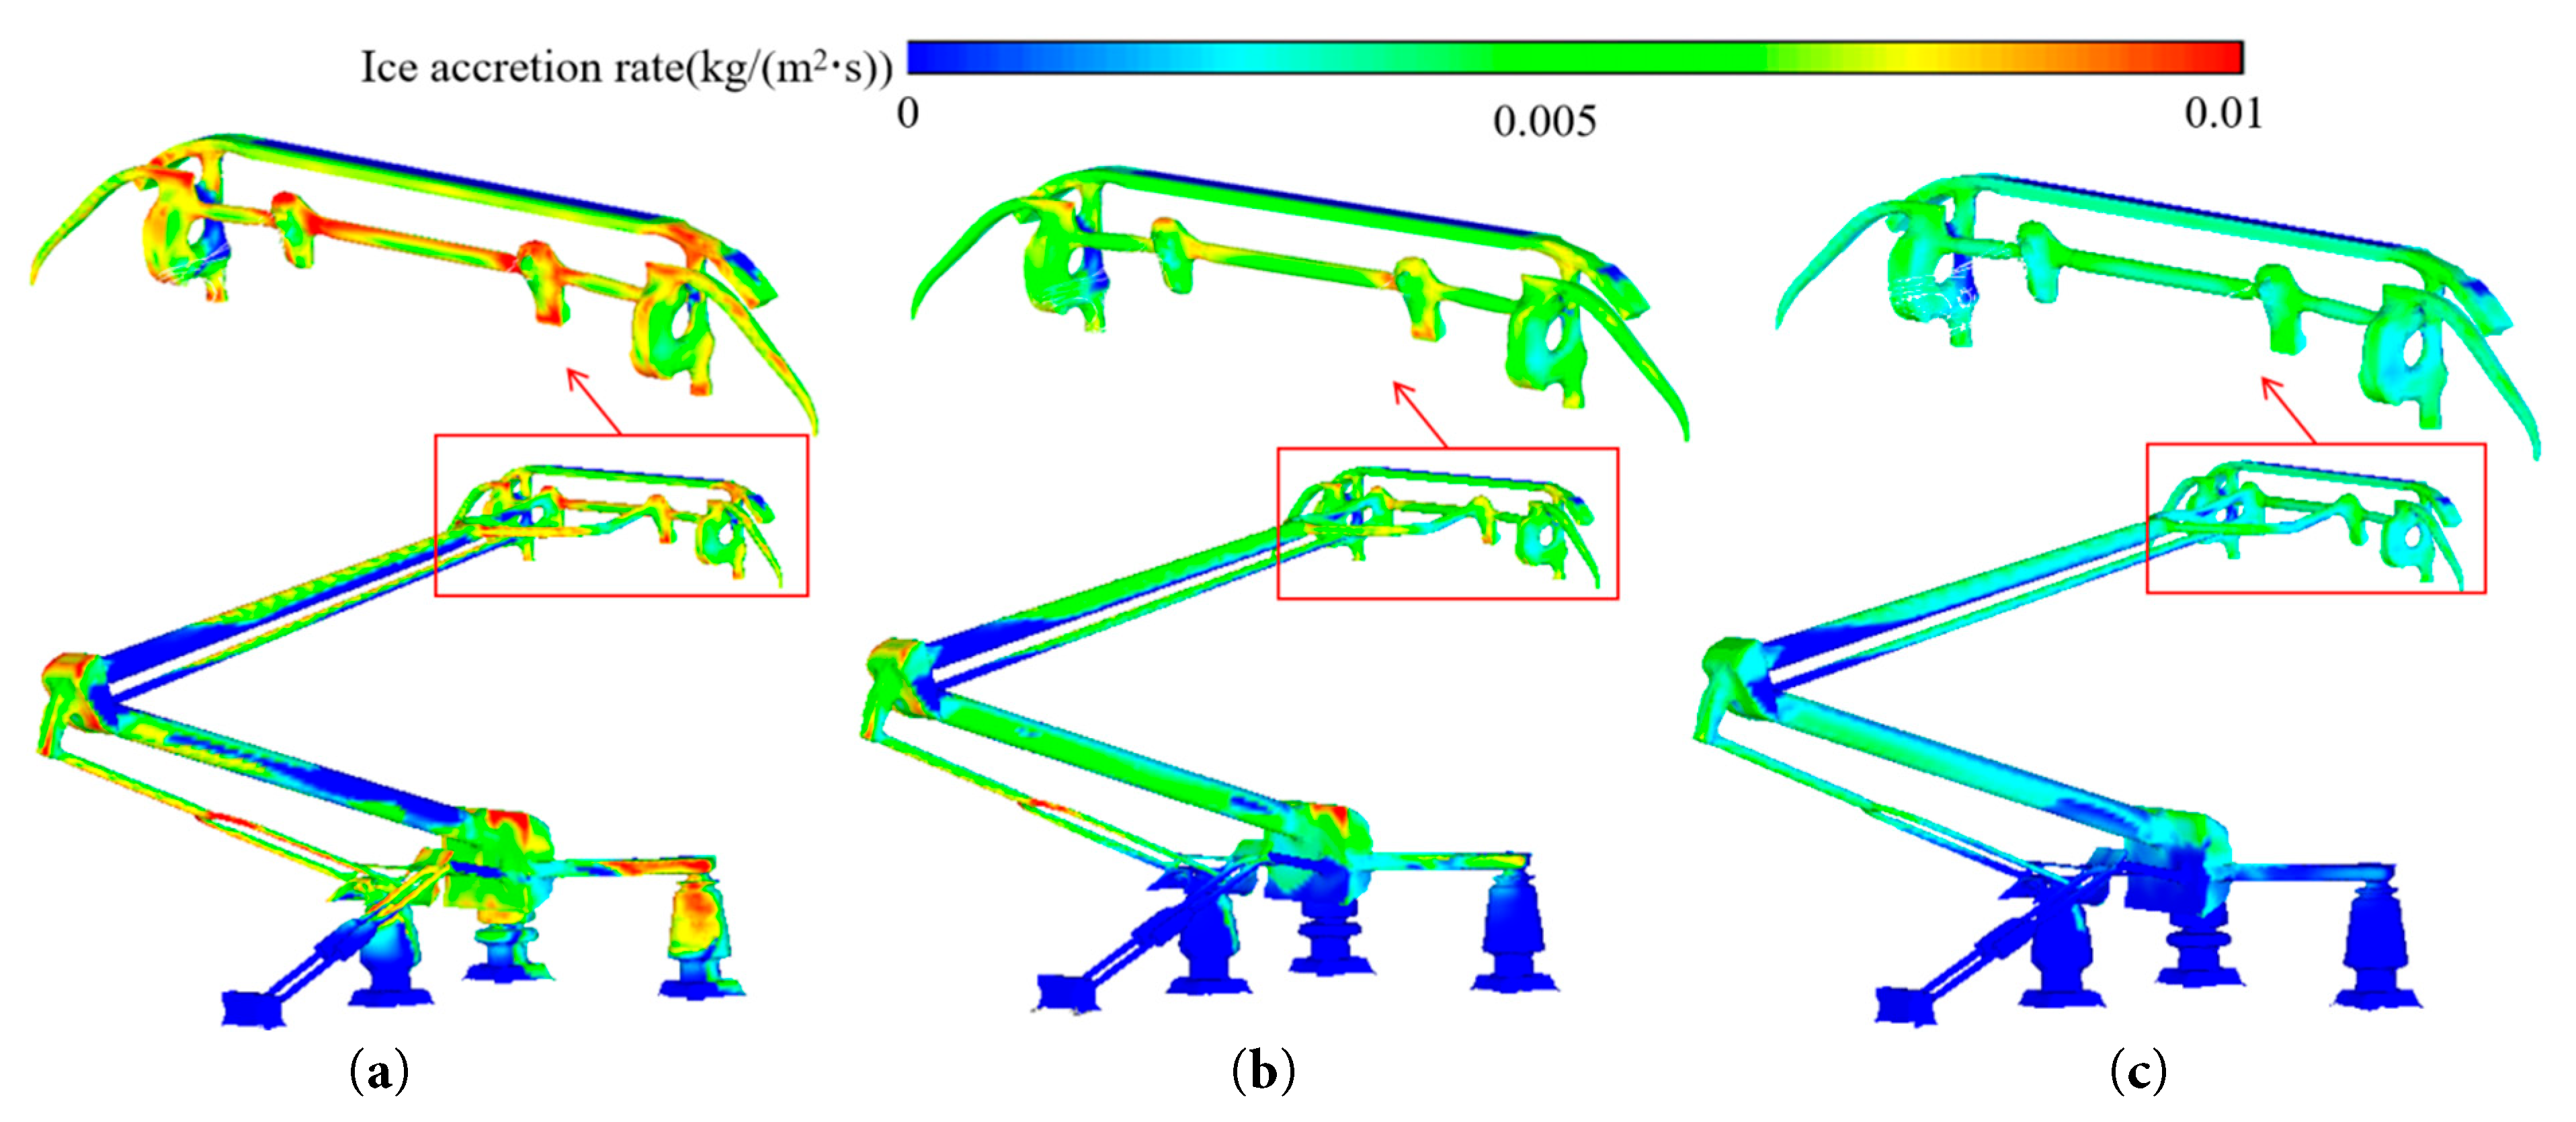
Figure 14: Schematic of ice-accumulation rate on pantograph surface for different droplet diameters. (a) D = 50 μm. (b) D = 100 μm. (c) D = 150 μm.
Fig. 15 presents the icing on the pantograph surface for different droplet diameters. As the droplet diameter increases, the icing area on the pantograph base and insulator decreases. Larger droplets are less easily transported to the pantograph base area by the airflow, resulting in a reduction of the icing area. Under the three conditions studied, the icing masses are 14.16, 11.88, and 10.54 kg, respectively. With increasing droplet diameter, the icing mass decreased by 16.10% and 5.39%, respectively. This trend is due to the decrease in droplet concentration, collection coefficient, and icing rate on the pantograph surface as the droplet diameter increases, leading to a reduction in overall icing mass. Fig. 16 shows the ice accretion mass on selected components of the pantograph, indicating that the icing mass on the pantograph base and insulator decreases significantly with increasing droplet diameter. The icing mass on the pantograph base frame was recorded as 3.92 kg, 2.27 kg, and 1.91 kg, while that on the insulators was 2.06 kg, 1.48 kg, and 0.40 kg, respectively.
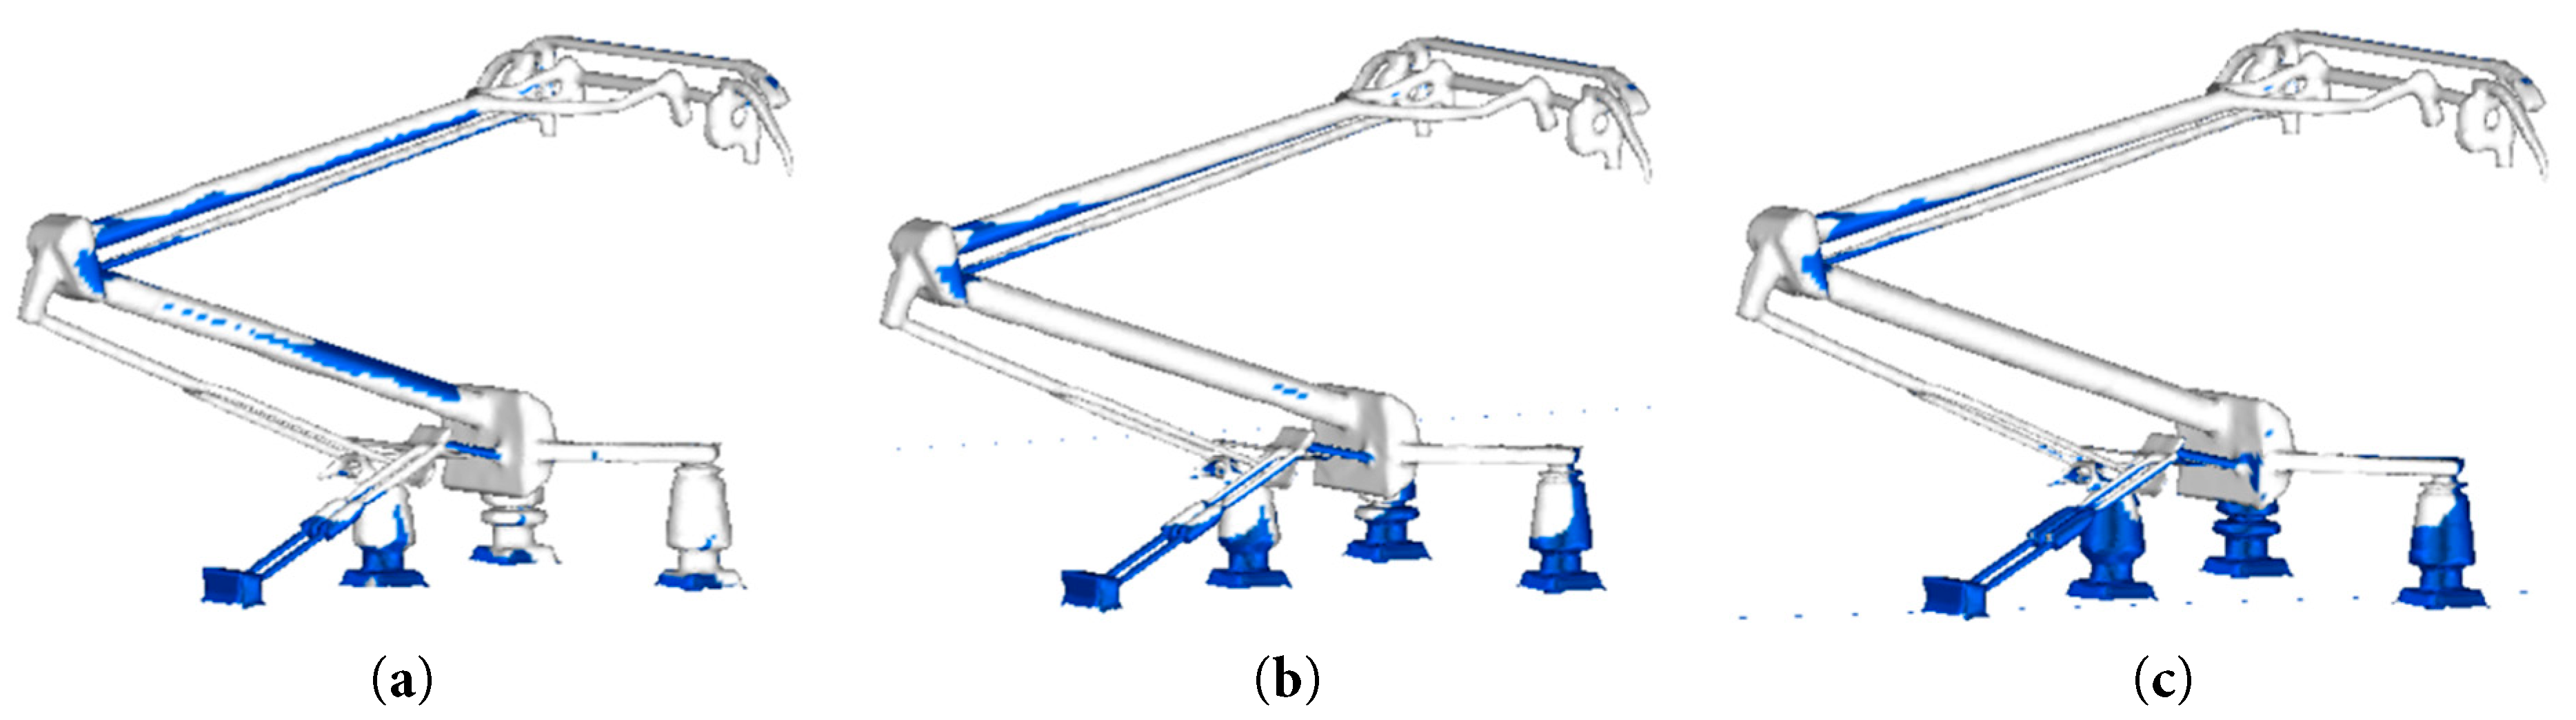
Figure 15: Schematic of icing on pantograph surface for different droplet diameters. (a) D = 50 μm. (b) D = 100 μm. (c) D = 150 μm.
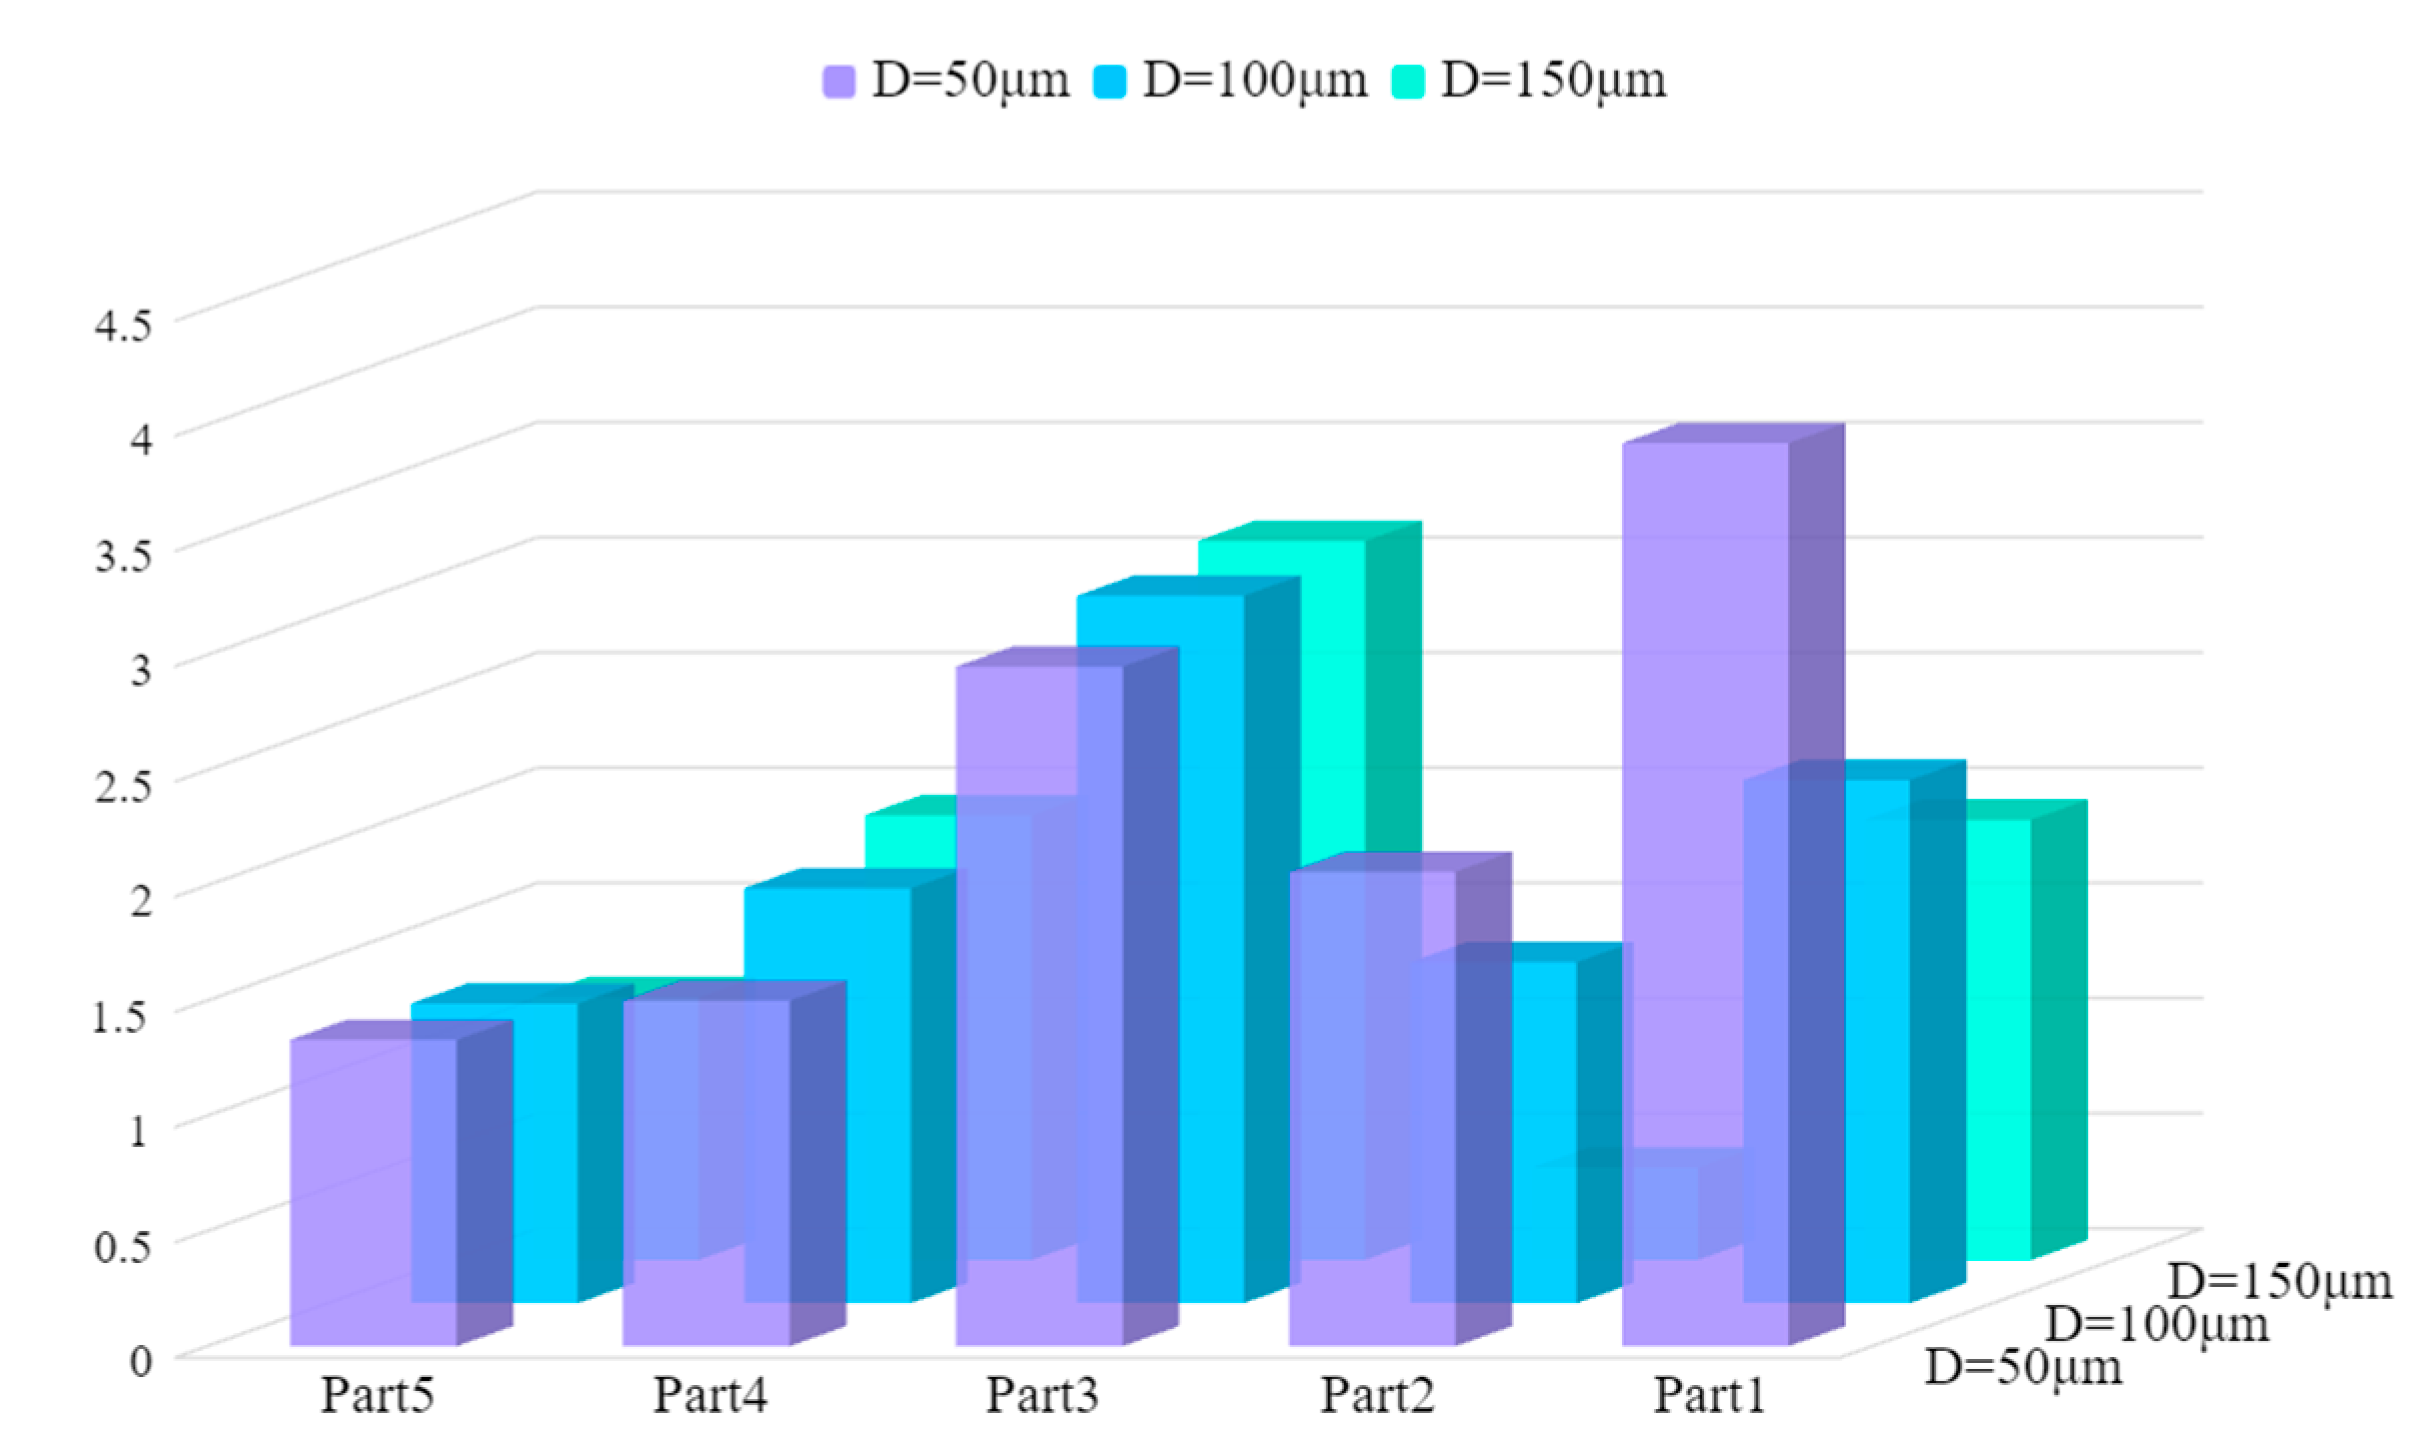
Figure 16: Statistics of pantograph component icing mass for different droplet diameters.
6 The Influence of Train Speed and Ambient Temperature on Pantograph Icing
6.1 The Impact of Train Speed on Pantograph Icing
When running in different regions, high-speed trains operate at varying speeds, affecting pantograph icing. To study this effect, the train speed is set at 200, 250, and 300 km/h [27], while keeping the ambient temperature at −5°C, the LWC at 1 g/m3, and the droplet diameter at 100 μm.
Fig. 17 shows the droplet concentration distribution on the pantograph surface at different train speeds. As the train speed increases, the droplet concentration on the pantograph surface tends to rise, but the distribution range is somewhat reduced. At lower speeds, droplets move slowly in the air, with a smaller relative speed between the pantograph and droplets. This makes it easier for droplets to spread and distribute over a wider area on the pantograph surface due to aerodynamic and inertial forces. As the train speed increases, the relative airflow speed quickens. Driven by the combined effect of inertial and aerodynamic forces, droplets are rapidly pushed onto the pantograph surface. The impact frequency between droplets and the pantograph surface increases, thus raising the droplet concentration there.
Fig. 18 shows the ice-formation rate on the pantograph surface at different train speeds. The ice-formation rate rises with increasing train speed. When the speed increases from 200 km/h to 250 km/h, the droplet collision efficiency rises significantly. More droplets adhere to the pantograph surface per unit time. The latent heat release rate also increases, lowering the surface temperature and accelerating ice thickening. When the speed increases from 250 km/h to 300 km/h, the ice-formation rate still rises, but the growth rate slows. This is due to the increasing aerodynamic shear force and thermal resistance at higher speeds, which restrict rapid ice thickening.
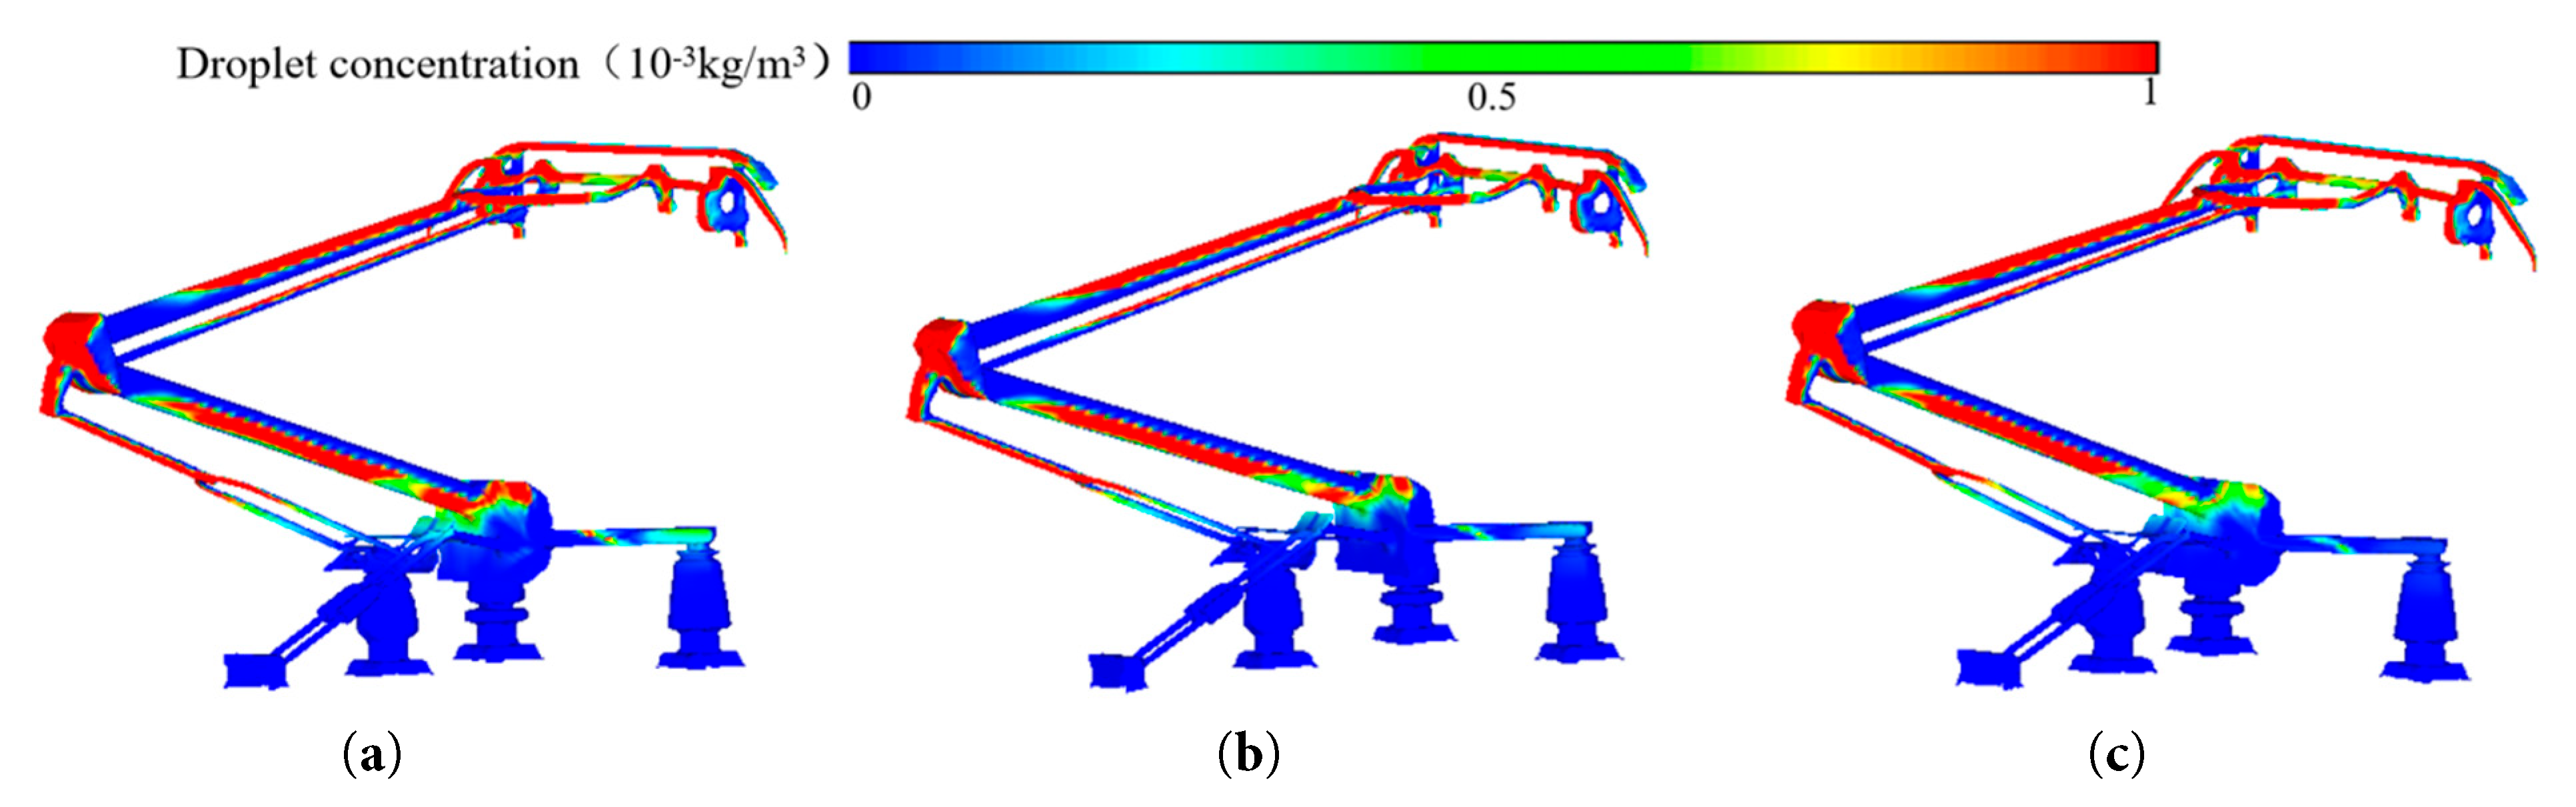
Figure 17: Droplet concentration distribution on pantograph surface at different train speeds. (a) V = 200 km/h. (b) V = 250 km/h. (c) V = 300 km.
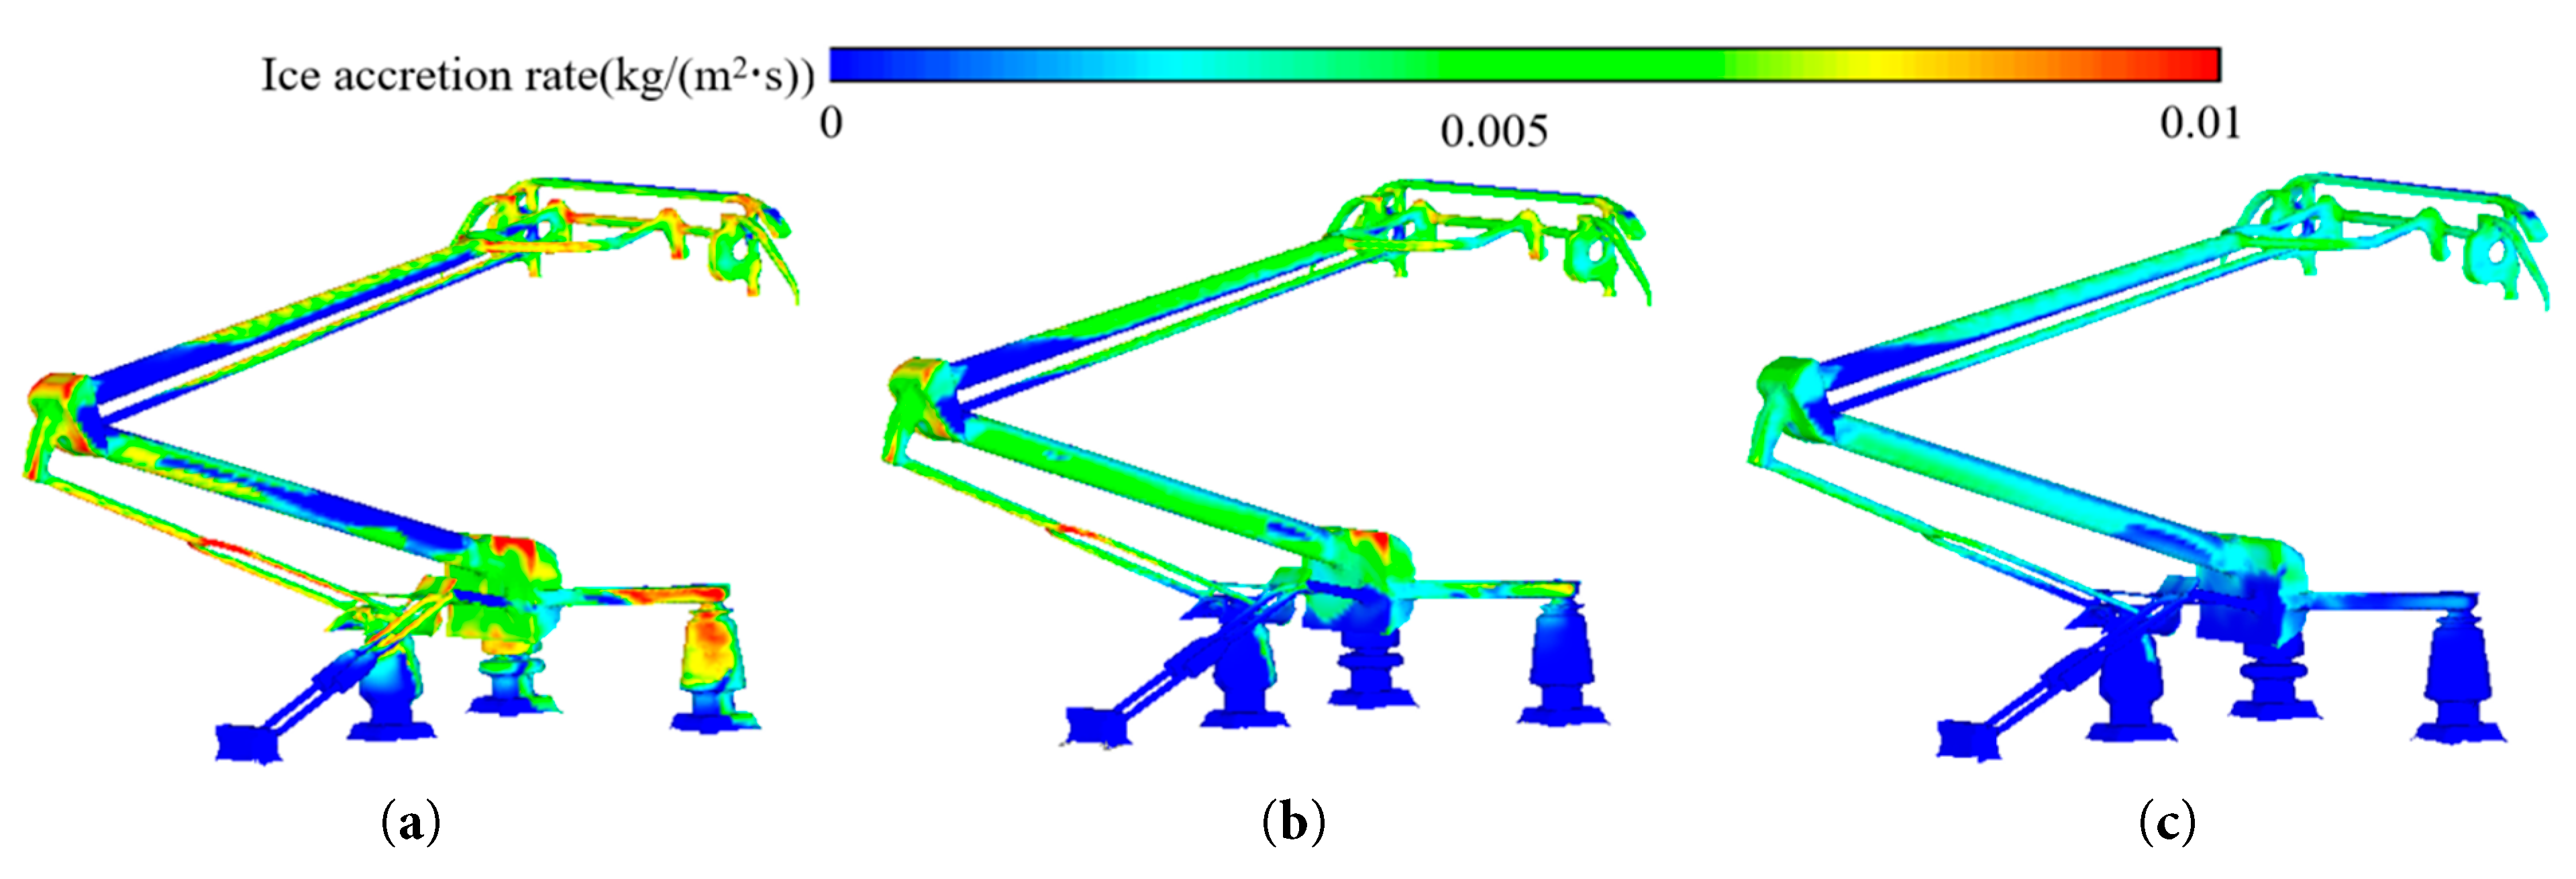
Figure 18: Schematic of ice-accretion rate on pantograph surface at different train speeds. (a) V = 200 km/h. (b) V = 250 km/h. (c) V = 300 km.
Fig. 19 shows the 2D diagram of icing on one side of the pantograph bowhead under different train speeds. As illustrated, the ice volume on the pantograph bowhead surface increases with rising speeds, but with a limited growth rate. This occurs because water droplets attached to the surface are prone to splash under high-speed airflow, thereby restricting ice accumulation.
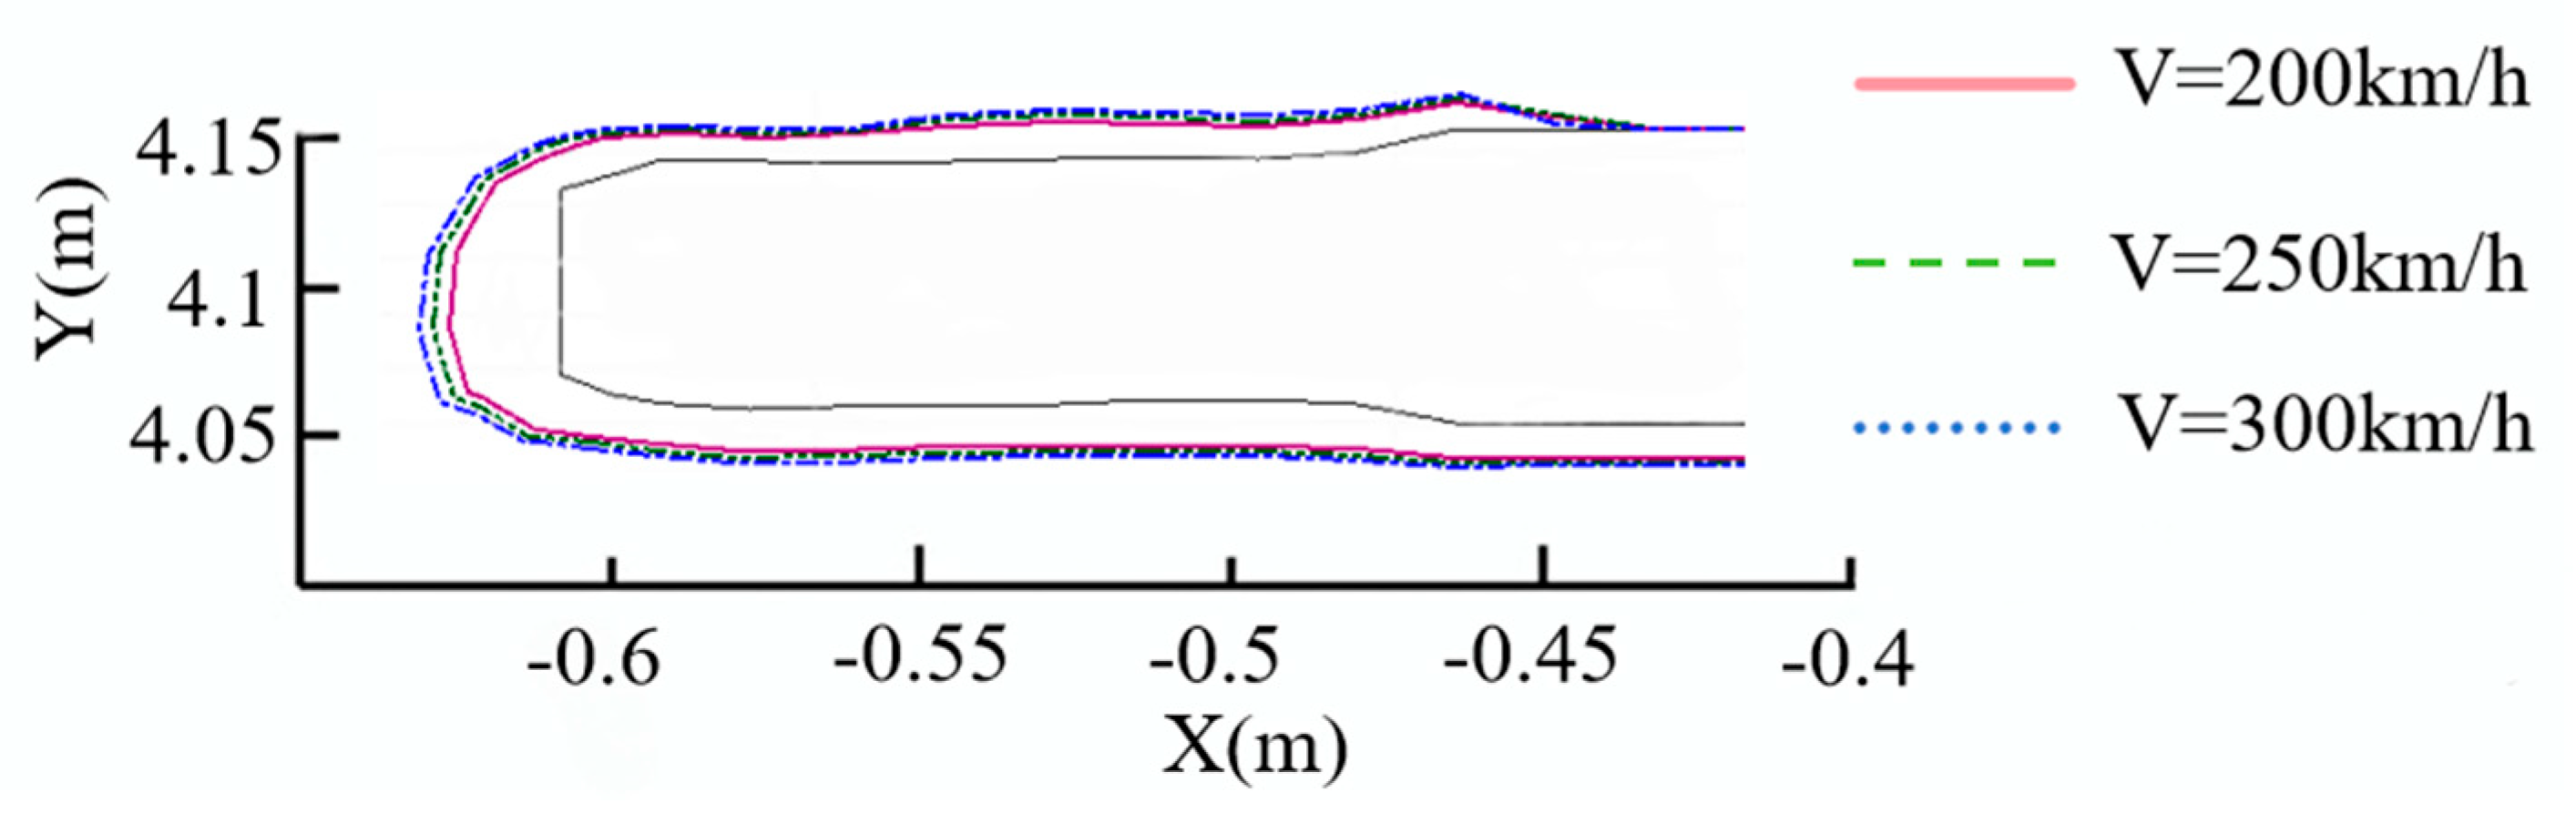
Figure 19: 2D diagram of pantograph bowhead icing under different speeds.
Under three test conditions, the ice accretion masses were 11.88 kg, 13.60 kg, and 15.42 kg, respectively. As ice mass gradually increased, the ice accretion rates decreased to 14.48% and 13.38%, indicating a slowdown in ice growth—consistent with the causes analyzed previously. Fig. 20 presents the statistics of icing mass on pantograph components at different train speeds. It can be observed that the icing mass on windward components increases with the train speed. However, the icing mass on the pantograph base decreases. This is attributed to the strong flow-following property of droplets. As the air flow speed increases, it becomes more difficult for droplets to be carried into the pantograph base area.
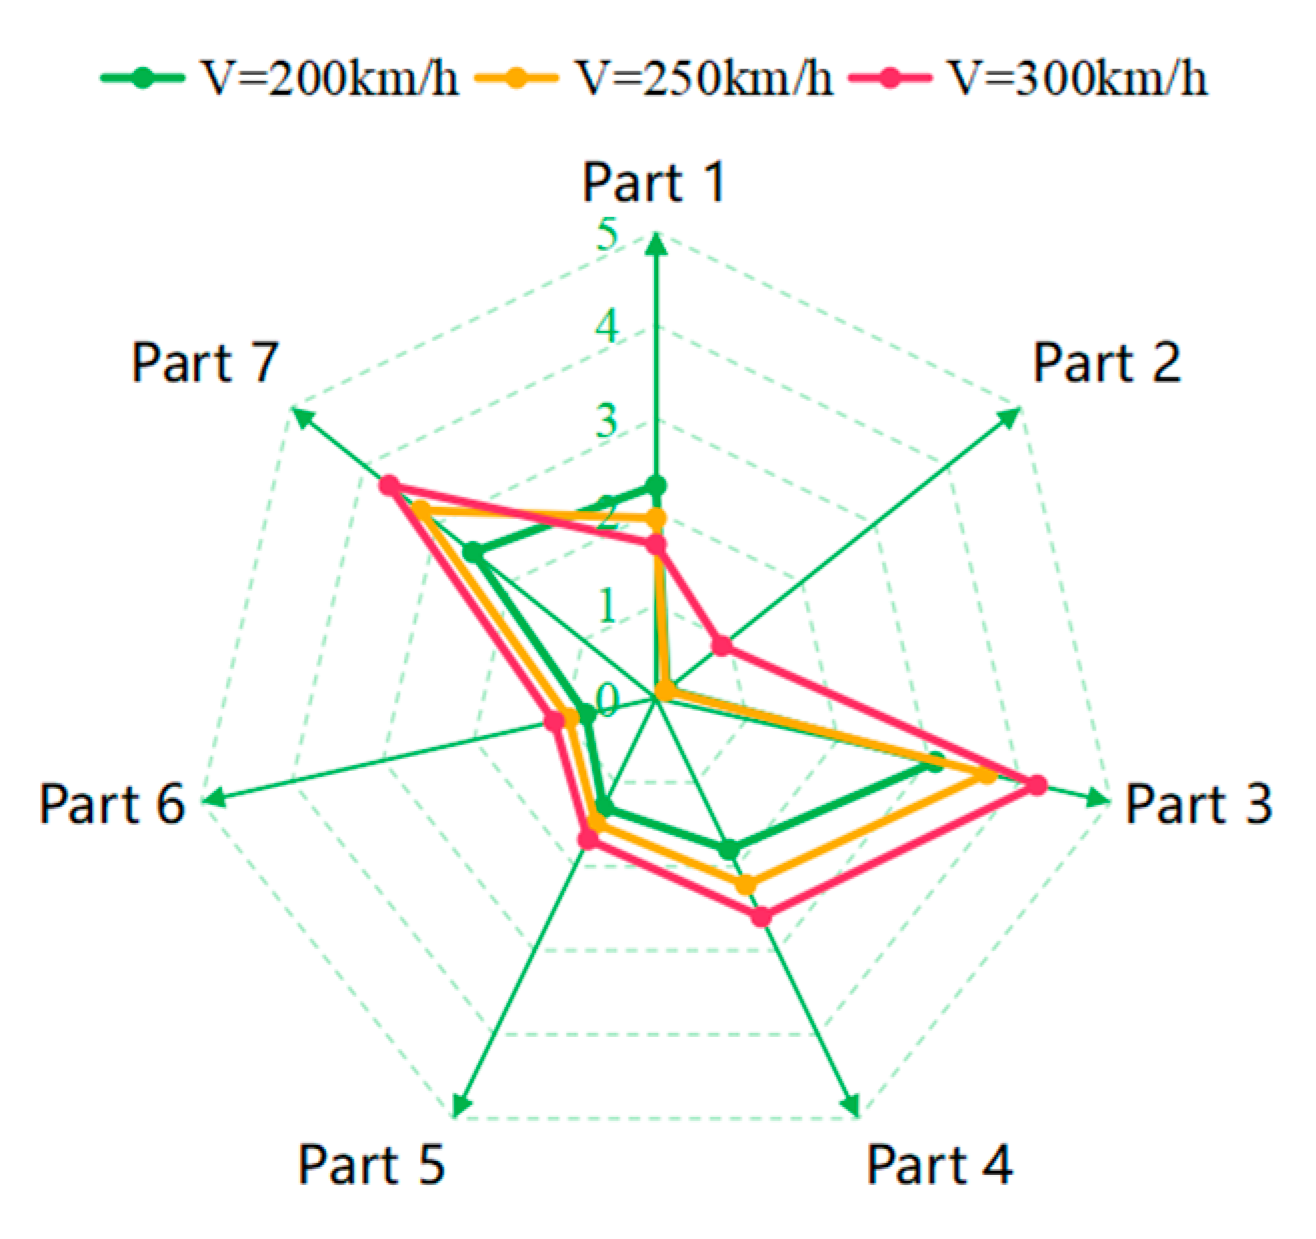
Figure 20: Icing mass statistics of pantograph components at different train speeds.
6.2 The Impact of Ambient Temperature on Pantograph Icing
To explore how ambient temperature affects pantograph icing, this study maintains a train speed of 200 km/h, an LWC of 1 g/m3, and a droplet diameter of 100 μm, while varying the ambient temperature at −5, −10, and −15°C [28,29]. As ambient temperature significantly impacts the icing rate, this section focuses on analyzing the icing rate and effectiveness on the pantograph surface.
Fig. 21 shows the ice-accretion rate on the pantograph head at different ambient temperatures. As the ambient temperature decreases, the ice-accretion rate on the windward side of the pantograph head increases significantly. This is due to the larger temperature difference between the droplets and the pantograph head surface, which accelerates the release of latent heat during freezing. Consequently, more droplets freeze per unit time, increasing the ice-accretion rate. However, when the temperature drops from −10°C to −15°C, the ice-accretion rate on the sides and back of the pantograph head decreases. At temperatures below −10°C, the freezing time of droplets shortens significantly. Upon frontal impact with the pantograph head, droplets with high supercooling freeze rapidly, marking the start of a fast-freezing phase. Supercooled droplets in the airflow struggle to reach the sides and back of the pantograph head, thus reducing the ice-accretion rate in these regions.
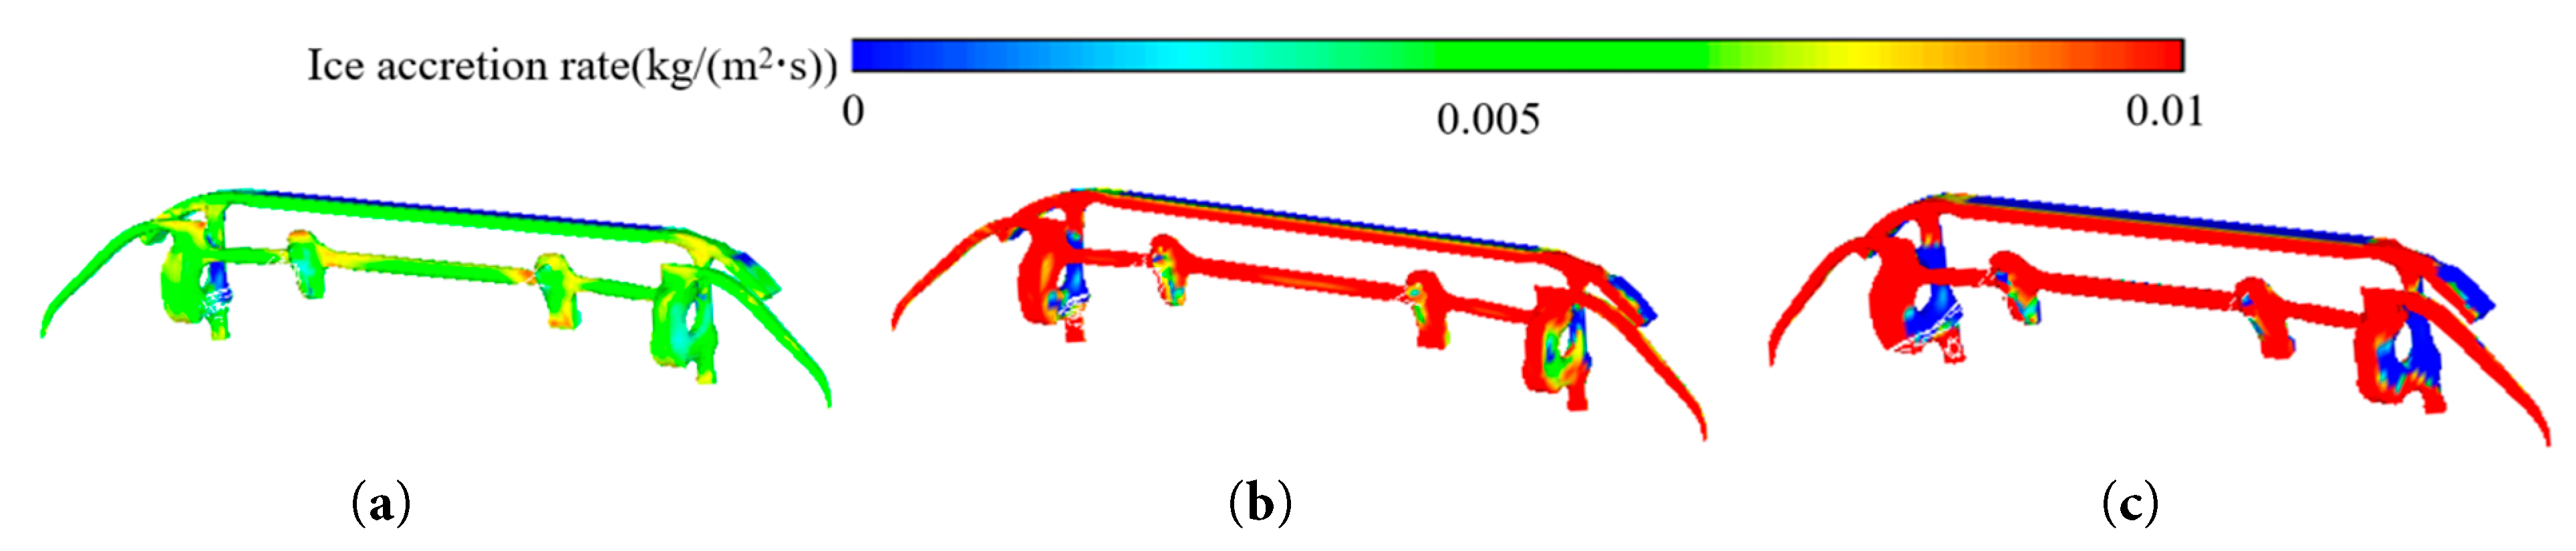
Figure 21: Schematic of ice-accretion rate on pantograph head at different ambient temperatures. (a) T = −5°C. (b) T = −10°C. (c) T = −15°C.
Fig. 22 presents the icing on the pantograph head at different ambient temperatures. The results show that as the ambient temperature decreases, the ice thickness on the windward side of the pantograph head increases, and the ice surface becomes more rough, which is consistent with the previous analysis. Under three operating conditions, the icing masses were 11.88 kg, 16.45 kg, and 19.64 kg, with ice accretion rates of 38.47% and 19.39%, respectively. The icing mass increased as ambient temperature decreased. Fig. 23 shows the statistics of icing mass on each pantograph component, indicating that the icing mass on the main components of the pantograph increases with decreasing ambient temperature.
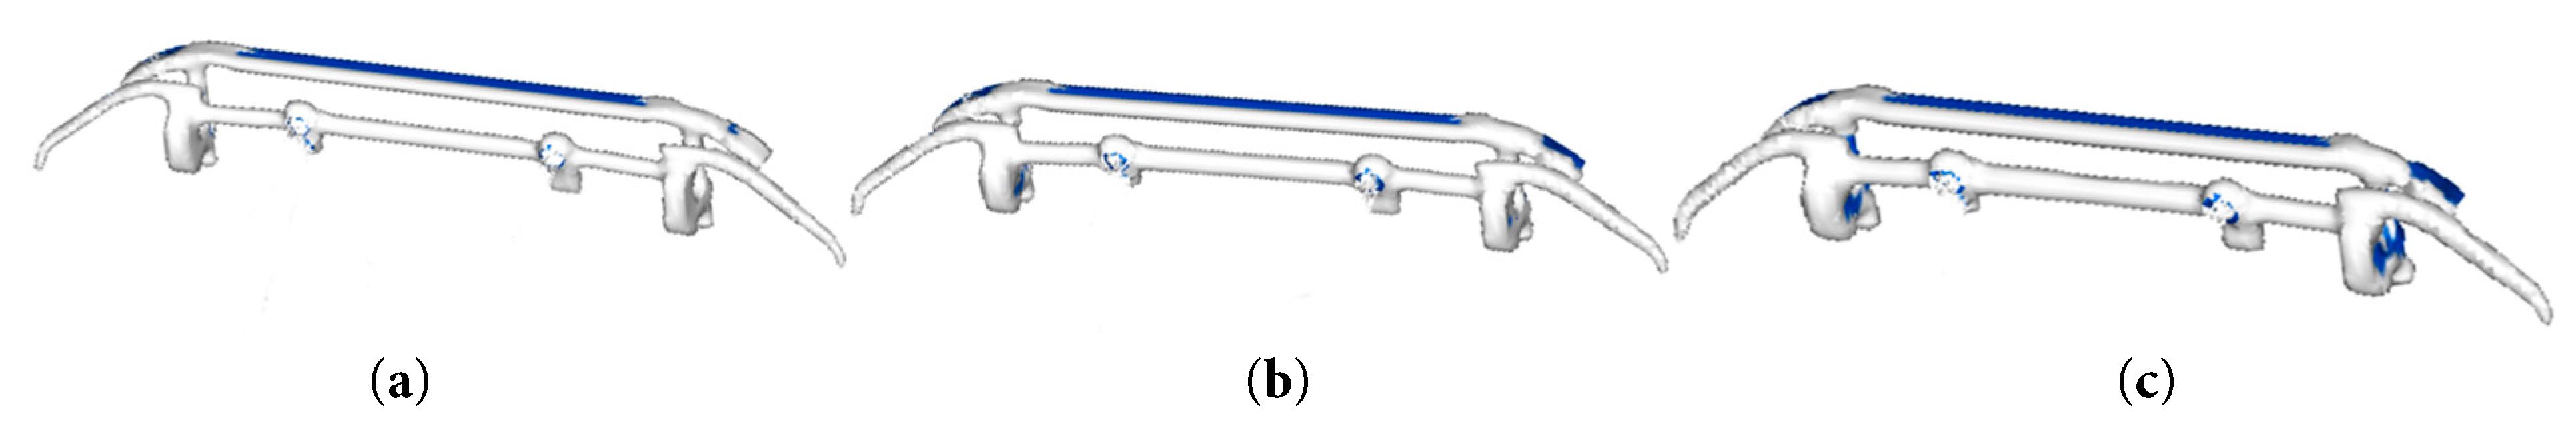
Figure 22: Schematic of icing on pantograph head at different ambient temperatures. (a) T = −5°C. (b) T = −10°C. (c) T = −15°C.
Fig. 24 presents a 2D icing diagram of the pantograph head. Ice primarily forms on the windward side due to direct impact and freezing of supercooled liquid droplets carried by airflow. Additionally, lower ambient temperatures increase ice volume by accelerating convective heat transfer and droplet solidification.
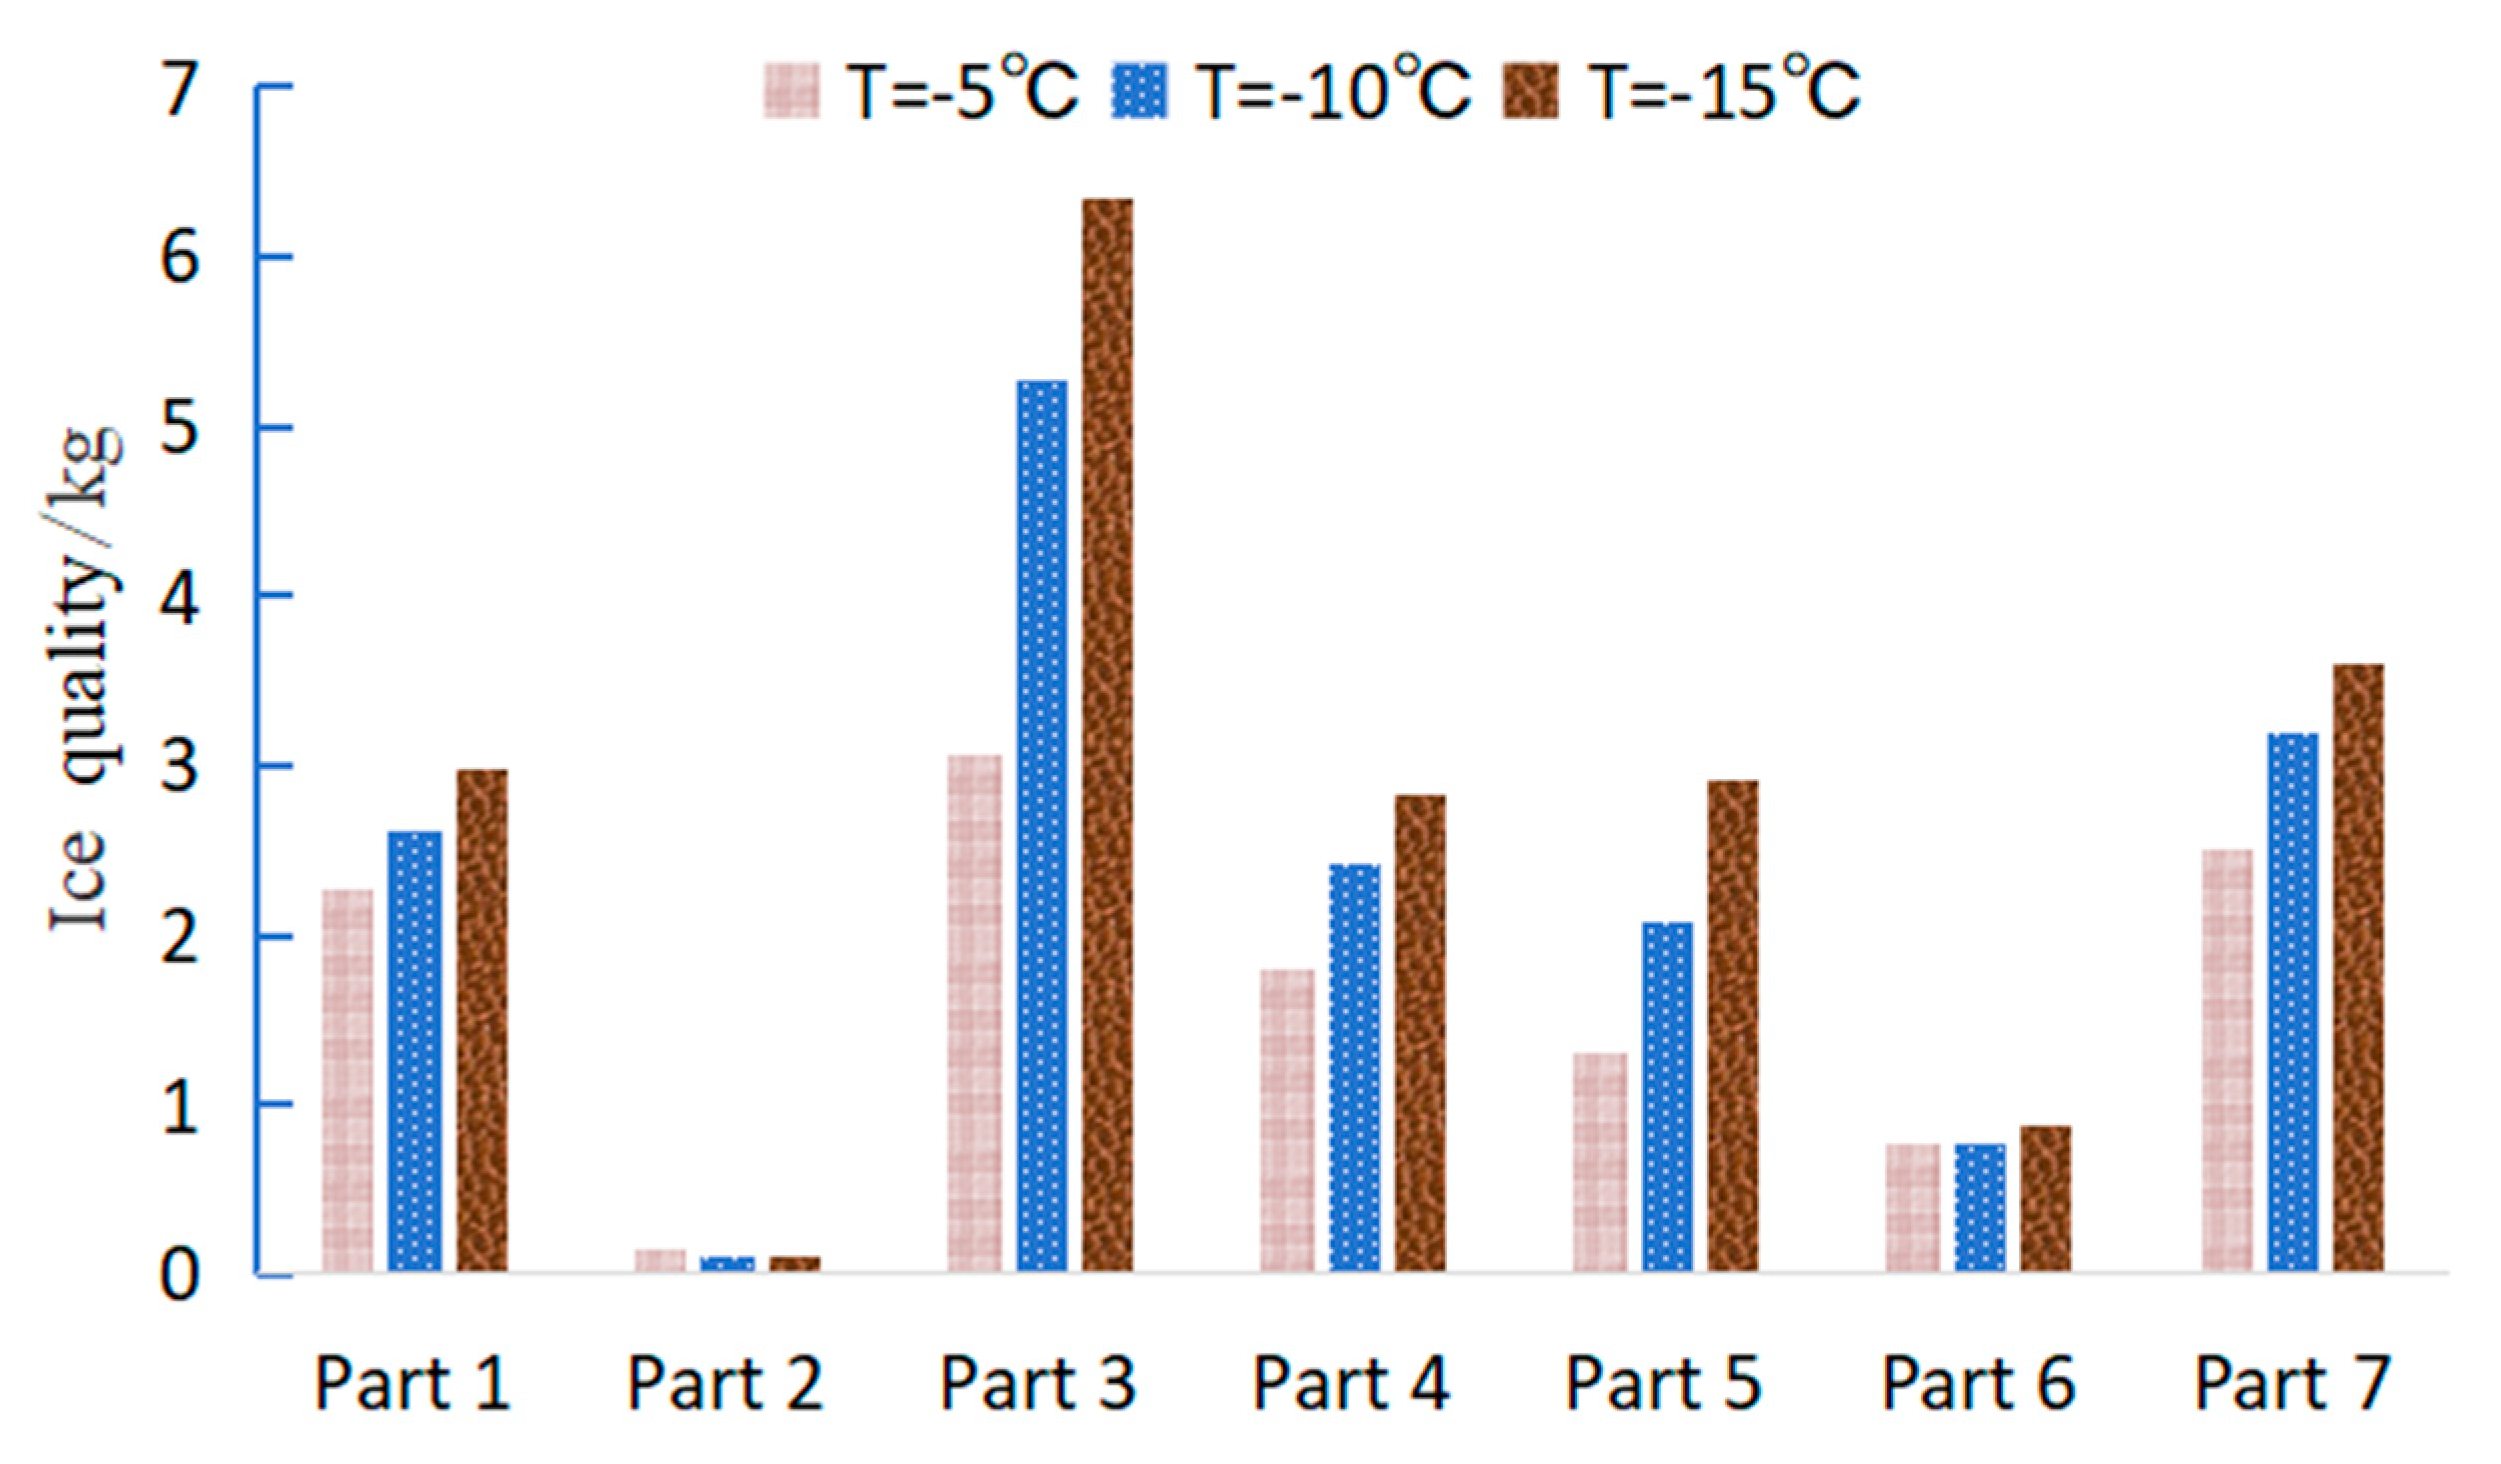
Figure 23: Statistics of pantograph component icing mass at different ambient temperatures.
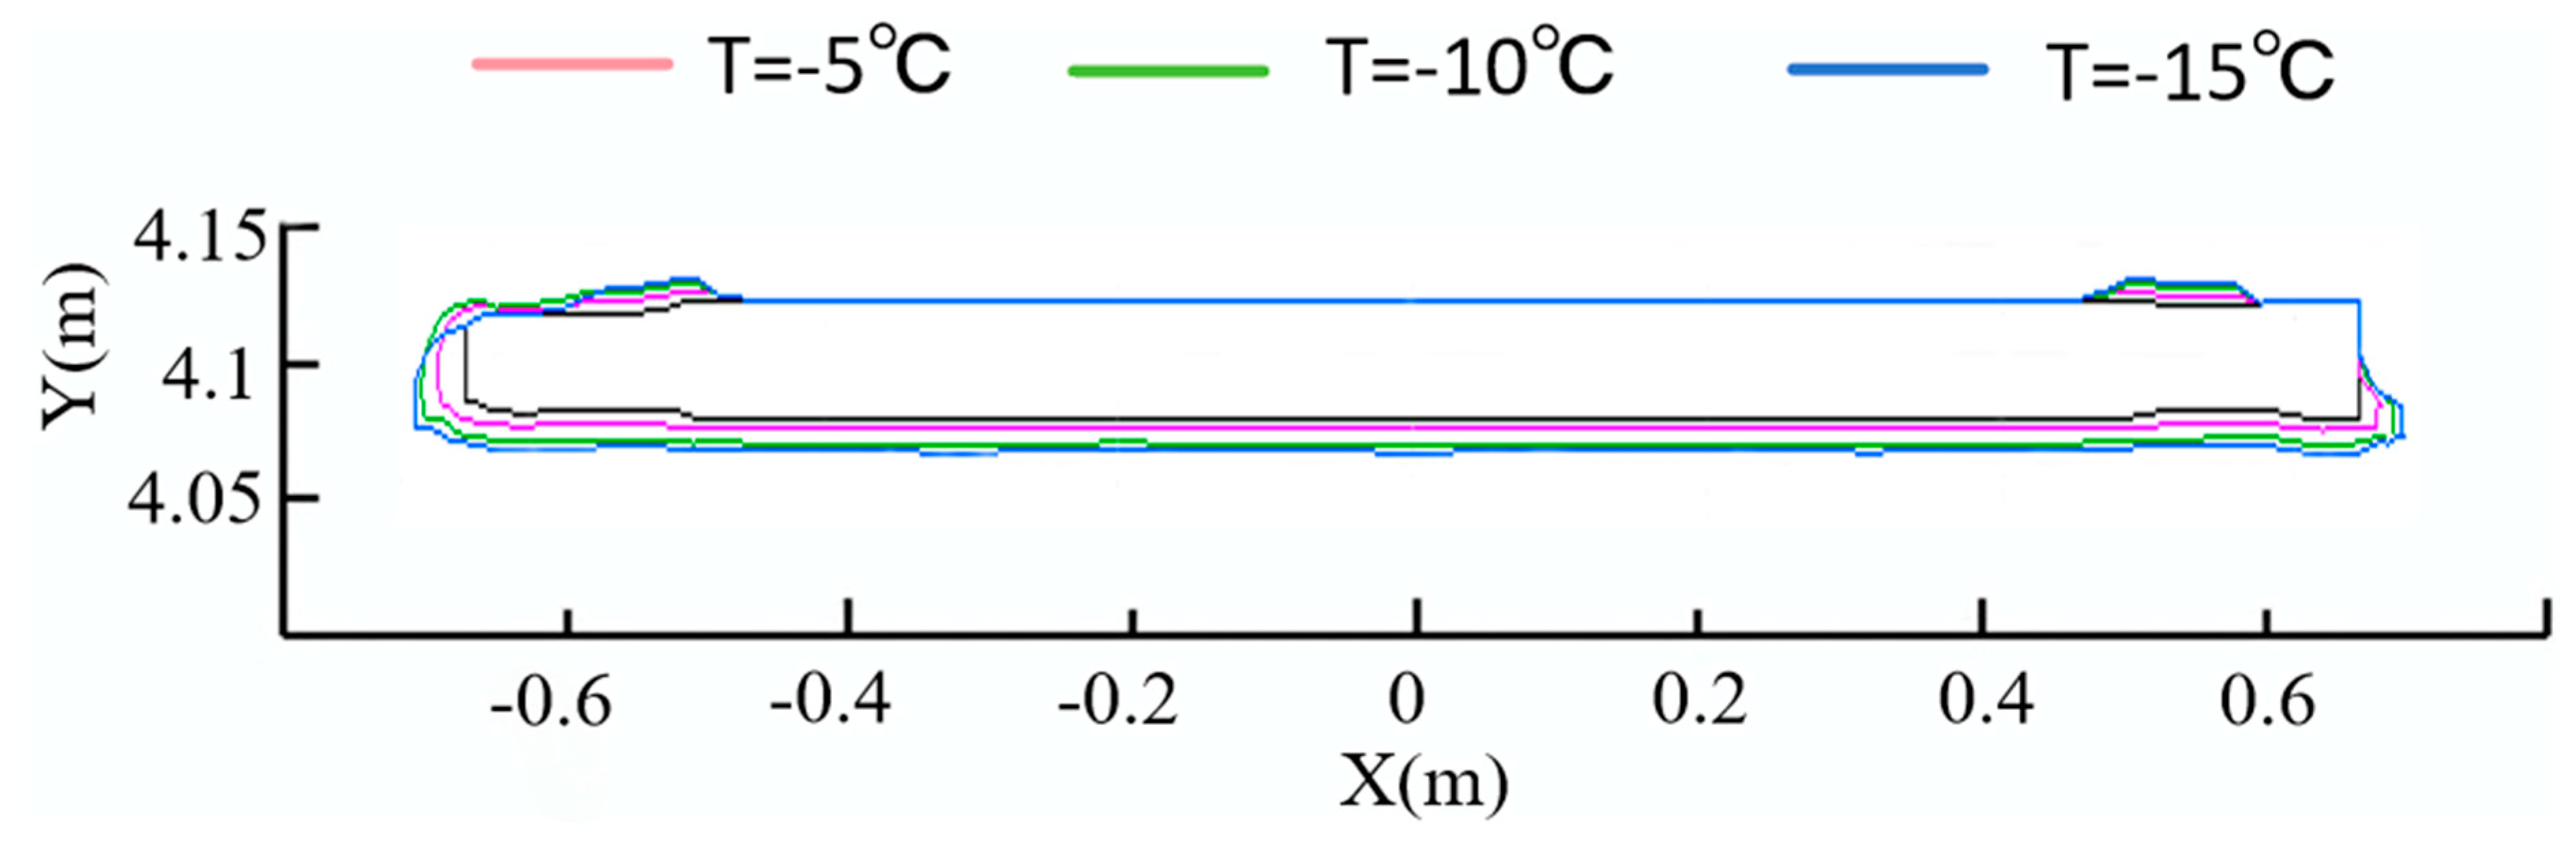
Figure 24: 2D diagram of pantograph head icing under different temperatures.
This study uses the Euler-Euler flow model to analyze the distribution of supercooled droplets in the pantograph region. It focuses on how droplet concentration, diameter, train speed, and ambient temperature affect icing. A glaze-ice model is adopted to investigate ice-accretion characteristics there. The study calculates ice mass under different conditions and draws the following conclusions:
- (1)The ice accretion mass on the pantograph surface increases with higher LWC, with total masses recorded as 7.94 kg, 11.88 kg, 14.13 kg, and 15.47 kg, respectively, showing a gradual rise. Conversely, as droplet diameter increases, the ice mass on the base frame decreases to 3.92 kg, 2.27 kg, and 1.91 kg, while the ice mass on insulators decreases to 2.06 kg, 1.48 kg, and 0.40 kg. Meanwhile, other components exhibit increased ice accretion.
- (2)The icing condition on the pantograph surface is also influenced by train speed. As the speed increases, the icing masses are recorded as 11.88 kg, 13.60 kg, and 15.42 kg, respectively. The total icing mass on the pantograph rises, while the ice accretion rates decrease to 14.48% and 13.38%. This occurs because heightened airflow velocity intensifies shear forces on the ice layer and amplifies thermal resistance effects, thereby restricting rapid ice thickness growth.
- (3)As ambient temperature decreases, the icing mass on the pantograph increases to 11.88 kg, 16.45 kg, and 19.64 kg under three temperature conditions. The lower temperature intensifies the supercooling degree of droplets, accelerating the release rate of latent heat during freezing and thereby augmenting ice accumulation.
- (4)When a train runs in a supercooled environment, the pantograph head is prone to icing, which can affect the train’s power supply. Icing on components like the upper and lower arms can also alter the pantograph’s dynamic performance. To ensure the pantograph operates efficiently and stably in such conditions, it’s crucial to account for the impact of supercooled droplets on icing.
Research indicates that components prone to ice accretion primarily include the pantograph head, upper arm, and lower arm. Based on these findings, when ice forms on the pantograph head, it impedes normal current collection from the overhead line, adversely affecting train operation. Therefore, installing heating de-icing devices on the pantograph head or developing novel anti-icing coatings is recommended. Conversely, ice accumulation on components such as the upper and lower arms may interfere with the pantograph’s normal raising and lowering functions. To ensure reliable train operation, particular attention should be paid to monitoring the pantograph’s lifting pressure to facilitate periodic de-icing of these critical areas.
Acknowledgement:
Funding Statement: Natural Science Foundation of Shandong Province (Grant No. ZR2022ME180), the National Natural Science Foundation of China (Grant No. 51705267).
Author Contributions: The authors confirm contribution to the paper as follows: study conception and design: Xiulong Yao and Mengge Yu; data collection: Xiulong Yao analysis and interpretation of results: Xiulong Yao, Qian Zhang and Jiali Liu; draft manuscript preparation: Xiulong Yao. All authors reviewed the results and approved the final version of the manuscript.
Availability of Data and Materials: The datasets generated during and/or analyzed during the current study are available from the corresponding author on reasonable request.
Ethics Approval: Not applicable.
Conflicts of Interest: The authors declare no conflicts of interest to report regarding the present study.
Nomenclature
| Velocity | |
| Cartesian coordinate components | |
| Time component of air velocity | |
| Density | |
| Pressure | |
| Viscous stress | |
| Reynolds stress | |
| Source item | |
| Turbulent kinetic energy | |
| Fluid dynamic viscosity coefficient | |
| Prandtl number | |
| Constant | |
| Volume fraction | |
| Density of the droplet phase | |
| Velocity of the droplet phase | |
| Stress tensor | |
| Gravitational acceleration | |
| Water film thickness | |
| Flow velocity | |
| Ice nucleation rate | |
| Freezing amount | |
| Evaporation capacity | |
| Specific heat capacity of water | |
| Water film temperature | |
| Specific heat capacity of ice | |
| Free stream temperature | |
| Surface temperature | |
| Liquid water content | |
| Latent heat of fusion | |
| Latent heat of evaporation | |
| Latent heat of sublimation | |
| Convection heat transfer | |
| Condensation heat transfer |
References
1. Zhu W , Liu K , Wang S , Wang M , Liu S . Estimating the functional impacts associated with rainfall-induced hazards for Chinese railway system: fragility, risk and its uncertainty. Nat Hazards. 2024; 120( 11): 9585– 607. doi:10.1007/s11069-024-06578-1. [Google Scholar] [CrossRef]
2. Zabaleta F , Jain SS , Bornhoft BJ , Bose S , Moin P . Large-eddy simulation of supercooled large droplets impingement using a Lagrangian particle approach. In: Proceedings of the AIAA AVIATION Forum and ASCEND 2024; 2024 Jul 29–Aug 2; Las Vegas, NV, USA. doi:10.2514/6.2024-4162. [Google Scholar] [CrossRef]
3. Blake J , Thompson D , Raps D , Strobl T . Simulating the freezing of supercooled water droplets impacting a cooled substrate. AIAA J. 2015; 53( 7): 1725– 39. doi:10.2514/1.j053391. [Google Scholar] [CrossRef]
4. Wang J , Guo R , Zhao N , Zhu C . An experimental investigation of the effect of a supercooled large droplet impingement on freezing behaviour. Aeronaut J. 2025; 129( 1339): 2556– 74. doi:10.1017/aer.2025.29. [Google Scholar] [CrossRef]
5. Lindner M , Wallisch J , Hann R . UAV icing: numerical simulation of icing effects on wing and empennage. Warrendale, PA, USA: SAE; 2023. doi:10.4271/2023-01-1384. [Google Scholar] [CrossRef]
6. Freschi M , Donizetti A , Bellosta T , Guardone A . A two-dimensional multi-step stochastic approach for straight wing ice accretion analyses. In: Proceedings of the AIAA AVIATION Forum and ASCEND 2025; 2025 Jul 21–25; Las Vegas, NV, USA. doi:10.2514/6.2025-3515. [Google Scholar] [CrossRef]
7. Kozelkov A , Galanov N , Semenov I , Zhuchkov R , Strelets D . Computational investigation of the water droplet effects on shapes of ice on airfoils. Aerospace. 2023; 10( 10): 906. doi:10.3390/aerospace10100906. [Google Scholar] [CrossRef]
8. Zhang Y , Wang J , Jiang C , Zhang J , Wang T , Gao G . Investigation of ice and snow accumulations on the bogie areas of high-speed trains using ice wind tunnel experiments. Cold Reg Sci Technol. 2022; 199: 103560. doi:10.1016/j.coldregions.2022.103560. [Google Scholar] [CrossRef]
9. Wang J , Zhang J , Zhang Y , Liang X , Krajnovic S , Gao G . Impact of rotation of wheels and bogie cavity shapes on snow accumulating on the bogies of high-speed trains. Cold Reg Sci Technol. 2019; 159: 58– 70. doi:10.1016/j.coldregions.2018.12.003. [Google Scholar] [CrossRef]
10. Du Z , Yu M , Liu J , Yao X . Analysis of snow distribution and displacement in the bogie region of a high-speed train. Fluid Dyn Mater Process. 2024; 20( 7): 1687– 701. doi:10.32604/fdmp.2024.047315. [Google Scholar] [CrossRef]
11. Clifton A , Lehning M . Improvement and validation of a snow saltation model using wind tunnel measurements. Earth Surf Processes Landf. 2008; 33( 14): 2156– 73. doi:10.1002/esp.1673. [Google Scholar] [CrossRef]
12. Bae J , Shon S , Kwon H , Yee K . Numerical investigation of snow accumulation on a high-speed train by snow saltation. Int J Rail Transp. 2023; 11( 4): 465– 89. doi:10.1080/23248378.2022.2094483. [Google Scholar] [CrossRef]
13. Kim B , Ahn J , Kwon H . A study on a partially-open bogie fairing to improve anti-snow performance of a high-speed train. J Mech Sci Technol. 2023; 37( 4): 1859– 69. doi:10.1007/s12206-023-0324-x. [Google Scholar] [CrossRef]
14. Bruni S , Bucca G , Facchinetti A , Gregori S , Pombo J . Recent developments on pantograph-overhead line interaction. Veh Syst Dyn. 2025; 63( 7): 1358– 94. doi:10.1080/00423114.2025.2484453. [Google Scholar] [CrossRef]
15. Yao Y , Zou D , Wang J , Zhou N , Zhang W . Study on simulation method of pantograph-catenary system considering ice coating. In: Advances in Dynamics of Vehicles on Roads and Tracks: Proceedings of the 26th Symposium of the International Association of Vehicle System Dynamics; 2019 Aug 12–16; Gothenburg, Sweden. doi:10.1007/978-3-030-38077-9_23. [Google Scholar] [CrossRef]
16. Zhang H , Zhu G , Li Z , Huang G , Zeng R . Study on the catenary icing characteristics of high-speed railways under different environments. In: Proceedings of the 19th Annual Conference of China Electrotechnical Society; 2024 Sep 20–22; Xi’an, China. Singapore: Springer Nature Singapore; 2025. p. 473– 81. doi:10.1007/978-981-96-1379-3_49. [Google Scholar] [CrossRef]
17. Lotfi A , Virk MS , Pettersen JA . Atmospheric ice accretion on railway overhead powerline conductors—a numerical case study. Int J Multiphysics. 2023; 17( 3): 253– 67. doi:10.21152/1750-9548.17.3.253. [Google Scholar] [CrossRef]
18. Ohishi F , Murase H , Nanishi K , Kogure H , Hashiba M . New polymer coating for reducing ice and snow damages in railways. In: Progress in pacific polymer science: proceedings of the first pacific polymer conference; 1989 Dec 12–15; Maui, HI, USA. Berlin/Heidelberg, Germany: Springer; 1991. p. 327– 35. doi:10.1007/978-3-642-84115-6_38. [Google Scholar] [CrossRef]
19. Fuhrman DR , Li Y . Instability of the realizable k–ε turbulence model beneath surface waves. Phys Fluids. 2020; 32( 11): 115108. doi:10.1063/5.0029206. [Google Scholar] [CrossRef]
20. Kwiatoń P , Cekus D , Miara M , Kubik-Maciąg I . Multiphase modeling of droplet fall using Euler-Euler approach. Acta Phys Pol A. 2020; 138( 2): 276– 9. doi:10.12693/aphyspola.138.276. [Google Scholar] [CrossRef]
21. Li Y . Advanced heat transfer. 1st ed. Beijing, China: Science Press; 2023. [Google Scholar]
22. Lan H , Zhang J , Cai L , Lou Z . Reserch on the impact of ice parameters on the icing of bogie region. J Mech Eng. 2025; 61: 1– 9. (In Chinese). [Google Scholar]
23. Wright W . Validation results for LEWICE 3.0. In: Proceedings of the 43rd AIAA Aerospace Sciences Meeting and Exhibit; 2005 Jan 10–13; Reno, NV, USA. doi:10.2514/6.2005-1243. [Google Scholar] [CrossRef]
24. Vargas M , Reshotko E . LWC and temperature effects on ice accretion formation on swept wings at glaze ice conditions. In: Proceedings of the 38th Aerospace Sciences Meeting and Exhibit; 2000 Jan 10–13; Reno, NV, USA. doi:10.2514/6.2000-483. [Google Scholar] [CrossRef]
25. Zhang Z , Zhao H , Zhu D , Dai H , Wang Z . Experimental study on the icing of rotating intake cones in wind tunnels under supercooled large-droplet conditions. Aerospace. 2025; 12( 5): 384. doi:10.3390/aerospace12050384. [Google Scholar] [CrossRef]
26. Politovich MK . Aircraft icing caused by large supercooled droplets. J Appl Meteor. 1989; 28( 9): 856– 68. doi:10.1175/1520-0450(1989)028<0856:AICBLS>2.0.CO;2. [Google Scholar] [CrossRef]
27. Rashidi MM , Hajipour A , Li T , Yang Z , Li Q . A review of recent studies on simulations for flow around high-speed trains. J Appl Comput Mech. 2019; 5( 2): 311– 33. [Google Scholar]
28. Li Z . Study on climate change in Southwestern China. Berlin/Heidelberg, Germany: Springer; 2014. doi:10.1007/978-3-662-44742-0. [Google Scholar] [CrossRef]
29. Salcher P , Pradlwarter H , Adam C . Reliability assessment of railway bridges subjected to high-speed trains considering the effects of seasonal temperature changes. Eng Struct. 2016; 126: 712– 24. doi:10.1016/j.engstruct.2016.08.017. [Google Scholar] [CrossRef]
Cite This Article
 Copyright © 2025 The Author(s). Published by Tech Science Press.
This work is licensed under a Creative Commons Attribution 4.0 International License , which permits unrestricted use, distribution, and reproduction in any medium, provided the original work is properly cited.
 Downloads
 Citation Tools