
 Submit a Paper
 Propose a Special lssue
 Open Access
ARTICLE

Effect of Salinity on Imbibition-Based Oil Production
1 School of Petroleum Engineering, Xi’an Shiyou University, Xi’an, 710065, China
2 College of Carbon Neutrality Future Technology, China University of Petroleum, Beijing, 102249, China
3 The Third Gas Production Plant of PetroChina Changqing Oilfield Branch, Wushenqi, Ordos, 017000, China
* Corresponding Author: Yueqi Cui. Email:
(This article belongs to the Special Issue: Subsurface Fluid Flow Dynamics and Applications in Carbon Reduction Technologies)
Fluid Dynamics & Materials Processing 2025, 21(11), 2815-2828. https://doi.org/10.32604/fdmp.2025.073775
Received 25 September 2025; Accepted 06 November 2025; Issue published 01 December 2025
 View Full Text
 Download PDF
Abstract
This study explores the impact of salinity on fluid replacement during imbibition-driven oil recovery through a series of core self-imbibition experiments. By integrating key parameters such as interfacial tension, contact angle, and oil displacement efficiency, we systematically examine how variations in salinity level, ion type, and ion concentration affect the imbibition process. The results demonstrate that the salinity of the injected fluid exerts a strong influence on the rate and extent of oil recovery. Compared with high-salinity conditions, low-salinity injection, particularly below 5000 mg·L−1, induces pronounced fluctuations in the replacement rate, achieving the highest recovery at approximately 1000 mg·L−1. The interplay between interfacial tension and displacement efficiency is jointly governed by both ion type and concentration. Moreover, changes in ionic composition can alter rock wettability from oil-wet toward water-wet states, thereby enhancing imbibition efficiency. Among the tested ions, Mg2+ and SO42− at low concentrations were found to be especially effective in promoting oil displacement.Keywords
With the increasing depletion of conventional oil and gas resources, the efficient development of unconventional reservoirs such as low-permeability and tight reservoirs has become a major challenge facing the global oil and gas industry [1,2,3,4]. Unconventional reservoirs are characterized by low permeability, complex geological structures, and high development costs, making the development of efficient, economical, and environmentally friendly enhanced recovery technologies particularly crucial [5,6]. Low-salinity water flooding technology has garnered widespread attention as an economical and efficient method for enhancing recovery [7,8,9]. Low-salinity water flooding technology has garnered significant attention as a cost-effective method for enhancing oil recovery. Compared to traditional high-salinity brine, extensive core displacement and imbibition experiments demonstrate that injecting low-salinity water can substantially improve crude oil recovery rates through complex mechanisms. These include altering rock surface properties and reversing wettability (shifting from oil-wet to water-wet conditions) [10,11,12,13]. Al-Saedi et al. [14] investigated the mechanism of enhanced oil recovery in sandstone reservoirs using low-salinity water flooding through laboratory experiments. Their analysis indicates that low-salinity water flooding can achieve higher recovery rates even in the absence of clay; Xu et al. [15] investigated the effect of low-salinity water on recovery in low-permeability cores through core displacement experiments and contact angle measurements. Results indicate that reducing injection water salinity from 10,000 mg·L−1 to 5000 mg·L−1 enhances recovery and transforms the reservoir into a hydrophilic state; Bijani et al. [16] by varying the dilution levels of seawater concentration, the study examined the impact of key factors on the performance and efficiency of low-salinity water systems; Saeedi Dehaghani et al. [17]; Kakati et al. [18]; Hou et al. [19]; Saw et al. [20] analyzed the effect of key ionic components in injection water on rock surface wettability. The results indicate that different ion types and ion concentration exert varying influences on rock wettability; Meng et al. [21]; Shahrabadi et al. [22] conducted tests on enhanced recovery through imbibition using nuclear magnetic resonance technology, contributing to research on enhancing recovery rates by understanding the imbibition behavior in unconventional reservoirs; Takeda et al. [23]; Yan et al. [24] demonstrated through experiments that the potential semipermeability of reservoir rocks containing crude oil and saline water can cause chemical osmosis upon exposure to the change in salinity difference; Roldán-Carrillo et al. [25]; Dabiri et al. [26]; Shi et al. [27] investigated the synergistic effect of low-salinity water and surfactant mixtures on enhancing oil recovery by injecting low-salinity water. The results demonstrated that the low-salinity water-surfactant mixture system significantly improves heavy oil recovery. Low-salinity waterflooding relies on specific ion types, ion concentrations, and their synergistic effects within the water. Currently, there remains no consensus on which ion combinations at what ion concentrations can most effectively optimize interfacial tension and wettability to achieve the highest recovery. This study focuses on low-permeability sandstone reservoirs. Building upon existing comparative research under high-and low-salinity conditions, it further refines the continuous impact of salinity reduction from 50,000 mg·L−1 to 1000 mg·L−1 on oil recovery efficiency. The research independently analyzes the influence of each key ion type and ion concentration, laying a theoretical foundation for the practical application of low-salinity waterflooding technology.
2 Experimental Materials and Methods
2.1 Experimental Apparatus and Materials
Materials: ① Sandstone core. Sandstone cores were used for self-imbibition experiments, with dimensions of approximately 4.80 cm in length and 2.50 cm in diameter. ② Crude oil. All cores utilized the same crude oil with a density of 0.8 g·cm−3 and viscosity of 1.87 mPa·s. ③ Simulated formation water. Distilled water was used to prepare experimental brines of varying salinity levels as the aqueous phase for core imbibition experiments.
Equipment: Core Evacuation and Pressure Saturation Apparatus; QTS-2 Gas Permeability Tester; KXD-2 Gas Porosity Tester; SDT-KRUSS Rotating Drop Interfacial Tension Tester; JC2000D Contact Angle Tester; Drying Oven; High-Precision Electronic Balance; Beaker.
2.2 Experimental Lithological Analysis
The results of gas measurement for porosity and permeability of the core samples are shown in Table 1. Analysis of the data reveals: the maximum porosity was 11.35%, the minimum porosity was 5.030%, and the average porosity was 8.19%; The maximum permeability was 0.61 mD, the minimum was 0.10 mD, and the average permeability was 0.22 mD, classifying it as a medium-pore, very low to ultra-low permeability reservoir (Table 1).
Table 1: Porosity and permeability test results.
| Core Number | Dry Weight/g | Saturated Oil Weight/g | Length/cm | Diameter/cm | Gas Porosity (%) | Gas Permeability/(mD) |
|---|---|---|---|---|---|---|
| 1 | 62.01 | 63.51 | 4.8 | 2.50 | 7.99 | 0.14 |
| 2 | 59.73 | 61.53 | 4.8 | 2.50 | 9.55 | 0.14 |
| 3 | 61.09 | 62.69 | 4.8 | 2.50 | 8.48 | 0.16 |
| 4 | 59.82 | 61.94 | 4.8 | 2.50 | 8.62 | 0.17 |
| 5 | 64.64 | 65.72 | 4.8 | 2.50 | 9.57 | 0.49 |
| 6 | 58.25 | 60.06 | 4.8 | 2.50 | 9.60 | 0.21 |
| 7 | 58.96 | 61.14 | 4.8 | 2.50 | 10.20 | 0.41 |
| 8 | 58.07 | 60.22 | 4.8 | 2.50 | 7.49 | 0.14 |
| 9 | 59.53 | 61.68 | 4.8 | 2.50 | 7.58 | 0.14 |
| 10 | 61.69 | 63.13 | 4.8 | 2.50 | 7.66 | 0.25 |
| 11 | 58.76 | 60.36 | 4.8 | 2.50 | 8.48 | 0.16 |
| 12 | 61.63 | 62.94 | 4.8 | 2.50 | 6.96 | 0.14 |
| 13 | 63.77 | 64.71 | 4.8 | 2.50 | 5.03 | 0.12 |
| 14 | 54.22 | 54.72 | 4.8 | 2.50 | 6.74 | 0.10 |
| 15 | 60.95 | 62.19 | 4.8 | 2.50 | 6.56 | 0.10 |
| 16 | 61.56 | 62.73 | 4.8 | 2.50 | 6.21 | 0.10 |
| 17 | 57.80 | 59.42 | 4.8 | 2.50 | 8.56 | 0.16 |
| 18 | 60.99 | 62.81 | 4.8 | 2.50 | 8.03 | 0.14 |
| 19 | 58.86 | 60.21 | 4.8 | 2.50 | 11.35 | 0.59 |
| 20 | 63.68 | 64.55 | 4.8 | 2.50 | 9.12 | 0.61 |
Correlation Analysis: The correlation coefficient between porosity and permeability is 0.5946, indicating that there is a moderate positive correlation between them. Porosity and permeability exhibit an exponential relationship: φ = 0.0206ln(K) + 0.1159 (Fig. 1).
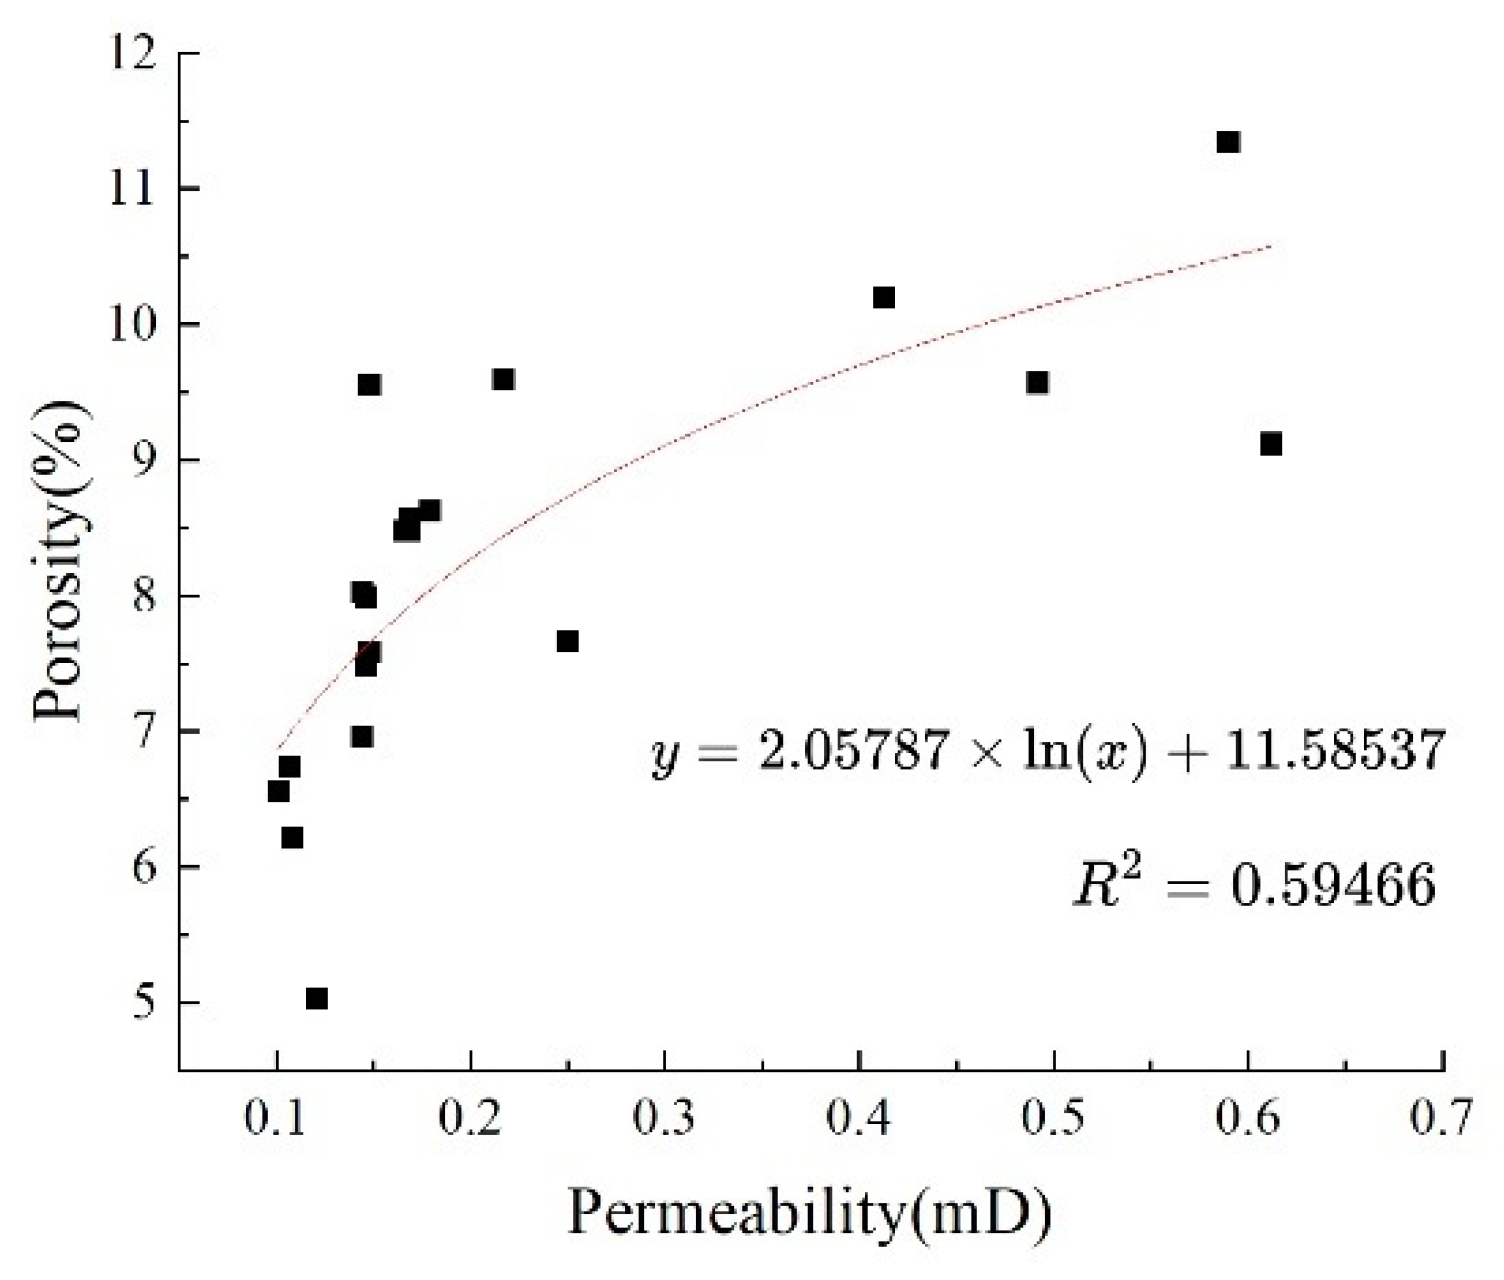
Figure 1: Correlation between permeability and porosity.
2.3 Evaluation of Lithological Analysis Results
Porosity and permeability are two key parameters for evaluating the reservoir capacity of rock and the fluid mobility within it. Porosity represents the proportion of space in reservoir rock not occupied by solid particles, influencing seepage characteristics; while permeability serves as an indicator of a reservoir rock’s ability to allow fluid passage, making it crucial for assessing reservoir fluidity. Based on the aforementioned lithological analysis, the core samples used in this experiment are low-permeability cores, which are highly significant for simulating actual low-permeability reservoir conditions.
The experimental flowchart is shown in Fig. 2. When investigating key ion interactions, the total salinity of the salt solution is fixed at 1000 mg·L−1. The ion concentration of key ions (using K+ as an example) is controlled by adjusting the mass ratio of KCl to NaCl. For instance, 0.2 KCl indicates that 20% of the solute is KCl, while 0.4 KCl indicates 40% KCl and 60% NaCl in the solute.
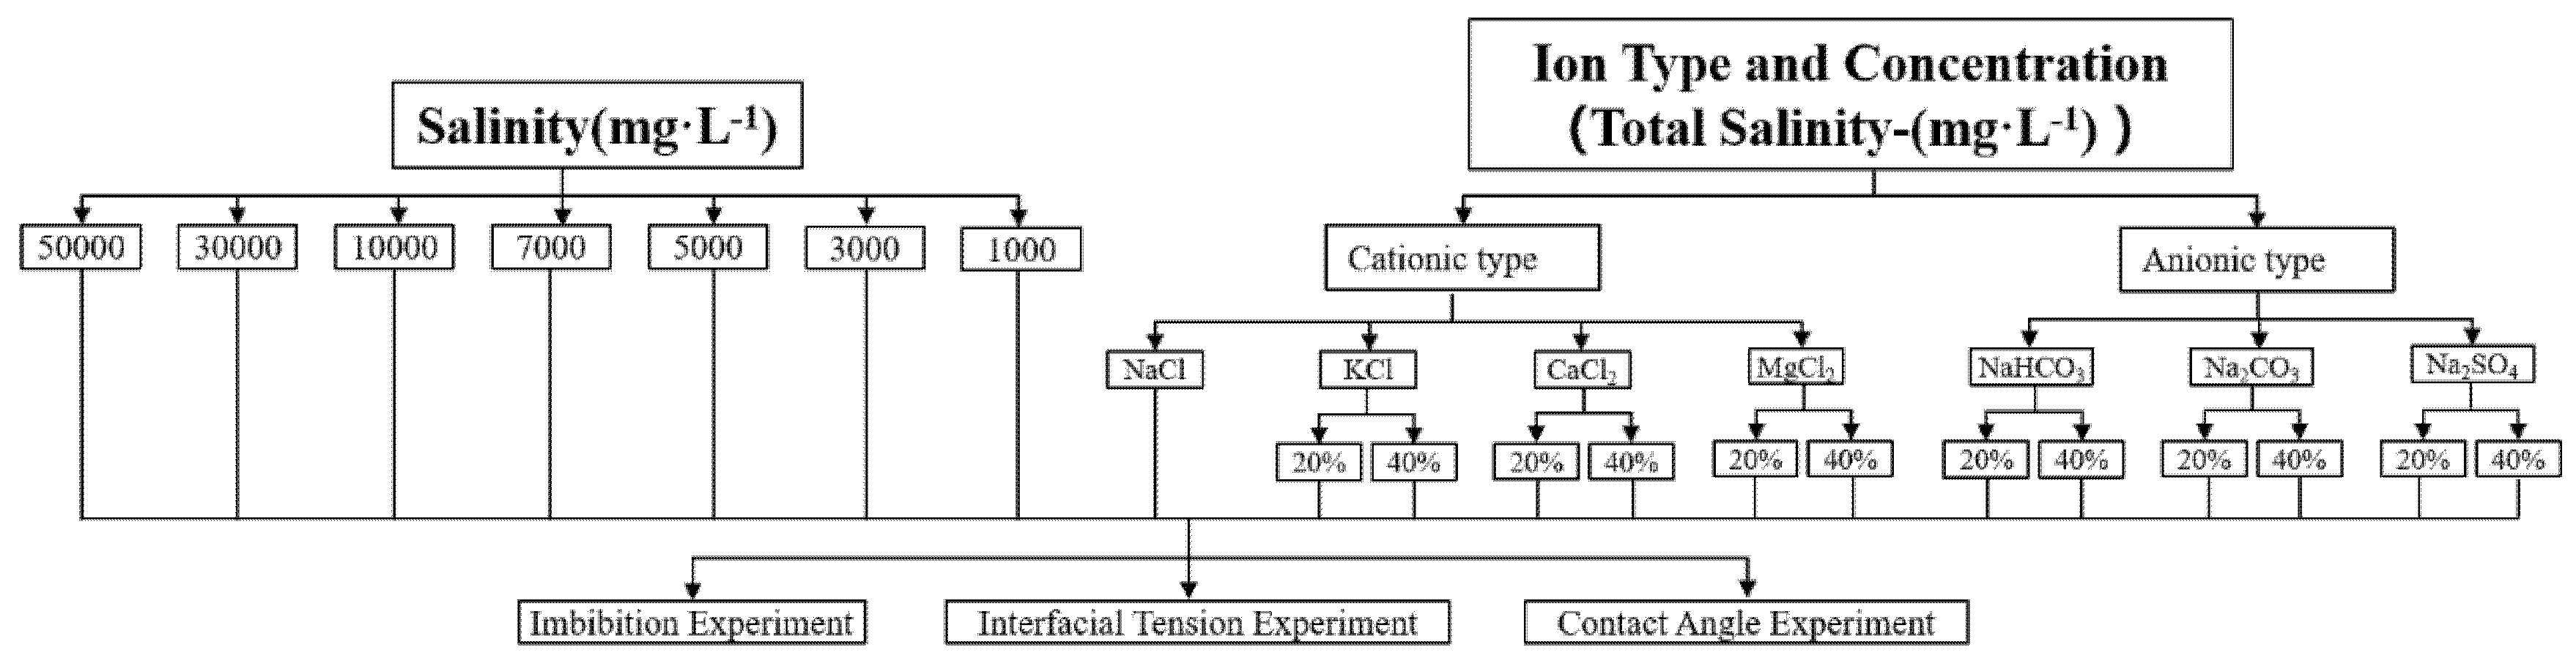
Figure 2: Experimental flowchart.
Rock cores were saturated by vacuum-pressurization using 99.99% pure nitrogen as the working medium. Gas permeability and porosity values were measured using a QTS-2 gas permeability tester and a KXD-2 gas porosity tester.
Natural reservoir cores were degreased, dried, and evacuated. Saturated standard cores were suspended beneath a high-precision electronic balance, fully immersed in aqueous solutions of varying salinity levels, ion compositions, and ion concentration without contacting the beaker base (Fig. 3). The spontaneous water absorption process was continuously recorded by monitoring real-time mass changes on the balance. To systematically investigate the continuous influence of injected water salinity on imbibition behavior, the salinity levels of the injected water in this study were set at 50,000 mg·L−1, 30,000 mg·L−1, 10,000 mg·L−1, 7000 mg·L−1, 5000 mg·L−1, 3000 mg·L−1, and 1000 mg·L−1 were used for rock core imbibition experiments, with each group replicated twice, and the final results were averaged to minimize error. During the experiments, a thermostatically controlled sealed container maintained ambient temperature, and an anti-evaporation oil layer was applied to minimize interference. The crude oil replacement rate from the self-permeation imbibition tests was analyzed using replacement rate versus time curves.
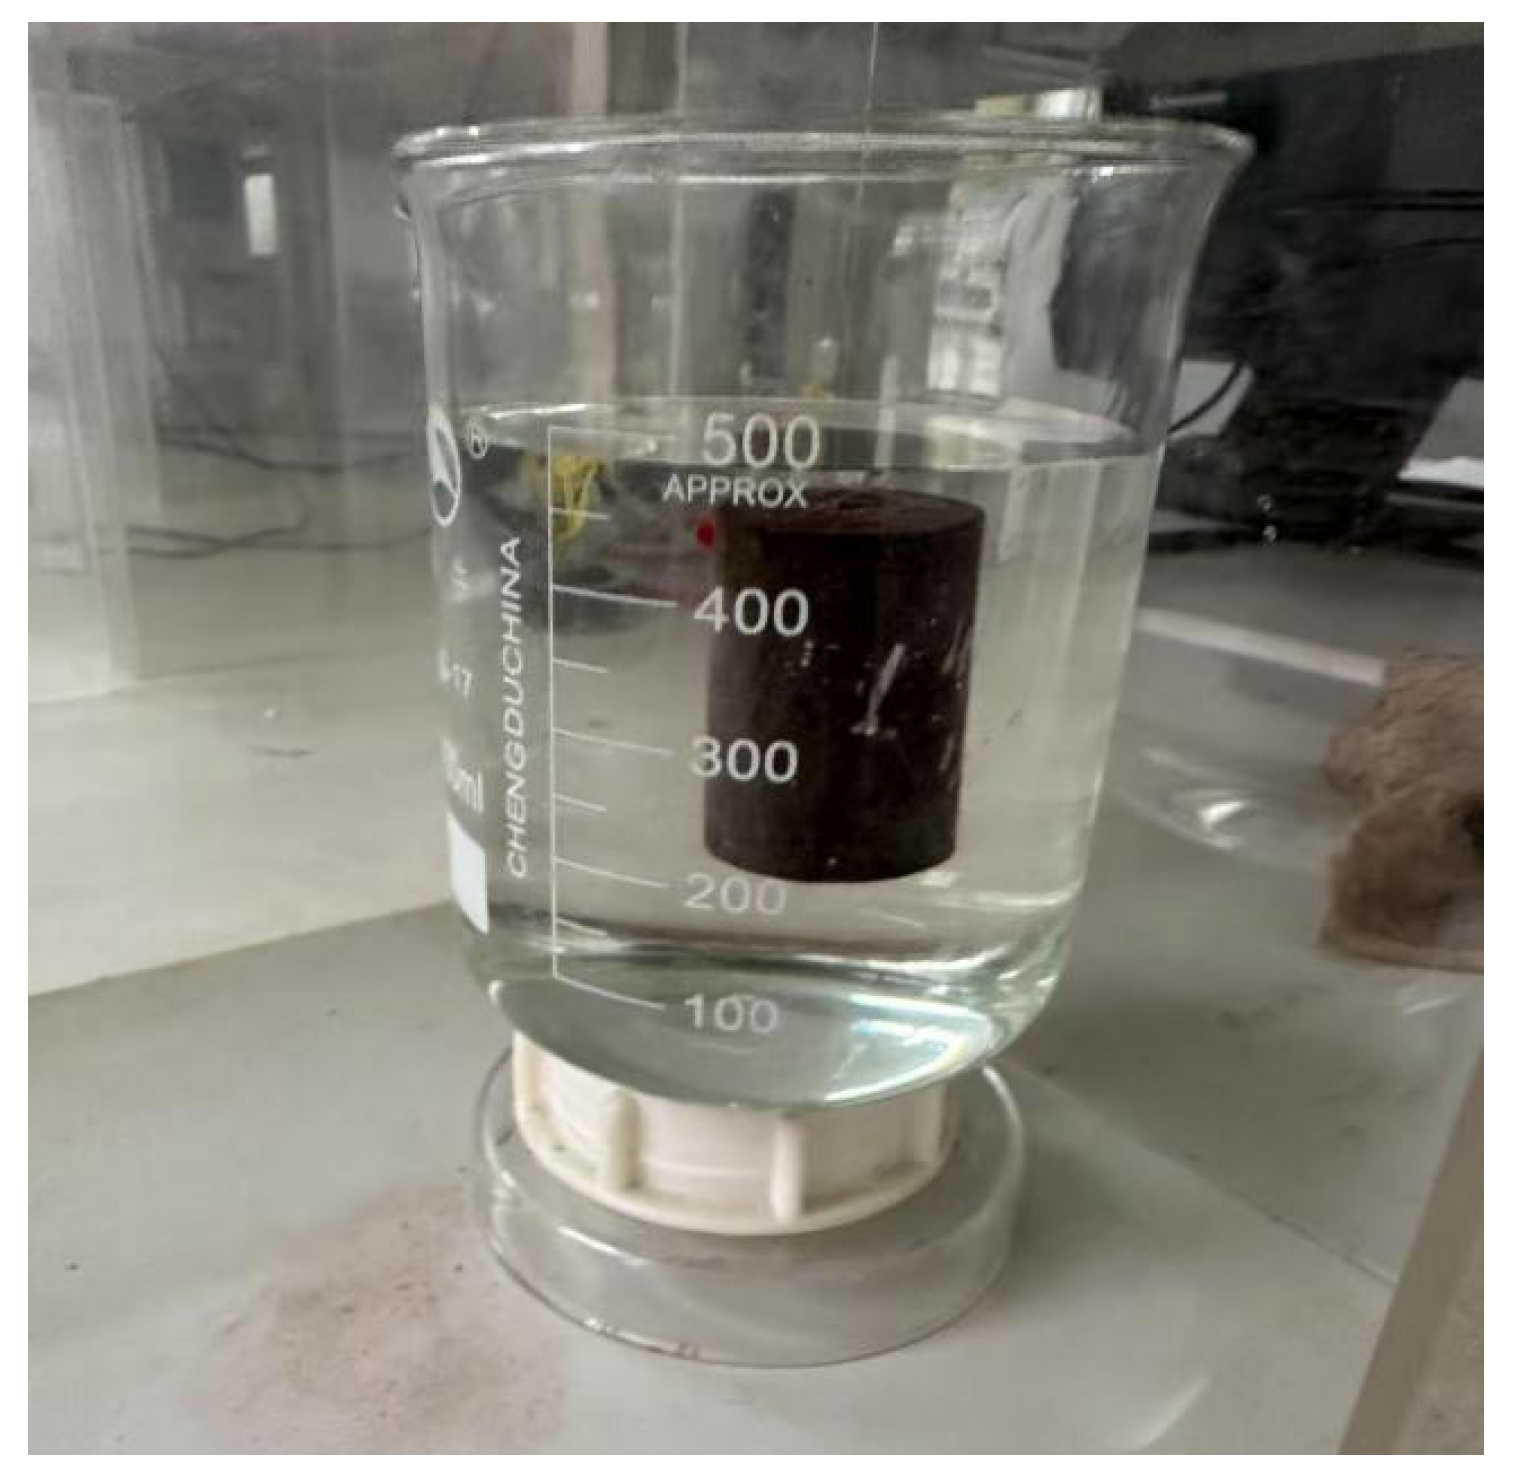
Figure 3: Physical experiment diagram of core imbibition experiment.
2.4.2 Interfacial Tension Experiment
At room temperature, the interfacial tension between aqueous solutions of varying salinity levels and ion concentration and reservoir crude oil was measured using an SDT-KRUSS rotary drop interfacial tension tester (Fig. 4). The density difference between the oil and water phases was 0.2 g·cm−3. Using a micro syringe, 1–2 μL of oil was drawn and injected into the center of the capillary tube. The tube was placed in the instrument, and the sample chamber temperature was stabilized at 30°C. Activate the temperature control system to ensure constant temperature throughout the experiment, eliminating the influence of temperature fluctuations. Set the rotation speed to 5000 r/min. Record data at 3-min intervals. Each experimental run lasted 30 min. At least three measurements were taken for each sample group, and the average value was recorded.
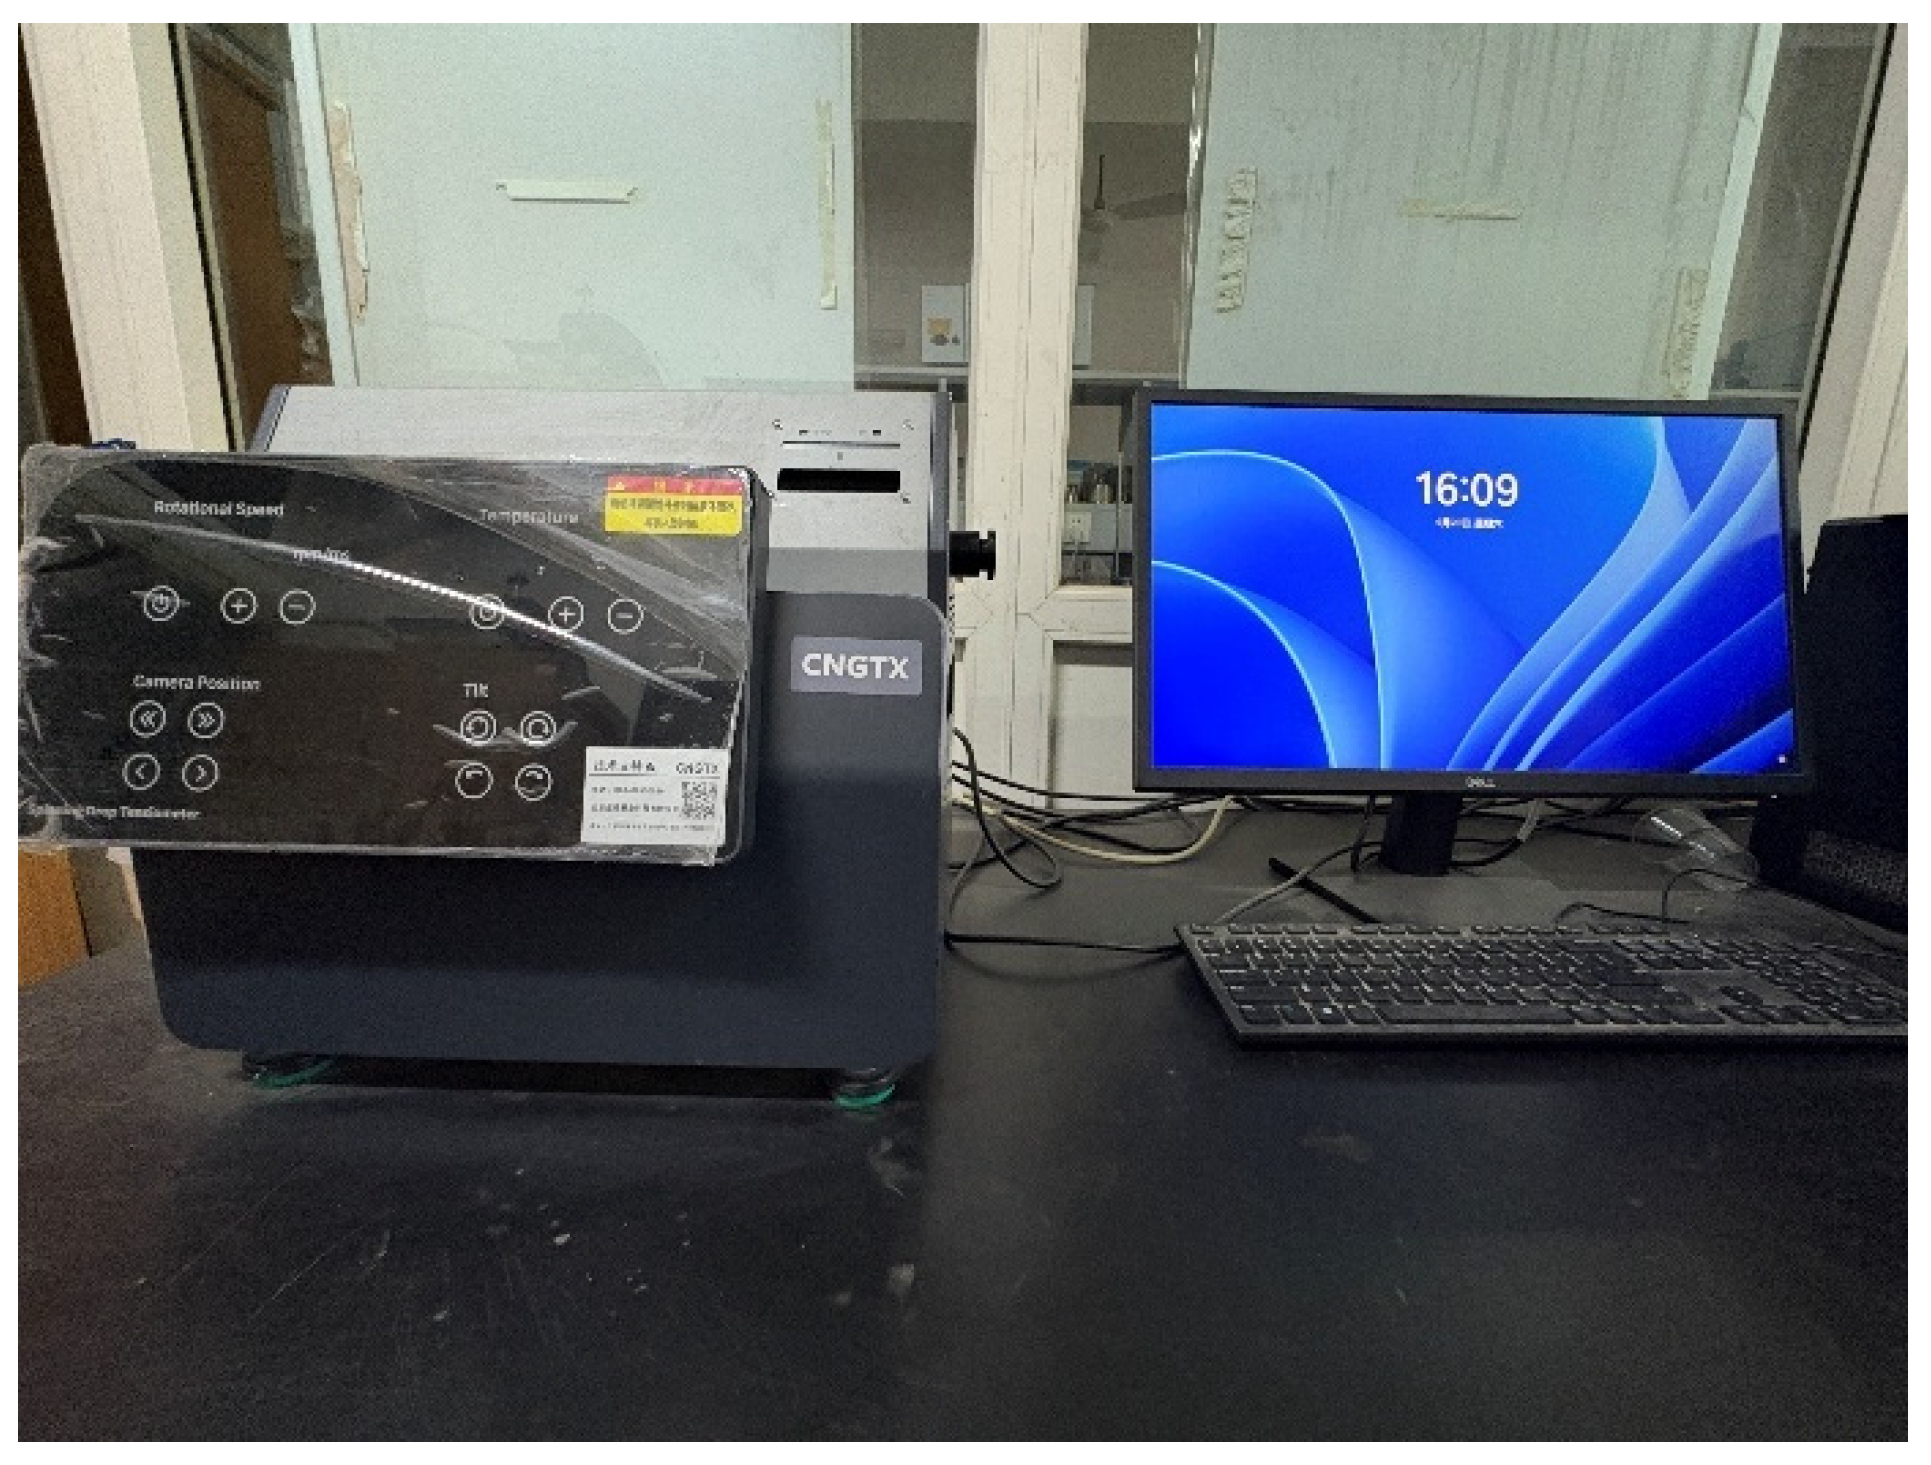
Figure 4: Interfacial tension tester.
2.4.3 Contact Angle Experiment
Contact angle measurements were performed using a contact angle measuring instrument with the static sessile drop method (Fig. 5). Glass slides were cut to appropriate dimensions, immersed in crude oil containers, and placed in a 70°C water bath for aging. After 5 days of aging, the initial contact angle was measured. Subsequently, the slides were immersed in each solution for 50 h, and the contact angle was measured. Each experimental group underwent repeated measurements, and the average value was calculated to ensure the accuracy of the experimental results.
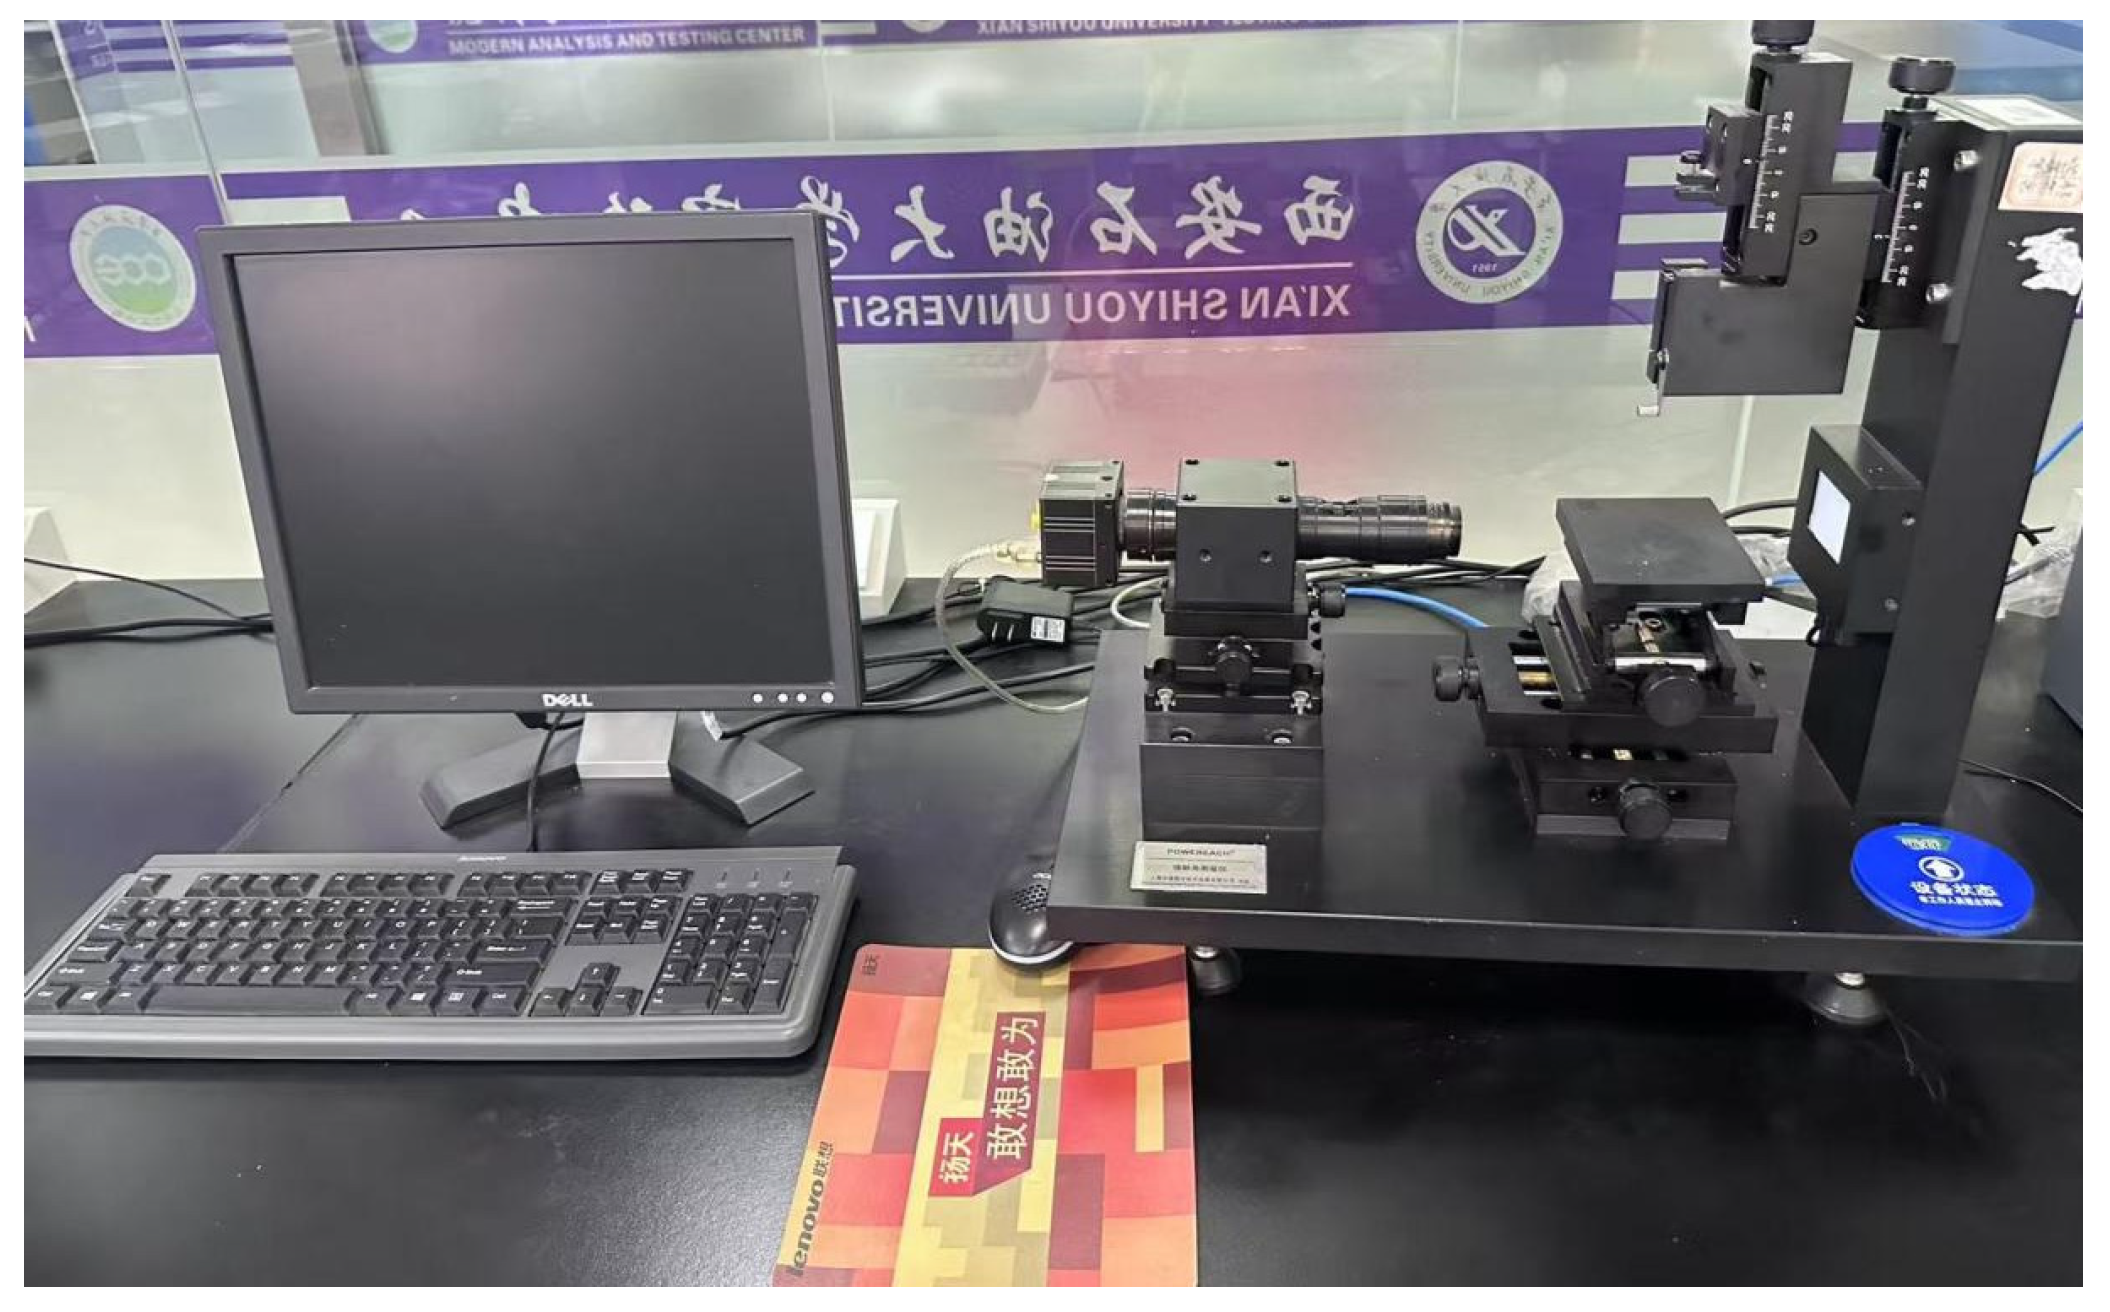
Figure 5: Contact angle measuring instrument.
3 Effect of Salinity on Wettability
3.1 Effect of Salinity on Imbibition Oil Recovery
Under identical conditions, cores that have undergone vacuum treatment and reached a saturated oil state serve as experimental specimens. The objective is to minimize any physical property changes or chemical composition alterations that could potentially affect the final experimental results due to external factors throughout the entire experimental process. This ensures that the experimental outcomes accurately and reliably reflect the actual effectiveness of low-salinity brine in enhancing fluid replacement rates.
In the experimental design, formation water with varying degrees of salinity was selected as the experimental medium. Specifically, concentrations of 50,000 mg·L−1, 30,000 mg·L−1, 10,000 mg·L−1, 7000 mg·L−1, 5000 mg·L−1, 3000 mg·L−1, and 1000 mg·L−1. Seven water samples were used for the core’s imbibition experiment. This series of salinities was selected to comprehensively cover potential geological conditions, enabling more accurate assessment of low-salinity brine efficacy under varying scenarios. To further enhance the accuracy and reliability of the experimental results, a replication strategy was adopted. For each experimental condition, two independent experimental runs were conducted. In the final data analysis, the average of these two sets of results was taken as the definitive data for that condition. This approach effectively minimized the impact of random errors on the experimental outcomes. Through the aforementioned experimental process, curves depicting the evolution of fluid replacement rates over time under varying salinity conditions were successfully obtained (Fig. 6).
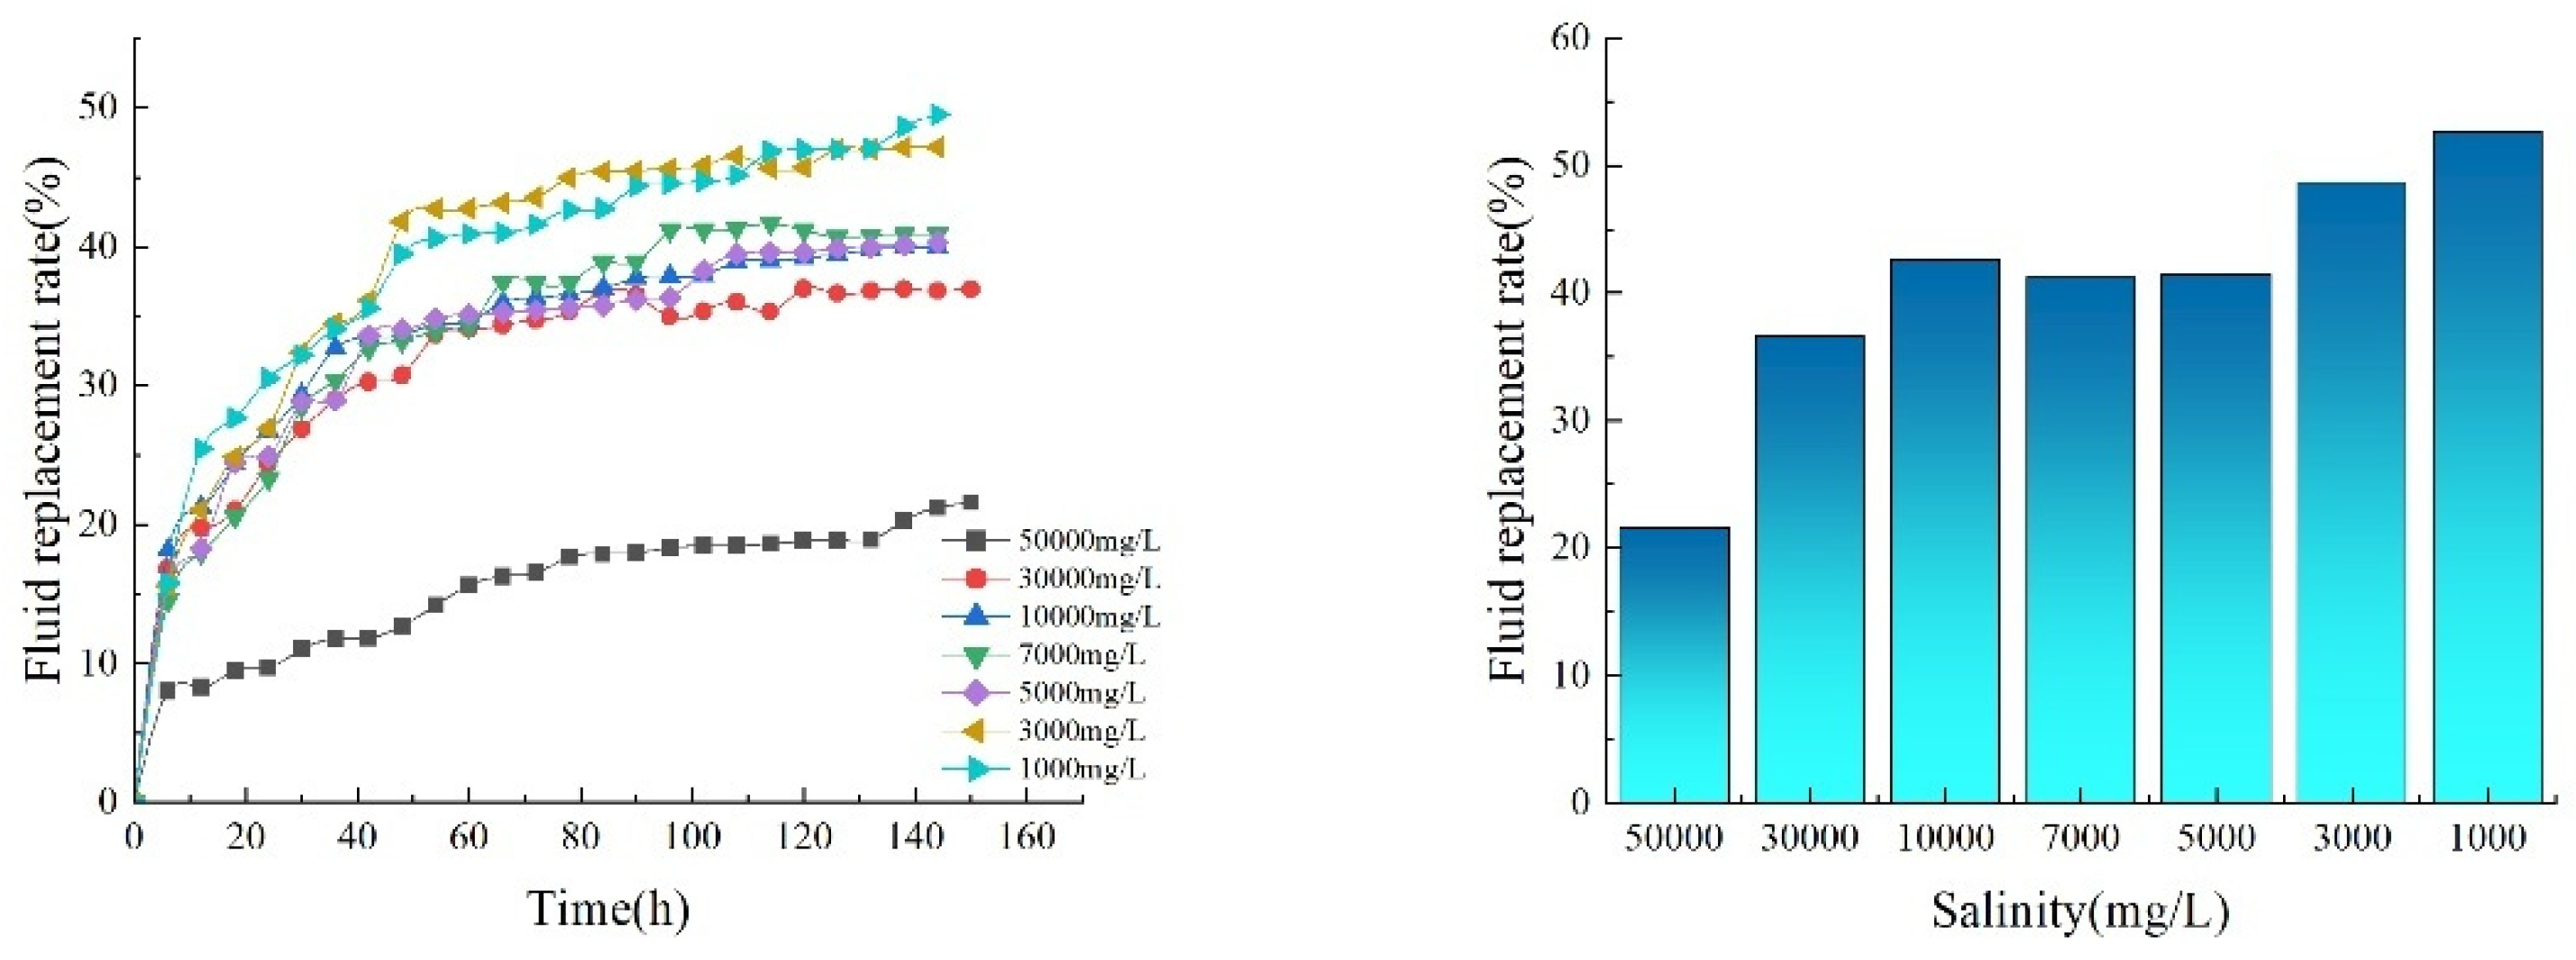
Figure 6: Comparison of fluid replacement rates under different salinity conditions.
By comparing fluid replacement rates under different salinity levels, the following conclusions were drawn: Low salinity significantly enhances fluid replacement in imbibition-driven oil recovery, with core imbibition completing its reaction around day 4. Low-salinity system (<5000 ppm): The rate surged sharply within the initial 5–10 h of reaction, exhibiting a significantly steeper slope than the high-salinity group. This phase was dominated by ion exchange, where low-salinity water replaced high-valent cations adsorbed on the rock surface, triggering expansion of the double electric layer thickness and enhancing the negative charge on the rock surface. This led to rapid contraction of the three-phase contact line between crude oil, water, and rock. High-salinity systems (>10,000 ppm): The rate increases gradually and then exhibits exponential decay, indicating that the compressive effect of high-valent cations on the double electric layer suppresses wettability reversal. Under conditions of 50,000, 30,000, 10,000, 7000, 5000, 3000, and 1000 mg·L−1, crude oil fluid replacement rates were 21.62%, 36.62%, 42.59%, 41.22%, 41.47%, 48.64%, and 52.66%, respectively. The fluid replacement rate at 1000 mg·L−1 was significantly higher than that at 50,000 mg·L−1, indicating that as the salinity of the brine further decreased, the core fluid replacement rate increased. When the salinity was reduced to 1000 mg·L−1, the final core fluid replacement rate reached 52.66%. The experimental results above demonstrate that low-salinity injection water holds potential for enhancing fluid replacement rates. Specifically, adjusting formation water salinity can significantly improve crude oil replacement efficiency.
The salinityof brine by imbibition for core samples was uniformly set at 1000 mg·L−1, ensuring consistent experimental salinity levels. A 1000 mg·L−1 NaCl solution was also prepared as a control group. Comparisons were made between solutions with identical salinity but differing ionic compositions (K+, Ca2+, Mg2+, HCO3−, CO32−, SO42−) and between solutions sharing the same salinity but varying ion concentrations. The resulting fluid replacement rate versus time curves for each ion type and concentration at the same salinity are shown in the figure. Significant differences in the final fluid replacement rate were observed during the core’s imbibition process.
Compared to a 1000 mg·L−1 NaCl solution, adding 0.2 mol K+, 0.2 mol Ca2+, 0.2 mol Mg2+, 0.2 mol HCO3−, 0.2 mol CO32−, and 0.2 mol SO42− at the same salinity significantly increased the core self-percolation fluid displacement rate significantly increased the fluid replacement rate in the core. When 0.2 mol K+ was added to the imbibition solution, the final fluid replacement rate in the core reached 42.66%. When 0.2 mol Mg2+ was added to the imbibition solution, the final fluid replacement rate in the core reached 68.38%. When 0.2 mol Ca2+ was added to the imbibition solution, the final fluid replacement rate of the core was 40.71% (Fig. 7).
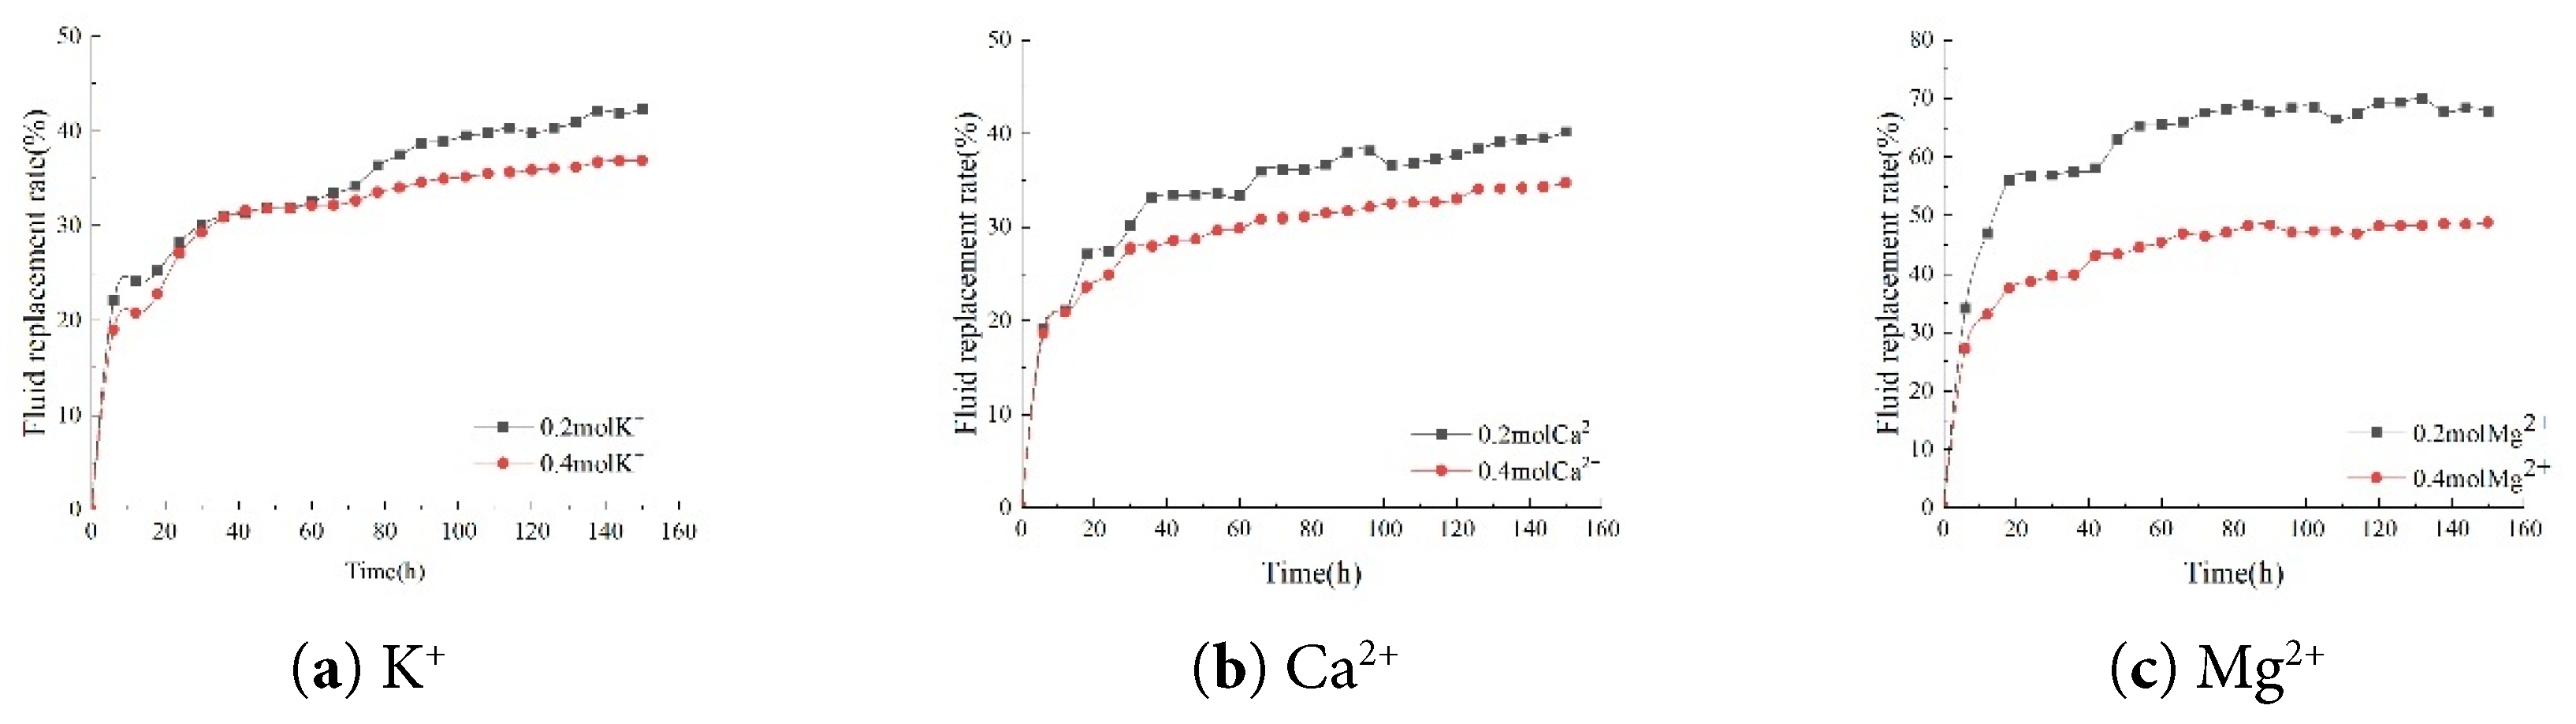
Figure 7: Comparison of fluid replacement rates for different cations.
As the concentrations of K+, Ca2+, and Mg2+ in the brine decreased, a distinct upward trend in the core’s imbibition fluid replacement rate was observed. Specifically, when the K+ concentration in the brine decreased from 0.4 mol/L to 0.2 mol/L, the core’s imbibition fluid replacement rate increased significantly from 37.45% to 42.66%. When the Ca2+ concentration in the brine decreased from 0.4 mol/L to 0.2 mol/L, the imbibition fluid replacement rate of the core also increased from 36.44% to 40.71%. More notably, reducing the Mg2+ concentration in the brine from 0.4 mol/L to 0.2 mol/L substantially increased the core’s imbibition fluid replacement rate from 51.47% to 68.38%. Lower ion concentrations in brine are not necessarily better, as the imbibition fluid replacement rate in the core was lower at only 37.37% in a 1000 ppm NaCl solution without any additional ions added (Fig. 8).
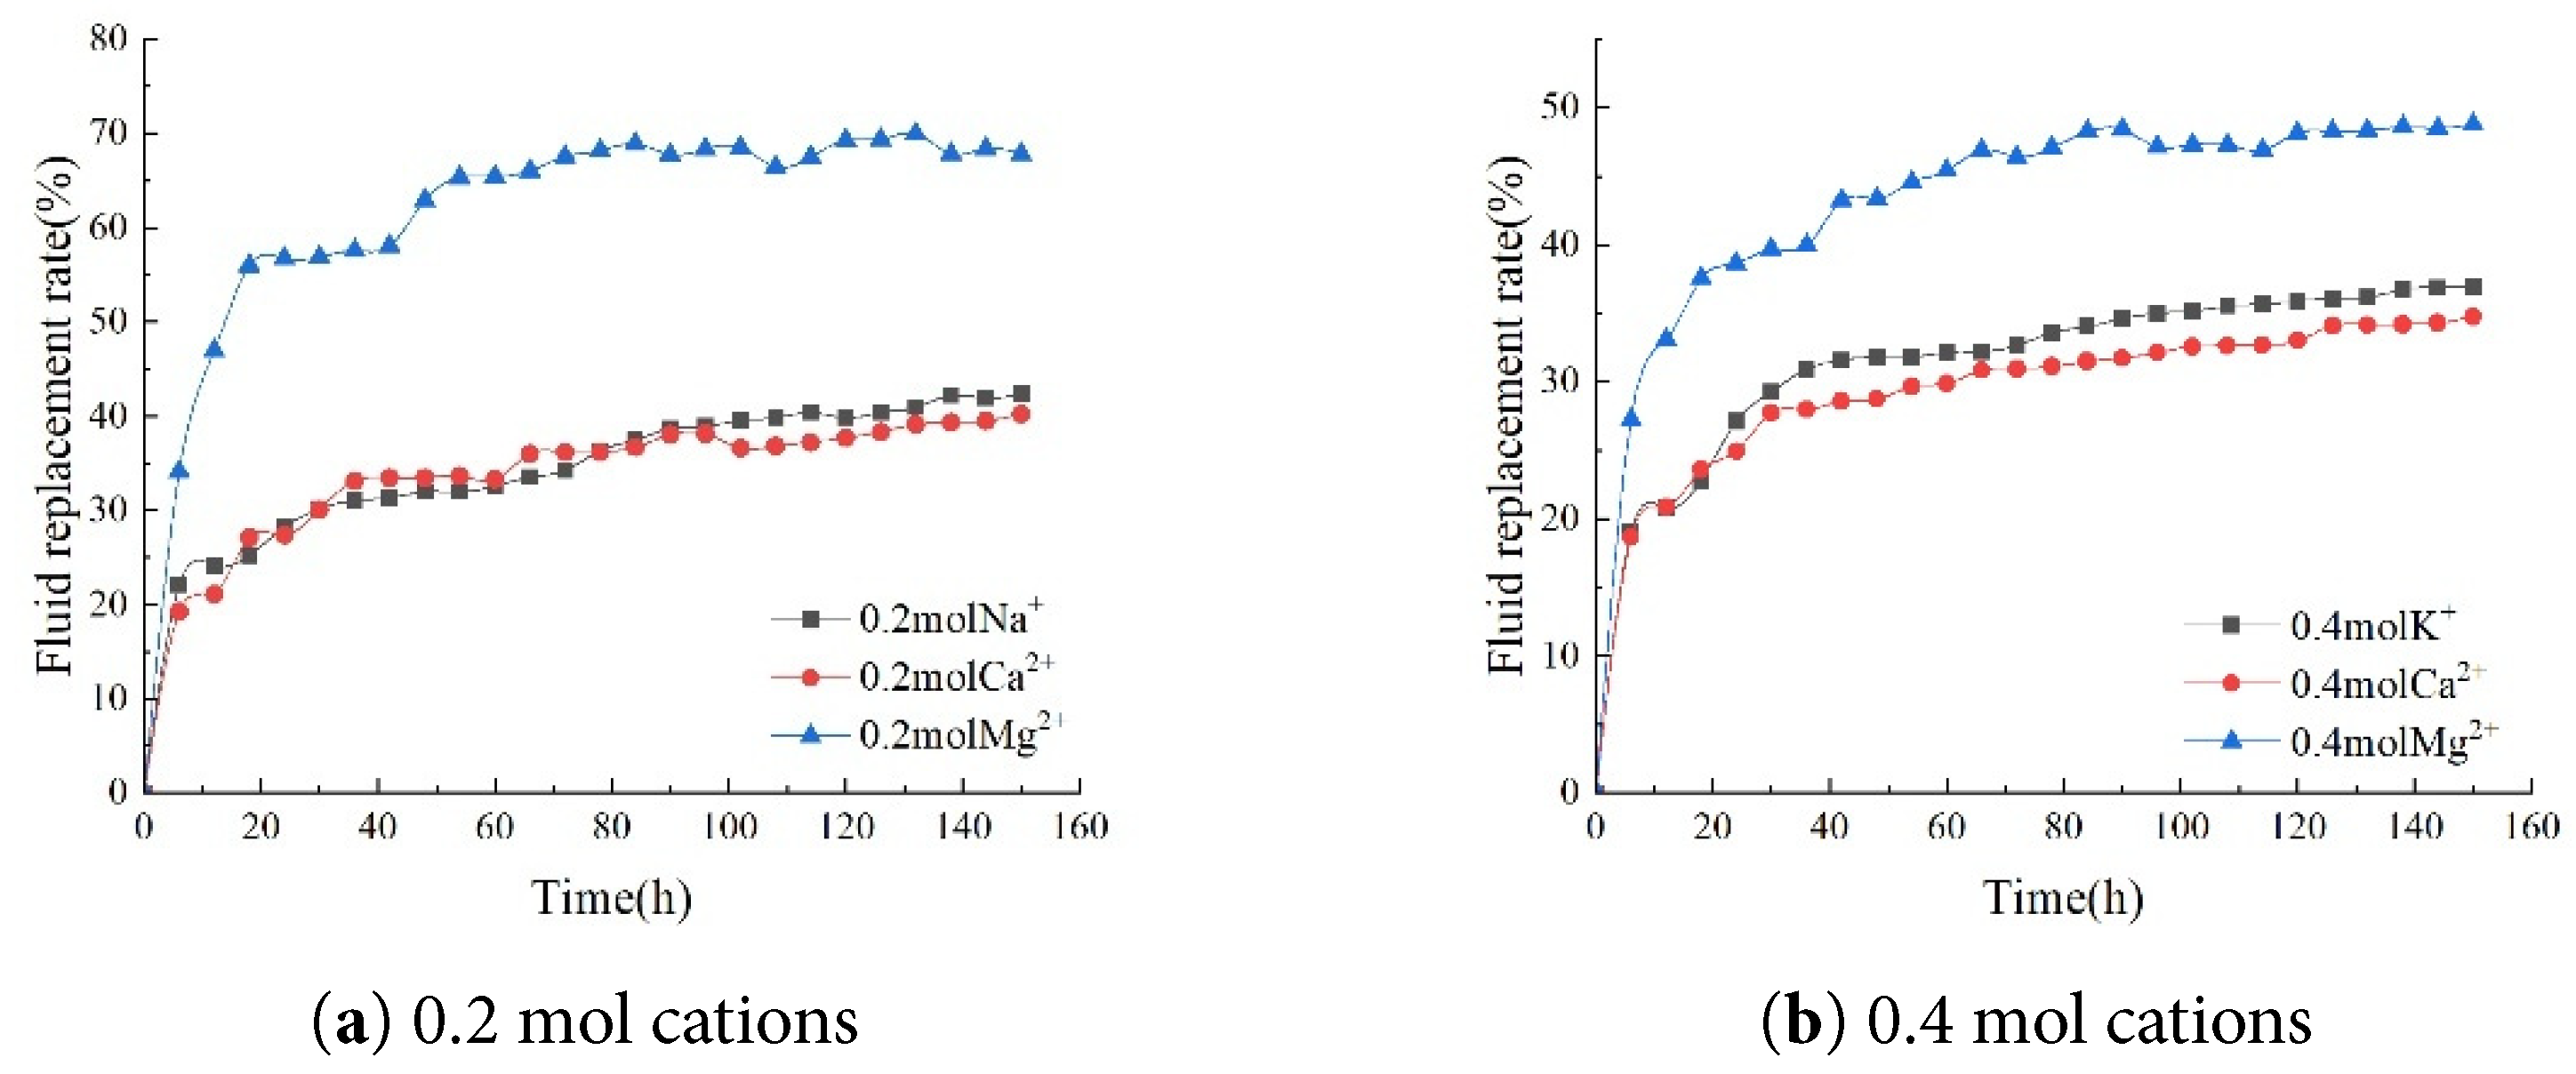
Figure 8: Comparison of fluid replacement rates at different cation concentrations.
When 0.2 mol HCO3−, 0.2 mol CO32−, and 0.2 mol SO42− were added to the imbibition solution, the final fluid replacement rates of the core were 51.60%, 41.98%, and 79.44%, respectively. It can be concluded that adding cations and anions of different valences at the same concentration can enhance the self-imbibition fluid replacement rate of the core. Among these, Mg2+ and SO42− have a particularly pronounced effect on the self-imbibition fluid replacement rate of low-salinity cores (Fig. 9).
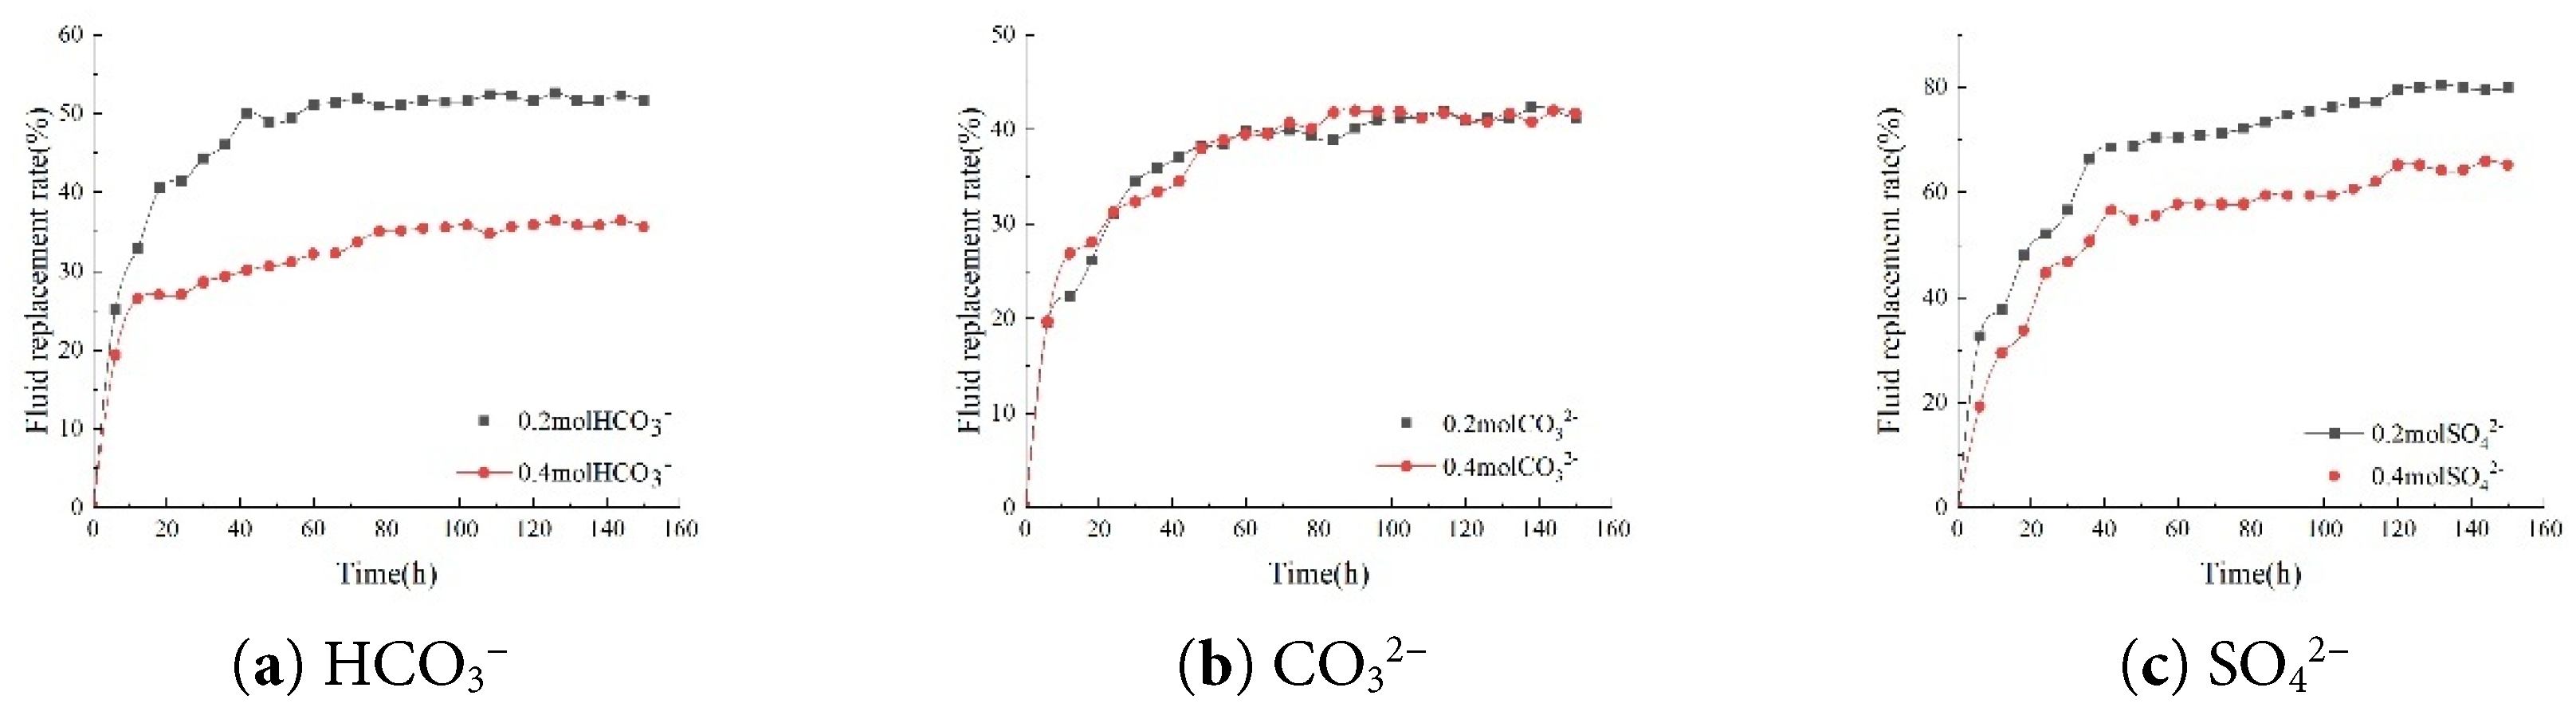
Figure 9: Comparison of fluid replacement rates for different anions.
Regarding anions, changes in the concentrations of HCO3−, CO32−, and SO42− also influenced the core’s imbibition fluid replacement rate. When the concentrations of these anions decreased from 0.4 mol/L to 0.2 mol/L, the core’s imbibition fluid replacement rate increased to varying degrees. Specifically, a decrease in HCO3− concentration resulted in a 15.77% increase in core imbibition fluid replacement rate, a reduction in CO32− concentration led to a 1.18% increase, and a decrease in SO42− concentration caused a 15.32% increase in the core’s imbibition fluid replacement rate. The results indicate that changes in ion concentration in brine significantly affect the fluid replacement rate during core imbibition (Fig. 10).
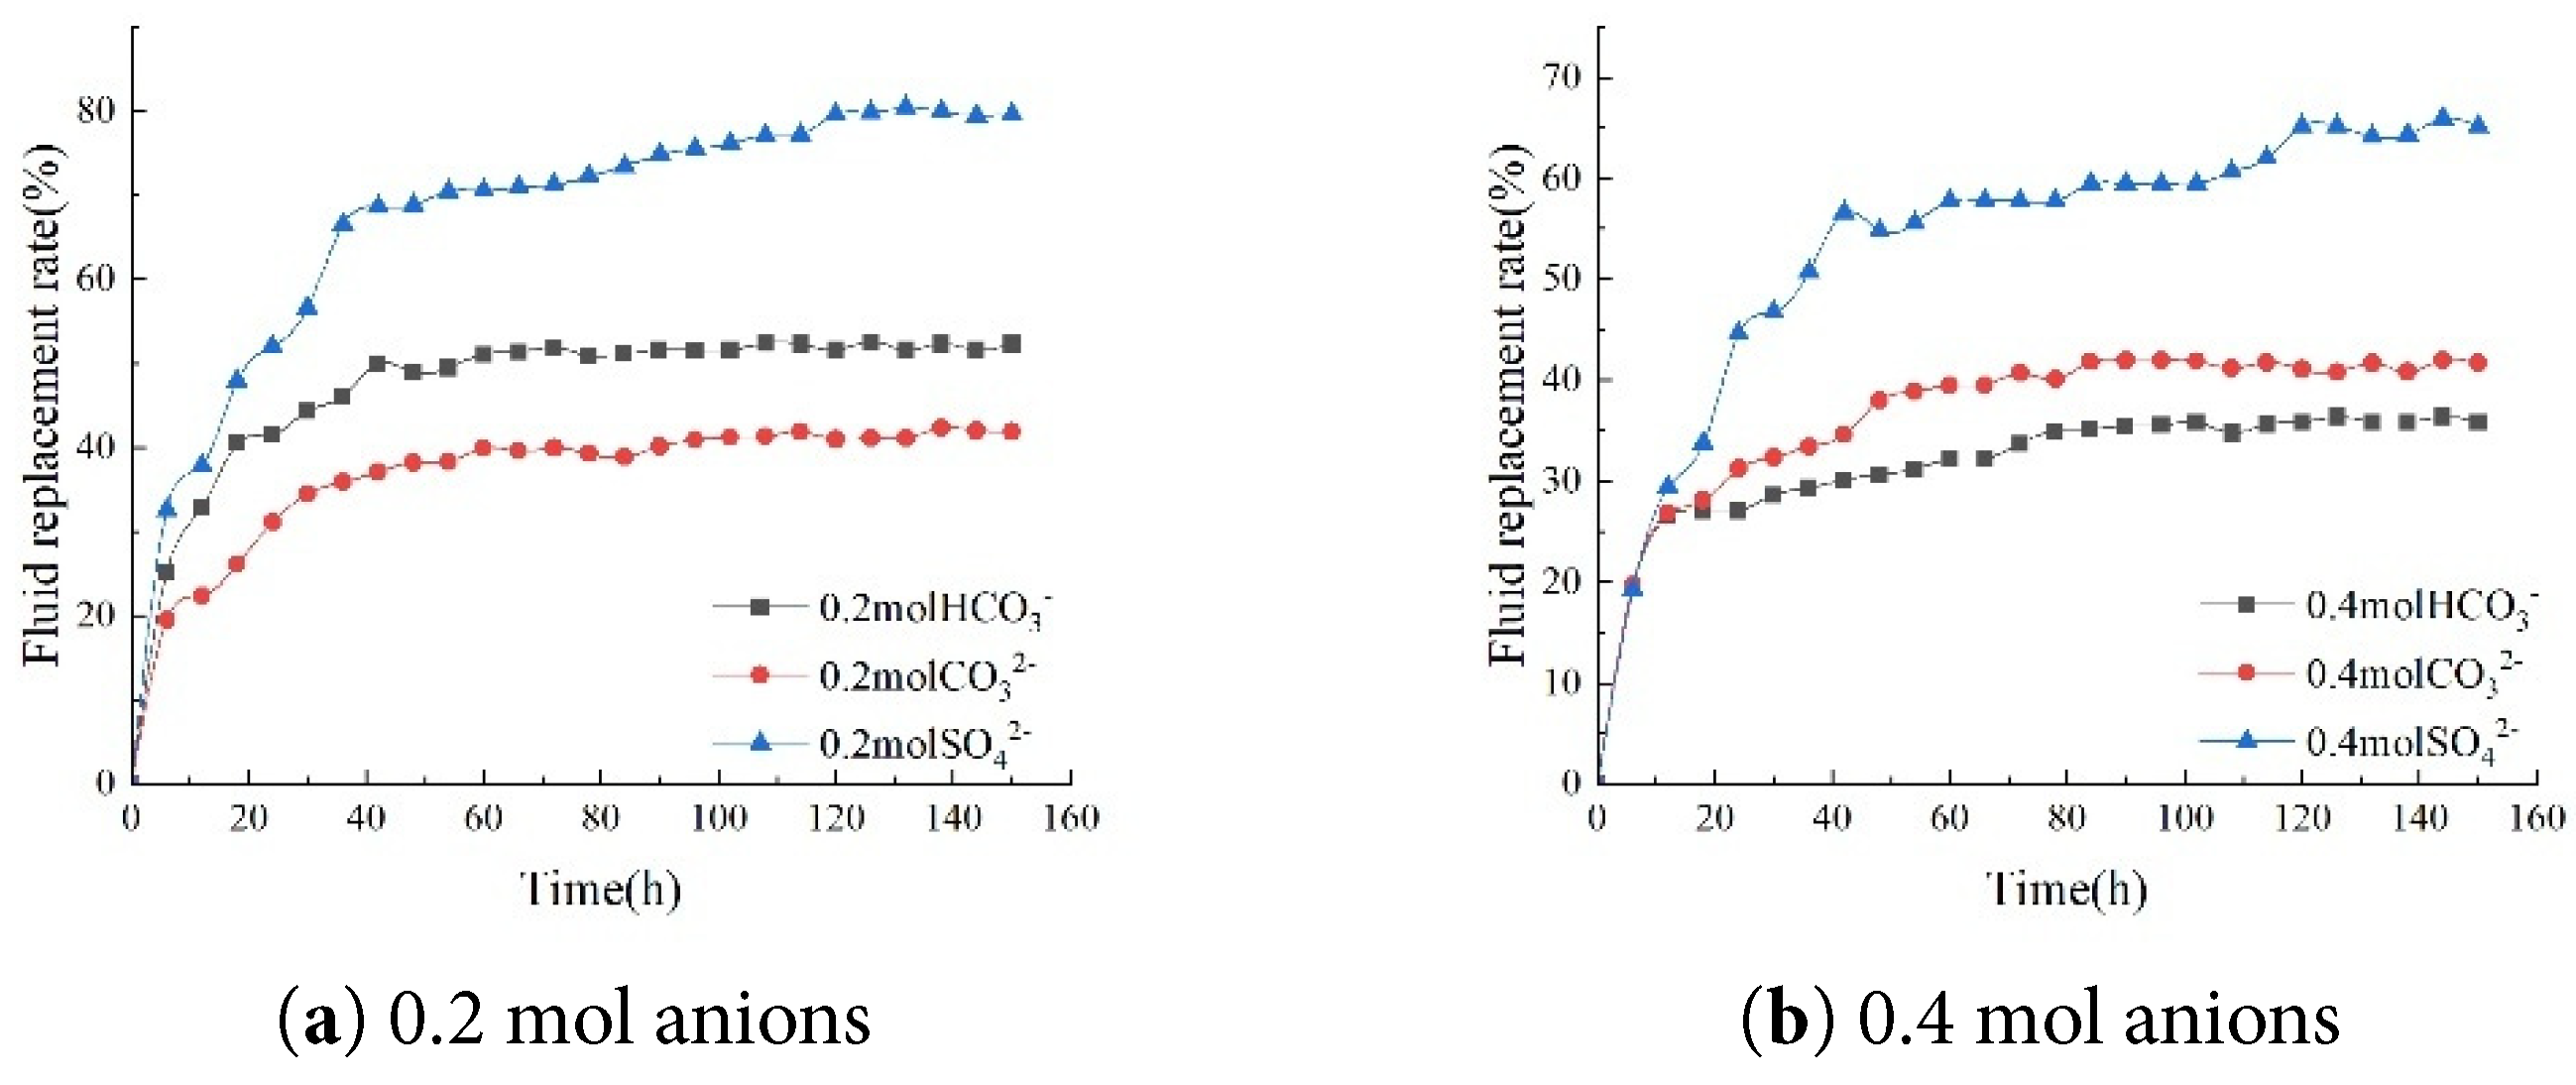
Figure 10: Comparison of fluid replacement rates at different anion concentrations.
During the experiment, the variation of imbibition fluid replacement rate in the core over time was meticulously recorded and analyzed under different brine ion compositions. These curves clearly reveal that the rate of increase in fluid replacement within the core exhibits an initial rapid phase followed by a gradual slowdown, ultimately stabilizing at a steady state. Specifically, during the initial imbibition phase, the sorption fluid replacement rate increases rapidly due to the strong interaction between brine ions and the rock surface, driven by significant differences in surface wettability. However, as time progresses, this interaction gradually weakens, causing the sorption fluid replacement rate to slow down until it reaches a relatively stable level.
With the gradual decrease in the ion concentration in the brine, including K+, Ca2+, Mg2+, and anions HCO3−, CO32−, and SO42−, the imbibition fluid replacement rate in the core samples exhibits a distinct upward trend (Fig. 11).
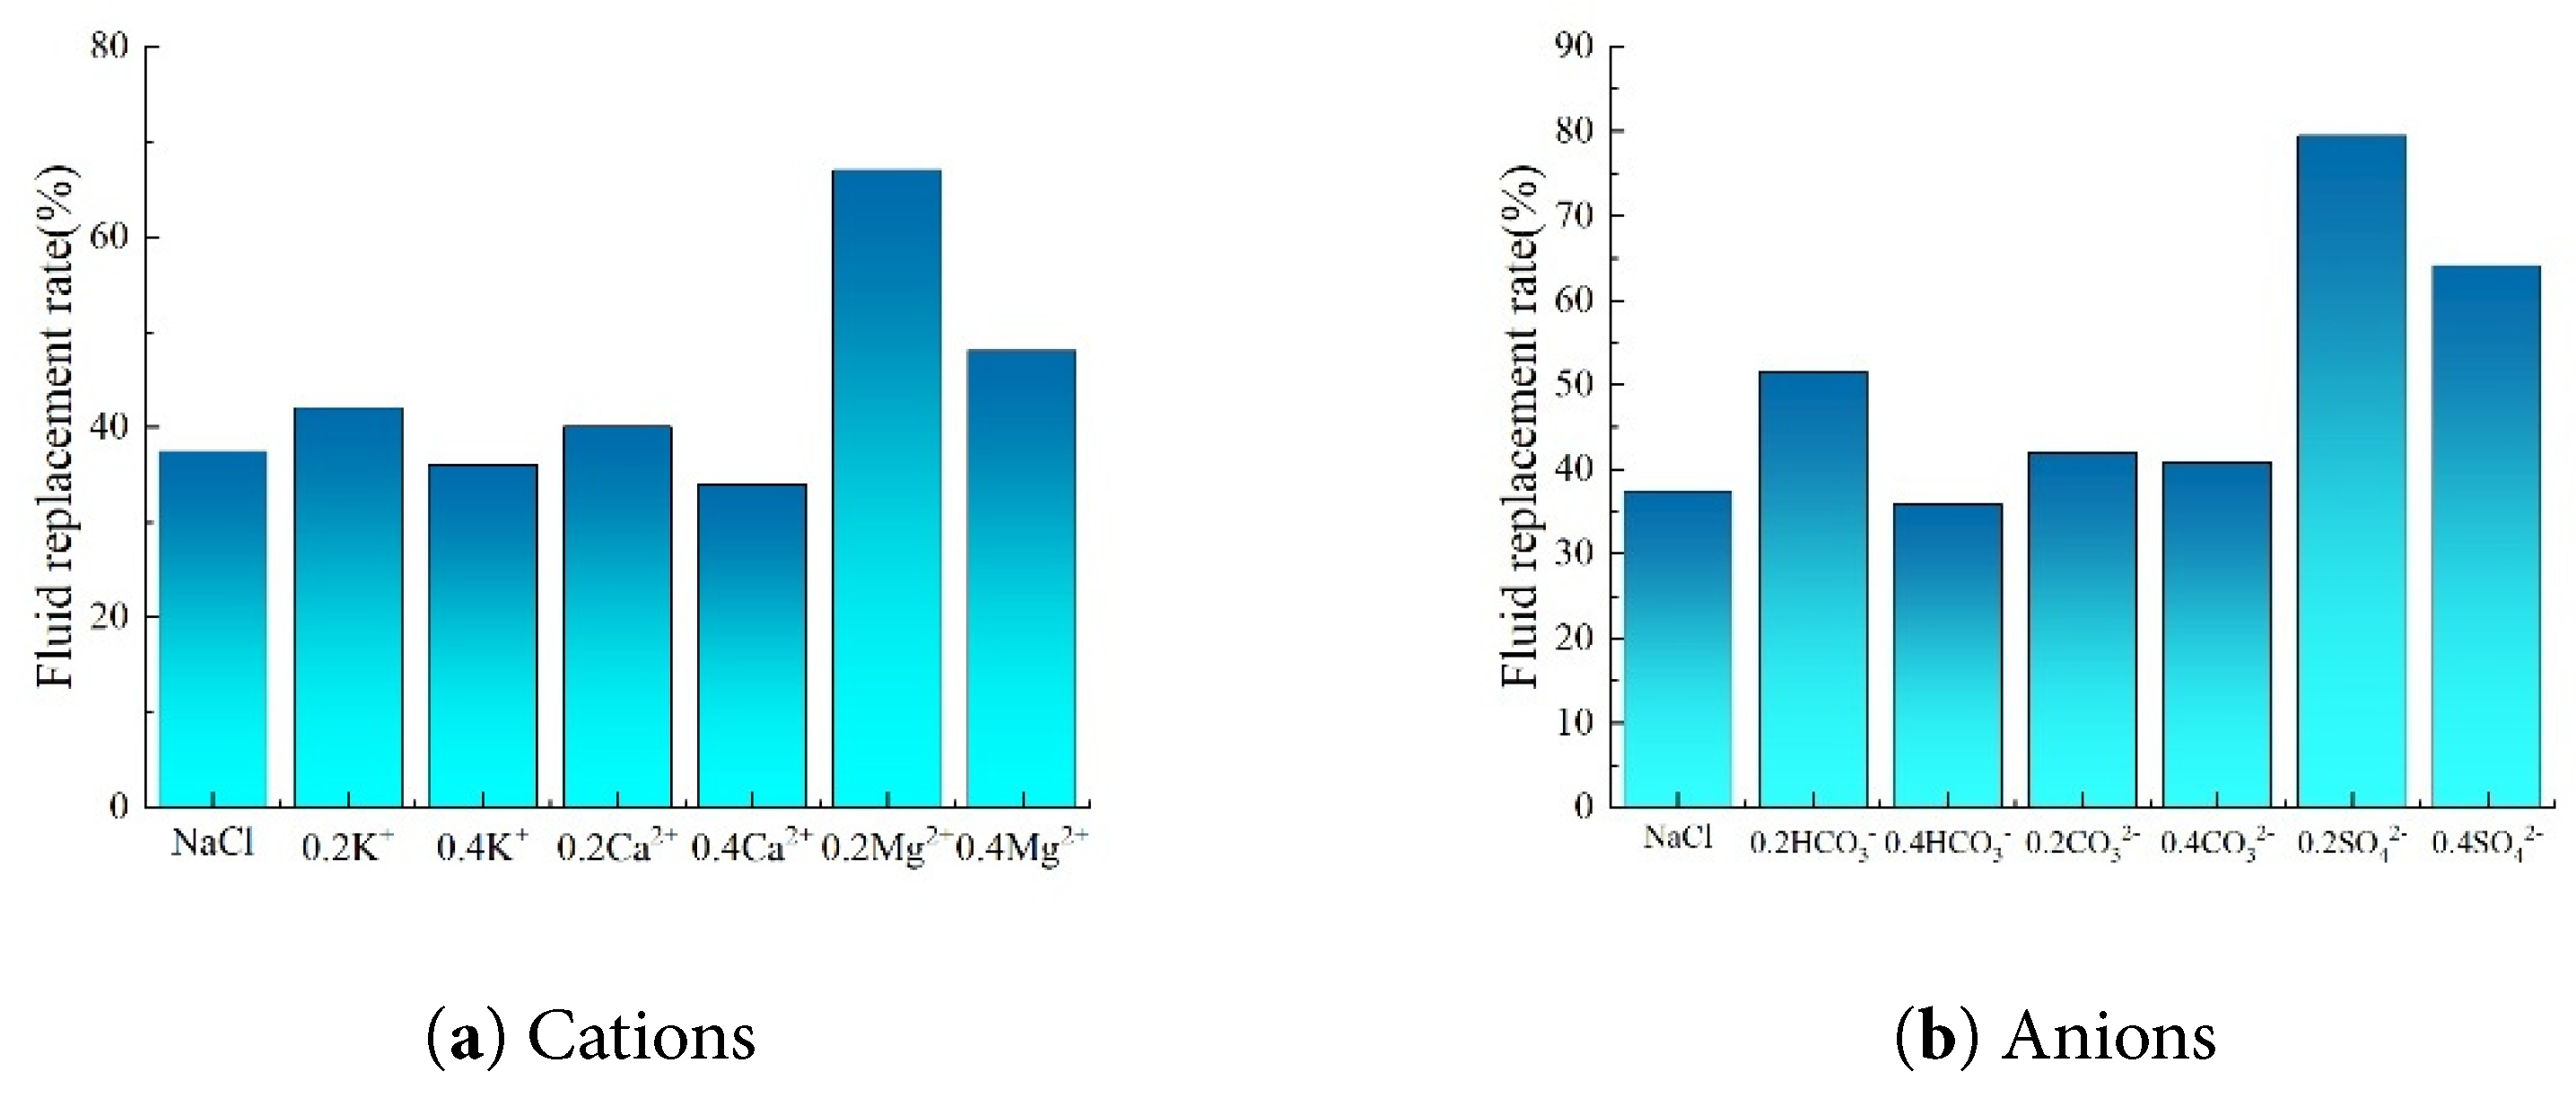
Figure 11: Bar chart of fluid replacement rates under different ion type conditions.
3.2 Effect of Ions on Interfacial Tension
Salt ions enhance the polarity of water, reducing the affinity between oil molecules and water, thereby increasing the intermolecular interaction energy at the interface. This mechanism primarily stems from the ion polarization effect and the strengthening of the aqueous phase structure. The introduction of salt ions enhances the polarity of the aqueous phase while weakening the affinity between molecules at the oil-water interface. This leads to tighter molecular packing at the interface and increased interaction energy. Specifically, low concentrations of salt ions slightly reduce water’s dielectric constant while promoting the formation of locally ordered water molecule structures through hydration, further intensifying the tendency for phase separation. Interfacial tension and fluid displacement rate under different experimental conditions are shown in the tables (Table 2 and Table 3). Comparing data at 1000, 3000, 5000, 7000, 10,000, 30,000, and 500,000 mg·L−1 concentrations, interfacial tension exhibits a nonlinear trend of first decreasing and then increasing with decreasing salinity. Specifically: Low salinity range (1000–7000 mg·L−1): Interfacial tension significantly decreased from 17.78 mN/m to 6.65 mN/m (Fig. 12). Here, increased ion concentration in the solution weakens the double layer compression effect, reducing electrostatic repulsion at the oil-water interface. This promotes tighter molecular packing at the interface, lowering interfacial energy.
High salinity range (10,000–30,000 mg·L−1): Tension further increases from 15.91 mN/m to 28.47 mN/m. Excessively high ion concentration causes excessive compression of the double layer, enhancing interfacial rigidity. Concurrently, the hydration effect and increased polarity of ions structure the aqueous phase, hindering oil phase dispersion. Additionally, highly charged ions reorganize the interface through strong adsorption and ion bridging, ultimately elevating interfacial tension.
Table 2: Interfacial tension values at different salinity degrees and fluid replacement rates.
| Core Number | Porosity/% | Permeability/mD | Experimental Project | Interfacial Tension (mN/m) | Fluid Replacement Rate/% |
|---|---|---|---|---|---|
| 1 | 7.99 | 0.14 | 50,000 mg·L−1 | 17.04 | 21.6 |
| 2 | 9.55 | 0.14 | 30,000 mg·L−1 | 28.47 | 36.6 |
| 3 | 8.48 | 0.16 | 10,000 mg·L−1 | 15.91 | 42.5 |
| 4 | 11.27 | 0.17 | 7000 mg·L−1 | 6.65 | 41.2 |
| 5 | 9.57 | 0.49 | 5000 mg·L−1 | 10.56 | 41.4 |
| 6 | 9.60 | 0.21 | 3000 mg·L−1 | 17.78 | 48.6 |
| 7 | 11.59 | 0.41 | 1000 mg·L−1 | 14.61 | 52.6 |
| 8 | 11.38 | 0.14 | 1000NaCl | 5.00 | 37.3 |
Table 3: Interfacial tension values and fluid replacement rates for different ion types and concentrations.
| Core Number | Porosity/% | Permeability/mD | Experimental Project | Interfacial Tension (mN/m) | Fluid Replacement Rate/% |
|---|---|---|---|---|---|
| 9 | 11.42 | 0.14 | 0.2K+ | 23.73 | 42.6 |
| 10 | 7.66 | 0.25 | 0.4K+ | 18.84 | 37.4 |
| 11 | 8.48 | 0.16 | 0.2Ca2+ | 25.34 | 40.7 |
| 12 | 6.96 | 0.14 | 0.4Ca2+ | 13.9 | 36.4 |
| 13 | 5.03 | 0.12 | 0.2Mg2+ | 14.96 | 68.3 |
| 14 | 2.7 | 0.10 | 0.4Mg2+ | 23.46 | 51.4 |
| 15 | 6.56 | 0.10 | 0.2HCO3− | 16.51 | 51.6 |
| 16 | 6.21 | 0.10 | 0.4HCO3− | 15.94 | 35.8 |
| 17 | 8.56 | 0.16 | 0.2CO32− | 17.87 | 41.9 |
| 18 | 9.67 | 0.14 | 0.4CO32− | 13.98 | 40.8 |
| 19 | 7.14 | 0.59 | 0.2SO42− | 12.14 | 79.4 |
| 20 | 9.12 | 0.61 | 0.4SO42− | 17.39 | 64.1 |
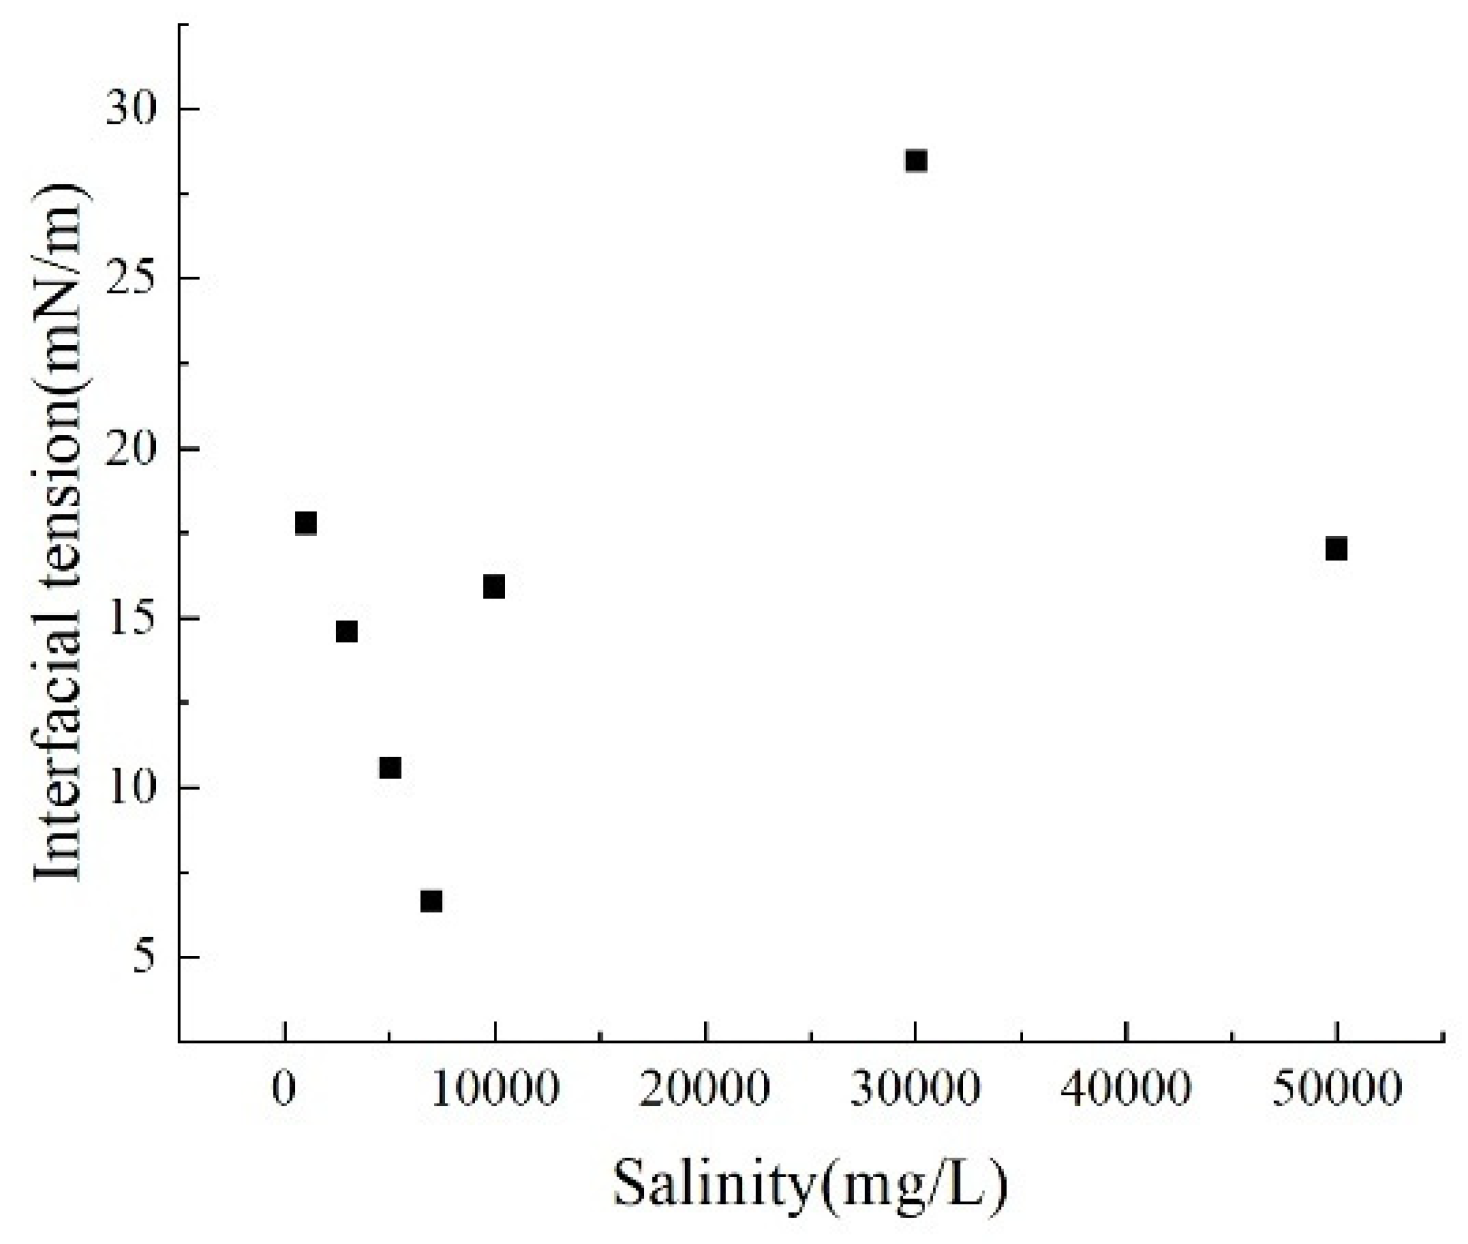
Figure 12: Interfacial tension at different salinities.
By comparing the interfacial tension-fluid replacement rate curves at different salinities (Fig. 13), the cation type and concentration-fluid replacement rate curves and the anion-fluid replacement rate curves (Fig. 14), it can be concluded that interfacial tension is only one of the key parameters controlling the fluid replacement rate. The relationship between interfacial tension and fluid replacement rate is multi-factorially regulated by ion type and concentration: specifically, in systems with varying salinity levels containing only Cl− anions alongside both monovalent and divalent cations, solutions with salinity corresponding to an interfacial tension of 15–20 mN/m exhibit higher fluid replacement rates. When comparing monovalent and divalent anions and their concentrations in isolation, the anion system aligns more closely with traditional theories that reducing interfacial tension effectively enhances fluid replacement rates. However, when comparing interfacial tension values across different ion types and concentrations, no clear traditional positive correlation with replacement rates emerges. This indicates that cations and complex salinity systems exhibit complex nonlinearity due to wetting interference.
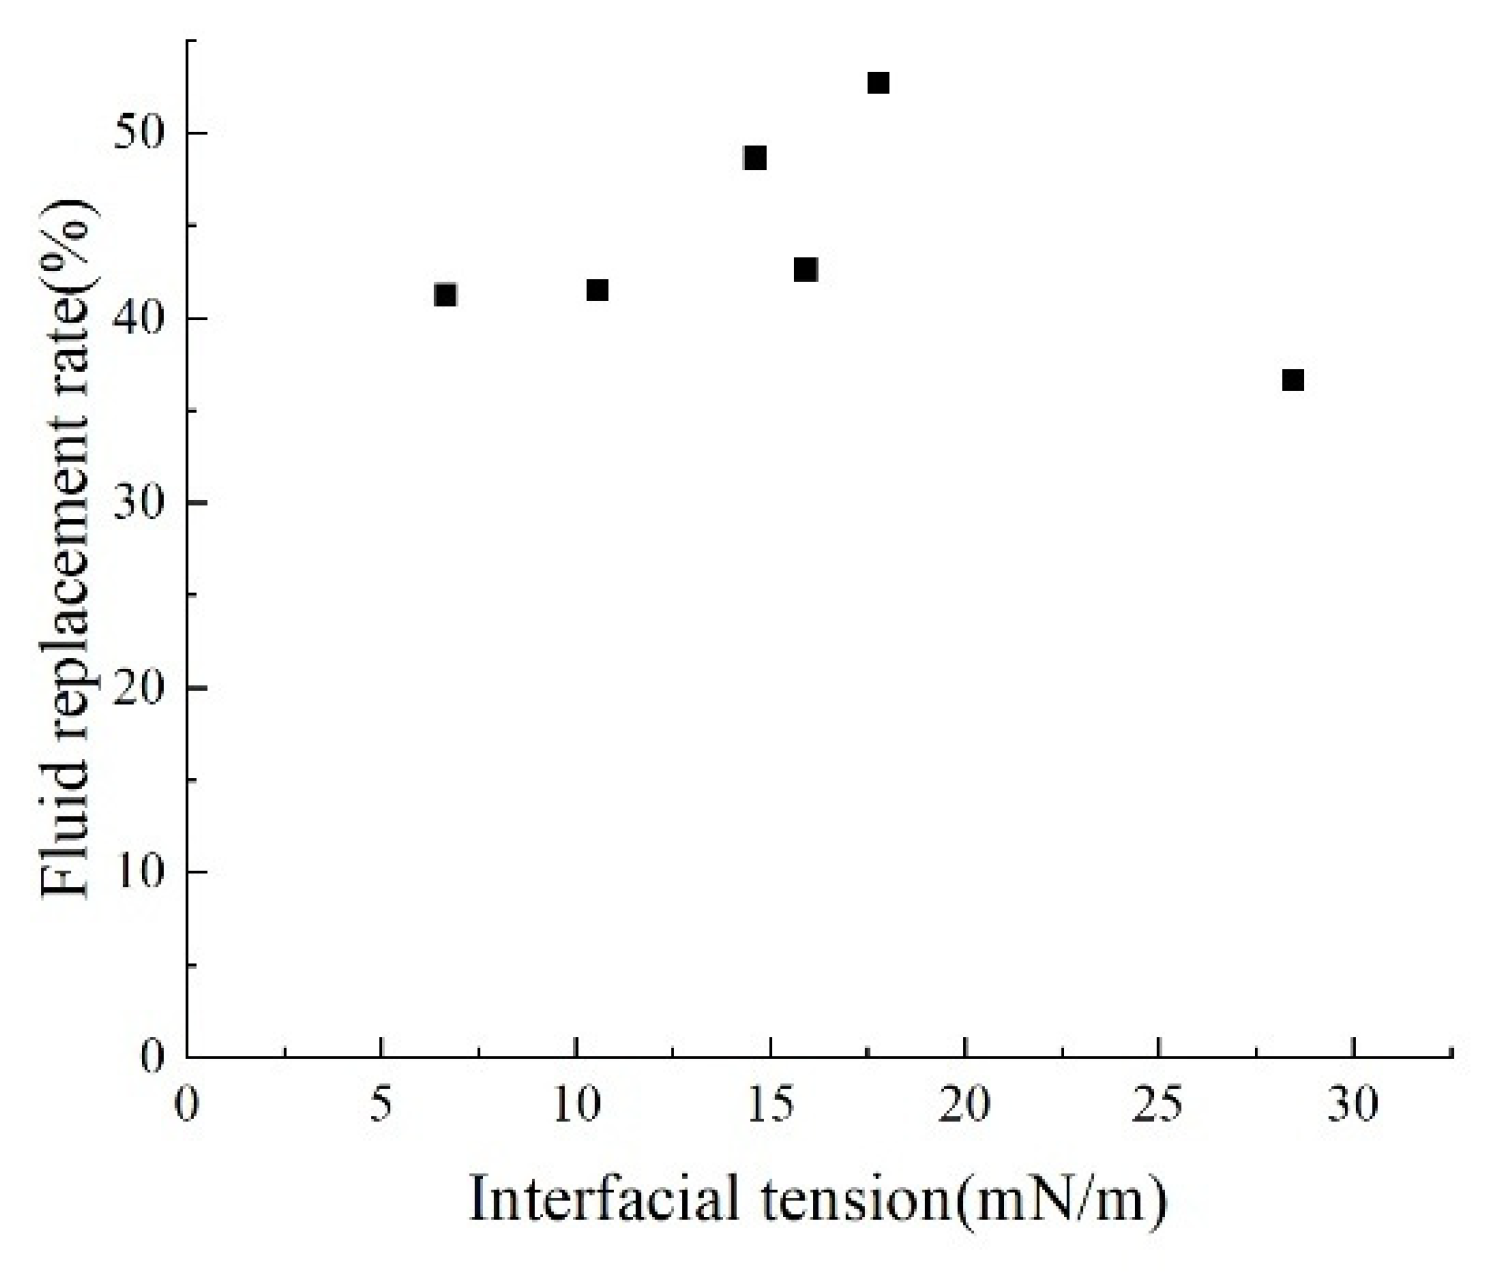
Figure 13: Relationship between interfacial tension and fluid replacement rate under different salinity conditions.
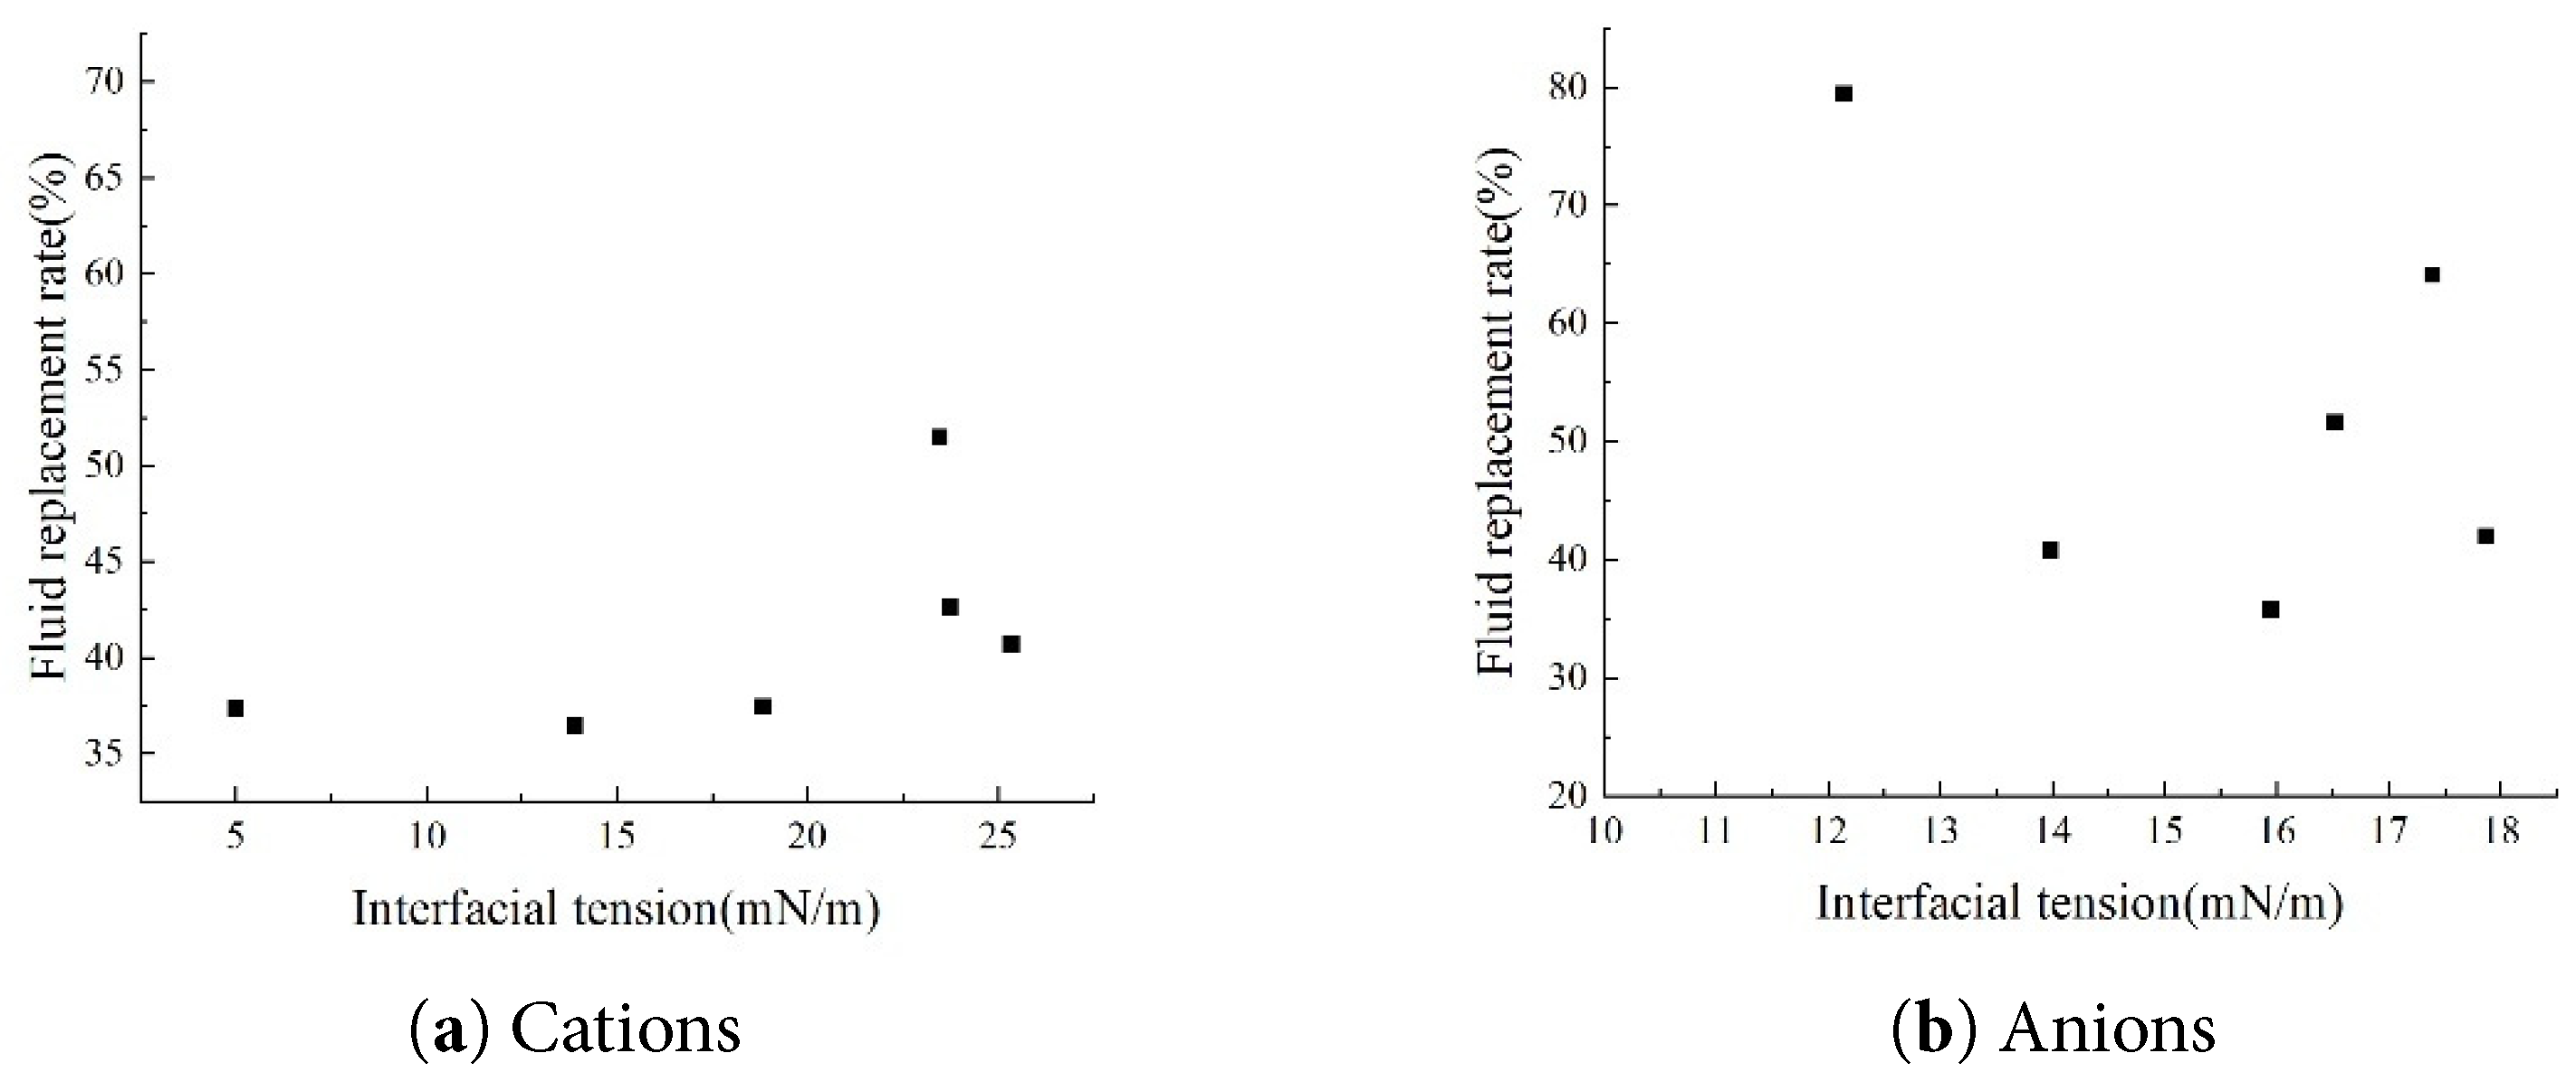
Figure 14: Relationship between interfacial tension and fluid replacement rate under different ion concentration conditions.
3.3 Effect of Ionic Pairs on Contact Angle
The experiment analyzed the influence of various factors on the interaction between crude oil and water by measuring the contact angle between slides treated with solution aging and crude oil. Experimental results (Fig. 15) show that as the solution’s salinity decreases, the wetting angle significantly reduces. This phenomenon indicates that when low-salinity water is absorbed, low-valent ions in the solution exchange with high-valent ions originally present in the reservoir. This enhances the negative charge at the interfaces between the core and water, as well as between crude oil and water. Organic polar substances originally adsorbed onto rock surfaces via physical or chemical interactions, along with organometallic complexes tightly bound to high-valent cations, gradually detach from the rock surface. This ultimately triggers a reversal in rock wettability, shifting from oil-wetting to water-wetting.
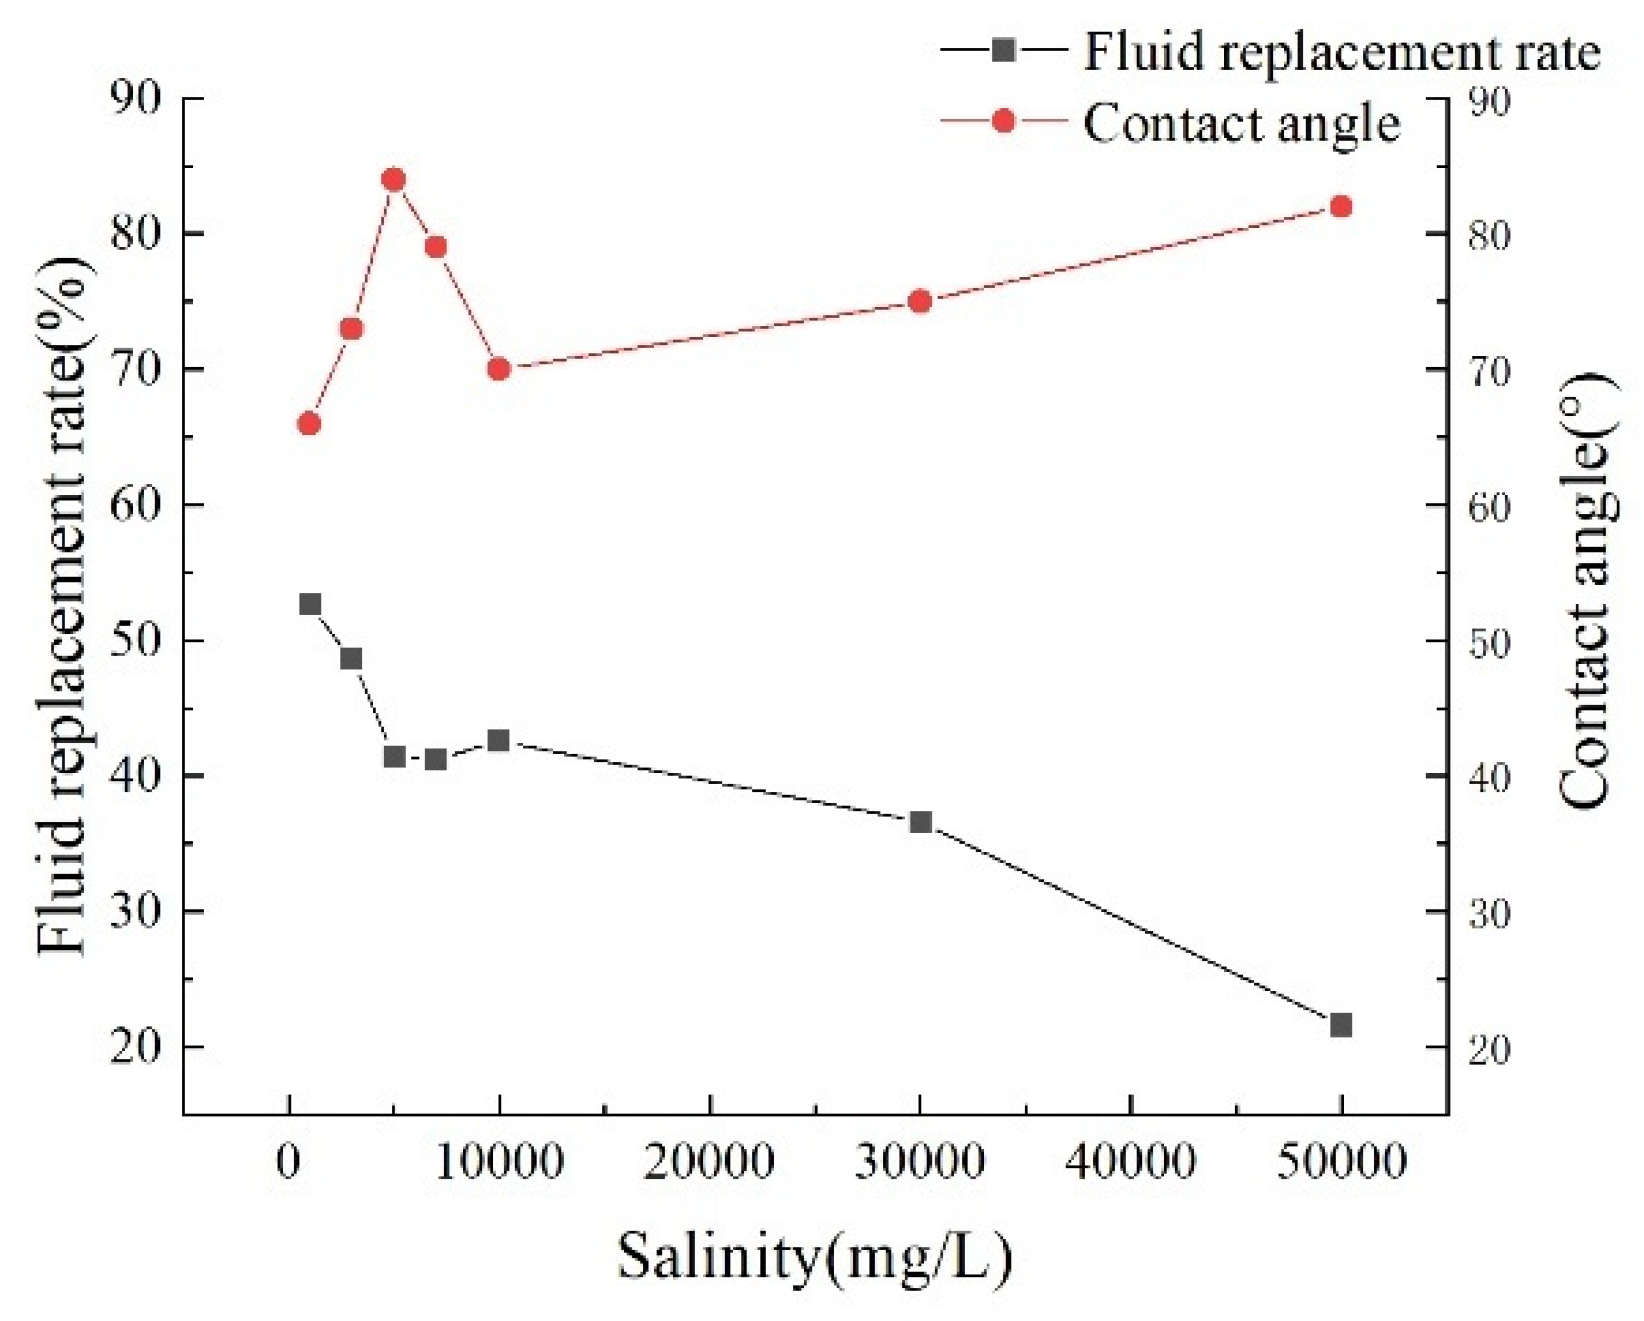
Figure 15: Relationship between parameters under different salinity conditions.
Different ionic compositions and concentrations reveal that in low-concentration anionic solutions (Fig. 16), 0.2SO42− exhibits optimal performance with the lowest contact angle of 60° and the highest fluid replacement rate reaching 79.44%. HCO3− and CO32− exhibit lower contact angles of 58° and 60° at low concentrations, but these angles rebound to 63° and 68° at high concentrations. This increase in pH at high concentrations inhibits hydrophilicity improvement. Among low-concentration cation solutions, Mg2+ performs best, achieving the lowest contact angle of 65° and a fluid replacement rate of 68.38%. Generally, as the ion concentration of a specific ion gradually increases, a corresponding decrease in contact angle is observed. This change subsequently affects the fluid replacement rate, which progressively decreases as the contact angle diminishes. When measuring surface contact angles by immersing glass slides in saline solutions with varying ionic compositions while maintaining constant salinity, significant differences in the obtained data are evident. Notably, under conditions where the saltwater salinity was set at 1000 mg·L−1, the contact angle measured after adding Mg2+ to the saltwater reached its minimum value. Adding NaCl to the saltwater resulted in a contact angle of 75°, which was at a relatively moderate level. Adding K+ solution yielded the maximum contact angle measured, clearly revealing the specific influence of different ions on the contact angle.
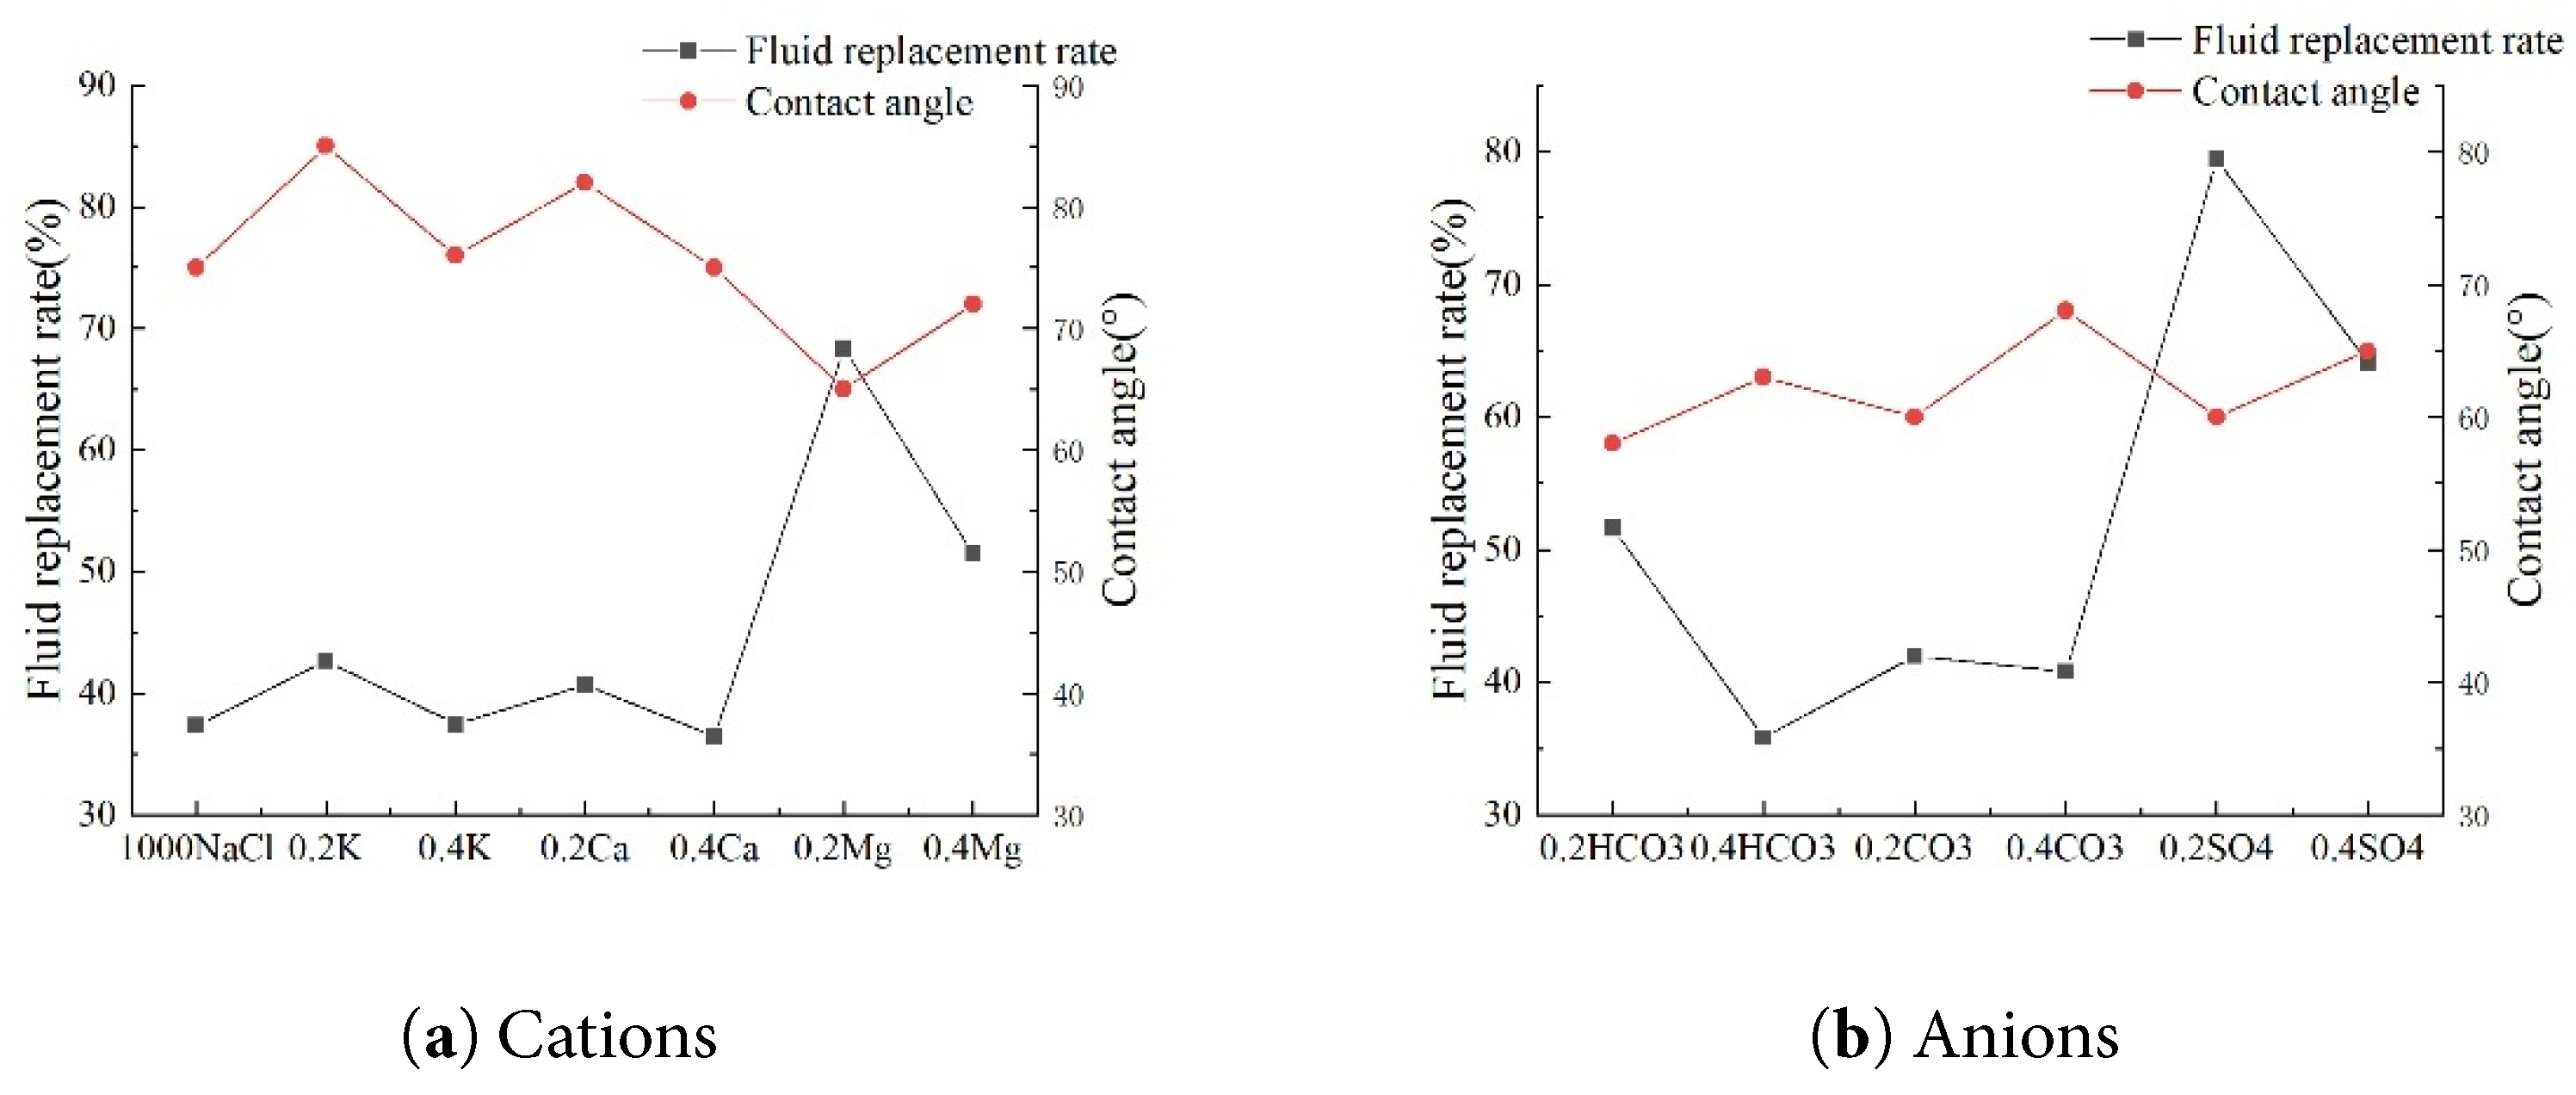
Figure 16: Relationship between parameters under different ion concentrations.
- (1)Imbibition experiments on rock cores indicate that the salinity of injected water significantly affects fluid replacement rates. When the injected water salinity decreased from 50,000 mg·L−1 to 1000 mg·L−1, the fluid replacement rate exhibited notable changes compared to higher salinity water, particularly when the injected water salinity was below 5000 mg·L−1. Therefore, adjusting the salinity of injection water can enhance fluid replacement rates in practical reservoir operations.
- (2)The relationship between interfacial tension and fluid replacement rate is multi-regulated by ion type and concentration. When the total salinity of the injected water is below 5000 mg·L−1, interfacial tension decreases nonlinearly with decreasing salinity, significantly improving imbibition efficiency. The anionic system better aligns with traditional theories that reducing interfacial tension effectively enhances fluid replacement rate. In contrast, cationic and composite salinity systems exhibit complex nonlinearity due to wetting interference.
- (3)Compared to other ions, Mg2+ exhibits particularly outstanding exchange capacity, more effectively replacing crude oil components from rock surfaces to exfoliate the oil. SO42− enhances fluid replacement by increasing interfacial negative charge. However, neither Mg2+ among cations nor SO42− among anions guarantees better oil replacement with higher ion concentration.
Although this study has made some progress in investigating waterflood efficiency in low-permeability reservoirs, several issues warrant further exploration in future research:
- 1.Investigate the influence of low-salinity water (LSW) from a molecular modeling perspective to provide a microscopic explanation for the mechanism by which LSW enhances recovery rates.
- 2.Reservoir damage under waterflooding conditions cannot be overlooked; consider employing artificial intelligence for evaluating reservoir damage [28].
Acknowledgement:
Funding Statement: This work was supported by the National Natural Science Foundation of China (Grant Nos. 52374038 and U23B2089) and Innovation Capability Support Program of Shaanxi (Program No. 2024ZC-KJXX-064).
Author Contributions: Xiong Liu: Writing—review & editing, Writing—original draft, Supervision, Investigation, Funding acquisition. Yueqi Cui: Writing—original draft. Yirui Ren: Writing—data curation. Lingxuan Peng: Supervision. Yuchan Cheng, Zhiyuan Du: Methodology. Yu Chen: Formal analysis. Lishan Cao: Visualization. All authors reviewed the results and approved the final version of the manuscript.
Availability of Data and Materials: The data and materials used in this study are available from the corresponding author upon reasonable request.
Ethics Approval: All experimental procedures in this study adhered to safety protocols, and the research strictly complied with environmental protection guidelines.
Conflicts of Interest: The authors declare no conflicts of interest to report regarding the present study.
References
1. Radwan AE , Yin S , Hakimi MH , Li H . Petroleum geology of conventional and unconventional resources: introduction. Geol J. 2023; 58( 11): 3965– 9. doi:10.1002/gj.4898. [Google Scholar] [CrossRef]
2. Tao S . Exploration and development of unconventional oil and gas resources: latest advances and prospects. Energies. 2025; 18( 15): 3933. doi:10.3390/en18153933. [Google Scholar] [CrossRef]
3. Gharavi A , Abbas KA , Hassan MG , Haddad M , Ghoochaninejad H , Alasmar R , et al. Unconventional reservoir characterization and formation evaluation: a case study of a tight sandstone reservoir in west Africa. Energies. 2023; 16( 22): 7572. doi:10.3390/en16227572. [Google Scholar] [CrossRef]
4. Hu Q , Zhang BJ , Chen C , Zhang M , Wang X , Qu DB , et al. Research and application of economic evaluation methods for unconventional oil and gas development. China Petrol Explor. 2025; 30( 1): 180– 92. (In Chinese). [Google Scholar]
5. Lai F , Li Z , Fu Y , Adenutsi CD . Investigating the effects of pore-structure characteristics on porosity and absolute permeability for unconventional reservoirs. Energy Fuels. 2021; 35( 1): 690– 701. doi:10.1021/acs.energyfuels.0c03152. [Google Scholar] [CrossRef]
6. Yang J , Zhang J , Ji Y , Lv W , Wu H , He Z , et al. Pore structure characteristics and controlling factors of a tight sandstone reservoir in the Paleogene shahejie formation, nanpu sag, Bohai Bay Basin, China. ACS Omega. 2022; 7( 2): 1740– 56. doi:10.1021/acsomega.1c04573. [Google Scholar] [CrossRef]
7. Aljuboori FA , Lee JH , Elraies KA , Stephen KD . Using low salinity waterflooding to improve oil recovery in naturally fractured reservoirs. Appl Sci. 2020; 10( 12): 4211. doi:10.3390/app10124211. [Google Scholar] [CrossRef]
8. Nande SB , Patwardhan SD . A review on low salinity waterflooding in carbonates: challenges and future perspective. J Petrol Explor Prod Technol. 2022; 12( 4): 1037– 55. doi:10.1007/s13202-021-01361-5. [Google Scholar] [CrossRef]
9. Gbadamosi A , Patil S , Al Shehri D , Kamal MS , Shakil Hussain SM , Al-Shalabi EW , et al. Recent advances on the application of low salinity waterflooding and chemical enhanced oil recovery. Energy Rep. 2022; 8: 9969– 96. doi:10.1016/j.egyr.2022.08.001. [Google Scholar] [CrossRef]
10. Zekri A , Nantongo H , Boukadi F . The effect of carbonate rock wettability on the performance of low salinity waterflooding: an experimental approach. J Petrol Explor Prod Technol. 2021; 11( 12): 4325– 38. doi:10.1007/s13202-021-01309-9. [Google Scholar] [CrossRef]
11. Sun M , Liu Y . Investigation of the temperature effect on oil-water-rock interaction mechanisms during low-salinity water flooding in tight sandstone reservoirs. Processes. 2025; 13( 10): 3135. doi:10.3390/pr13103135. [Google Scholar] [CrossRef]
12. Tetteh JT , Veisi M , Brady PV , Barati Ghahfarokhi R . Surface reactivity analysis of the crude oil-brine-limestone interface for a comprehensive understanding of the low-salinity waterflooding mechanism. Energy Fuels. 2020; 34( 3): 2739– 56. doi:10.1021/acs.energyfuels.9b03664. [Google Scholar] [CrossRef]
13. Maya G , Carreño Otero AL , Monares Bueno FL , Romero Bohórquez AR , Cortés FB , Franco CA , et al. Rock-oil-brine dominant mechanisms in smart water flooding. Energies. 2023; 16( 4): 2043. doi:10.3390/en16042043. [Google Scholar] [CrossRef]
14. Al-Saedi HN , Flori RE . Enhanced oil recovery of low salinity water flooding in sandstone and the role of clay. Petrol Explor Dev. 2018; 45( 5): 927– 31. doi:10.1016/S1876-3804(18)30096-X. [Google Scholar] [CrossRef]
15. Xu YL , Ma QH , Chen N , Liu JY , Ding HN . Influences of low salinity waterflooding on oil recovery and wettability of the medium and low permeability sandstone. Contemp Chem Ind. 2024; 53( 5): 1174– 81. (In Chinese). doi:10.13840/j.cnki.cn21-1457/tq.2024.05.010. [Google Scholar] [CrossRef]
16. Bijani M , Khamehchi E , Shabani M . Optimization of salinity and composition of injected low salinity water into sandstone reservoirs with minimum scale deposition. Sci Rep. 2023; 13( 1): 12991. doi:10.1038/s41598-023-40067-y. [Google Scholar] [CrossRef]
17. Saeedi Dehaghani AH , Badizad MH . Impact of ionic composition on modulating wetting preference of calcite surface: implication for chemically tuned water flooding. Colloids Surf A Physicochem Eng Aspects. 2019; 568: 470– 80. doi:10.1016/j.colsurfa.2019.02.009. [Google Scholar] [CrossRef]
18. Kakati A , Sangwai JS . Wettability alteration of mineral surface during low-salinity water flooding: role of salt type, pure alkanes, and model oils containing polar components. Energy Fuels. 2018; 32( 3): 3127– 37. doi:10.1021/acs.energyfuels.7b03727. [Google Scholar] [CrossRef]
19. Hou J , Liu C , Yuan X , Ma L , Yan H , Zhang H , et al. Influence of ionic composition in aqueous solution on wettability of rock surface-experiment and economics evaluation. Arab J Chem. 2023; 16( 5): 104632. doi:10.1016/j.arabjc.2023.104632. [Google Scholar] [CrossRef]
20. Saw RK , Mandal A . A mechanistic investigation of low salinity water flooding coupled with ion tuning for enhanced oil recovery. RSC Adv. 2020; 10( 69): 42570– 83. doi:10.1039/d0ra08301a. [Google Scholar] [CrossRef]
21. Meng M , Zhang Y , Yuan B , Li Z , Zhang Y . Imbibition behavior of oil-saturated rock: implications for enhanced oil recovery in unconventional reservoirs. Energy Fuels. 2023; 37( 18): 13759– 68. doi:10.1021/acs.energyfuels.3c02501. [Google Scholar] [CrossRef]
22. Shahrabadi A , Babakhani Dehkordi P , Razavirad F , Noorimotlagh R , Nasiri Zarandi M . Enhanced oil recovery from a carbonate reservoir during low salinity water flooding: spontaneous imbibition and core-flood methods. Nat Resour Res. 2022; 31( 5): 2995– 3015. doi:10.1007/s11053-022-10092-1. [Google Scholar] [CrossRef]
23. Takeda M , Manaka M , Ito D . Experimental evidence of chemical osmosis-driven improved oil recovery in low-salinity water flooding: generation of osmotic pressure via oil-saturated sandstone. J Petrol Sci Eng. 2022; 215: 110731. doi:10.1016/j.petrol.2022.110731. [Google Scholar] [CrossRef]
24. Yan L , Aslannejad H , Hassanizadeh SM , Raoof A . Impact of water salinity differential on a crude oil droplet constrained in a capillary: pore-scale mechanisms. Fuel. 2020; 274: 117798. doi:10.1016/j.fuel.2020.117798. [Google Scholar] [CrossRef]
25. Roldán-Carrillo T , Castorena-Cortes G , Salazar Castillo RO , Hernández-Escobedo L , Olguín-Lora P , Gachuz-Muro H . Hybrid low salinity water and surfactant process for enhancing heavy oil recovery. Petrol Explor Dev. 2023; 50( 6): 1466– 77. doi:10.1016/S1876-3804(24)60480-5. [Google Scholar] [CrossRef]
26. Dabiri A , Honarvar B . Synergic impacts of two non-ionic natural surfactants and low salinity water on interfacial tension reduction, wettability alteration and oil recovery: experimental study on oil wet carbonate core samples. Nat Resour Res. 2020; 29( 6): 4003– 16. doi:10.1007/s11053-020-09657-9. [Google Scholar] [CrossRef]
27. Shi Y , Miller C , Mohanty K . Surfactant-aided low-salinity waterflooding for low-temperature carbonate reservoirs. SPE J. 2021; 26( 4): 2214– 30. doi:10.2118/201754-pa. [Google Scholar] [CrossRef]
28. Khormali A , Ahmadi S , Aleksandrov AN . Analysis of reservoir rock permeability changes due to solid precipitation during waterflooding using artificial neural network. J Petrol Explor Prod Technol. 2025; 15( 1): 17. doi:10.1007/s13202-024-01898-1. [Google Scholar] [CrossRef]
Cite This Article
 Copyright © 2025 The Author(s). Published by Tech Science Press.
This work is licensed under a Creative Commons Attribution 4.0 International License , which permits unrestricted use, distribution, and reproduction in any medium, provided the original work is properly cited.
 Downloads
 Citation Tools