
 Submit a Paper
 Propose a Special lssue
 Open Access
ARTICLE

Phase Behavior and Dew Point Pressure of Multicomponent Condensate Gas in Nanopores
1 Petroleum Engineering College, Yangtze University, Wuhan, 430199, China
2 Hubei Key Laboratory of Oil and Gas Drilling and Production Engineering (Yangtze University), Wuhan, 430199, China
3 Exploration & Development Project Department of Mahu Area of Xinjiang Oilfield Company, China National Petroleum Corporation, Karamay, 834000, China
* Corresponding Author: Jing Sun. Email:
Fluid Dynamics & Materials Processing 2025, 21(2), 279-292. https://doi.org/10.32604/fdmp.2025.060998
Received 14 November 2024; Accepted 14 January 2025; Issue published 06 March 2025
 View Full Text
 Download PDF
Abstract
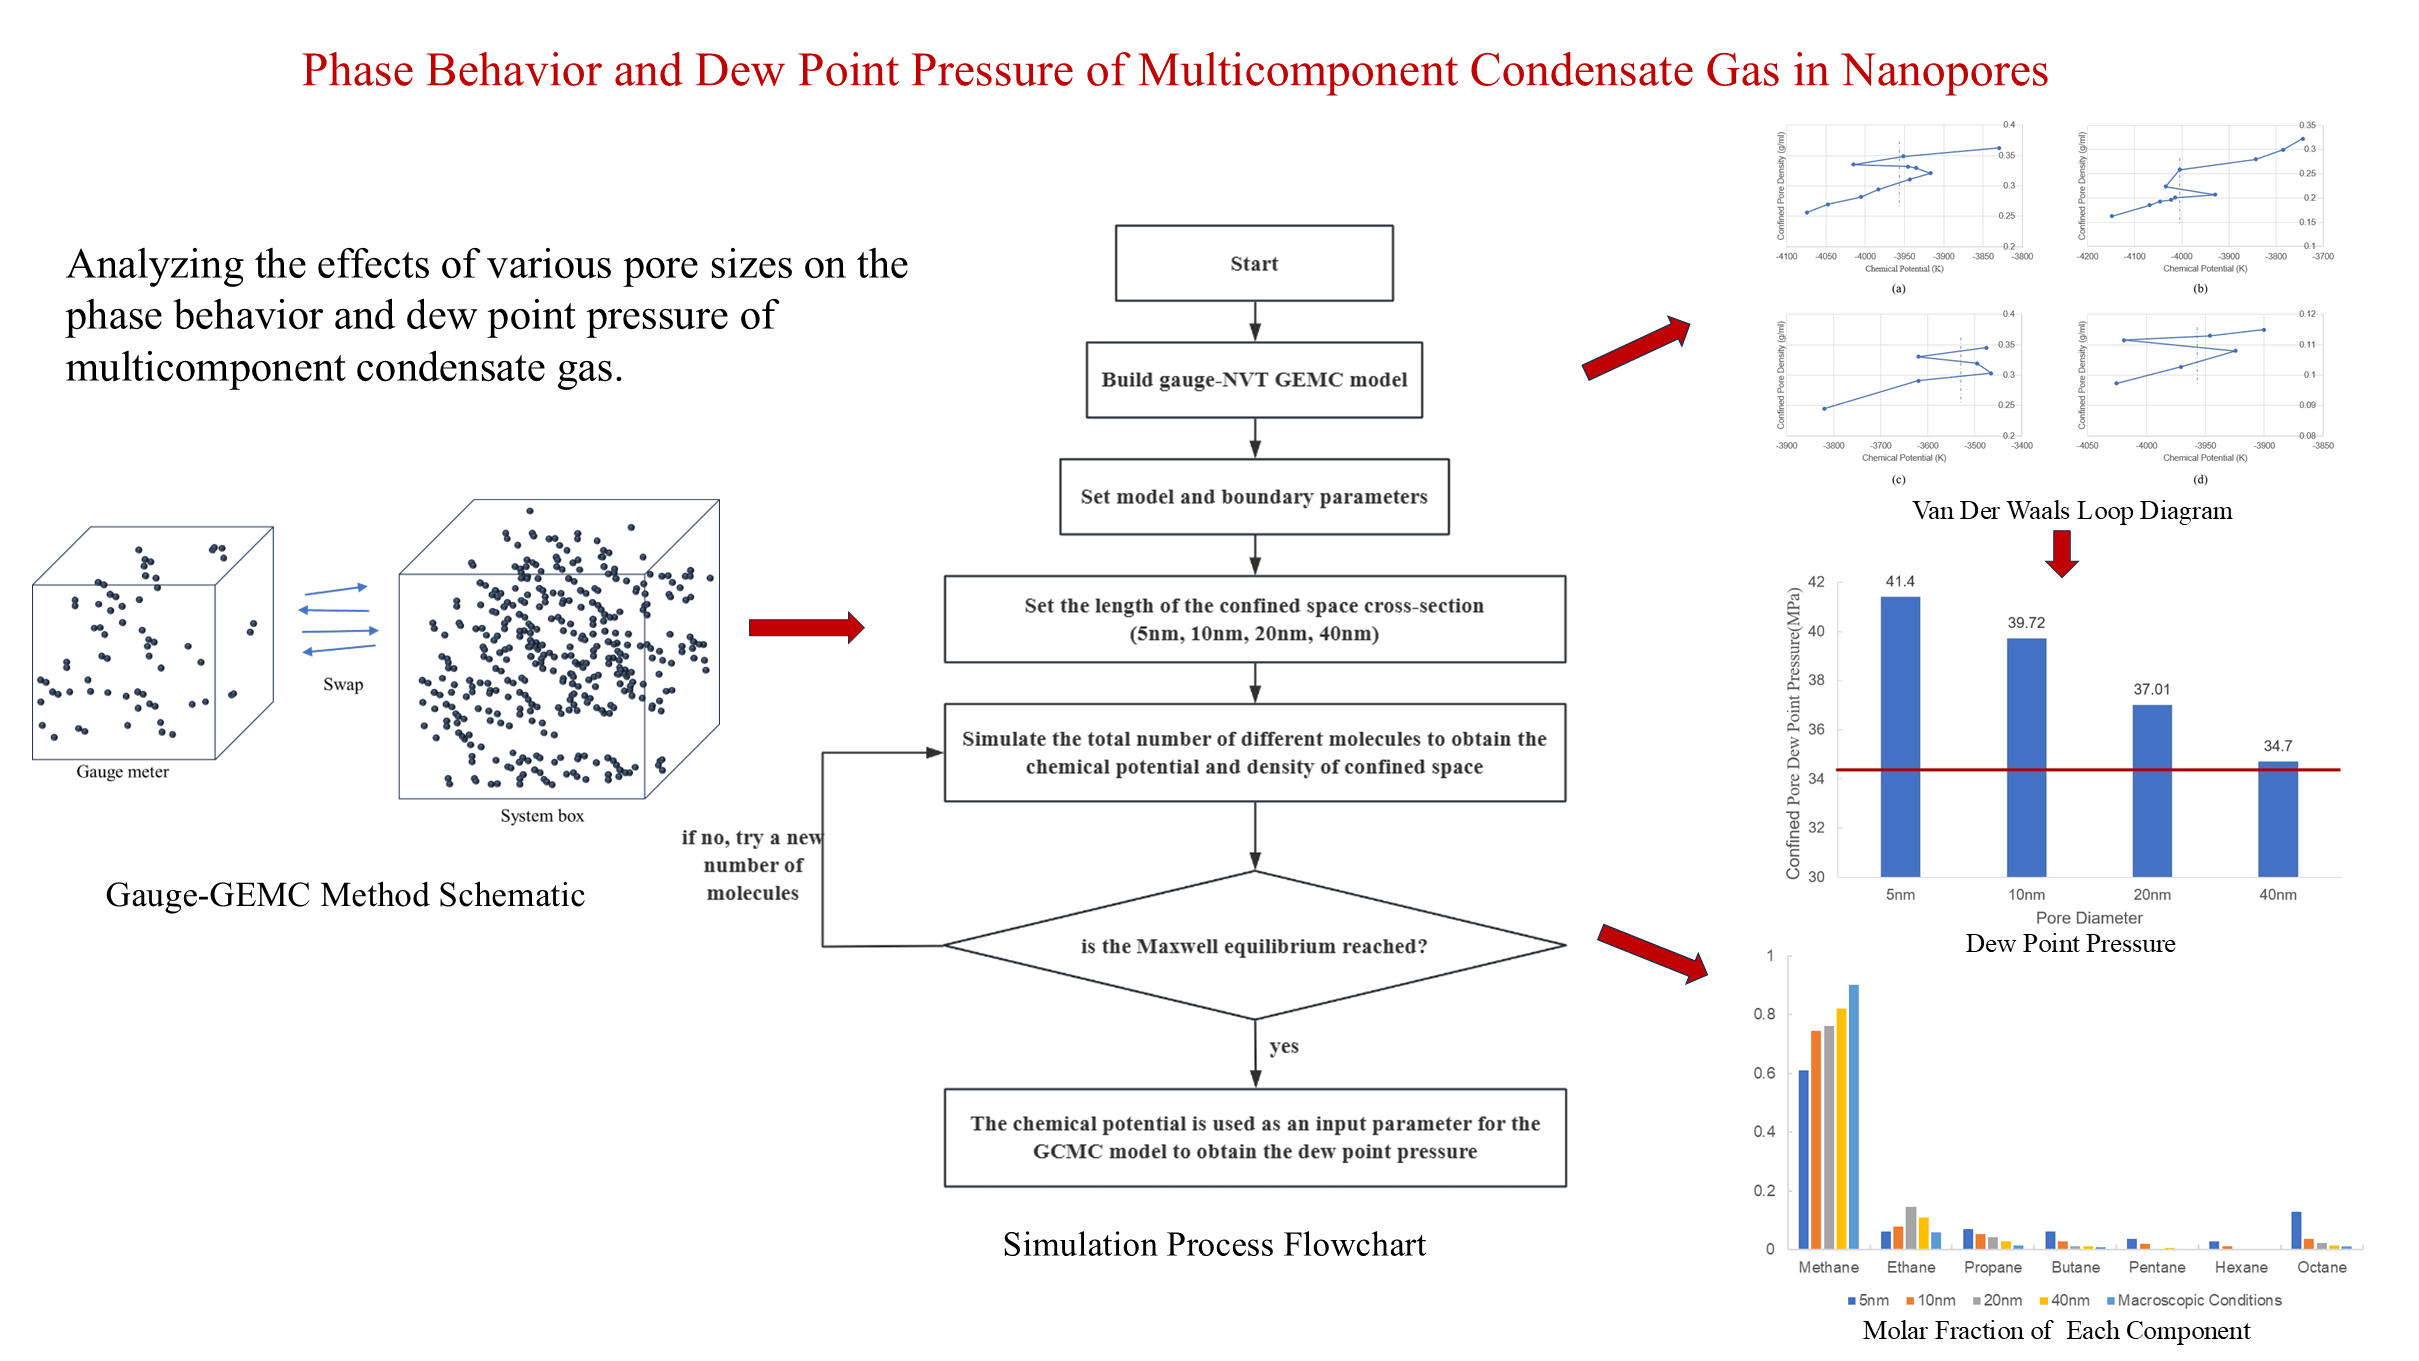
Shale gas reservoirs typically contain numerous nanoscale pores, with pore size playing a significant role in influencing the gas behavior. To better understand the related mechanisms, this study employs the Gauge-GEMC molecular simulation method to systematically analyze the effects of various pore sizes (5, 10, 20, and 40 nm) on the phase behavior and dew point pressure of the shale gas reservoir components. The simulation results reveal that when pore sizes are smaller than 40 nm, the dew point pressure increases significantly as the pore size decreases. For instance, the dew point pressure in 5 nm pores is 20.3% higher than under macroscopic conditions. Additionally, larger hydrocarbon molecules exhibit a tendency to aggregate in smaller pores, particularly in the 5–10 nm range, where the relative concentration of heavy hydrocarbons (C4+) increases markedly. Moreover, as the pore size becomes larger, the component distribution gradually aligns with experimental results observed under macroscopic conditions. This study demonstrates that pore effects are more pronounced for smaller sizes, directly influencing the aggregation of heavy hydrocarbons and the rise in dew point pressure. These phenomena could significantly impact the diffusivity of shale gas reservoirs and the recovery of condensate gas. The findings provide new theoretical insights into phase behavior changes in nanopores, offering valuable guidance for optimizing shale gas reservoir extraction strategies.Graphic Abstract
Keywords
Condensate gas reservoirs play a crucial role in natural gas development, producing primarily dry gas and high-quality light hydrocarbons, which have considerable economic benefits. However, the development of condensate gas reservoirs is more complicated than that of conventional gas reservoirs. In the initial reservoir conditions, the fluid in the reservoir exists primarily in a single gas phase. As the recovery progresses, the pressure in the reservoir gradually decreases, and when it falls below the dew point pressure, part of the condensate gas changes phase. The precipitated condensate oil clogs the pores, causing reservoir contamination, a sharp decline in permeability, reduced well productivity, decreased overall development efficiency, and generally low recovery rates for condensate gas. In recent years, research on phase behavior in shale condensate gas reservoirs has become a popular topic in natural gas phase behavior studies. As defined by the International Union of Pure and Applied Chemistry (IUPAC), pores are categorized into macropores (>50 nm), mesopores (2−50 nm), and micropores (<2 nm) [1]. Shale, as a representative tight rock, is characterized by its microporous structure, featuring a high proportion of nanometer-scale pores with extremely low porosity and permeability [2]. In pore networks, interactions take place both between fluid molecules and between the molecules and the pore walls. In larger pores, the interaction between molecules and the walls is negligible compared to the intermolecular interactions. However, in nanoscale pores, the properties of fluid molecules near the pore walls are strongly influenced by interactions with the walls. Devegowda et al. noted that when the ratio of pore diameter to molecular size is less than 20, the effect of pore proximity on fluid properties should be considered [3]. Numerous studies indicate that interactions among fluid molecules and between fluid molecules and pore walls increase in confined environments, potentially altering apparent physical properties such as critical characteristics, density, viscosity, wettability, and surface tension [4–7]. Luo et al. demonstrated the effects of nanoscale confinement on the bubble point of octane and decane binary mixtures using differential scanning calorimetry (DSC). The results clearly demonstrated the difference in bubble points between bulk fluids and confined fluids [8,9]. In nanoscale pores, confinement effects lead to significant differences in the thermodynamic properties and phase behavior of confined fluids compared to conventional fluids, causing changes in fluid behavior [10]. The phase behavior deviation of fluids in nanopores affects the overall phase behavior of the fluid, adding uncertainty to shale reservoir production. The PVT phase diagram effectively represents the phase behavior of fluids. Typically, phase diagrams are constructed using high-pressure PVT experimental methods, equations of state (EOS), and numerical approaches [11–14]. Laboratory studies provide direct evidence of phase behavior changes in pressurized fluids, but these studies are typically limited to light hydrocarbons under moderate to low temperature and pressure conditions, differing from actual reservoir conditions. The interaction between fluid molecules and pore walls plays a crucial role in determining the phase behavior of fluids within pores, but traditional PVT studies often do not account for this factor.
To better understand phase behavior in confined environments, molecular simulation methods can be used to study the phase behavior of fluids in nanopores. The fundamental principle of molecular simulation is to approximate the macroscopic properties of fluids by calculating the averages within statistical ensembles. The statistical ensemble represents a set of hypothetical independent thermodynamic systems in different microscopic states, all sharing the same macroscopic state. Molecular dynamics (MD) and Monte Carlo (MC) simulations are extensively applied in the study of confinement effects in nanopores. However, due to high computational cost, time step limitations, and sensitivity to initial conditions, the practical application of MD simulations in confined spaces such as shale is restricted [15]. In MC simulations, molecular system configurations are repeatedly generated and sampled, and the total system energy is calculated to determine the most probable configuration and the corresponding thermodynamic properties. For different systems, there are different constraints, so different MC simulation methods are needed to adapt to specific problems and conditions. In the study of phase behavior of confined fluids in shale reservoirs, Grand Canonical Monte Carlo (GCMC) simulation and Gibbs Ensemble Monte Carlo (GEMC) simulation are commonly used [15].
Many researchers have utilized GCMC simulations to study the phase behavior of confined fluids, including their critical properties and adsorption behavior in nanopores [16–20]. Due to its constant chemical potential, the GCMC method works for adsorption studies well. However, phase coexistence studies require extensive chemical potential calculations in various states, particularly for multicomponent systems. As the types and chain lengths of hydrocarbons increase, computation time grows exponentially, hindering its application in complex mixture studies and posing challenges for shale oil and gas research.
Panagiotopoulos conducted the GEMC simulation method to directly calculate phase coexistence points and their densities [21]. In GEMC simulations, phase coexistence points are calculated in a single step, avoiding the need for extensive chemical potential calculations to determine coexistence conditions. Pathak et al. applied GEMC simulations to investigate single component (decane) and binary mixtures (decane-methane with molar ratio 9:1) in 3.5 nm graphite slit pores [22]. Results showed that the critical temperature and critical density were both suppressed in confined pure decane and decane-methane binary mixtures. Some researchers have used the gauge cell method and MC simulations together, such as Gauge-GEMC and Gauge-GCMC [23,24]. Xing et al. applied the Gauge-GEMC method to investigate the phase change of methane in shale inorganic nanopores with pore sizes ranging from 2 to 20 nm under phase equilibrium and reservoir conditions. Their findings highlighted critical shifts in methane’s phase properties, emphasizing that confinement effects are strongly influenced by pore width and wall material [25]. Bi et al. studied methane’s phase behavior in single cylindrical pores (4–10 nm) using the Gauge-GEMC method. They calculated saturation pressures at various temperatures, demonstrating significant phase diagram shifts as pore size decreased. These studies are noteworthy for their exclusive focus on single-component methane systems, limiting their applicability to more complex, multicomponent scenarios in shale reservoirs [26].
In this study, the Gauge-GEMC molecular simulation method was introduced, targeting the actual fluid composition of a shale condensate gas reservoir in a certain block. The research aims to explore the phase behavior of multicomponent system in the nanoscale, reveal shale gas well production patterns, and provide theoretical foundation for optimizing gas injection production strategies.
Neimark et al. improved the Gauge-GEMC method for studying phase equilibrium in confined systems [24]. This method is an improvement based on the original GEMC technique [24,27]. The method includes two simulation boxes: one for the fluid system and a standard box with typically confined volume. The Gauge-GEMC method employs two types of MC moves (displacement and exchange) to calculate the chemical potential. In the standard box, additional GCMC moves are used to insert or delete molecules by the configurational bias Monte Carlo (CBMC). For a system containing M components, this method performs simulations under constant temperature (T), the volume of each box (V), chemical potentials (
The Gauge-GEMC simulation method performs millions of MC steps during the simulation to reach the global minimum of the system’s free energy, and then uses the Gauge-Gibbs Ensemble partition function to obtain macroscopic physical quantities of the molecular system. In each MC simulation step, an attempt is made to perform a type of MC move on the molecules, including translational movement of the molecular center of mass, rotational movement, and partial regeneration movement, while the volume of the simulation space is exchanged. The acceptance probabilities for the aforementioned MC molecular moves and volume exchanges are as follows:
Here,
After the system reaches equilibrium, the momentum, spatial positions of all particles, and system energy can be obtained. Using the partition function of the Gibbs ensemble, Eq. (5), macroscopic physical quantities can then be calculated.
Here,
In mixture systems, the intermolecular interactions are calculated using the Lorentz-Berthelot formula, as shown in the following equation:
Here,
2.3 Steele 10-4-3 Potential Surface
In the shale-confined condensate gas simulation, the Steele 10-4-3 potential formula is used to simulate shale rock walls. In the Steele 10-4-3 model, carbon nanotubes are used to approximate the molecular model of pore boundaries, as it has been widely used in previous simulation studies [28–32]. After constructing the pore wall using an extension of the Steele 10-4-3 potential [33,34], Eq. (6) is used to characterize the interaction forces between fluid particles and the pore wall, as shown in the following equations:
In the equation above,
In Eq. (10), the calculation methods for
PVT sampling was conducted in a well within a certain block, with a wellhead pressure of 19.387 MPa, sampling depth of 2200 m, and sampling point pressure of 24.594 MPa. The gas-oil ratio (GOR) was between 6700 and 1600 m3/m3. The collected samples were analyzed for downhole fluid composition, and the condensate gas composition results are shown in the Table 1.
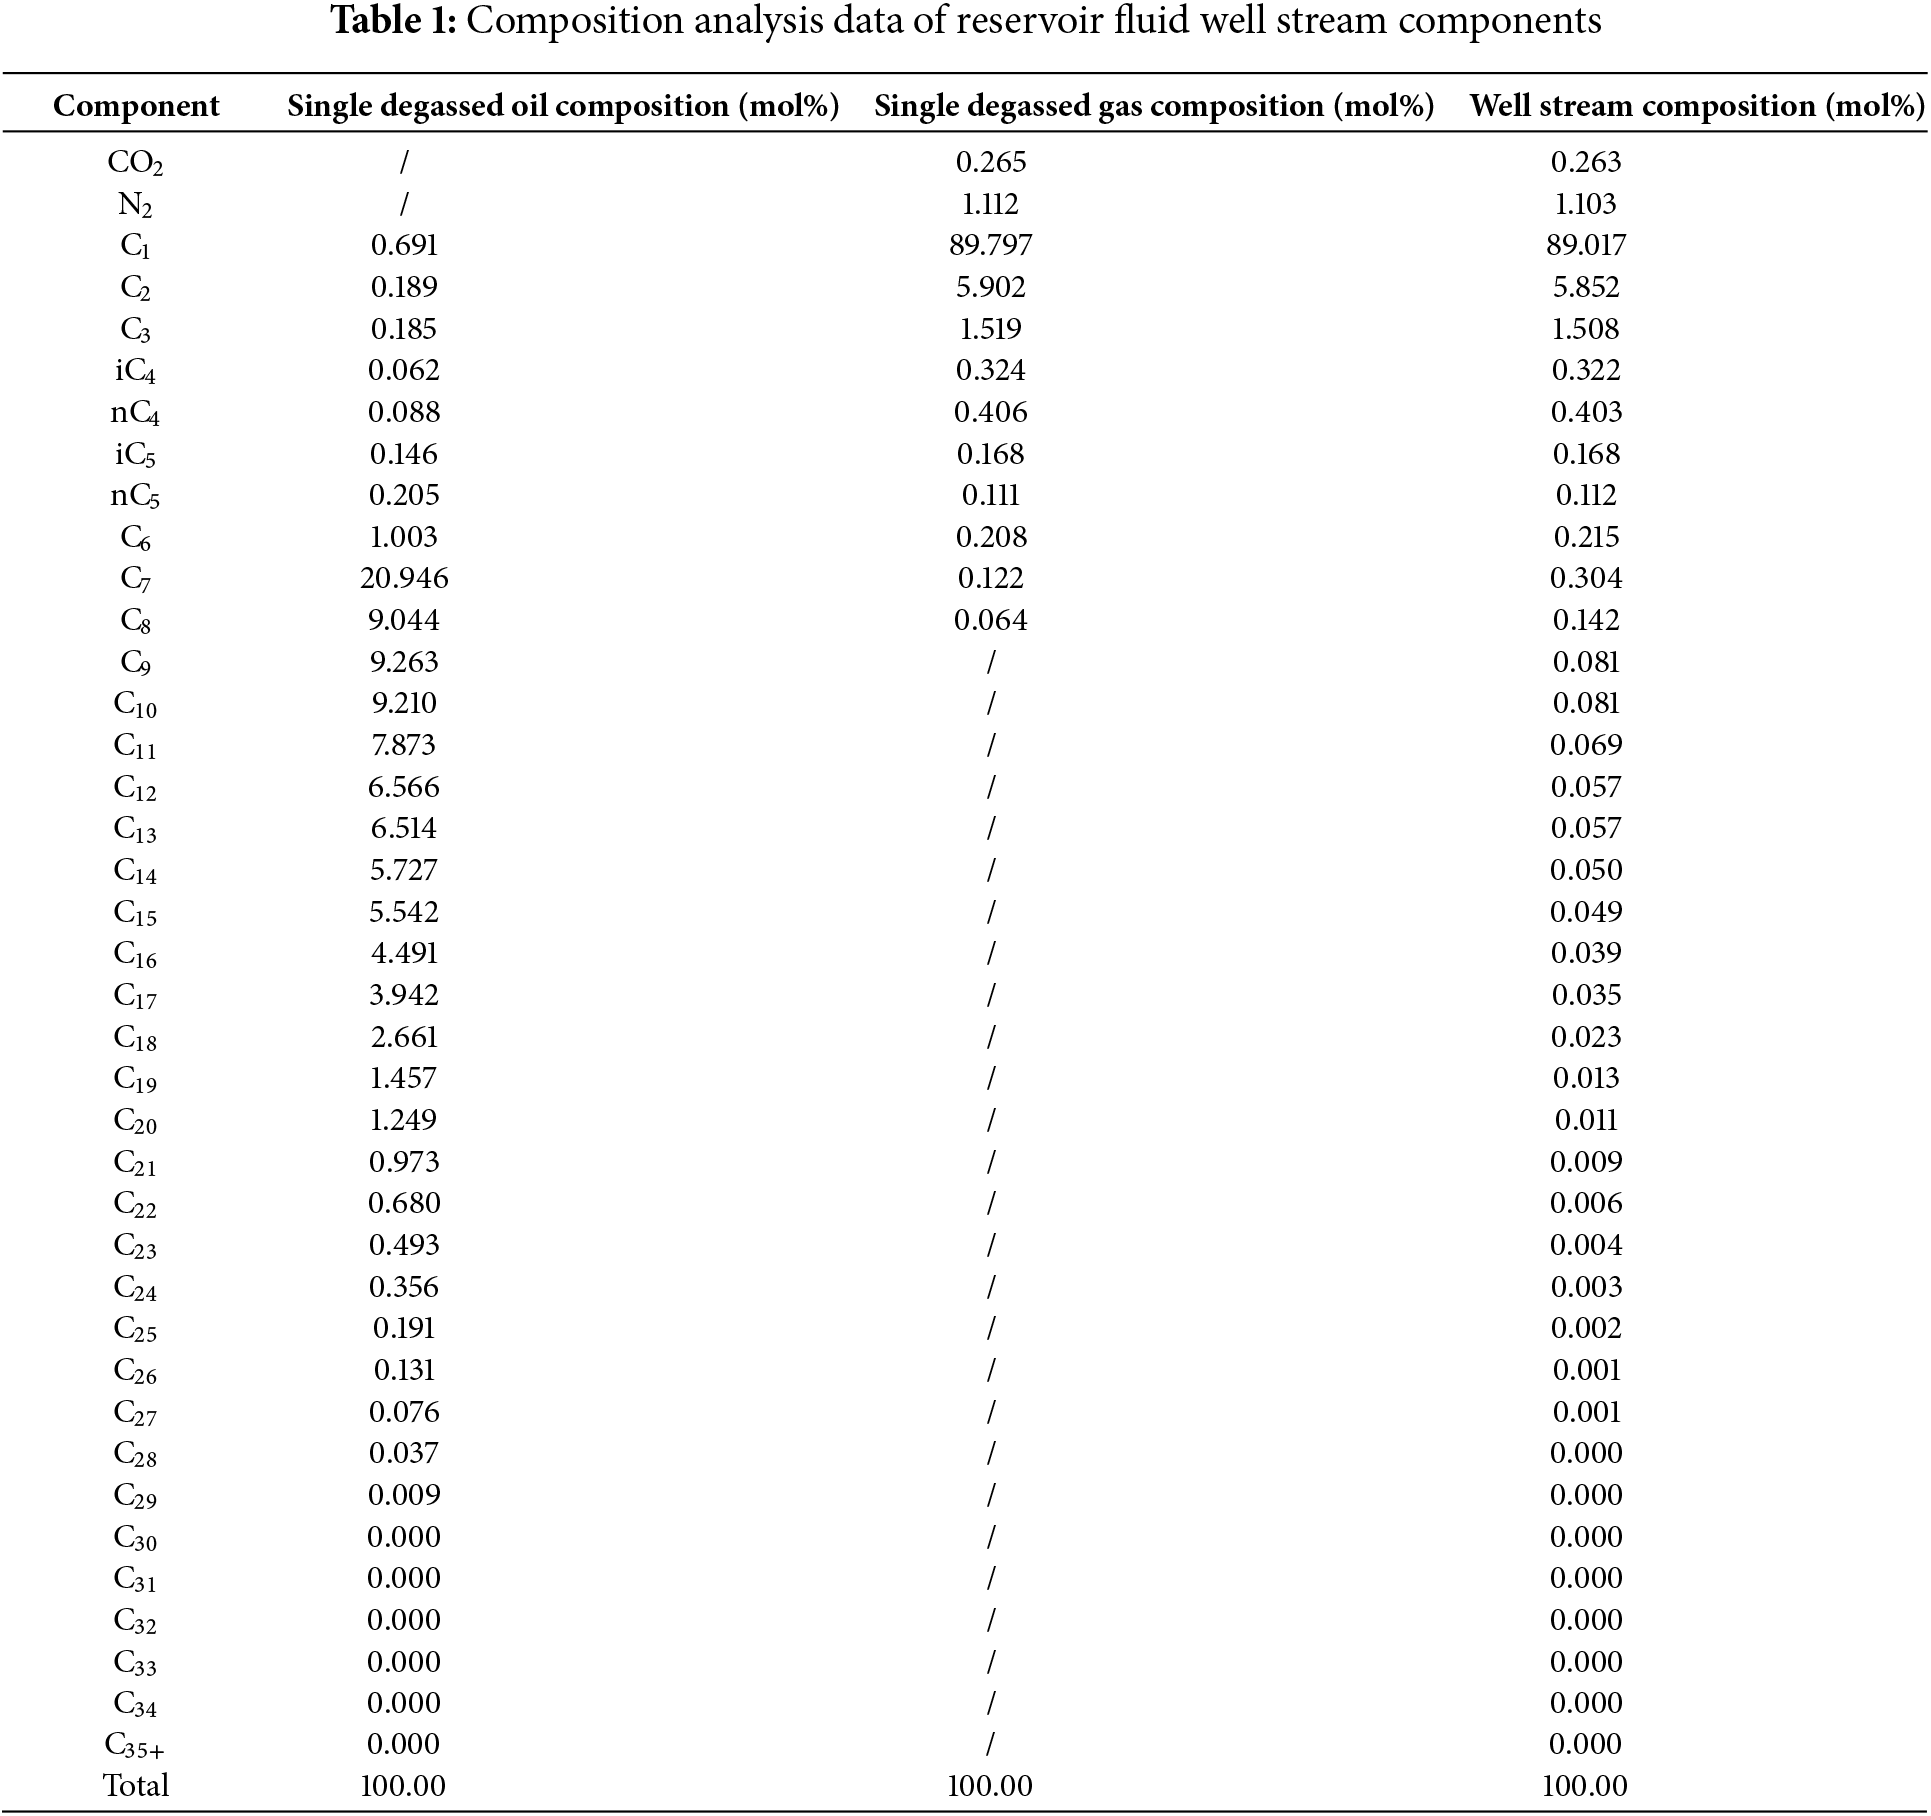
At 20°C and 0.101 MPa, the relative density of the single degassed fluid is 0.6309 g/cm3, with a gas-oil ratio of 12,629.9 m3/m3. The molar mass of C7+ is 152.21 g/mol with a relative density of 0.7941 g/cm3, and the molar mass of C21+ is 320.09 g/mol with a relative density of 0.8723 g/cm3. The condensate oil content is 60.2 g/m3, classifying it as a low-condensate-content type of condensate gas. The P-T phase diagram of a certain block well is shown in the Fig. 1.
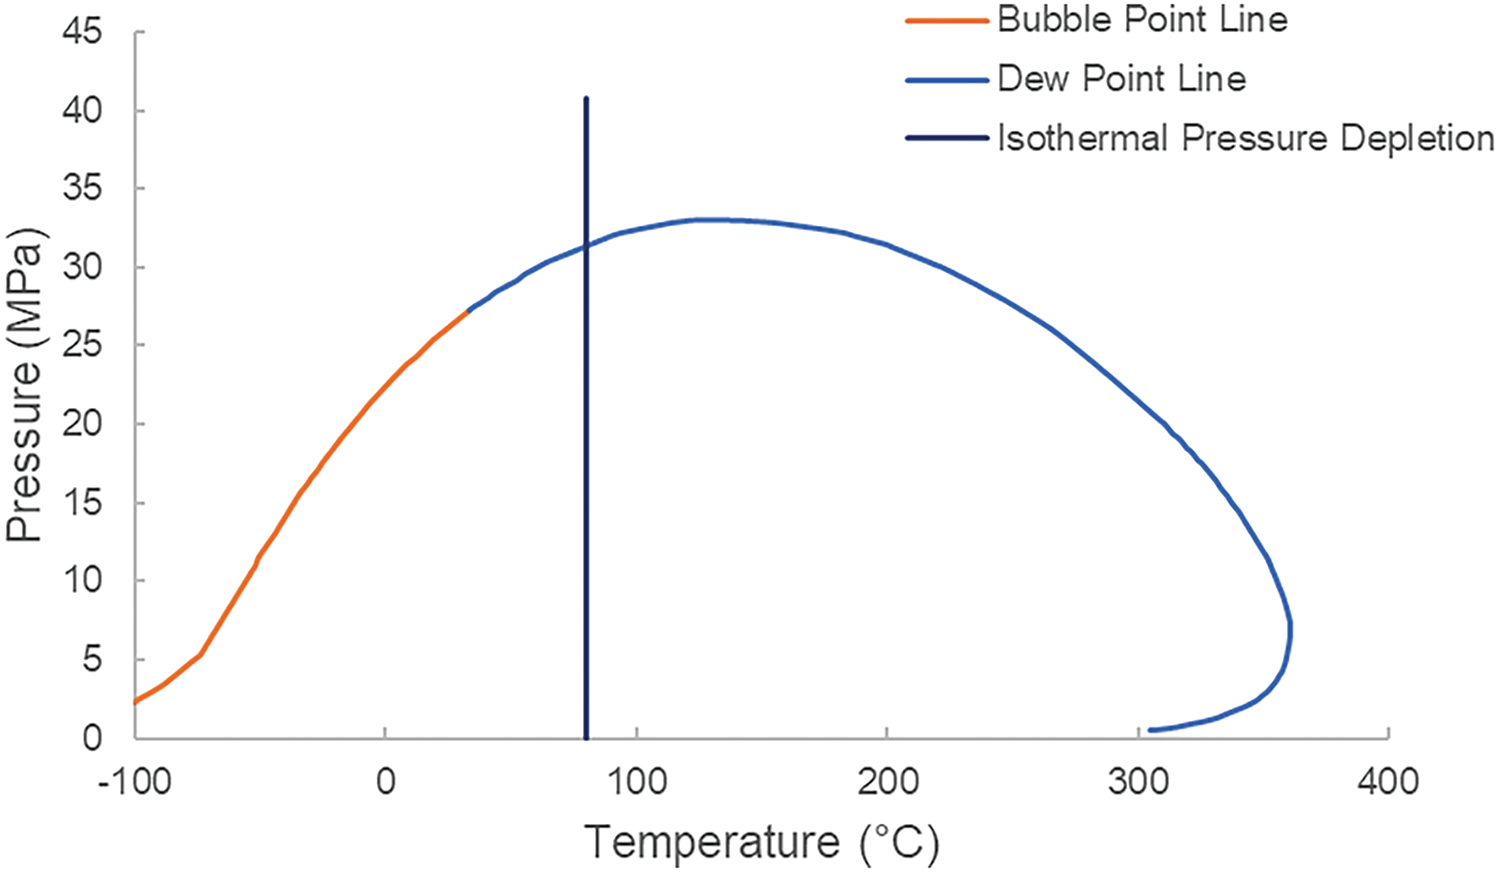
Figure 1: P-T Phase diagram of a well in a certain block
The formation pressure in a certain block is 40.78 MPa, with a dew point pressure of 34.4 MPa and a formation-dew pressure difference of 6.4 MPa.
According to measurements from the previous section on actual gas samples, the simulation composition has been adjusted to facilitate the modeling process. First, this study focuses exclusively on alkanes; therefore, carbon dioxide and nitrogen are omitted. Second, isomers are consolidated into their corresponding straight-chain alkanes. Finally, hydrocarbons with seven or more carbon atoms were represented by nonane. The detailed composition is shown in the Table 2.
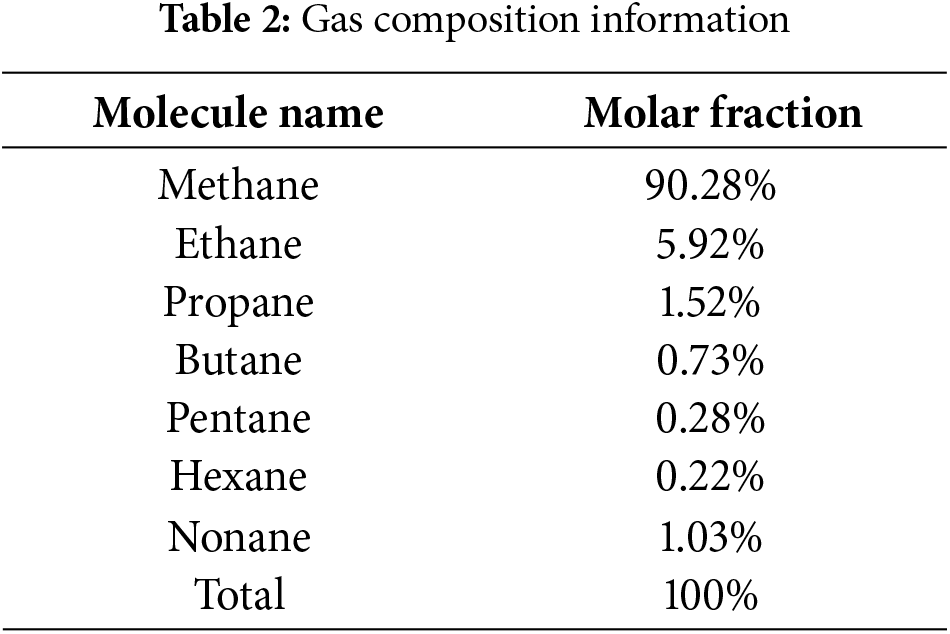
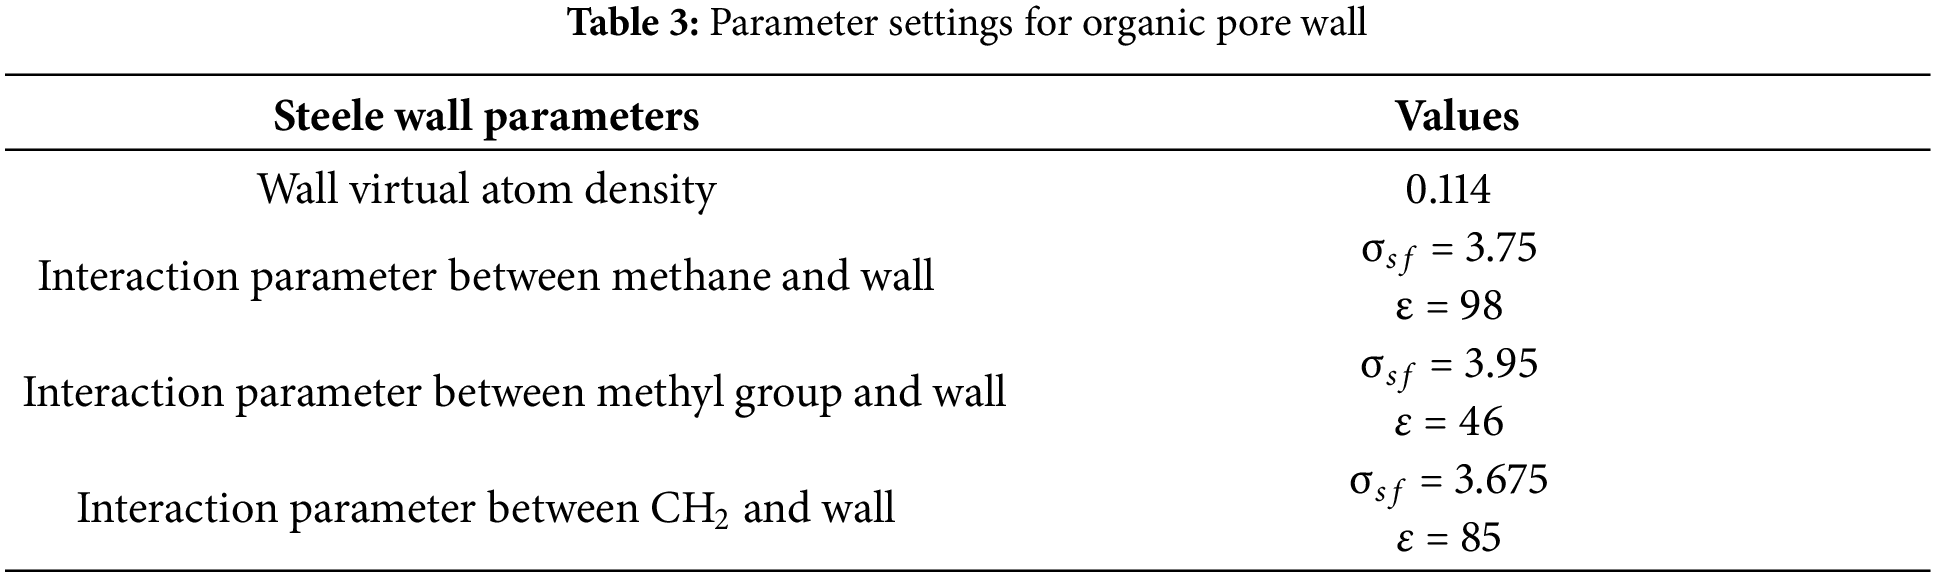
Based on gas composition information, molecular models of each component are initially constructed, with intermolecular interactions described using the Trappe-UA united atom force field. Since all components are electrically neutral, the Coulombic forces among molecules are ignored, and interactions among different atoms are mixed using the Lorentz-Berthelot rule. In the confined space box, walls in the xy directions are simulated as organic walls using the Steele 10-4-3 model (wall parameters shown in Table 3), with periodic boundary conditions set in the z direction. In the gauge box, periodic boundary conditions are set in all xyz directions. When molecules transfer between boxes, the biased transfer probability of molecular configurations and equal probability of molecular regeneration movements are considered.
The model simulation process is shown in the Fig. 2. After constructing the molecular model, molecules are filled into the Gauge-NVT GEMC model, and the temperature is 80°C, where molecular interaction parameters, boundary wall parameters, and cross-sectional lengths of the confined space are set. Simulations are performed for pore sizes of 5, 10, 20, and 40 nm. For each pore size, different total molecular counts are simulated, and van der Waals loop diagrams are plotted to obtain the Maxwell equilibrium point. The chemical potential results at the equilibrium position are then imported into the GCMC ensemble model to calculate the dew point pressure. All the simulations were run by the Towhee software [35].
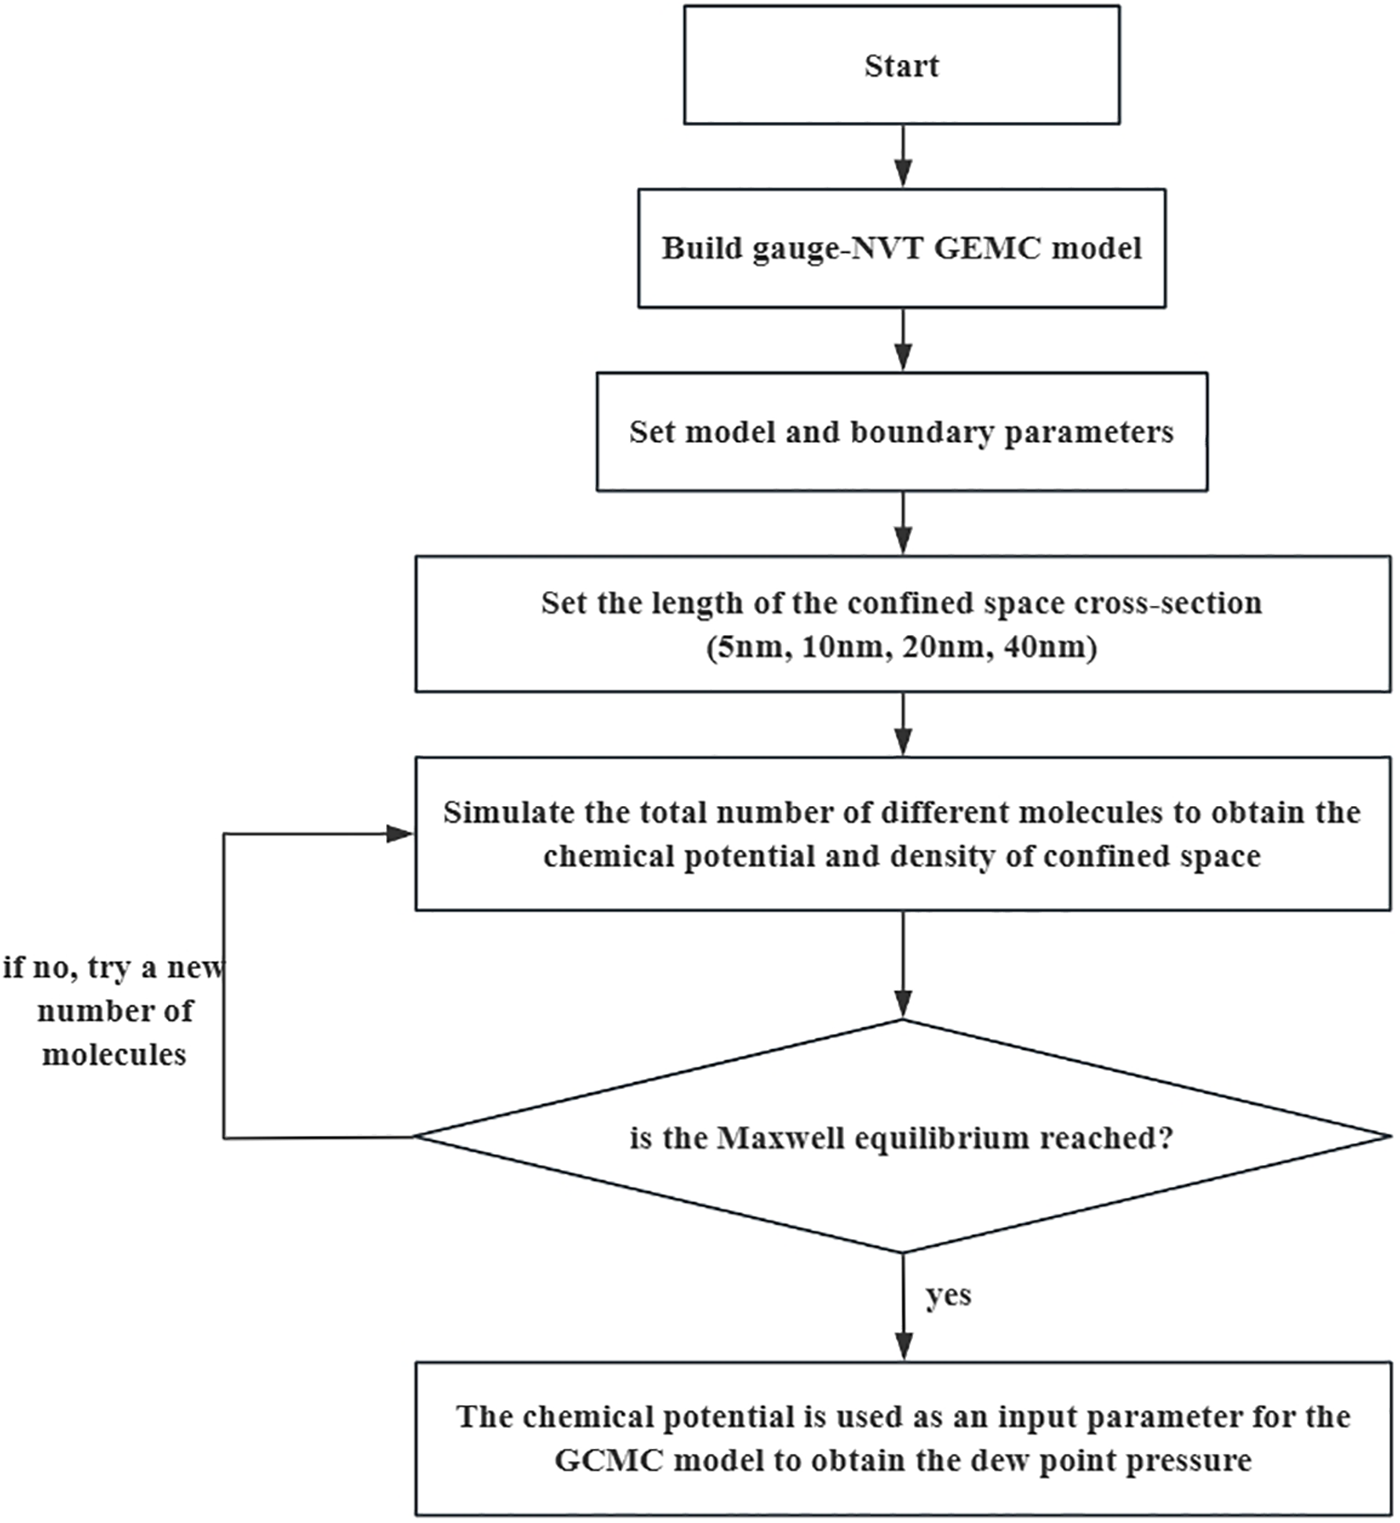
Figure 2: Simulation process flowchart
In this study, MC molecular simulation methods were used to simulate and analyze gas components in various nanopore sizes (5, 10, 20, and 40 nm), obtaining dew point pressure, chemical potential, component variation, and heavy hydrocarbon aggregation characteristics at each pore size.
Simulations were conducted on 5, 10, 20, and 40 nm pores, yielding chemical potential values at the Maxwell equilibrium points shown by dashed line of Fig. 3 are 3955.3, −4004.13, −3541.79, and −3963.76 K, respectively. By simulating the chemical potential with the grand canonical ensemble, the dew point pressures for each pore size were determined (Fig. 4). The dew point pressures for 5, 10, 20, and 40 nm pores are 41.4, 39.72, 37.01, and 34.7 MPa, respectively, while the dew point pressure measured in the laboratory is 34.4 MPa. The results reveal that as pore size increases, confinement effects gradually weaken, once the pore diameter is greater than 40 nm, the dew point pressure is nearly consistent with that under laboratory conditions. Conversely, as the pore diameter decreases, the dew point pressure of the fluid inside the pore gradually increases, reaching 41.4 MPa in the 5 nm pore.
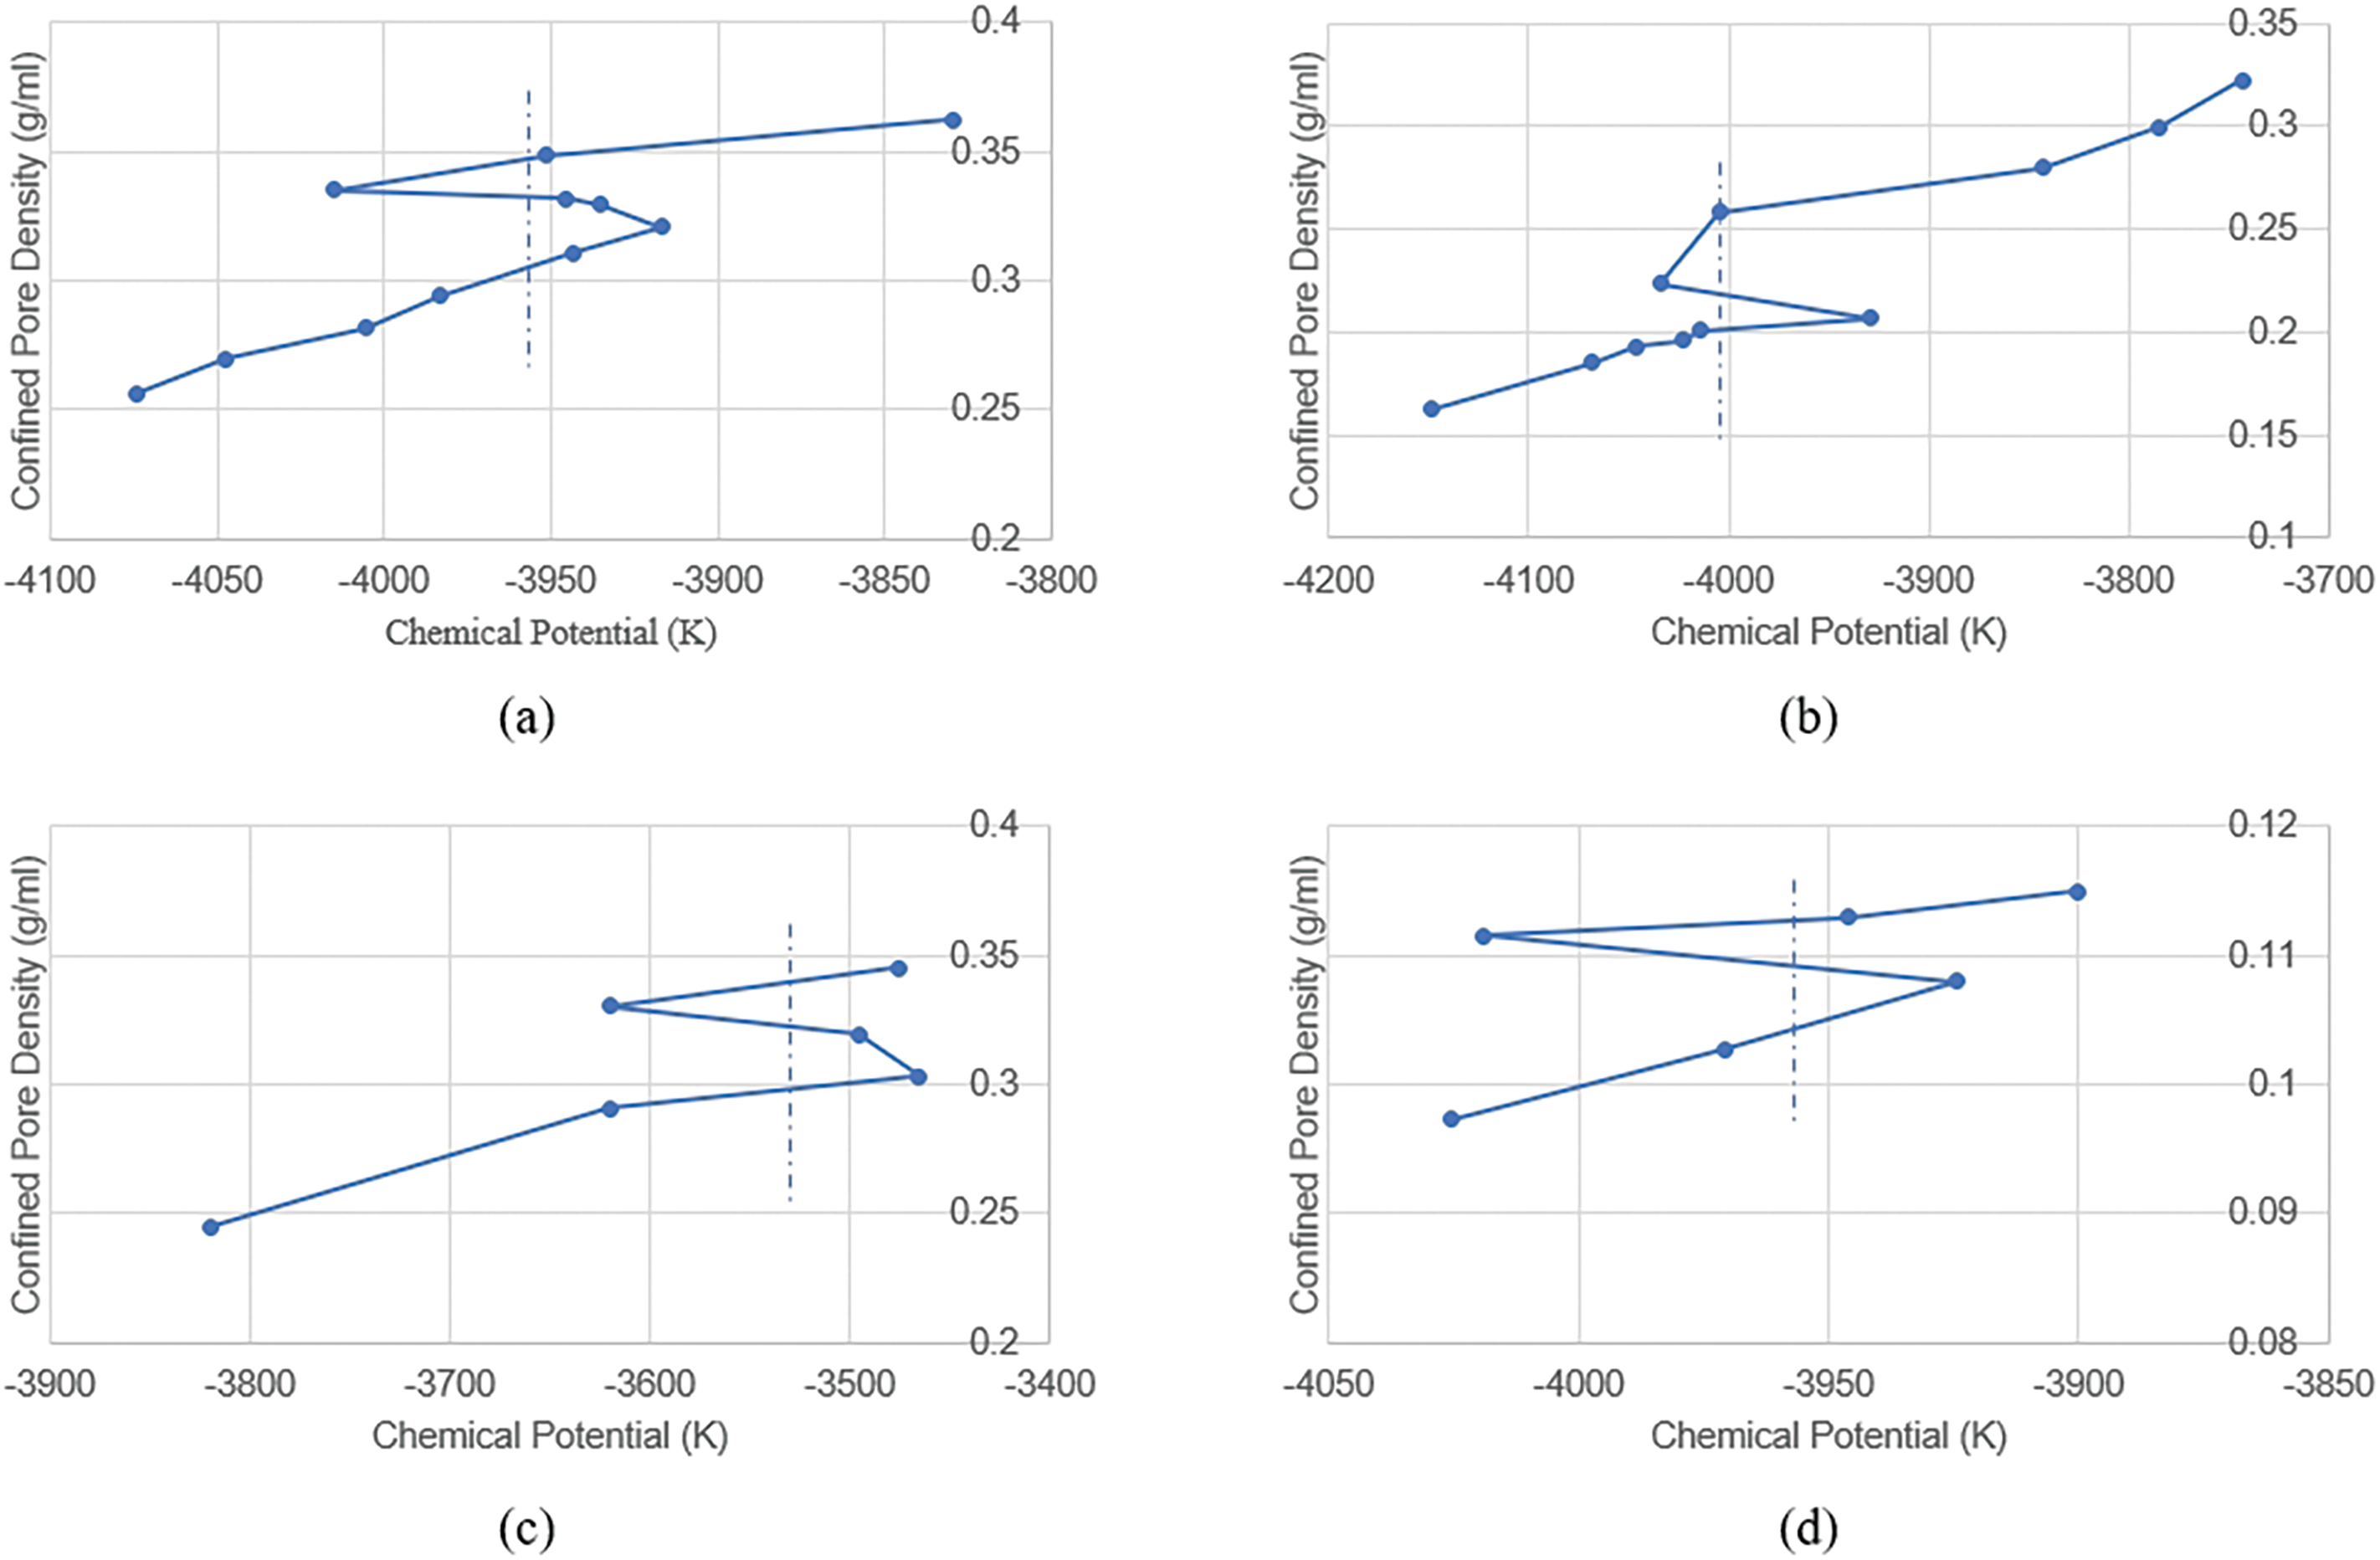
Figure 3: Relationship between chemical potential and density for different pore sizes (van der waals loop diagram): (a) 5 nm; (b) 10 nm; (c) 20 nm; (d) 40 m
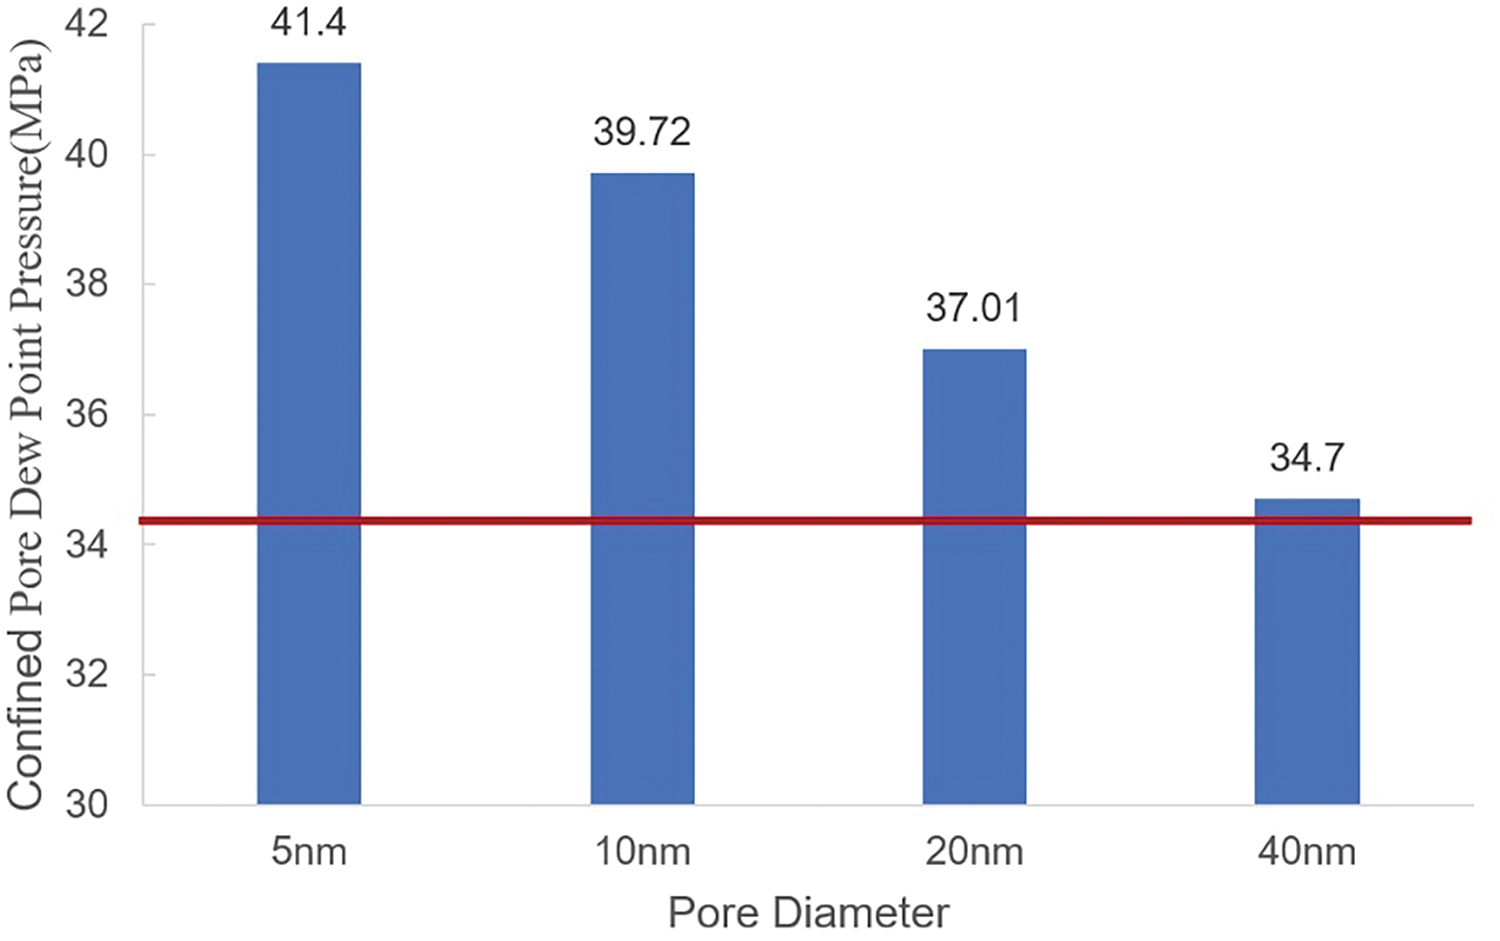
Figure 4: Comparison of dew point pressure for different pore sizes with experimental dew point pressure (red line)
During the simulation, the proportion of each component in different pore sizes was analyzed (Fig. 5). The results display that with increasing pore size, methane content gradually increases, while the content of other heavy hydrocarbons (propane and above) decreases. This suggests that methane is more prevalent in larger pores, while heavier hydrocarbons tend to concentrate in smaller pores. Data indicate that, excluding methane and ethane, the content of propane and higher alkanes increases significantly with decreasing pore size. For example, the butane and pentane contents in 5 nm pores are 0.060 and 0.036, respectively, while their content is lower or even zero under macroscopic conditions. This indicates that smaller pores facilitate the aggregation of heavy hydrocarbons, possibly due to intermolecular interactions and confinement effects. Component contents in 20 and 40 nm pores are relatively similar to those under macroscopic conditions, whereas significant differences are observed in 5 and 10 nm pores. This comparison illustrates the differences between laboratory macroscopic conditions and pore effects at the nanoscale, establishing a basis for comparing experimental results with actual conditions within nanopores. By further analyzing the differences between various pore sizes and macroscopic conditions, it is possible to evaluate the reliability and bias of laboratory data when applied to nanopore systems.
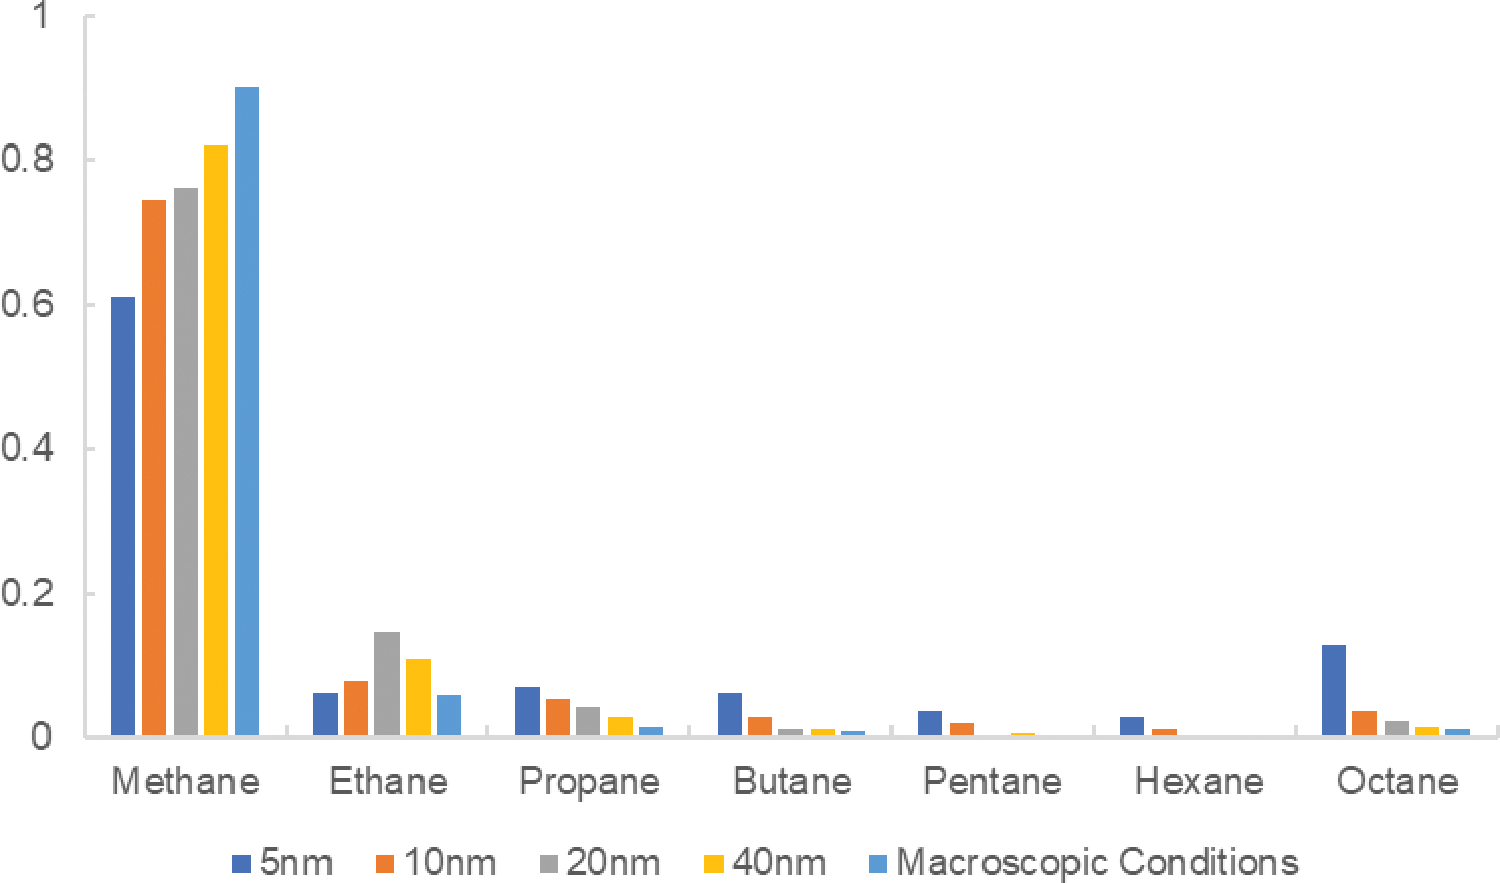
Figure 5: Variation in molar fraction of each component for different pore sizes
Based on molecular dynamics simulation results, the component number density at dew point pressure for each pore size has been obtained. By integrating the shale pore distribution map (Fig. 6), the mass fractions of heavy hydrocarbon components in 5, 10, 20, and 40 nm pores can be calculated (Fig. 7). The results show that if the pressure drops to the dew point pressure of the 5 nm pore, the mass of C4+ alkanes in the 5 nm pore constitutes 37.1% of the total C4+ mass, meaning over one-third of C4+ aggregates in the 5 nm pore. However, as the pore size increases gradually to 10 nm, the heavy hydrocarbon mass fraction significantly decreases.
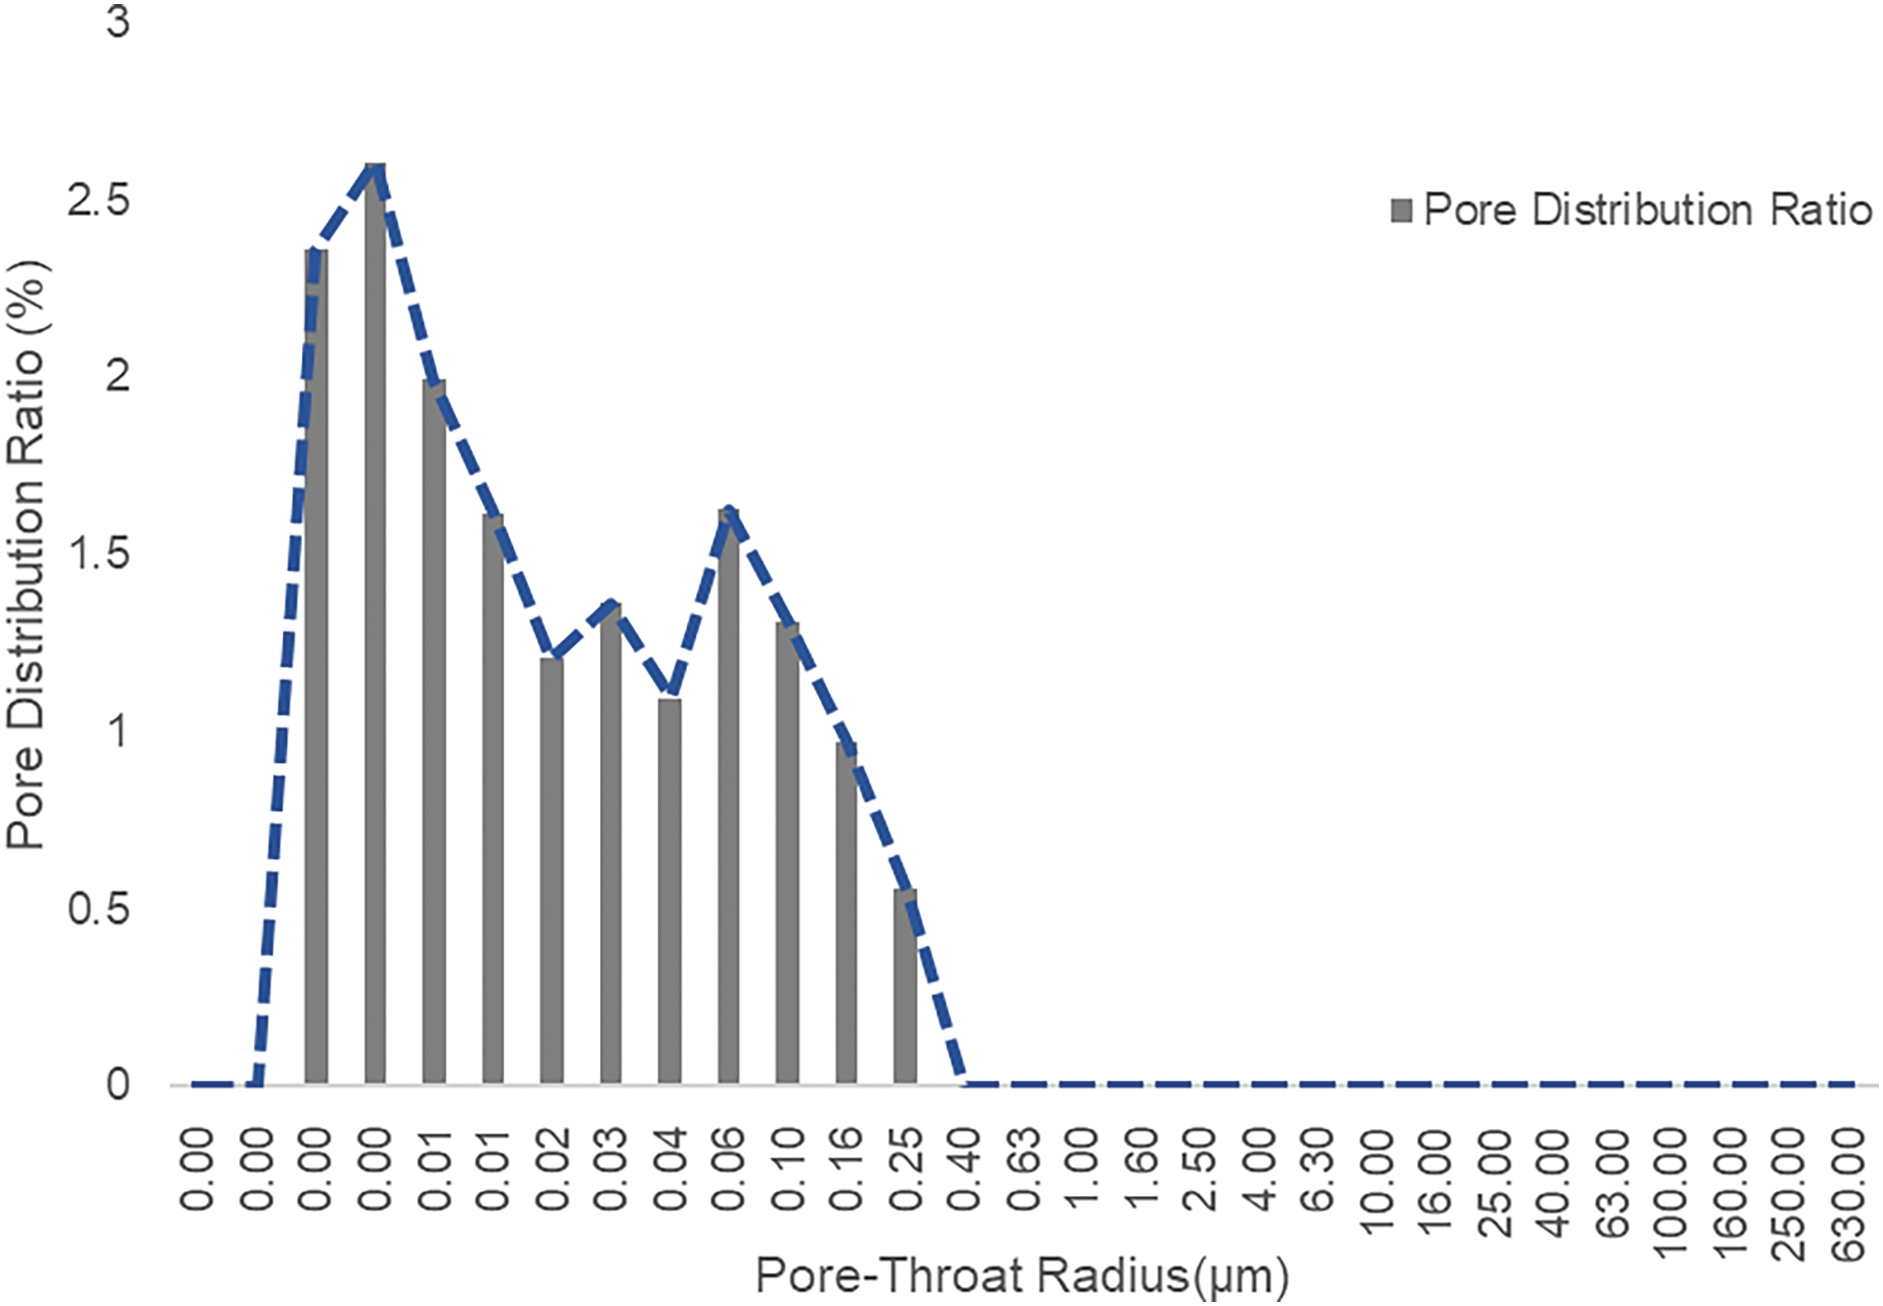
Figure 6: Pore distribution frequency diagram
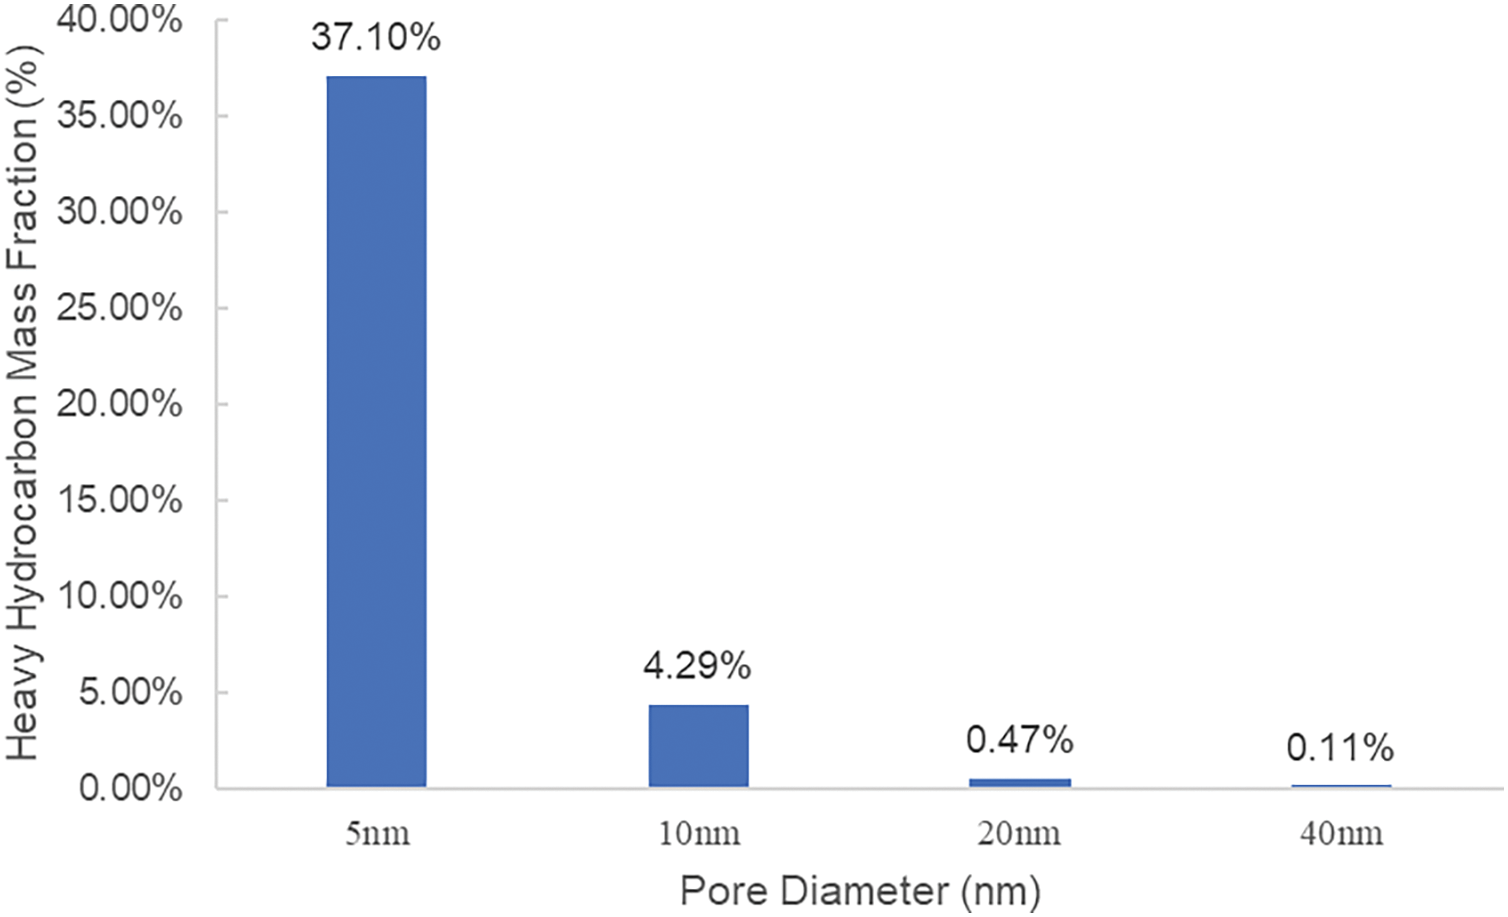
Figure 7: Mass fraction distribution of heavy hydrocarbons in different pore sizes
Simulation results indicate a notable effect of nanopores on the dew point pressure and component distribution of condensate gas. The simulation results for multicomponent condensate gas reservoirs show that when the pore size exceeds 40 nm, the dew point pressure is nearly consistent with that measured in the laboratory (with a difference of around 1%). However, when the pore size is less than 40 nm, the dew point pressure inside the pore gradually increases as the pore size decreases. In 5 nm pores, the dew point pressure can reach 41.4 MPa, 20.3% higher than under macroscopic experimental conditions (Fig. 8). This indicates that when the pore size is 40 nm or larger, the confinement effect on the dew point pressure is minor, while in smaller pores, the effect is more pronounced.
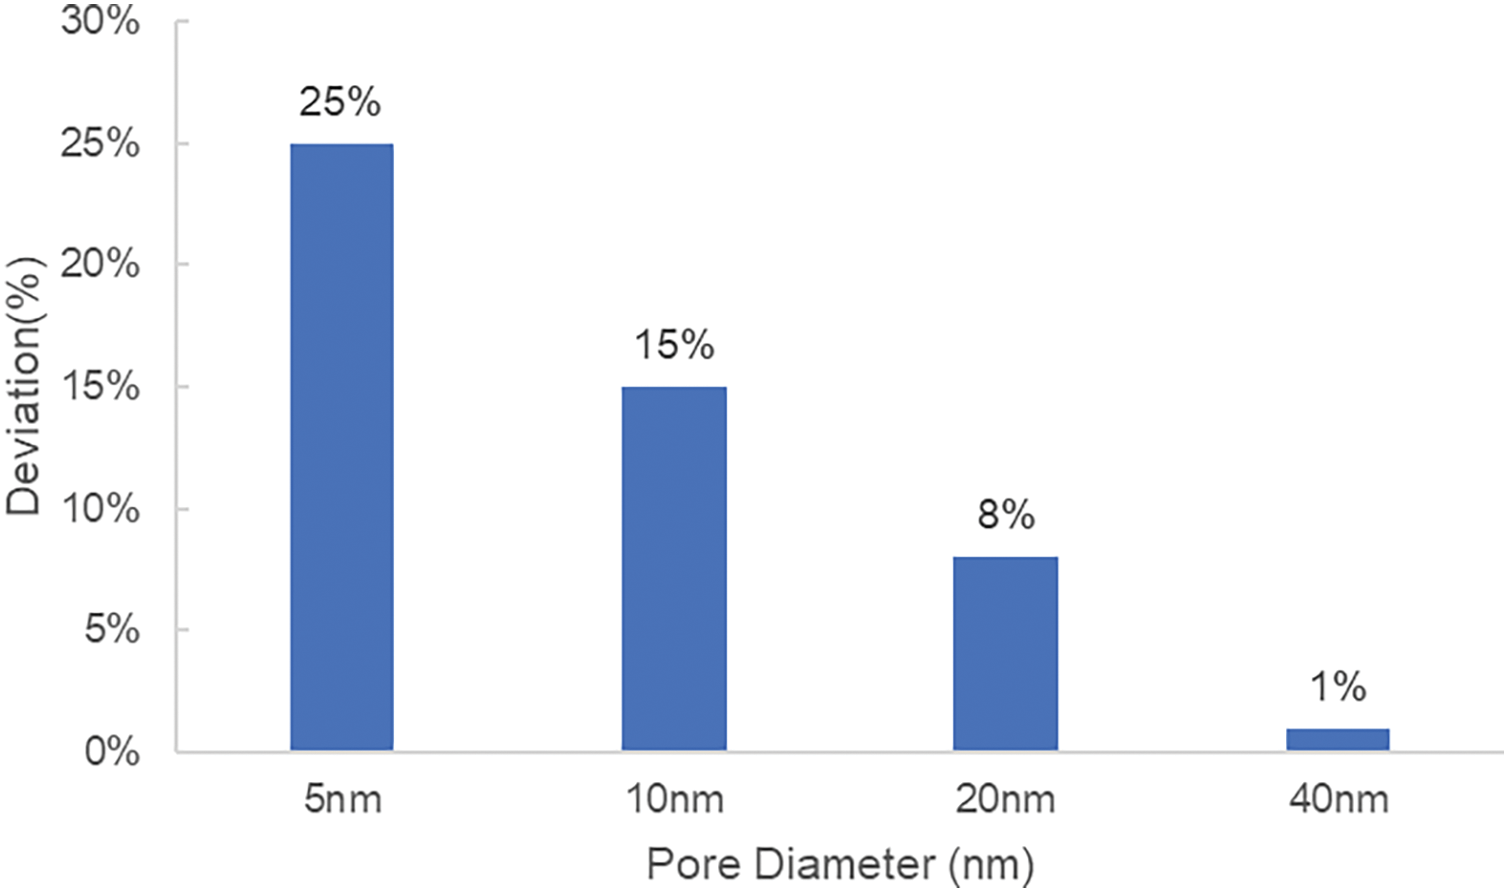
Figure 8: Degree of dew point pressure deviation from bulk phase dew point pressure for different pore sizes
As the pressure decreases, propane and higher-chain alkanes, excluding methane and ethane, tend to accumulate in smaller pores. In particular, the heavy hydrocarbon content in 5 nm pores can account for 37.1% of all heavy hydrocarbons, while pores around 5 nm in size make up only 6% of the total pore volume. As the pore size increases, the component distribution gradually aligns with macroscopic laboratory results. This may be due to the limited freedom of larger hydrocarbon molecules in nanopores, causing these molecules to more readily accumulate in smaller pores.
This study analyzed the effects of different nanopore sizes on the phase behavior and dew point pressure of gas components in shale gas reservoirs using molecular simulation methods. The conclusions are as follows:
1. Pore size significantly affects the dew point pressure of gases, especially when the pore size is less than 40 nm, where the dew point pressure increases notably. In 5 nm pores, the dew point pressure reaches 41.4 MPa, 20.3% higher than the dew point pressure under laboratory conditions.
2. Heavy hydrocarbon components (C4+ and above) show a significant tendency to accumulate in smaller pores, especially in pores of 5–10 nm, where heavy hydrocarbon content increases considerably. Experimental results show that the content of chain alkanes, from propane onward, increases as pore size decreases, excluding methane and ethane. At the dew point pressure (34.4 MPa), heavy hydrocarbons in 5 nm pores account for 37.1% of the total heavy hydrocarbon mass, with pores under 40 nm adsorbing up to 41.8% of the heavy hydrocarbons.
3. Exceeding 40 nm of the pore size, the dew point pressure closely matches laboratory data, but confinement effects still have some influence on the dew point pressure, particularly in smaller pores where the effect is more pronounced.
4. This study provides a new theoretical basis for understanding phase behavior changes within nanopores, aiding in the optimization of extraction strategies and technical decision-making for condensate-rich shale gas reservoirs. It is particularly valuable for enhancing reservoir development efficiency and optimizing extraction technology.
Acknowledgement: None.
Funding Statement: This work was financially supported by the Hubei Province Education Department of China (Project Name: Research on the Formation Mechanism and Microscopic Characteristics of Tight Dolomite Reservoirs in Salt Lake Basins: A Case Study of the Xingouzui Formation in the Jianghan Basin, Grant No. B2020032).
Author Contributions: Jichao Zhao: Conceptualization, Software, Writing—Original Draft, Writing—Review & Editing; Xu Yan: Conceptualization, Methodology; Jing Sun: Methodology, Supervision; Sheng Li: Resources. All authors reviewed the results and approved the final version of the manuscript.
Availability of Data and Materials: The datasets generated and/or analyzed during the current study are not publicly available due to classified requirement by the original source but are available from the corresponding author on reasonable request.
Ethics Approval: Not applicable.
Conflicts of Interest: The authors declare no conflicts of interest to report regarding the present study.
Abbreviations
| PVT | Pressure-Volume-Temperature, used to describe the state of fluids under varying conditions |
| GEMC | Gibbs Ensemble Monte Carlo, a simulation method used to study phase coexistence in confined systems |
| GCMC | Grand Canonical Monte Carlo, a simulation method used for adsorption and phase behavior studies |
| Maxwell Equilibrium Point | The point of balance in a phase diagram, determined using van der Waals loop and related to phase coexistence |
| CBMC | Configurational-Bias Monte Carlo, a technique in Monte Carlo simulations used to manage molecular configurations in systems with strong confinements. |
| C4+ | Heavy hydrocarbon components with four or more carbon atoms |
References
1. Rouquerol J, Avnir D, Fairbridge CW, Everett DH, Haynes JM, Pernicone N, et al. Recommendations for the characterization of porous solids (technical report). Pure Appl Chem. 1994 Jan 1;66(8):1739–58. doi:10.1351/pac199466081739. [Google Scholar] [CrossRef]
2. Yu H, Xu H, Fan J, Zhu YB, Wang F, Wu H. Transport of shale gas in microporous/nanoporous media: molecular to pore-scale simulations. Energy Fuels. 2021 Jan 21;35(2):911–43. doi:10.1021/acs.energyfuels.0c03276. [Google Scholar] [CrossRef]
3. Devegowda D, Sapmanee K, Civan F, Sigal R. Phase behavior of gas condensates in shales due to pore proximity effects: implications for transport, reserves and well productivity. Paper presented at: SPE Annual Technical Conference and Exhibition; 2012 Oct; San Antonio, TX, USA. doi:10.2118/160099-MS. [Google Scholar] [CrossRef]
4. Wang J, Wu S, Li Q, Zhang J, Guo Q. Characterization of the pore-throat size of tight oil reservoirs and its control on reservoir physical properties: a case study of the Triassic tight sandstone of the sediment gravity flow in the Ordos Basin. China J Pet Sci Eng. 2020 Mar;186(20):106701. doi:10.1016/j.petrol.2019.106701. [Google Scholar] [CrossRef]
5. Sapmanee K. Effects of pore proximity on behavior and production prediction of gas/condensate [MS thesis]. USA: Mewbourne School of Petroleum and Geological Engineering, University of Oklahoma; 2011. [Google Scholar]
6. Firincioglu T, Ozkan E, Ozgen C. Thermodynamics of multiphase flow in unconventional liquids-rich reservoirs. Paper presented at: SPE Annual Technical Conference and Exhibition; 2012 Oct; San Antonio, TX, USA. doi:10.2118/159869-MS. [Google Scholar] [CrossRef]
7. Feng D, Bakhshian S, Wu K, Song Z, Ren B, Li J, et al. Wettability effects on phase behavior and interfacial tension in shale nanopores. Fuel. 2021 Apr;290(15):119983. doi:10.1016/j.fuel.2020.119983. [Google Scholar] [CrossRef]
8. Luo S, Nasrabadi H, Lutkenhaus JL. Effect of confinement on the bubble points of hydrocarbons in nanoporous media. AIChE J. 2016 May 1;62(5):1772–80. doi:10.1002/aic.15154. [Google Scholar] [CrossRef]
9. Luo S, Lutkenhaus JL, Nasrabadi H. Experimental study of confinement effect on hydrocarbon phase behavior in nano-scale porous media using differential scanning calorimetry. Paper presented at: SPE Annual Technical Conference and Exhibition; 2015 Sep; Houston, TX, USA. doi:10.2118/175095-MS. [Google Scholar] [CrossRef]
10. Vishnyakov A, Piotrovskaya EM, Brodskaya EN, Votyakov EV, Tovbin YK. Critical properties of lennard-jones fluids in narrow slit-shaped pores. Langmuir. 2001;17(14):4451–8. doi:10.1021/la001641a. [Google Scholar] [CrossRef]
11. Cai J, Jiao X, Wang H, He W, Xia Y. Multiphase fluid-rock interactions and flow behaviors in shale nanopores: a comprehensive review. Earth-Sci Rev. 2024 Oct;257(2):104884. doi:10.1016/j.earscirev.2024.104884. [Google Scholar] [CrossRef]
12. Wang P, Huang S, Zhao F, Shi J, Wang B, Li Y. Modeling phase behavior of nano-confined fluids in shale reservoirs with a modified Soave-Redlich-Kwong equation of state. Chem Eng J. 2022 Apr;433(2):133661. doi:10.1016/j.cej.2021.133661. [Google Scholar] [CrossRef]
13. Al-Kindi I, Babadagli T. Revisiting Kelvin equation and Peng-Robinson equation of state for accurate modeling of hydrocarbon phase behavior in nano capillaries. Sci Rep. 2021 Mar 22;11(1):6573. doi:10.1038/s41598-021-86075-8. [Google Scholar] [PubMed] [CrossRef]
14. Song Y, Song Z, Feng D, Qin J, Chen Y, Shi Y, et al. Phase behavior of hydrocarbon mixture in shale nanopores considering the effect of adsorption and its induced critical shifts. Ind Eng Chem Res. 2020 Apr 29;59(17):8374–82. doi:10.1021/acs.iecr.0c00490. [Google Scholar] [CrossRef]
15. Liu X, Zhang D. A review of phase behavior simulation of hydrocarbons in confined space: implications for shale oil and shale gas. J Nat Gas Sci Eng. 2019 Aug 1;68:102901. doi:10.1016/j.jngse.2019.102901. [Google Scholar] [CrossRef]
16. Hamada Y, Koga K, Tanaka H. Phase equilibria and interfacial tension of fluids confined in narrow pores. J Chem Phys. 2007 Aug 28;127(8):084908. doi:10.1063/1.2759926. [Google Scholar] [PubMed] [CrossRef]
17. Coasne B, Alba-Simionesco C, Audonnet F, Dosseh G, Gubbins KE. Adsorption and structure of benzene on silica surfaces and in nanopores. Langmuir. 2009;25(18):10648–59. doi:10.1021/la900984z. [Google Scholar] [PubMed] [CrossRef]
18. Didar BR, Akkutlu IY. Pore-size dependence of fluid phase behavior and properties in organic-rich shale reservoirs. Paper presented at: SPE International Symposium on Oilfield Chemistry; 2013 Apr; The Woodlands, TX, USA. doi:10.2118/164099-MS. [Google Scholar] [CrossRef]
19. Lowry E, Piri M. Effects of chemical and physical heterogeneity on confined phase behavior in nanopores. Micropor Mesopor Mater. 2018 Jun 1;263:53–61. doi:10.1016/j.micromeso.2017.11.045. [Google Scholar] [CrossRef]
20. Pitakbunkate T, Balbuena PB, Moridis GJ, Blasingame TA. Effect of confinement on pressure/volume/temperature properties of hydrocarbons in shale reservoirs. SPE J. 2016;21(02):621–34. doi:10.2118/170685-PA. [Google Scholar] [CrossRef]
21. Panagiotopoulos AZ. Adsorption and capillary condensation of fluids in cylindrical pores by Monte Carlo simulation in the Gibbs ensemble. Mol Phys. 1987 Oct 20;62(3):701–19. doi:10.1080/00268978700102501. [Google Scholar] [CrossRef]
22. Pathak M, Cho H, Deo M. Experimental and molecular modeling study of bubble points of hydrocarbon mixtures in nanoporous media. Ener Fuels. 2017;31(4):3427–35. doi:10.1021/acs.energyfuels.6b02422. [Google Scholar] [CrossRef]
23. Jin B, Nasrabadi H. Phase behavior of multi-component hydrocarbon systems in nano-pores using gauge-GCMC molecular simulation. Fluid Phase Equilib. 2016 Oct;425(8):324–34. doi:10.1016/j.fluid.2016.06.018. [Google Scholar] [CrossRef]
24. Neimark AV. Gauge cell method for simulation studies of phase transitions in confined systems. Phys Rev E. 2000;62(4):4611–22. doi:10.1103/PhysRevE.62.4611. [Google Scholar] [PubMed] [CrossRef]
25. Xing X, Feng Q, Zhang W, Wang S. Phase behavior of methane in shale inorganic nanopores using Monte Carlo molecular simulation. J Nat Gas Sci Eng. 2022 Sep;105(26):104691. doi:10.1016/j.jngse.2022.104691. [Google Scholar] [CrossRef]
26. Bi R, Hao M, Wan Y, Pan Y, Chen F. Phase behavior analysis of methane confined in nanopores using molecular simulation. Front Earth Sci. 2024 Oct 16;12:1455127. doi:10.3389/feart.2024.1455127. [Google Scholar] [CrossRef]
27. Vishnyakov A, Neimark AV. Studies of liquid−vapor equilibria, criticality, and spinodal transitions in nanopores by the gauge cell monte carlo simulation method. J Phys Chem B. 2001;105(29):7009–20. doi:10.1021/jp003994o. [Google Scholar] [CrossRef]
28. Karki S, Chakraborty SN. A Monte Carlo simulation study of hydrogen adsorption in slit-shaped pores. Micropor Mesopor Mater. 2021 Apr;317(5):110970. doi:10.1016/j.micromeso.2021.110970. [Google Scholar] [CrossRef]
29. Peng X. Impact of realistic vs. Slit models of activated carbon on H2 and H2S Adsorption, and H2/CO2, CH4/H2S separation. Sep Purif Technol. 2024 Jun;338:126538. doi:10.1016/j.seppur.2024.126538. [Google Scholar] [CrossRef]
30. Kumar M, Sengupta A, Kummamuru NB. Molecular simulations for carbon dioxide capture in silica slit pores. Mater Today Proc. 2024;102:194–202. doi:10.1016/j.matpr.2023.04.517. [Google Scholar] [CrossRef]
31. Caviedes D, Cabria I. Grand Canonical Monte Carlo simulations of the hydrogen storage capacities of slit-shapedpores, nanotubes and torusenes. Int J Hydrog Energy. 2022 Mar;47(23):11916–28. doi:10.1016/j.ijhydene.2022.01.229. [Google Scholar] [CrossRef]
32. Kolesnikov AL, Budkov YA, Barbosa GD, Möllmer J, Tavares FW. Water adsorption on planar interfaces: classical density functional study. Fluid Phase Equilib. 2023 Jan;564(12):113567. doi:10.1016/j.fluid.2022.113567. [Google Scholar] [CrossRef]
33. Siderius DW, Gelb LD. Extension of the Steele 10-4-3 potential for adsorption calculations in cylindrical, spherical, and other pore geometries. J Chem Phys. 2011 Aug 28;135(8):084703. doi:10.1063/1.3626804. [Google Scholar] [CrossRef]
34. Bi R, Nasrabadi H. Molecular simulation of the constant composition expansion experiment in shale multi-scale systems. Fluid Phase Equilib. 2019 Sep;495(8):59–68. doi:10.1016/j.fluid.2019.04.026. [Google Scholar] [CrossRef]
35. Martin MG. MCCCS Towhee: a tool for Monte Carlo molecular simulation. Mol Simul. 2013;39(14–15):1212–22. doi:10.1080/08927022.2013.828208. [Google Scholar] [CrossRef]
Cite This Article
 Copyright © 2025 The Author(s). Published by Tech Science Press.
This work is licensed under a Creative Commons Attribution 4.0 International License , which permits unrestricted use, distribution, and reproduction in any medium, provided the original work is properly cited.
 Downloads
 Citation Tools