
 Submit a Paper
 Propose a Special lssue
 Open Access
ARTICLE

An Investigation into Dust Migration Patterns in Small-Section Tunnels and Large Steep-Sloped Inclined Shafts
1 China Railway Tunnel Bureau Group Road & Bridge Engineering Co., Tianjin, 300300, China
2 School of Civil Engineering, Chongqing Jiaotong University, Chongqing, 400074, China
* Corresponding Author: Liangwen Wei. Email:
Fluid Dynamics & Materials Processing 2025, 21(3), 555-571. https://doi.org/10.32604/fdmp.2024.054275
Received 23 May 2024; Accepted 12 November 2024; Issue published 01 April 2025
 View Full Text
 Download PDF
Abstract
This study focuses on addressing ventilation and dust removal challenges during the construction of small-section tunnels using drilling and blasting techniques. Specifically, the research examines the shale gas gathering and transmission trunk line project in the Weiyuan and Luzhou blocks. To gain deeper insights into dust migration patterns, numerical simulations were conducted. The study further analyzed dust migration behavior in small-section tunnels and large steep-sloped shafts, taking into account various factors such as ventilation distance, tunnel slope, and section size. The results indicate that optimal ventilation occurs at distances of 15 and 13 m. Additionally, dust concentration was notably lower when the tunnel slope was 0°, suggesting that a flat slope is more advantageous for construction projects where the outlet wind speed remains constant. Moreover, as the tunnel’s cross-sectional size increases, dust concentration decreases significantly, further underscoring the benefits of larger tunnel sections in mitigating dust accumulation.Keywords
Shaft tunnels are often used to facilitate and shorten the construction time of large tunnels. Moreover, in contrast to conventional tunnels, the construction of large highway tunnels requires the use of drilling and blasting methods. However, it is difficult to naturally discharge the produced blasting dust and harmful gases out of such tunnels. This is even the case when ventilation equipment is used, as it takes a long time. Besides, the longer the tunnel is, the more prominent the situation will be, which might adversely impact the project’s construction schedule.
Using a long-inclined shaft, Li [1] researched the long main cavern with a high burial depth. For this purpose, the ventilation method, theoretical calculation of the maximum airflow demand in the cavern, etc., were applied. This effectively solved the ventilation problems of the main cavern, improved the working environment of the construction personnel, increased the construction efficiency, accelerated the construction progress, and provided a reference for the construction of similar tunnels. In another research, computer simulation was used by Weisenpacher et al. [2] to study the smoke movement and its layering inside the highway. Cvjetic et al. [3] studied the ventilation mode of the Bar-Boljare highway tunnel in Montenegro. In the study, the influence of different ventilation equipment on tunnel ventilation was investigated, the findings of which provided a basis for research on the ventilation performance of the tunnels. Considering such factors as temperature gradients in the surrounding terrain, Porras-Amores et al. [4] employed numerical simulation software to accurately replicate the natural ventilation processes within underground structures. In order to better reflect real-world conditions, their approach involved refining computational fluid dynamics (CFD) models. This method holds significant relevance for similar subterranean projects and offers insights for optimizing ventilation and energy management systems. Moreover, the findings have enabled architects and engineers to enhance the overall efficiency and performance of underground constructions, ensuring both comfort and sustainable environments. In addition, Guo et al. [5] developed a theoretical distribution model specifically designed for tunnels with curved edge sections. The model provides a reliable framework for understanding the dynamics of dust migration during drilling construction. In another study, Hu et al. [6] used a 1:21 modeling test to study the dust movement law and liner car obstruction effect between different gradients. They also investigated the effects of tunnel dust movement under different starting dust concentrations and return air velocities. The findings provide a valuable reference for understanding the motion law of tunnel dust under different gradients. Studying dust motion modeling in an air intake tunnel, Zhu et al. [7] analyzed the effects of airflow and temperature on the dust motion characteristics. Accordingly, the critical airflow conditions were determined at room temperature. A study was also conducted by Nie et al. [8] on the estimation of dust pollution levels within concealed tunnels. Various dust dispersion patterns were analyzed under different conditions, which led to the proposal of novel metrics for assessing the air quality within the tunnels. Hao et al. [9] also investigated the dust distribution and deposition under the breathing height of personnel. For this purpose, numerical models were used to simulate the comprehensive mining face of a coal mine. In another research, dust movement patterns in tape transportation tunnels were investigated by Jing et al. [10]. Based on the obtained results, they designed a comprehensive dust reduction strategy of “central suppression and bilateral decomposition”, which substantially improved the dust removal efficiency. Such results provide insights for the implementation of dust control measures in the synthesized mining face in the breathing belt area. Analyzing dust samples from different tunnel sections, Liu et al. [11] studied the migration of dust of different sizes during TBM construction. Their obtained results provided guidance for the development of dust reduction strategies as well as the optimization of nozzle parameters. Furthermore, Liu et al. [12] studied the operation area of construction tunnels. Using FLUENT software, they constructed a numerical model which simulated the distribution pattern of dust in the tunnels. This, in turn, provided direction for research on the health protection of construction workers.
However, despite the valuable findings of the above research works, such studies mainly suffer from mainly focusing on highway tunnels or tunnels with larger cross-sections. This means that there are relatively few studies on tunnels with smaller cross-sections. Moreover, existing studies tend to focus on the ventilation and dust removal problems under specific projects or conditions. These shortcomings have caused the studies to lack systematicity and universality, making them difficult to provide generalized guidance for further similar projects. In addition, although dust movement laws have been explored under different tunnel construction methods in the literature, the drill-and-blast construction method is still an understudied area of research. Moreover, although certain studies have adopted numerical simulation methods, more method applications and validations are still needed to improve the reliability and accuracy of the studies. Hence, the present study is an attempt to firstly fill the gap in the ventilation and dust removal problem of the drill-and-blast construction of small-section tunnels. This provides a new perspective and a theoretical support for the development of the field. Moreover, taking a specific project as an example, the effects of different ventilation distances, tunnel slopes and cross-section sizes on the dust migration characteristics are investigated. This, in turn, provides an important guidance and a reference for the ventilation design and construction of similar projects. Some key conclusions are also drawn through numerical simulation combined with actual engineering cases, which provide theoretical and technical support for the development of dust transportation and control technology during the blasting period of long inclined shaft tunnels.
2 Overview of Dependent Projects
The project, Yangtze River Tunnel, is located in the Jiangjin District, Chongqing City, Tanpan Town, Hengshan Village, three groups and Baysha Town, Fangyin Village, five groups, of which the West Bank inlet section of the hole is located in the Jiangjin District, Chongqing City, Tanpan Town, Hengshan Village, three groups, the hole in the ground level of 230.70 m. The entrance of the east bank exit section is located in Group 5, Fangyin Village, Baisha Town, Jiangjin District, Chongqing Municipality, with the ground elevation of 203.50 m. The level of the tunnel surrounding rock is classified as IV–VI. The peripheral rock level is mainly class IV, accounting for 95.14% of the total length, with all the rest being class VI and V. The tunnel adopts the crossing scheme of “Slope Alley (West Bank) + Flat Alley + Slope Alley (East Bank)”. With the total length of 1638.6 m, the length of the west bank (inlet) inclined shaft is 298.11 m, with the inclination of 25°; the length of the flat lane is also 1097.95 m; Moreover, the length of the east bank (outlet) inclined shaft, the inclination and the minimum depth of the river bottom section are 242.75 m, 25°, and about 70 m, respectively. The straight-walled arch of the tunnel section has the net width of 3.6 m, net height of 3.6 m, with both of the wall height and arch height of 1.8 m. Moreover, the maximum depth of the tunnel is about 101 m and the minimum depth of the bottom section of the river is about 70 m. The section of the river plane level of the 100-year maximum depth of water is about 20 m, with the elevation of 210 m. Tunnel structure adopts composite lining structure, its shape is straight wall arch, which consists of primary support + secondary lining + waterproofing, its unilateral setting of drainage ditch, excavation using drilling and blasting construction method.
Dust particles which move within the continuous wind flow of the tunnel exhibit a typical two-phase flow motion. Presently, Eulerian and Lagrangian methods are used as the most important treatments in the analysis of the motion. While the former takes the dispersed phase as a continuous medium, the latter method takes the gas as a continuous term and other particles in the flow field as discrete phases. As for the dust transportation, the comprehensive analysis of dust characteristics’ movements in the fluid cannot consider the collision and the volume occupied by the particles. On the other hand, as a Lagrangian method, the application of DPM (Discrete phase model) is more appropriate.
According to the inertia of the particles balanced with the force, the equation governing the motion of the particles in the dispersed phase is expressed as [13]:
where:
The equation of the dust motion is integrated to get the particle velocity; it is then integrated to get the three-dimensional trajectory of the dust.
3.2 Wind Flow Control Equations
The mass conservation equation is often called the continuity equation [14].
where:
The above equation is written as:
The equation for the conservation of momentum is:
where:
Based on Reynolds’ mean equation and pulsation equation of motion, turbulence modeling establishes a closed system of equations on the average amount of turbulence. Both the two-equation model in the eddy-viscosity model as well as the standard model are the most commonly used ones [15] The standard model equation is:
where:
During the simulation process by Fluent, the appropriate simplification can make the calculation more convenient, which does not adversely affect the simulation results. Therefore, with regards to the model calculation, the following assumptions are made [16]:
(1) The change of air density is normally negligible when the air velocity is low. So, the air in the inclined tunnel can be considered as an incompressible fluid;
(2) The dust in the bored tunnel falls due to gravity. So, the effect of gravity needs to be considered;
(3) The wind flow from the press-in air blower into the tunnel is fresh air and does not entrain other pollutants;
(4) The flow field is a steady state with none of the variables changing with time.
4.2 Geometric Model and Mesh Generation
In the present study, the actual situation of the Yangtze River gas transmission tunnel is modeled by the simulation and calculation. Therefore, to carry out an appropriate simplification, a tunnel model of the length of 298 m, the hole width of 3.6 m, and the hole height of 3.6 m, with a straight wall and a rounded arch inclined shaft is designed. The tunnel adopts pressure-entry ventilation, with its pressure-entry blower simplified as a cylinder with a diameter of 0.6 m. It is positioned 1.8 m above the tunnel bottom, near the right wall. The tunnel model is shown in Fig. 1.
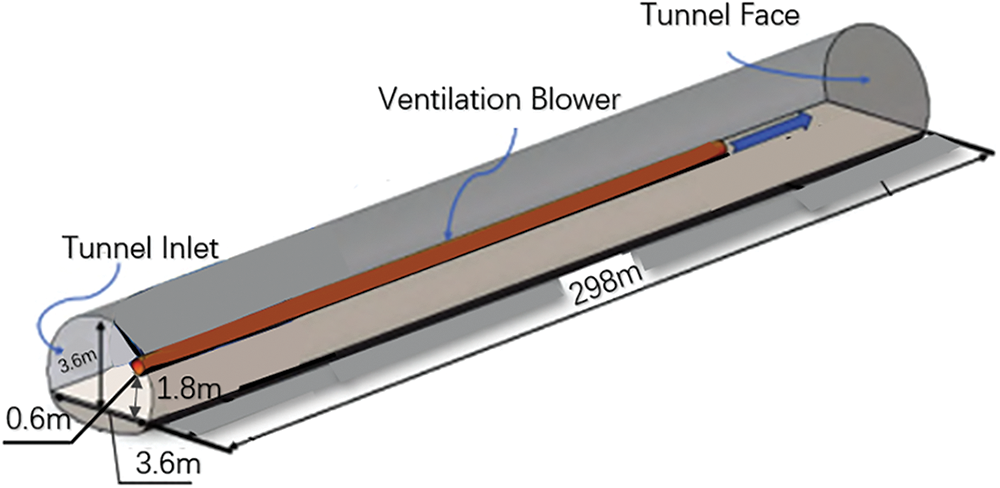
Figure 1: Tunnel model
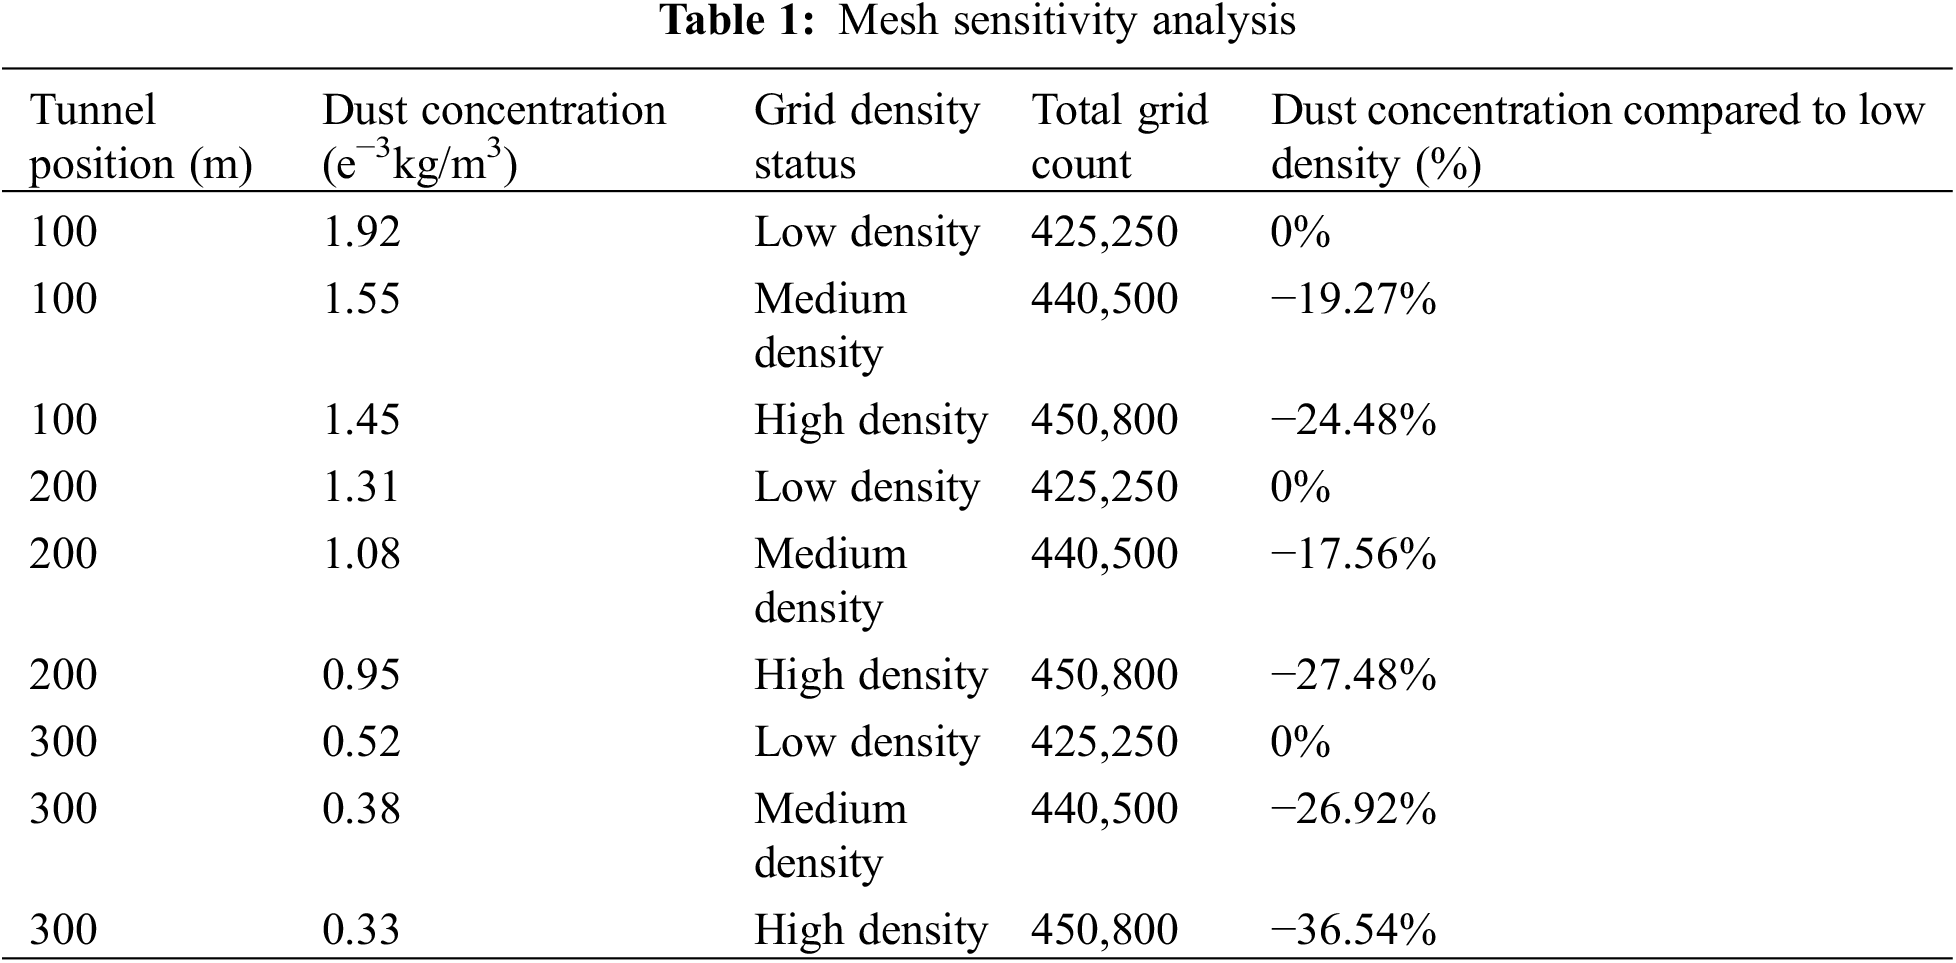
The geometric model was imported into FLUENT MESH for global and local mesh generation. The mesh division diagram is shown in Fig. 2, where the mesh at the pressure-entry blower is refined. A slope of 25° is selected for the tunnel, with the duct outlet set 15 meters from the boring face and a cross-section size of 3.6 m. A mesh sensitivity analysis is conducted to examine the percentage change in dust concentration at distances of 100, 200, and 300 m from the tunnel working face as the mesh density in the duct increases. Specific data can be found in Table 1. The results indicate that mesh refinement significantly reduces dust concentration at various sections, and the dust concentration tends to stabilize as the mesh density increases. Therefore, refining the mesh in the pressure-entry blower ensures accurate predictions of dust concentration within the tunnel.
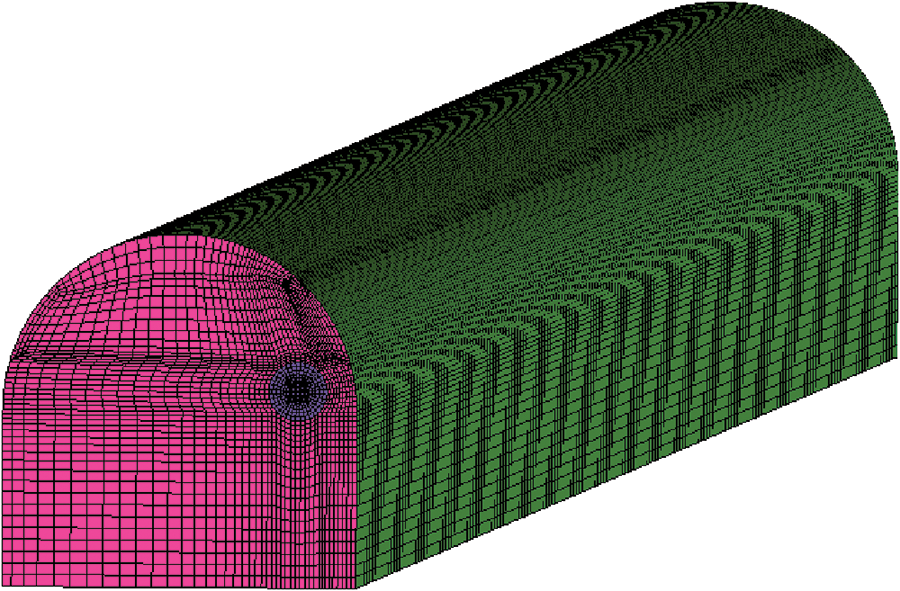
Figure 2: Grid partition diagram
4.3 Configuring Parameters and Boundaries for Numerical Modeling
Before carrying out the numerical simulation, it is necessary to set the initial concentration of the dust, which is performed to simulate the process of dust concentration change. Moreover, the choice of boundary conditions is crucial to the solution. This is because reasonable initial conditions can ensure that the discrete solution in the region of the solved flow field has a solution, which leads to correct simulation results [17].
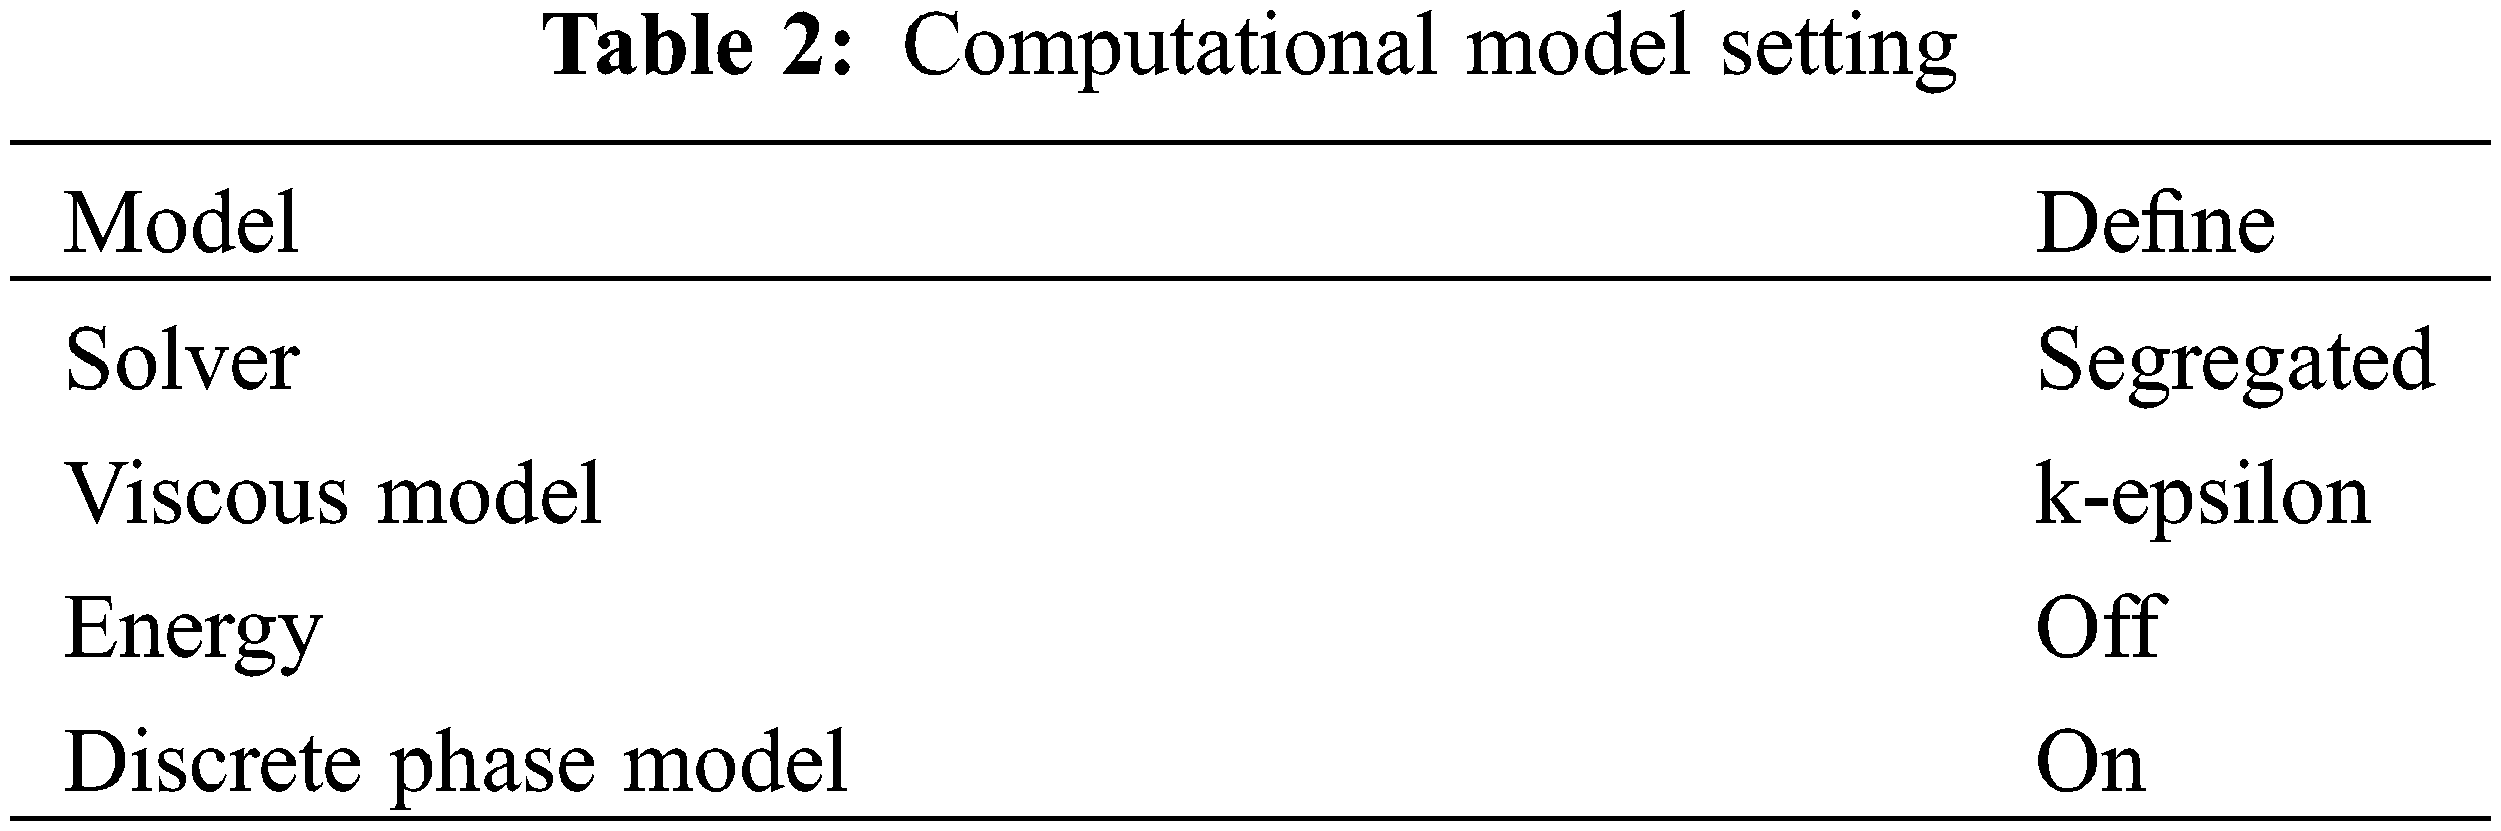
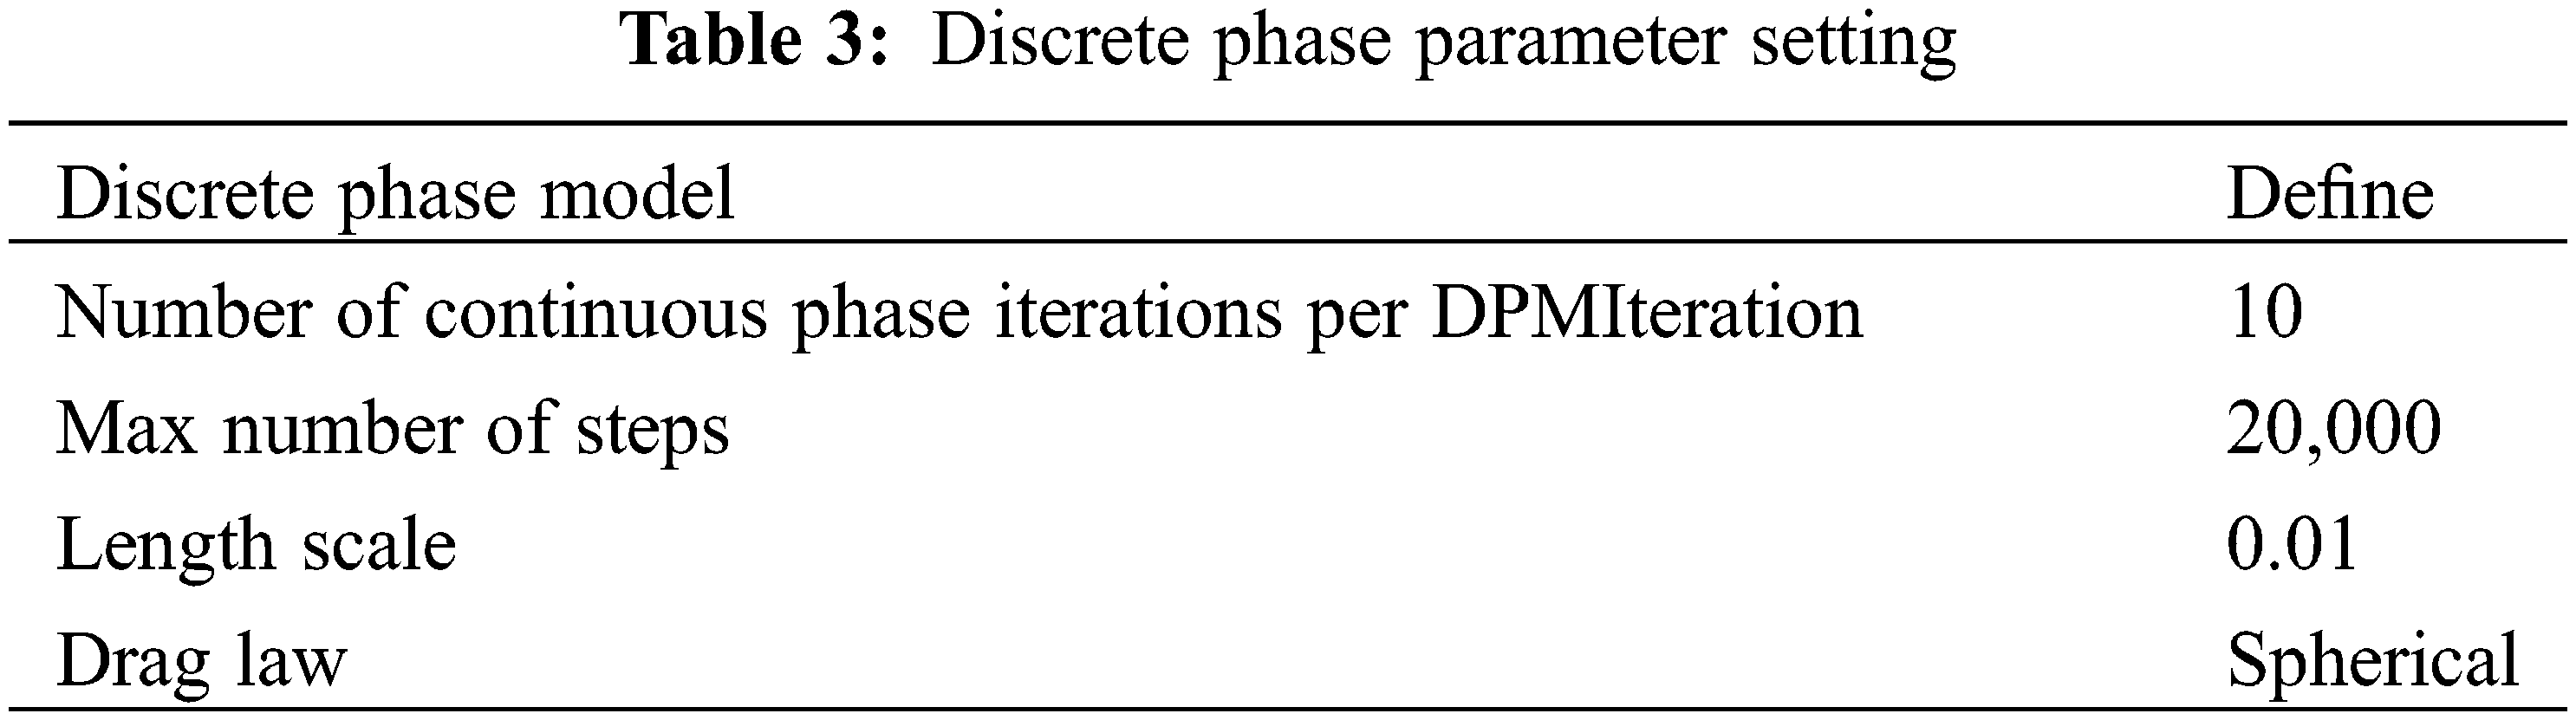
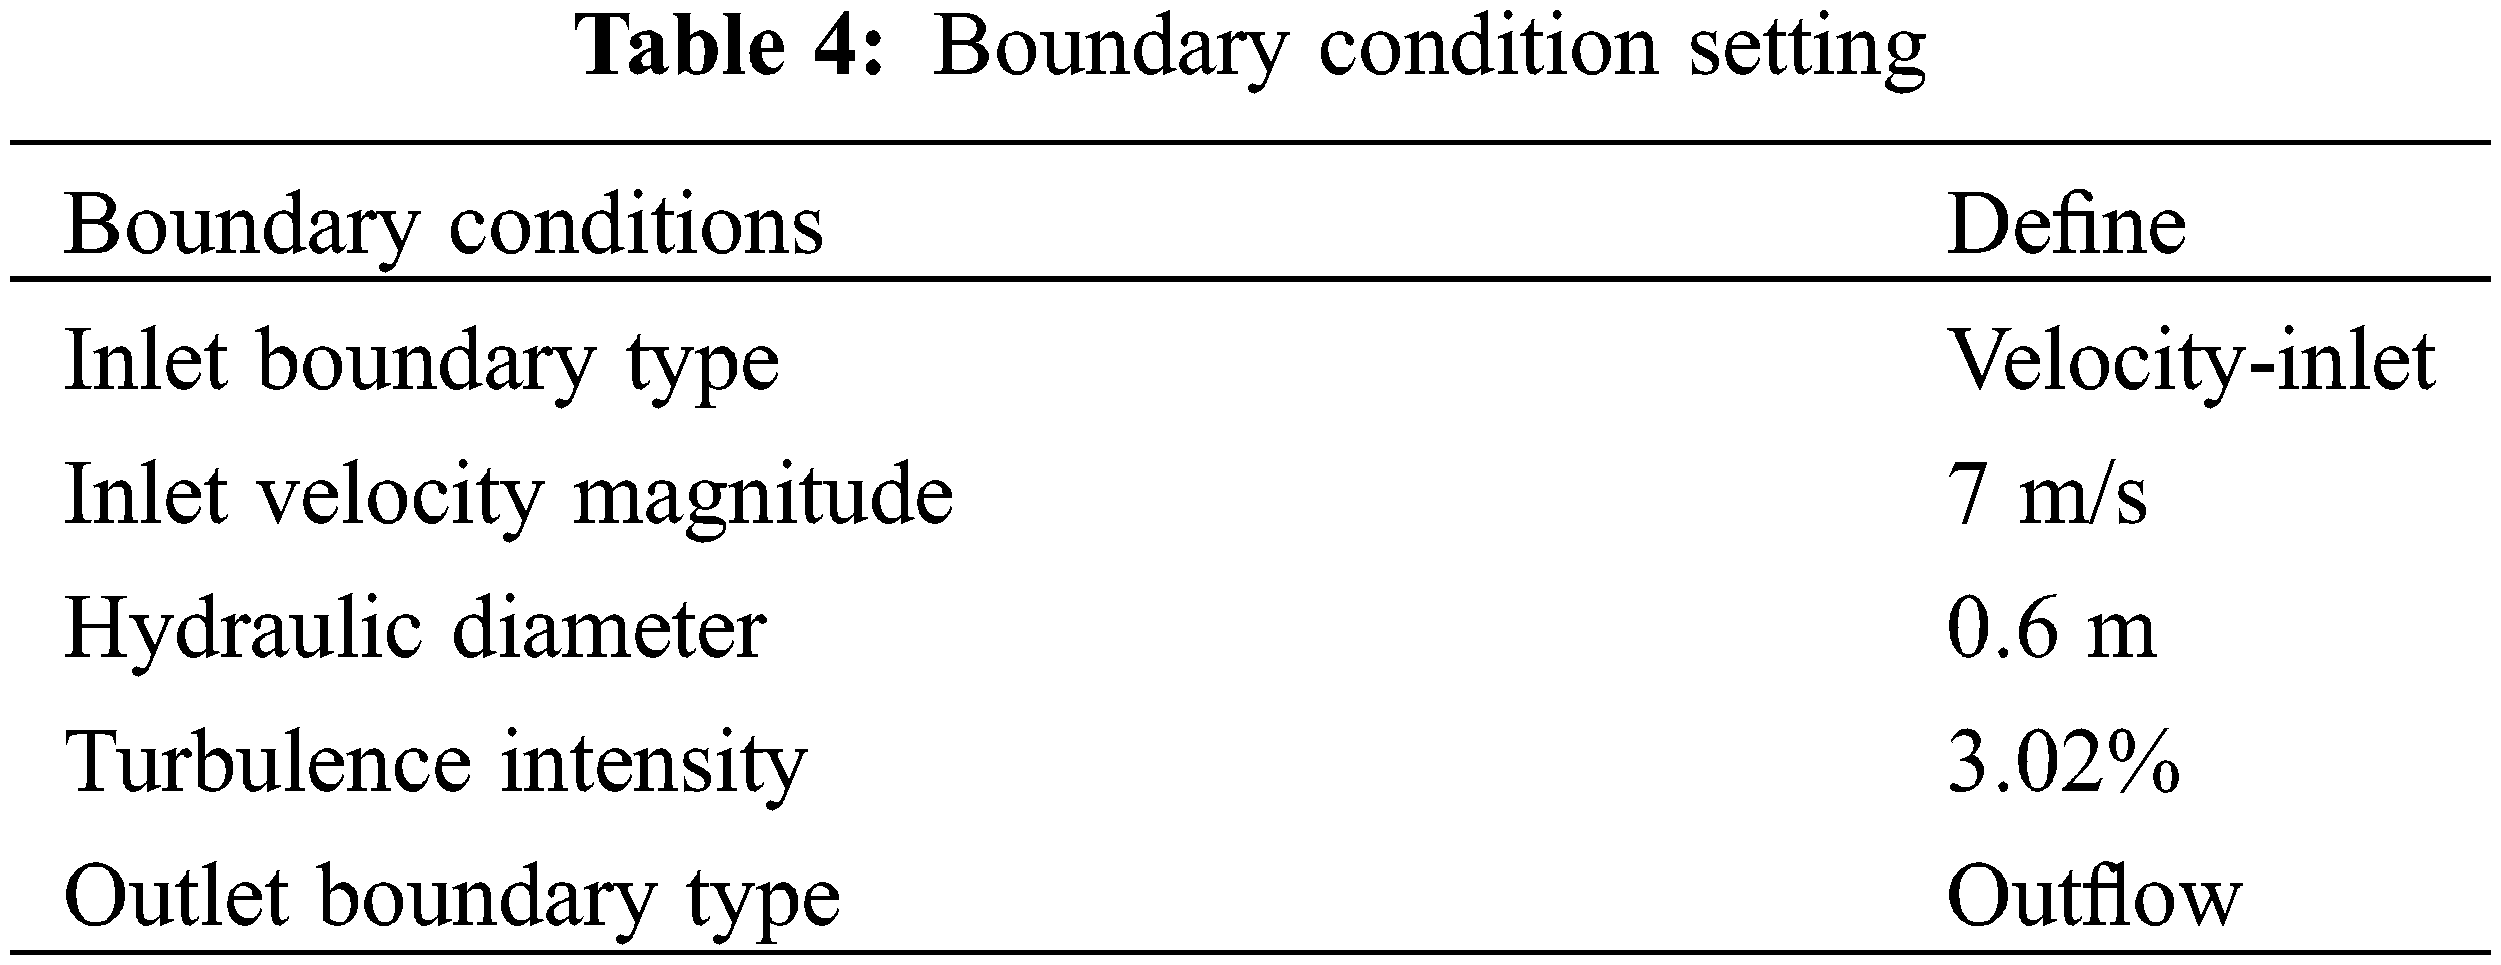
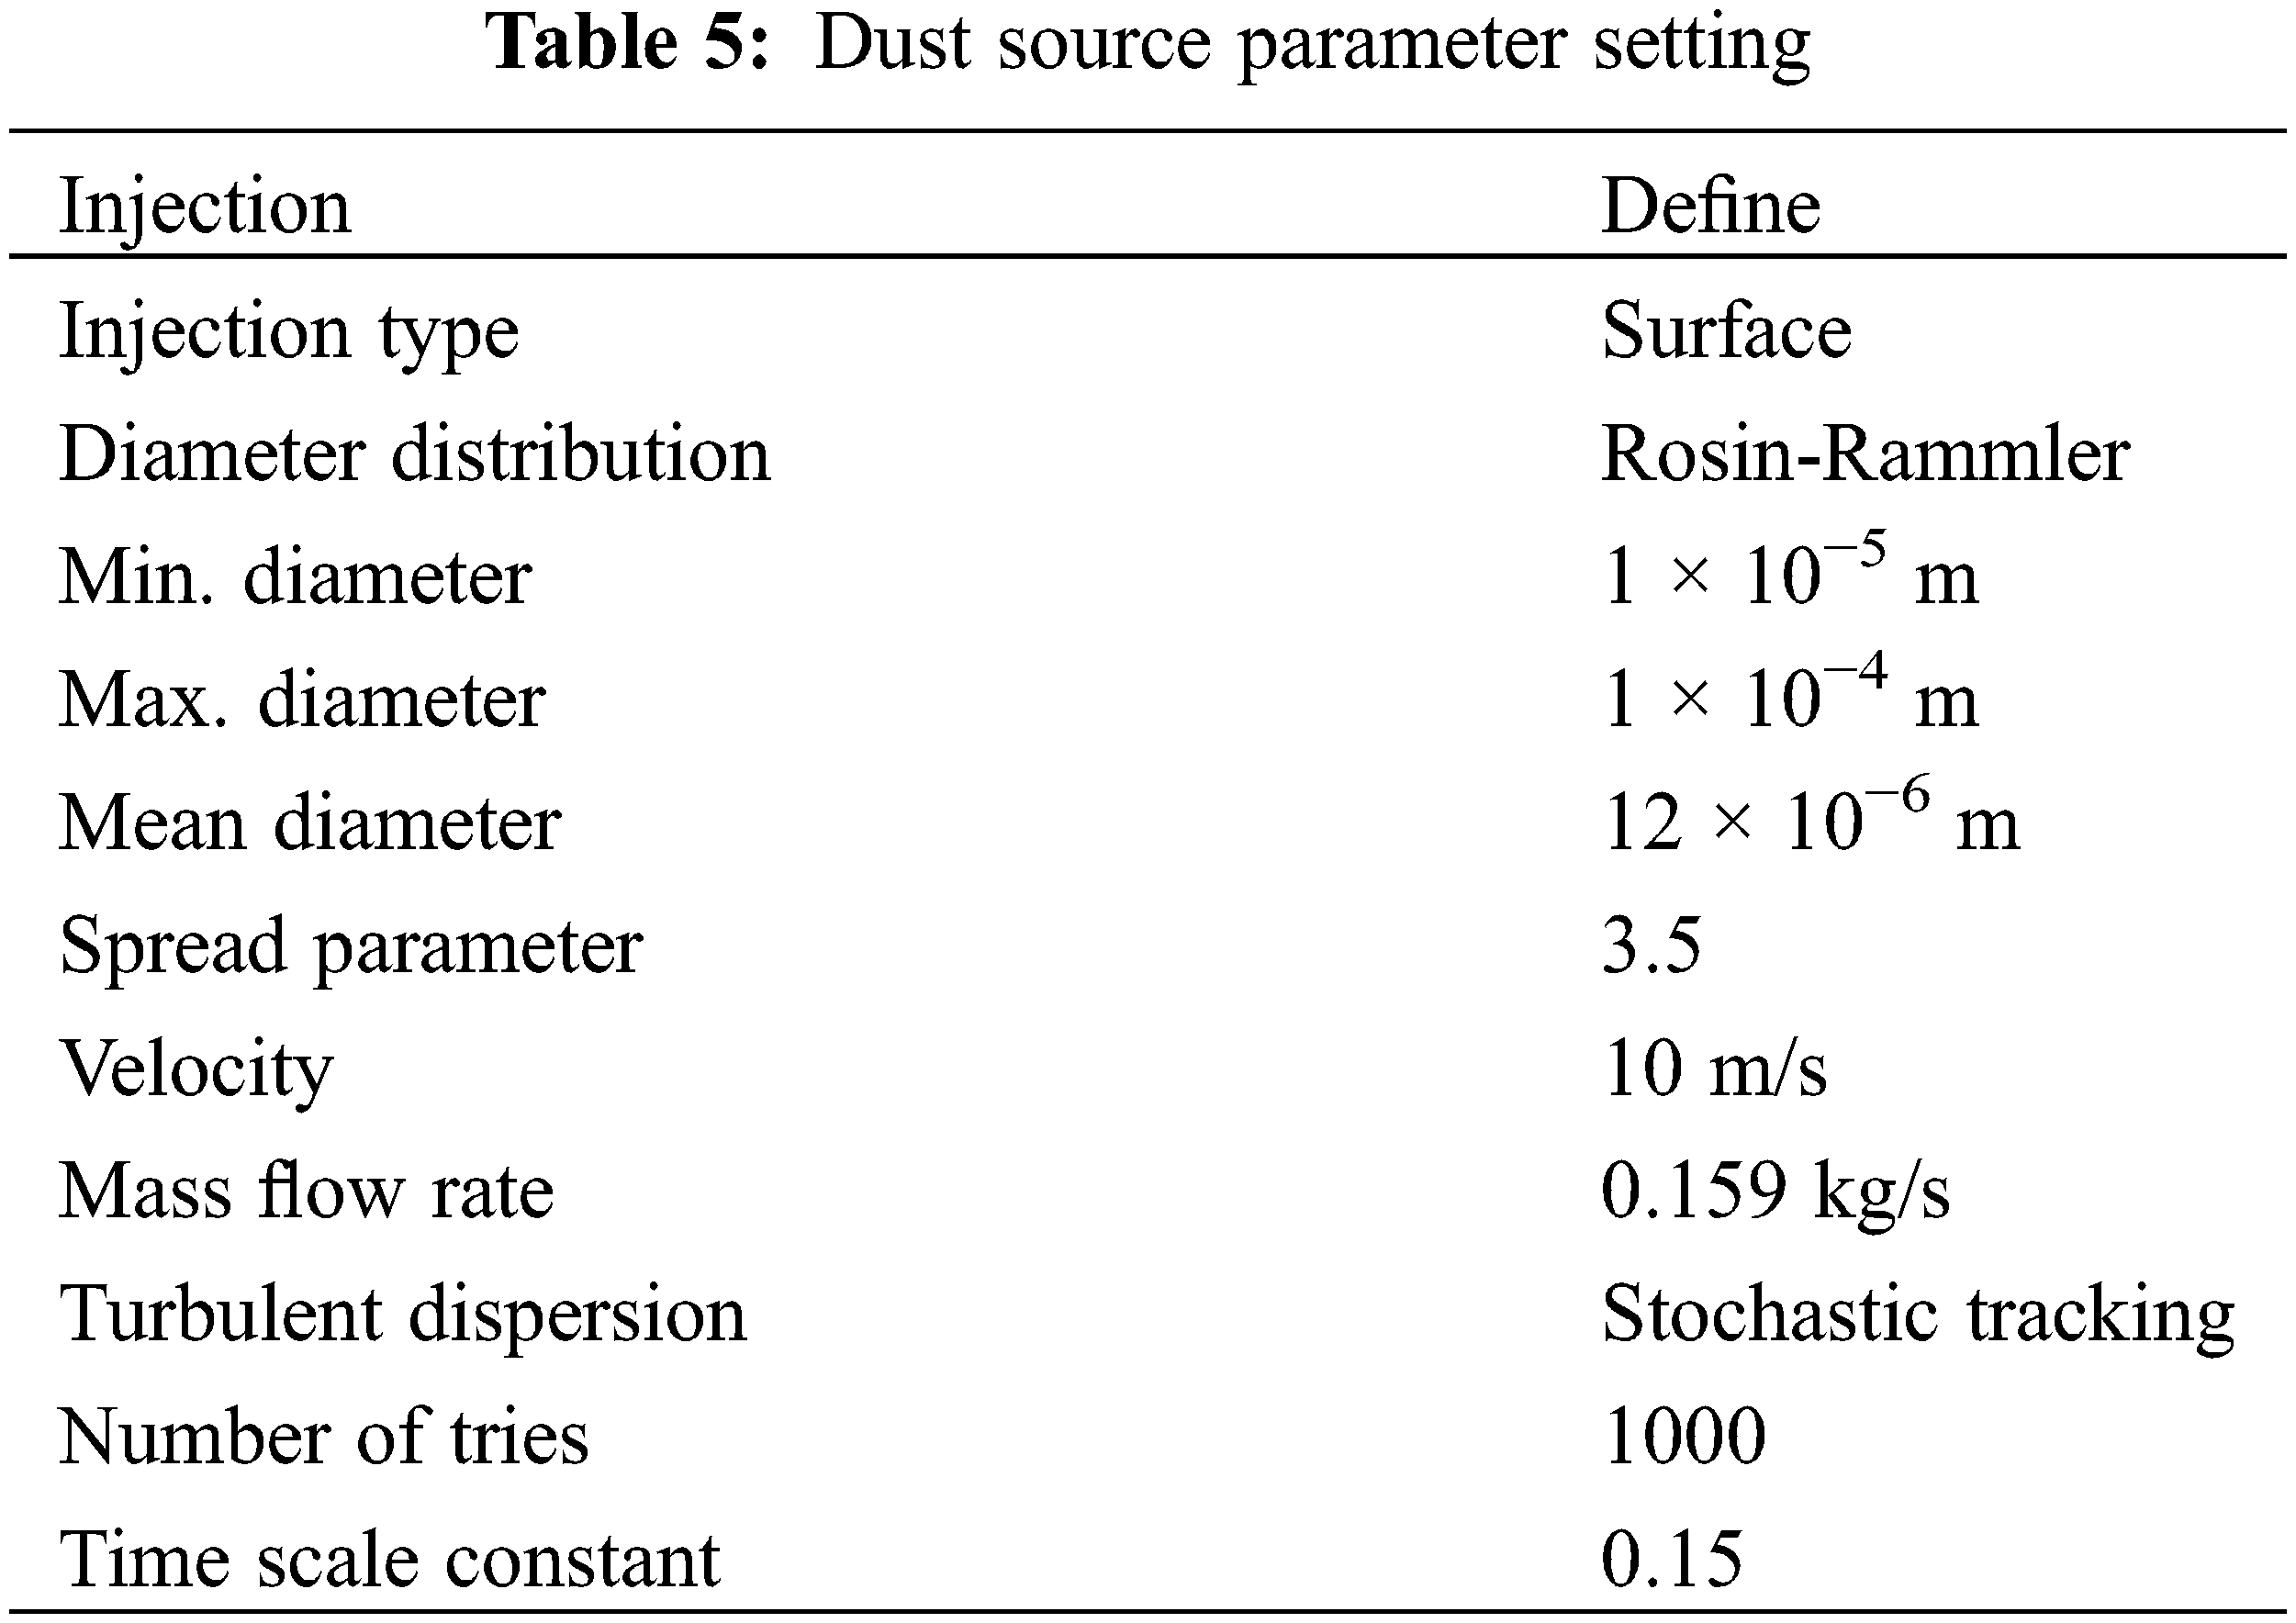
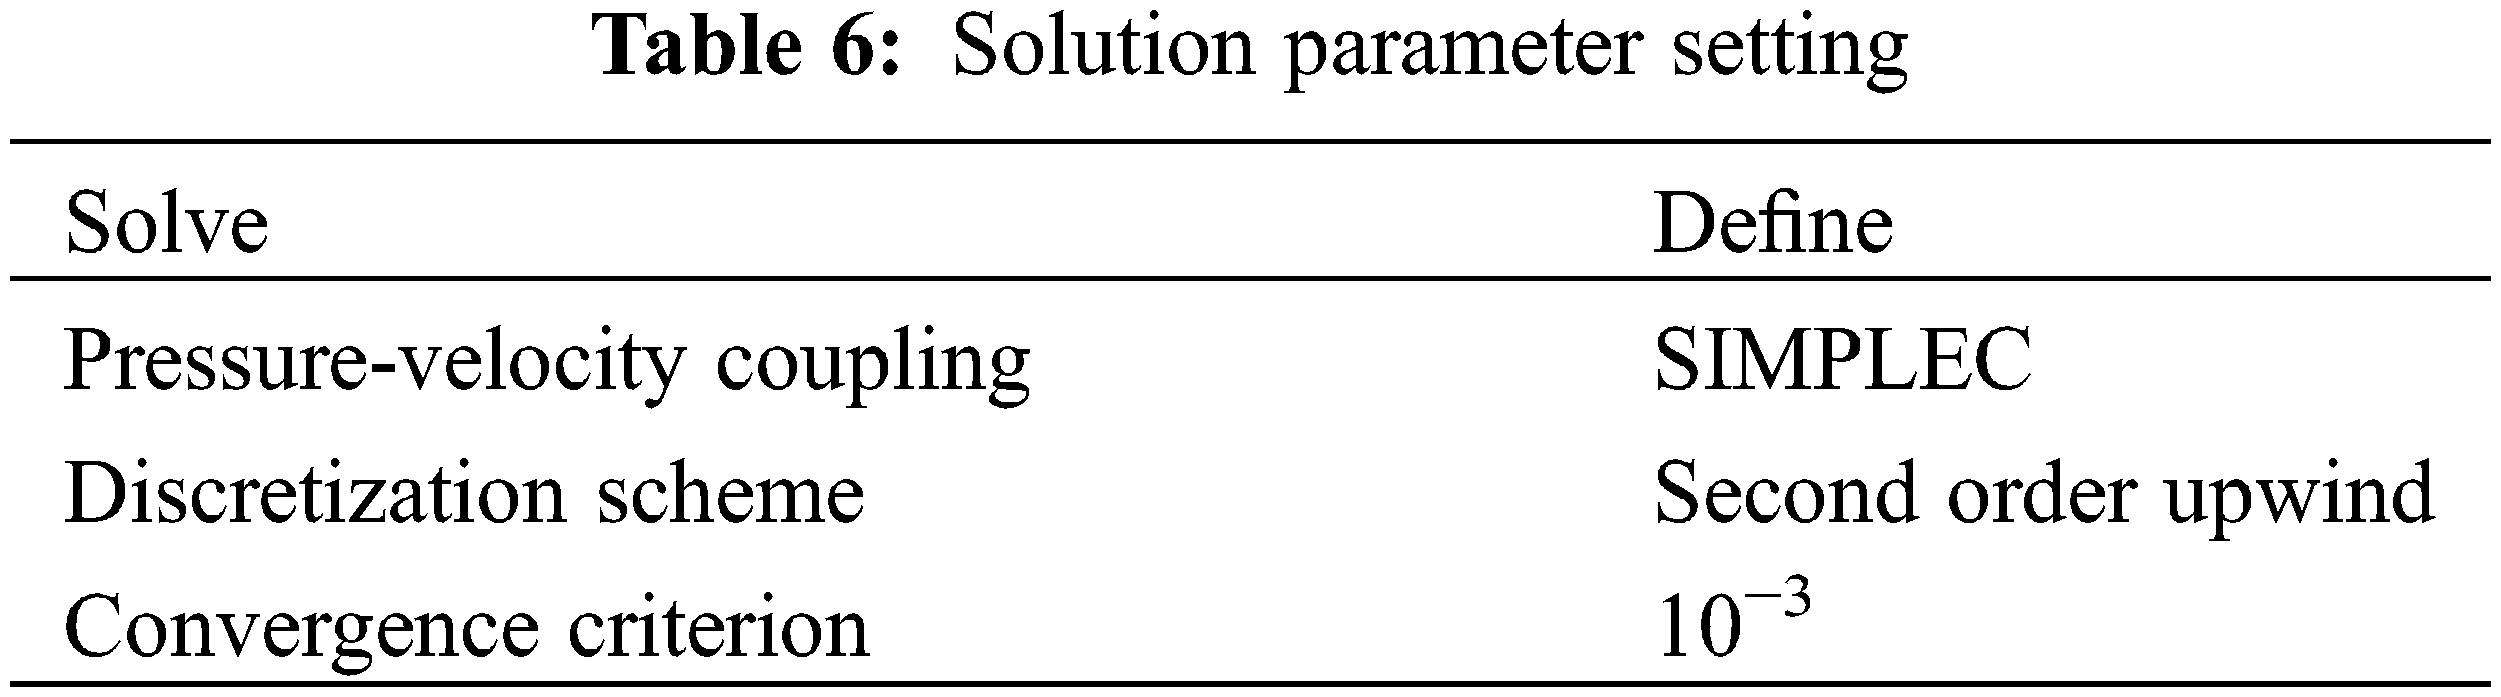
The geometric model is imported into Fluent. As shown in Tables 2 to 6, the boundary conditions as well as each parameter of the software simulation are also determined by combining the simulation method of Fluent with the mathematical model of dust movement.
Wind speed determination:
According to the construction organization design scheme, the ventilation volume is 470 m3/min.
Press-in blower outlet air velocity [18] is as follows:
So, while performing the numerical simulation, the wind speed is taken as 7 m/s.
The hydraulic diameter is calculated using the following formula [19]:
where:
The intensity of turbulence is calculated as below:
where:
In this scenario, the sizing pattern of the dust particles conforms to the Rosen-Rummler model, which assumes a relationship between the proportion of particles of a specific size
where:
where:
The calculation of the mass flow rate follows the below equation:
where:
4.4 Dust Distribution Pattern under Different Ventilation Distances
In the tunnel drilling and blasting method, as the tunnel boring moves forward, the air duct in the distance from the excavation process alters the flow field distribution within the tunnel. Therefore, duct outlets were selected at the distances of 15, 13, and 11 m from the boring face. The tunnel was set at a slope of 15° and a section size of 3.6 m. A cloud diagram was also generated to illustrate the dust particle concentration distribution. Since the tunnel is a long and thin tunnel, and the dust distribution pattern from 0 to 150 m of the tunnel is not obvious, in order to analyze the distribution pattern of the tunnel dust more clearly and directly, all the analyses in this thesis are selected to analyze the concentration of dust particles from 150 to 300 m of the tunnel. This enabled the comparison of dust concentrations at varying ventilation distances from the tunnel face.
(1) The outlet of the duct was 15, 13 and 11 m away from the digging face, respectively.
(2) Horizontal particle concentration along the tunnel section when the air duct outlet is positioned 15 meters from the excavation face.
The following can be observed from Figs. 3 to 5:
(1) After blasting the tunnel, the dust is sprayed from the face of the palm into the tunnel space. Due to the influence of the pressurized ventilation jet, the dust then gathers on the left side of the palm face. Subsequently, the return airflow on the left side of the tunnel causes the dust to gather on the left side of the palm face. Then, it is gradually transported along the left side of the tunnel to the tunnel entrance. Moreover, the dust with larger particle size settles faster during the process, and is gradually captured by the tunnel base plate. As an instantaneous source of pollution, the dust is constantly transported to the entrance direction and is mainly concentrated on the left side of the tunnel. Furthermore, the distribution of the dust mass concentration shows a low and a high concentration in the vicinity and in a distance from the palm face, respectively. Afterwards, the dust concentration decreases rapidly and gradually stabilizes, which is due to the large amount of dust with larger particle size settling on the ground.
(2) The maximum value of dust concentration in the digging face was found not in the vicinity, but at a distance from the dust source. This can be attributed to the larger kinetic energy of the dust particles, which is due to the force of the wind flow of the duct on the dust, as well as the larger distance that the dust particles with large sizes move.
(3) Different concentrations of dust particles can be observed at different ventilation distances from the different sections of the boring face. This is to say that, while the maximum value of concentration is produced when the ventilation distance is 11 m, i.e., close to 7 × 10⁻³ kg/m3, the concentration is relatively reduced at the ventilation distances of 15 and 13 m.
(4) As the distance increases from the working face, the tunnel dust is either settled down or arrested along the course. However, the dust concentration on the left side of the tunnel (x = 1.2) is lower than that of the right side (x = 2.4), which is due to the air ducts being on the right side, and the tunnel wind speed being gradually decreased from right to left in the tunnel section in the horizontal direction.
(5) The effective range of press-in ventilation is calculated as the following:
where:
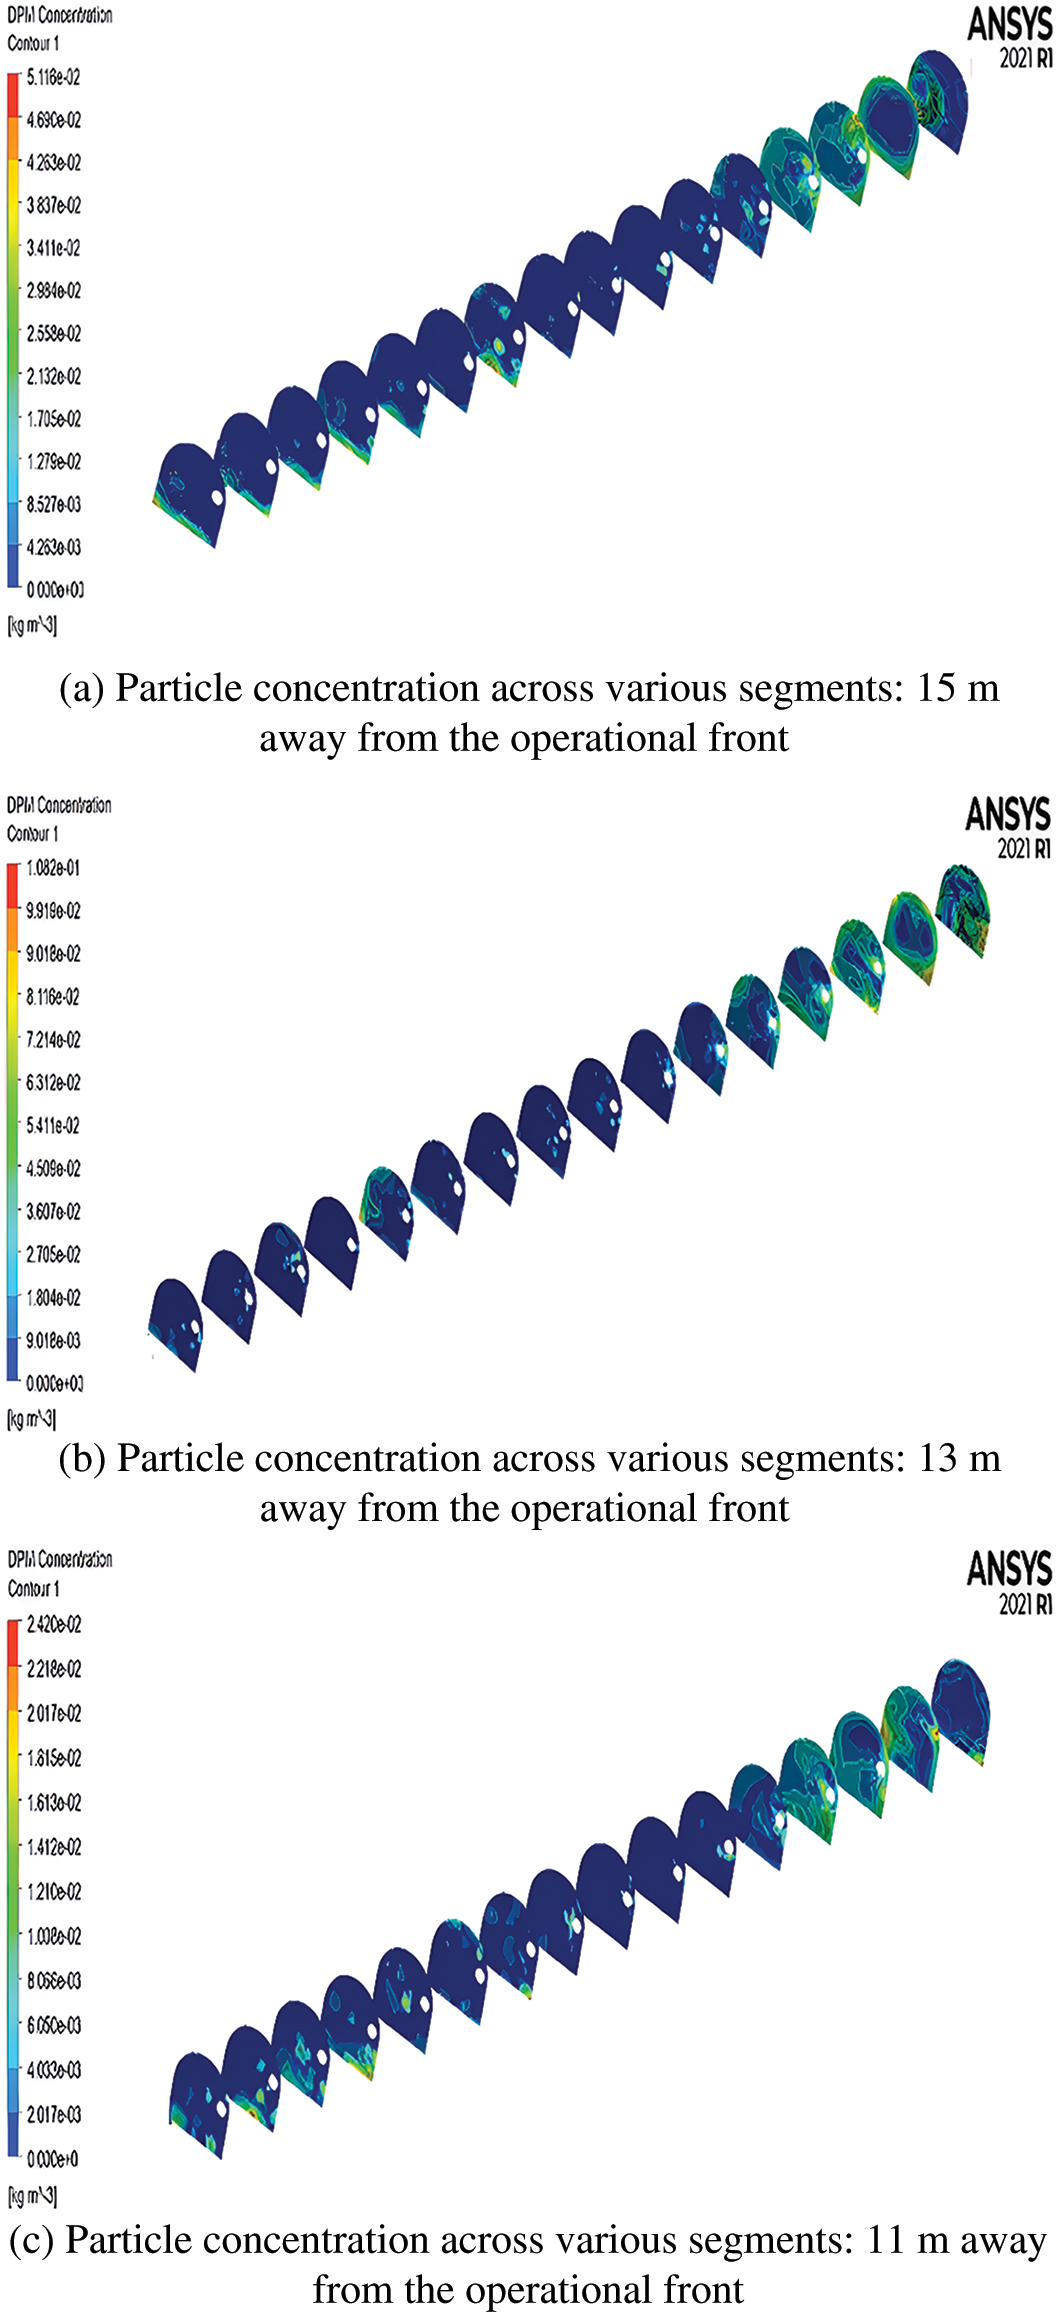
Figure 3: Particle concentration across varying distances from the duct outlet to the excavation front in the distinct segments (a: 15 m, b: 13 m, c: 11 m)
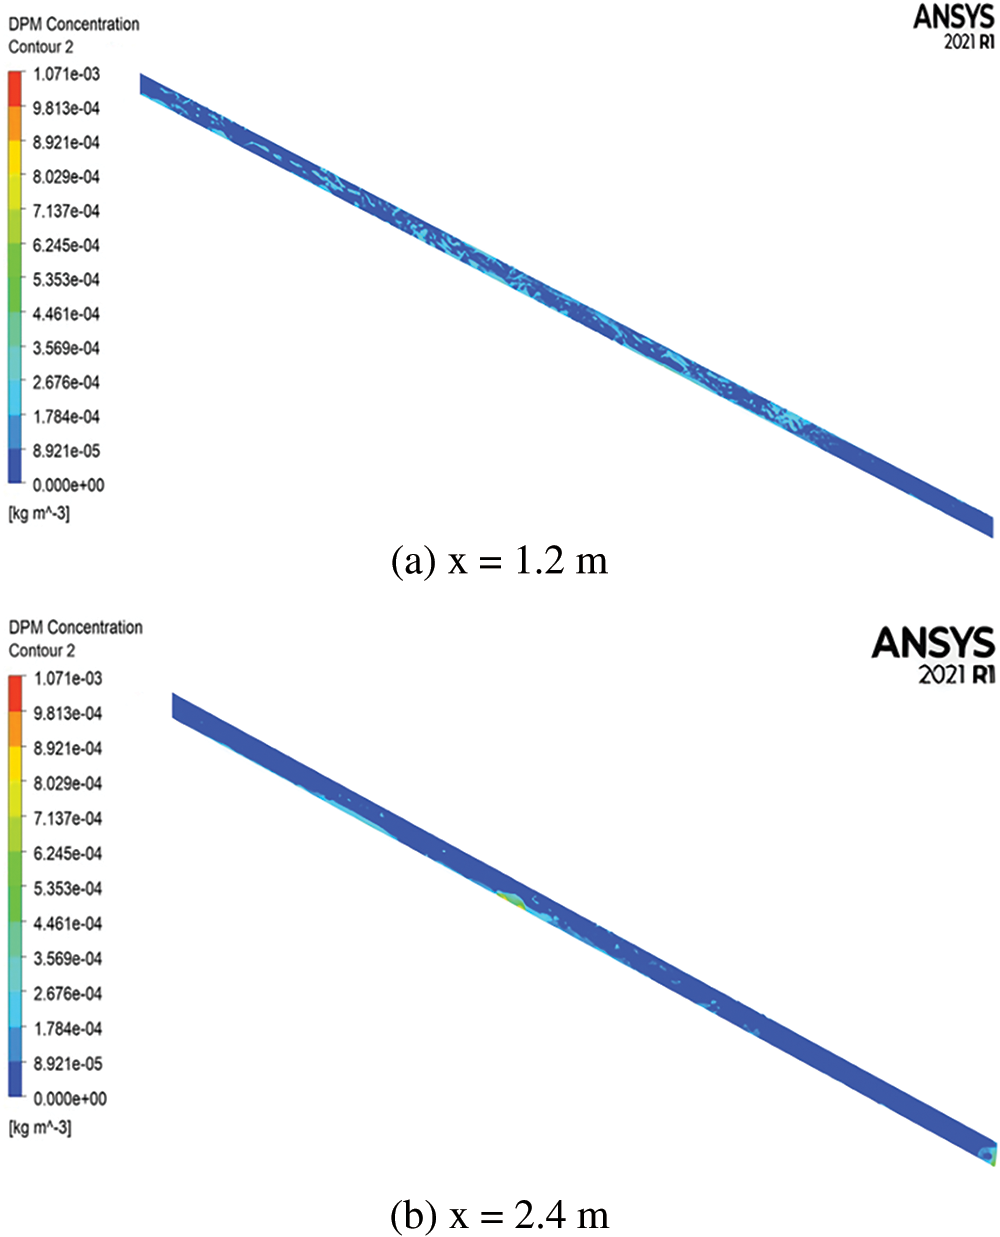
Figure 4: Plane dust concentration (a: 1.2 m, b: 2.4 m)
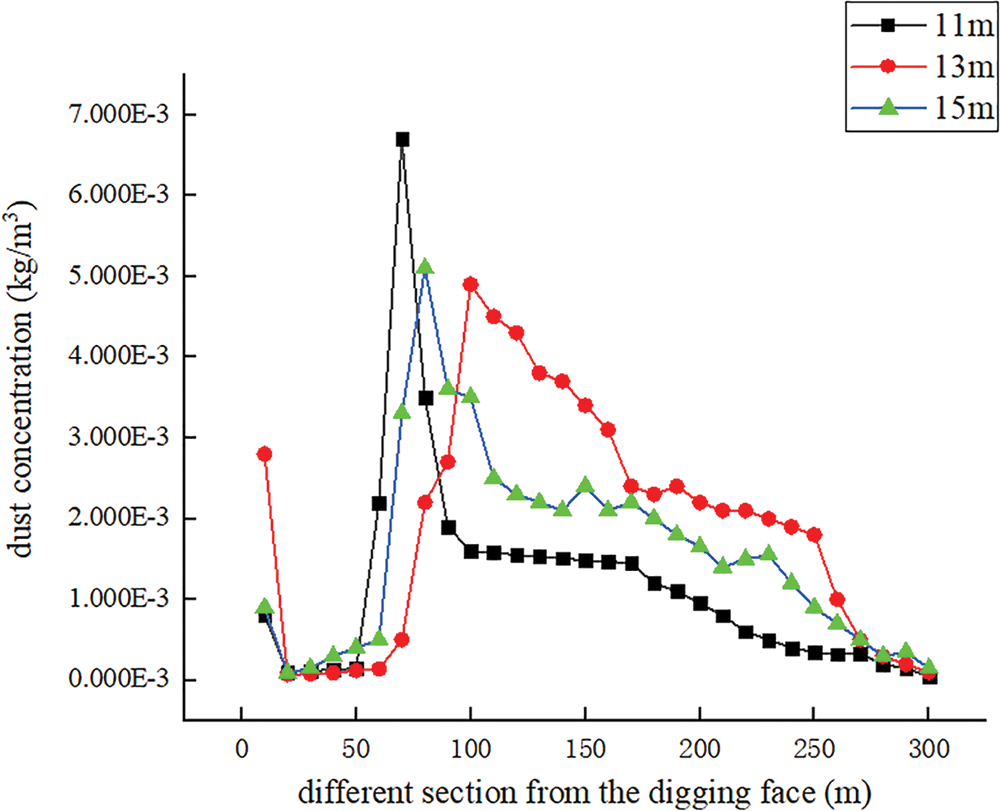
Figure 5: Concentration of dust particles in different parts of the face at different ventilation distances
4.5 Dust Distribution Pattern under Different Slopes
The slope is an important influencing factor for the inclined tunnel. The outlet of the air duct was 15 m away from the boring face, with 25°, 15°, and 5° being selected for the present study. A cloud map of dust particle concentration distribution was made and the concentration of dust particles in different sections from the working face was compared at different slopes.
(1) Tunnel slopes of 25°, 15° and 5°.
(2) Dust concentration in the horizontal direction of the tunnel section at a tunnel gradient of 25°.
The following can be observed from Figs. 6 to 8:
(1) The maximum value of dust concentration in the tunneling face is observed not at the working face, but at a distance from it. After a certain distance from the working face, the tunnel dust either settles or stagnates along the way. Moreover, due to the effect of the slope, the dust spreads outward to a certain position and then sinks or stagnates.
(2) At 25°, the concentration is higher at locations closer to the dust source. This is mainly because the slope is larger, and dusts with larger particle sizes are not easily diffused to the outside, but easily deposited at the bottom of the inclined shaft.
(3) The dust concentration is very low and tends to be stable at 5°. It is also lower throughout the diffusion process, with a wider range of dust filling and a more uniform distribution of concentration. This indicates that there is no slope and that it is more favorable for constructions with the unchanged wind speed of the air outlet.

Figure 6: Dust concentration at different slopes and cross sections (a: 25°, b: 15°, c: 5°)
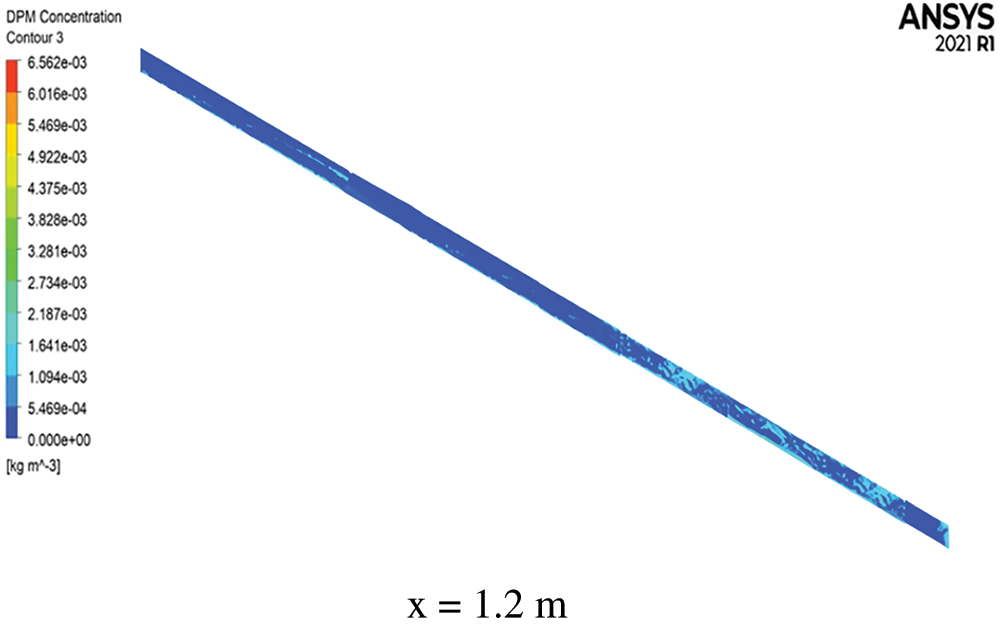
Figure 7: Plane dust concentration
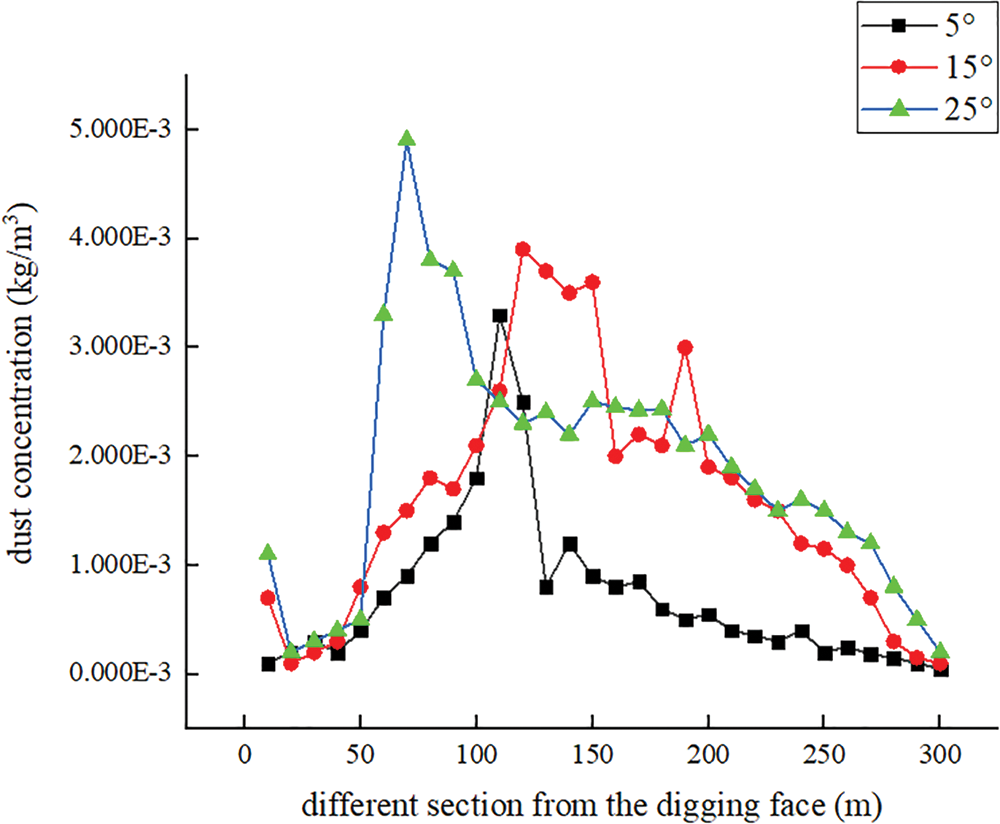
Figure 8: Comparison of dust particles concentration in different sections at different slopes away from the boring face
4.6 Dust Distribution Pattern under Different Section Sizes
The dust distribution is also influenced by the different sizes of the sections in inclined tunnels. With a slope of 25°, the duct outlet was set at 15 m from the boring face. Subsequently, the section sizes of 4.8, 4.2, 3.6 and 3 m were studied. Moreover, a cloud map of dust particle concentration distribution was made and the concentration at different section sizes was compared for the different sections of the excavation’s working face.
Dust concentration in the horizontal direction of the tunnel section at section size 3.6 m.
The following can be drawn from Figs. 9 to 11:
(1) When the cross-section size is 3 m, the dust concentration is relatively small in the whole tunnel. However, due to the small cross-section size, the dust does not easily diffuse outward at the constant wind speed. Accordingly, the dust concentration decreases gently after reaching a certain area. As the size of the cross-section increases, the concentration decreases more obviously, which is an indication of a larger cross-section size leading to the easier outward spread of the dust.
(2) While the dust concentration is large at the face, its maximum level is not near the dust source, but at a distance from it. As the distance from the working face increases, the tunnel dust is either settled down or trapped along the way, resulting in the concentration to gradually decrease and stabilize.

Figure 9: Dust concentration at different section sizes of different sections (a: 4.2 m, b: 3.6 m, c: 3 m)
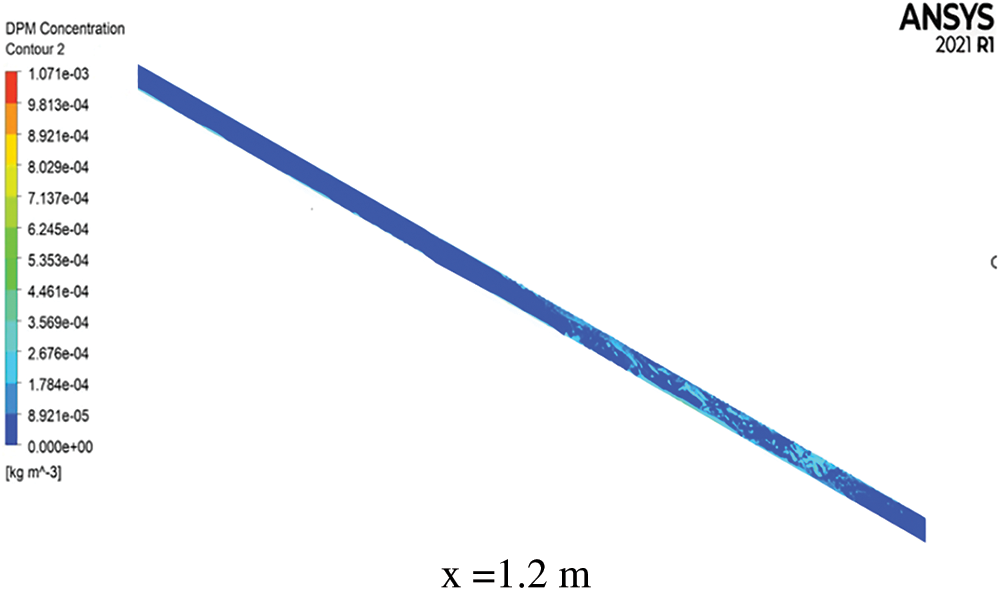
Figure 10: Plane dust concentration
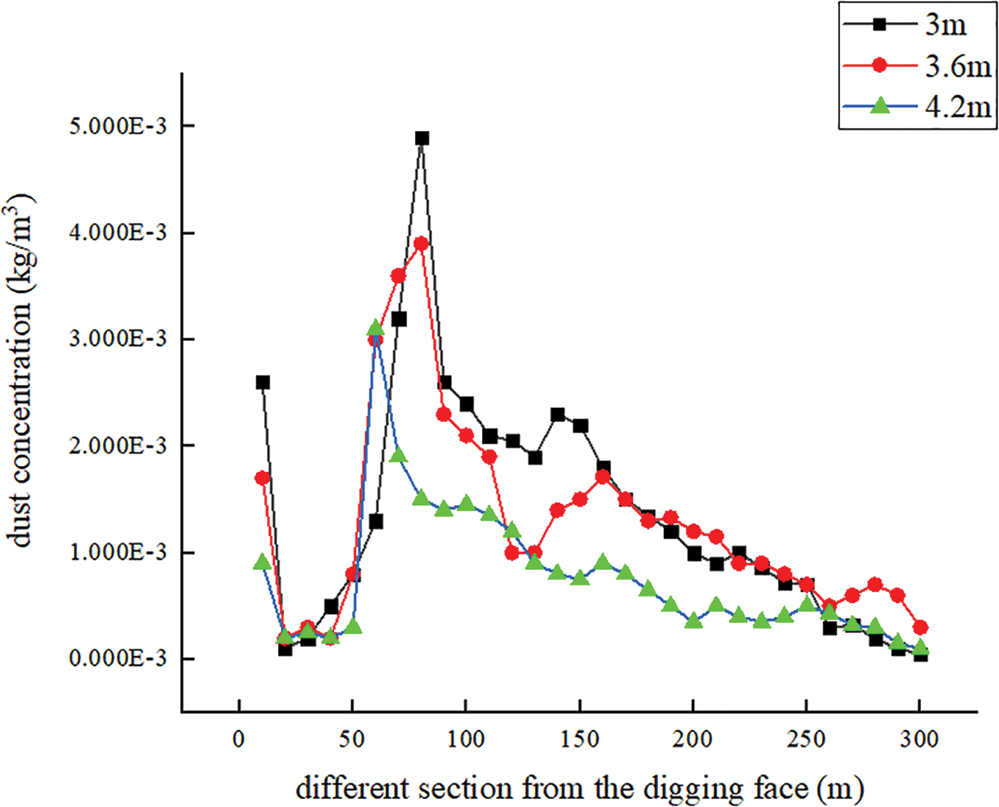
Figure 11: Comparison of dust particle concentration at different sections from different sections of heading face under different section sizes
5 Conclusions and Future Prospects
Fluent software was adopted in the present study to simulate the dust transportation of a small cross-section and a large steep slope inclined shaft tunnel after press-in ventilation. Accordingly, the dust transportation law was obtained. Hence, the following conclusions are drawn:
(1) A brief introduction was provided to computational fluid dynamics. The software used for the simulation was also identified. Moreover, the fluid motions and the related phenomena were simulated and analyzed by discretizing the system of hydrodynamic equations into a set of numerical equations. Also, they were solved using a computer, and the solution process of computational fluid dynamics was elucidated.
(2) Prior to performing the simulation, a clear physical and mathematical model was required to ensure its accuracy and reliability. The model was also necessary for defining the mesh size, the time step and the boundary conditions required for the numerical simulation. Ensuring the correct setting of these parameters and boundary conditions is critical to obtaining accurate and applicable numerical simulation results. Additionally, the study indicates that refining the mesh significantly reduces dust concentrations in all sections, and as the mesh density increases, the dust concentration tends to stabilize. This provides strong support for improving simulation accuracy and optimizing the ventilation scheme.
(3) The distribution law of dust concentration was investigated for small section as well as large steep slope inclined shaft tunnel under different factors. Accordingly, it was found that: (a) better results are obtained when the ventilation distance is 15 or 13 m; (b) the dust concentration is lower in the whole diffusion process when the slope is 0°, which indicates that it is more favorable for constructions without a slope when the wind speed is constant at the outlet; and (c) the dust concentration decreases more obviously with the enlargement of the section size.
(4) In order to achieve better dust control, future works can use the obtained results to further optimize the ventilation scheme. Such parameters as ventilation distance and wind speed can also be adjusted to improve ventilation efficiency and construction safety. The significant influence of multiple factors such as humidity, temperature and other environmental factors can also be considered in the simulation calculation. Finally, in order to more accurately predict the dust distribution pattern, changes in the actual situation occur during the construction process can be investigated.
Acknowledgement: The authors would like to express our sincere gratitude to the funding agencies that have made this research possible.
Funding Statement: This work was supported by the National Natural Science Foundation of China under the Youth Project (Grant No. 52204087). Additional support was provided by the Science and Technology Research Program of the Chongqing Municipal Education Commission (Grant No. KJQN202200746).
Author Contributions: Liangwen Wei conceptualized and designed the study and analyzed the data. Baoli Zang assisted with data collection and interpretation. Liyang Shao provided critical feedback. Yang Li helped shape the research questions and analysis. Hao Ran contributed to the writing of the manuscript. All authors reviewed and approved the final version of the manuscript.
Availability of Data and Materials: Data will be made available on request.
Ethics Approval: Not applicable.
Conflicts of Interest: The authors declare no conflicts of interest to report regarding the present study.
References
1. Li T. Ventilation technology of long main hole with high burial depth under the condition of long inclined shaft. In: Proceedings of the Academic Exchange Conference on Construction Science and Technology and Management, 2017; Beijing, China; p. 35–7. [Google Scholar]
2. Weisenpacher P, Glasa J, Valasek L, Kubisova T. FDS simulation of smoke backlayering in emergency lay-by of a road tunnel with longitudinal ventilation. J Phys: Conf Series. 2021;2090:012100. [Google Scholar]
3. Cvjetic Aleksandar S, Lilic Nikola M, Cokorilo Vojin B, Milisavljevic Vladimir M. Case study on ventilation method development for Bar-Boljare highway tunnels construction in Montenegro. Tehnika. 2017;72(5):667–74. doi:10.5937/tehnika1705667C. [Google Scholar] [CrossRef]
4. Porras-Amores C, Mazarrón FR, Cañas I, Sáez PV. Natural ventilation analysis in an underground construction: CFD simulation and experimental validation. Tunnell Undergr Space Technol. 2019;90:162–73. doi:10.1016/j.tust.2019.04.023. [Google Scholar] [CrossRef]
5. Guo J, Li A, Hu J, Xiong J, Yang C. Normalized modeling of airflow-respirable dust migration and distribution in drilling construction tunnels with different cross-sections. Atmos Pollut Res. 2023;14(3):101690. doi:10.1016/j.apr.2023.101690. [Google Scholar] [CrossRef]
6. Hu H, Tao Y, Zhang H, Zhao Y, Lan Y, Ge Z. Experimental study on the influence of longitudinal slope on airflow-dust migration behavior after tunnel blasting. Sci Rep. 2023;13(1):19792. doi:10.1038/s41598-023-46242-5. [Google Scholar] [PubMed] [CrossRef]
7. Zhu Y, Chen T, Sun S, Ji Y, Zhao D, Zhuang D, et al. Influence of air volume and temperature in the air inlet tunnel on the characteristics of dust movement. ACS Omega. 2024;9(1):866–78. doi:10.1021/acsomega.3c06816. [Google Scholar] [PubMed] [CrossRef]
8. Nie W, Jiang C, Sun N, Guo L, Liu Q, Liu C, et al. CFD-based simulation study of dust transport law and air age in tunnel under different ventilation methods. Environ Sci Pollut Res Int. 2023;30(53):114484–500. doi:10.1007/s11356-023-30286-1. [Google Scholar] [PubMed] [CrossRef]
9. Hao T, Wang L, Wang Z, Li F, Jiang W, Jiang S. Research on dust migration and dust deposition rules of breathing zone in fully mechanized mining face. ACS Omega. 2023;8(42):39143–53. doi:10.1021/acsomega.3c04251. [Google Scholar] [PubMed] [CrossRef]
10. Jing D, Ma M, Ge S, Zhang T, Meng X, Ren S. Study on the dust migration law and a spray dust suppression scheme in transportation roadway. Environ Sci Pollut Res Int. 2023;30(21):59316–26. doi:10.1007/s11356-023-26716-9. [Google Scholar] [PubMed] [CrossRef]
11. Liu N, Chen K, Jiang P, Huang Y. Research on dust migration law and dust reduction efficiency in the operation process of tunnel boring machine. KSCE J Civil Eng. 2021;26:1419–27. doi:10.1007/s12205-021-0609-5. [Google Scholar] [CrossRef]
12. Liu F, Feng X. Study on dust concentration distribution in a construction tunnel. IOP Conf Series: Earth Environ Sci. 2021;687(1):012162. [Google Scholar]
13. Xu D, Shen Y. A novel CFD-DEM-DPM modelling of fluid-particles-fines reacting flows. Chem Eng Sci. 2024;292:120014. doi:10.1016/j.ces.2024.120014. [Google Scholar] [CrossRef]
14. Tu S, Li W, Zhang C, Wang L, Jin Z, Wang S. Seepage effect on progressive failure of shield tunnel face in granular soils by coupled continuum-discrete method. Comput Geotech. 2024;166:106009. doi:10.1016/j.compgeo.2023.106009. [Google Scholar] [CrossRef]
15. Mironov VL, Mironov SV. Vortex model of plane couette flow. Fluids. 2023;8(6):165–70. doi:10.3390/fluids8060165. [Google Scholar] [CrossRef]
16. Riyadh B, Abdelhakim S, Khaled C, Adrian I. Numerical modeling of horizontal axis wind turbine: aerodynamic performances improvement using an efficient passive flow control system. Energies. 2022;15(13):4872–2. doi:10.3390/en15134872. [Google Scholar] [CrossRef]
17. Qin Y, Zhang M, Cui L, Liu J. Numerical modeling of dust transportation in a comprehensive excavation face and research on dust reduction by pressurized air diversion. J Univ Sci Technol Beijing. 2011;33(7):790–4. [Google Scholar]
18. Wu T, Yang Z, Wang A, Zhang K, Wang B. A study on movement characteristics and distribution law of dust particles in open-pit coal mine. Sci Rep. 2021;11(1):14703. doi:10.1038/s41598-021-94131-6. [Google Scholar] [PubMed] [CrossRef]
19. You R, Kinnas SA. VIScous vorticity equation (VISVE) model applied to 2-D turbulent flow over hydrofoils. Ocean Eng. 2022;256:111416. doi:10.1016/j.oceaneng.2022.111416. [Google Scholar] [CrossRef]
20. Feng S, Liao Y, Liu W, Dai J, Xie M, Li L. Numerical simulation of asphaltene precipitation and deposition during natural gas and CO2 injection. Fluid Dyn Mater Proc. 2024;20(2):275–92. doi:10.32604/fdmp.2023.041825. [Google Scholar] [CrossRef]
Cite This Article
 Copyright © 2025 The Author(s). Published by Tech Science Press.
This work is licensed under a Creative Commons Attribution 4.0 International License , which permits unrestricted use, distribution, and reproduction in any medium, provided the original work is properly cited.
 Downloads
 Citation Tools