
 Submit a Paper
 Propose a Special lssue
 Open Access
ARTICLE

A Numerical Study on Erosion and Wear Mechanisms in Variable Diameter Bend Pipes
1 Shandong Jining Yunhe Coal Mine Co., Ltd., Jining, 272000, China
2 College of Resources, Shandong University of Science and Technology, Tai’an, 271019, China
3 School of Transportation Engineering, Dalian Jiaotong University, Dalian, 116028, China
* Corresponding Author: Jiming Zhu. Email:
Fluid Dynamics & Materials Processing 2025, 21(4), 989-1005. https://doi.org/10.32604/fdmp.2025.057931
Received 31 August 2024; Accepted 12 December 2024; Issue published 06 May 2025
 View Full Text
 Download PDF
Abstract
To elucidate the relationship between pipeline erosion and wear during slurry transportation, this study considers three key influencing parameters, namely, the ratio of inlet to outlet pipe diameter, the length of the variable diameter section, and the roughness of the pipe wall. The impact of these factors on pipeline erosion and wear is analyzed using a single-factor analysis approach. In particular, the Fluent software is employed to conduct the required numerical simulations for variable diameter elbows of varying morphologies. The results indicate that as the inlet to outlet diameter ratio increases, the wear on the pipe inlet and the outer wall of the elbow becomes increasingly pronounced. Notably, when the diameter ratio exceeds 0.8, there is a significant escalation in wear on both the inner and outer elbow walls. Initially, the maximum erosion rate decreases sharply with increasing diameter ratio before a stable condition is attained. Erosion wear in the variable diameter section exhibits a distinct layered distribution pattern. In this region, the wear range for a 40 mm length of the pipe body is relatively small; however, once this length exceeds 40 mm, the wear range expands, ultimately covering the entire pipe section. The length of the variable diameter section significantly influences the maximum erosion rate of the pipeline, with sections shorter than 80 mm experiencing the most severe effects, and showing an exponential decline in erosion rate. As the wall roughness gradually increases, the wear area on both cheeks of the bend section rapidly expands and tends to deepen further. When the roughness reaches 4 mm, the pipeline wear experiences a dramatic shift, resulting in extensive “spot-like” wear patterns emerging at the bottom and sides of the horizontal flow section, which previously exhibited no wear.Keywords
Erosion and wear are typical failure modes of filling slurry transportation pipelines, and the wear can cause a sharp decrease in the strength and stiffness of pipelines [1–4]. The study of the areas and degrees of pipeline wear is crucial for ensuring pipeline transportation efficiency and safety. The variable-diameter pipes are often used in slurry transportation to control slurry flow and protect transportation pipelines [5–9]. The existence of variable-diameter pipes can cause instantaneous changes in the slurry transportation state, increase the degree of wear on the pipe wall, and increase the probability of failure. Accurately predicting the wear area and wear degree of pipelines based on the specifications, slurry characteristics, and filling techniques are therefore a key issue in pipeline transportation. Scholars used indoor experiments and numerical simulation methods to study the erosion wear mechanism and wear law of pipelines. Makwana et al. [10] studied the effects of impact angle and particle impact velocity on the wear rate of nickel-based hard materials at 20% mortar concentration by using a slurry tank tester. Abdelrhman et al. [11] obtained the erosion properties and associated mechanisms at different erosion angles by slurry rotating erosion test-bed. Liu [12] quantitatively measured the wear effect of four kinds of filling slurry on pipe walls by designing a roller wear experimental device and obtained the rule of particle size change with time and wear law. Xie [13] obtained the relationship between the internal protrusions and the wear rate under the condition of solid-liquid two-phase flow by building a test platform. Fu et al. [14] studied the erosion of the elbow under different pipe diameters and bend diameter ratios by Fluent software and got the relationship between wear rate and pipe diameter and bend diameter ratio. Xu et al. [15] used the Discrete Phase Model (DPM) model to simulate the erosion of liquid-solid two-phase flow in a three-way pipe and obtained the distribution law of wear at branches. Liu et al. [16] analyzed the dense discrete phase model and found that pipeline wear was not only related to particle impact velocity but also to the mass fraction of particles in the transportation of high-concentration slurry. Zhang et al. [17] established a variable-diameter curved pipe consisting of a curved pipe and an oblique vertebral pipe, the anti-wear property of the kind of elbow was verified by fluent flow field simulation. Guo et al. [18] studied the impact of particle size, shape, slurry viscosity, flow rate, and other factors on pipeline wear based on the actual filling pipeline in a certain mine. Wang et al. [19] used a numerical simulation method to construct an erosion model and found that local erosion rate was closely related to particle size. Mao et al. [20] simulated the flow of high-concentration packing slurry in pipes, the influence of slurry density, pipe diameter, filling doubling line, vertical pipe height and particle size on pipe wear was quantitatively analyzed.
Many scholars have studied the erosion wear mechanism and wear law of pipelines by means of laboratory tests and numerical simulation, and have obtained a series of valuable research results. However, in the process of research, most of the research pipes are straight pipes and elbow pipes, and there is less research on the transport wear of irregular pipes such as high-density slurry reducers. For variable diameter bend pipes, inlet and outlet pipe diameter ratio, variable diameter length and pipe wall roughness are three important factors affecting the erosion wear of pipe. Therefore, this paper adopts multi-dimensional factor comprehensive consideration, and the study is not limited to the influence of a single factor on erosion wear of slurry conveying pipe but innovatively selects three key factors: inlet and outlet pipe diameter ratio, variable diameter length and pipe wall roughness, and systematically discusses their complex interaction against erosion wear through single factor analysis method, providing a more comprehensive theoretical basis for pipeline design. The theoretical model of erosion wear of filling slurry in variable-diameter bend pipe was established by using Fluent software, and the dynamic transport characteristics of slurry in the pipe were simulated by numerical simulation method, which provided an efficient and accurate tool for predicting pipe wear.
2 Theoretical Model and Governing Equation of Erosion Wear
Using euler-lagrange model, the fluid flow in each phase must obey the conservation laws of mass and momentum. The transport of the continuous phase and the motion of the discrete phase take into account two coupling terms [21].
The continuity equation is
where ux, uy, uz is velocity components in different directions.
The conservation equation of momentum was
where
The standard turbulence model adopted by the two equations was [22]
The turbulent viscosity was
where
The energy conservation equation describes the energy change of a fluid in space and time. The equation shows that in unit time and unit volume, the energy change rate of the fluid is equal to the sum of energy input minus energy output and energy production and consumption, and the energy conservation equation is
where E is the total energy held by the fluid, J/kg; h is the work done by the internal energy of the fluid and the external pressure, J/kg; hj is enthalpy of component j, J/kg; keff is effective conductivity, depending on the characteristics of the system and problem under study, W/m·K; Jj is the amount of diffusion of component j through unit area in unit time, kg·s−1·m−2; Sh is volumetric heat source term described in the energy conservation equation, J.
2.2 Discrete Phase Control Model
The discrete phase occupied a very small concentration in the slurry, and the interaction between the two phases and the effect of the interaction on the two-phase motion were considered, the forces acting on solid particles under the conditions could be expressed in cartesian coordinate system [23].
where
The influencing factors of pipeline erosion wear mainly include material property, particle property, impact velocity, impact angle, geometry shape and so on. The paper selected the erosion wear model defined in FLUENT. Erosion corrosion model has also achieved good prediction effect in pipe erosion, so this model is selected for simulation [24].
where
2.4 Wall Collision Recovery Equation
The rebound velocity of particles was not constant after they entered the pipe and collide with the pipe. Because of the energy transfer and loss after colliding, the rebound velocity of particles was always lower than the incident velocity. The wall collision recovery function was usually used to express the characteristic. In the paper, the recovery coefficient equation of Forder was adopted. The empirical formula was [25]
where
3 Pipeline Modeling and Grid Generation
3.1 Geometric Models and Their Meshes
The pressure-velocity coupled equations are based on SIMPLE algorithm, the standard of residual convergence is set to 10−5, and the Discrete Phase Model (DPM) model is used for coarse particle phase. Select Velocity-inlet and pressure-outlet, and set the turbulence parameter to turbulence intensity and hydraulic diameter, the former is set to 5%, the latter is set according to the parameters of the inlet and outlet pipe, and the contact condition of gangue particles is escape. The inner wall of the pipeline is a uniform sand granular surface, and the boundary condition type of the wall is reflect.
GM (Geometric Model) was used to set up variable diameter bend pipes in Ansys program. The orthographic drawings and grid division of the variable diameter elbow was shown in Fig. 1. The variable diameter bend pipes were composed of inlet G1, elbow G2, advection G3, variable diameter G4 and outlet G5. R1 represented inlet diameter and R2 represented outlet diameter. The initial inlet pipe diameter R1 = 200 mm. The outlet pipe diameter R2 was 150 mm. The diameter-changing section length was 100 mm. The orthographic drawings and grid division of the variable diameter elbow. Grid independence of pressure drop at inlet-outlet and maximum erosion rate was shown in Fig. 2. It was shown that when the number of grids increased to 800,000, the changes of the maximum erosion rate and fluid pressure drop tended to be stable, the simulation results had high accuracy.
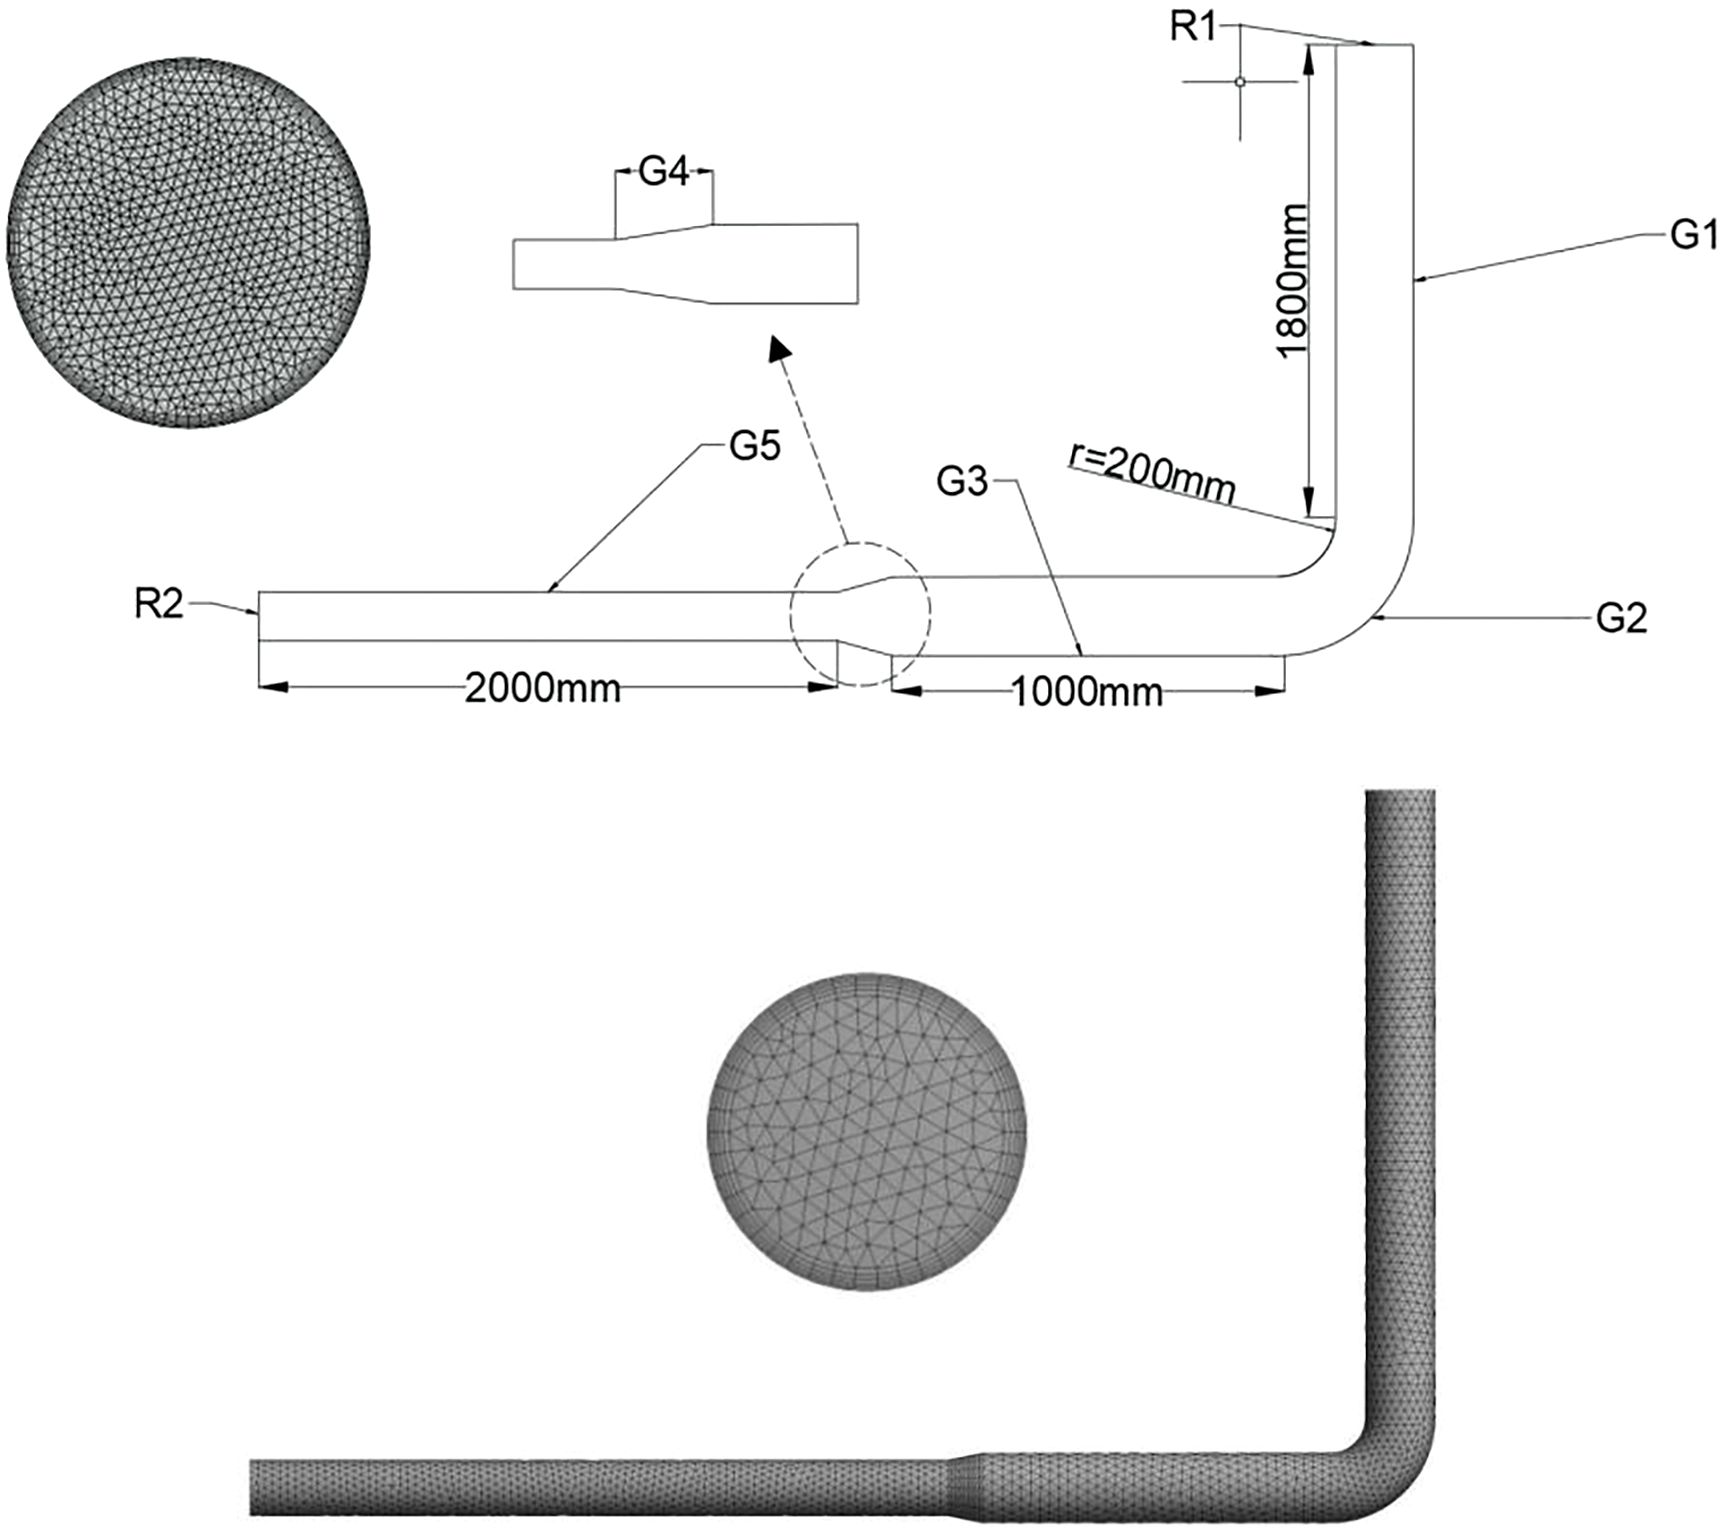
Figure 1: The orthographic drawings and grid division of the variable diameter elbow
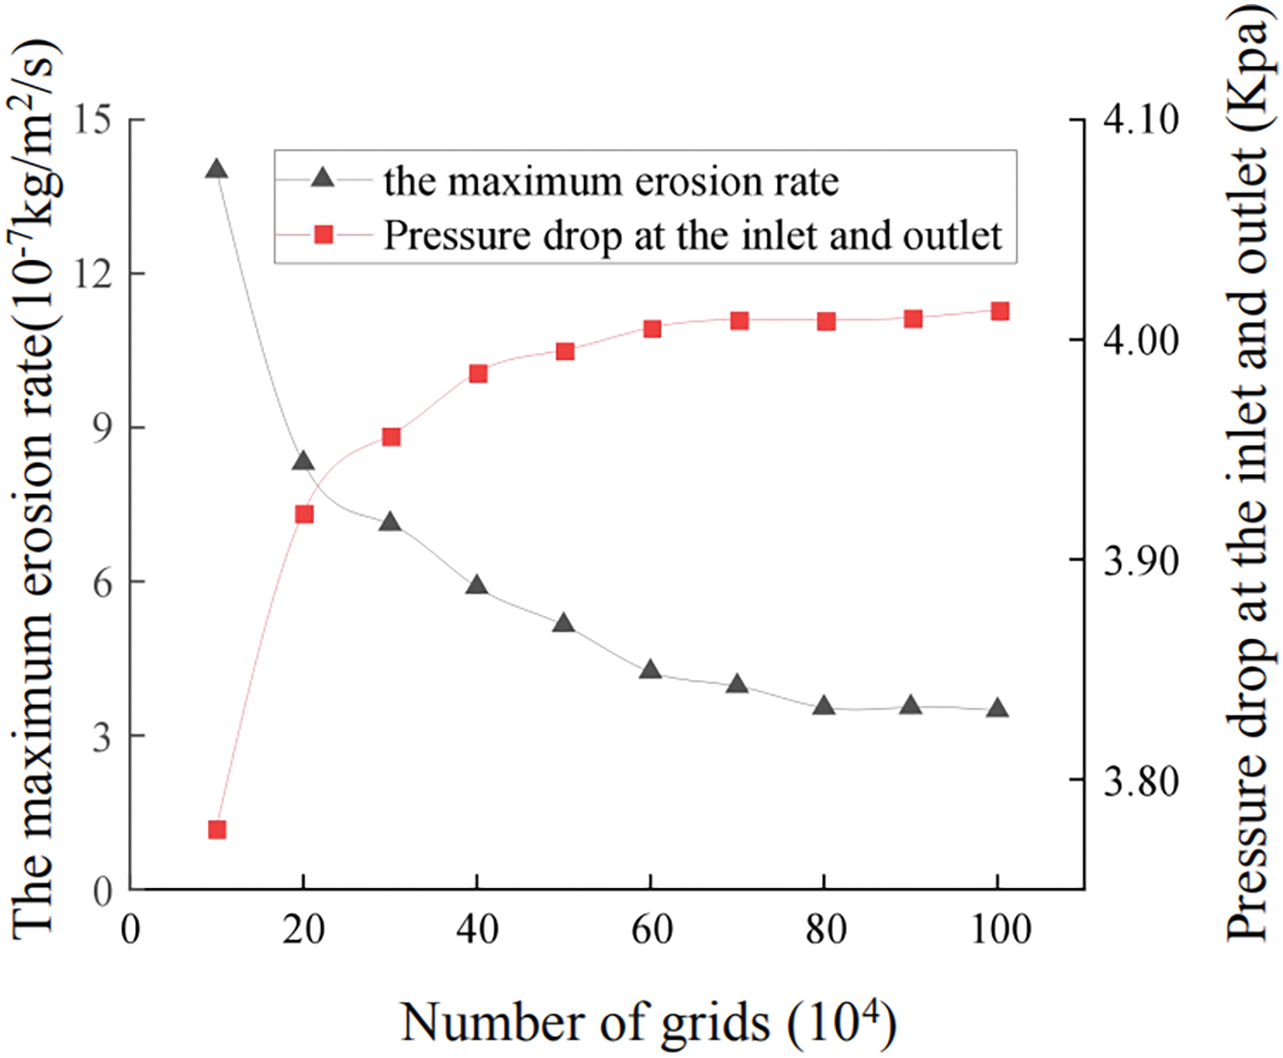
Figure 2: Grid independence of pressure drop at inlet-outlet and maximum erosion rate
The slurry density of fly ash, water and fine gangue particles was set at 1900 kg/m3. The rheological parameters τR was 81.7 pa. η was 2.88 pa·s. The density of coarse gangue was set at 2300 kg/m3. The particle size was R-P distribution.
3.3 Boundary Condition Setting
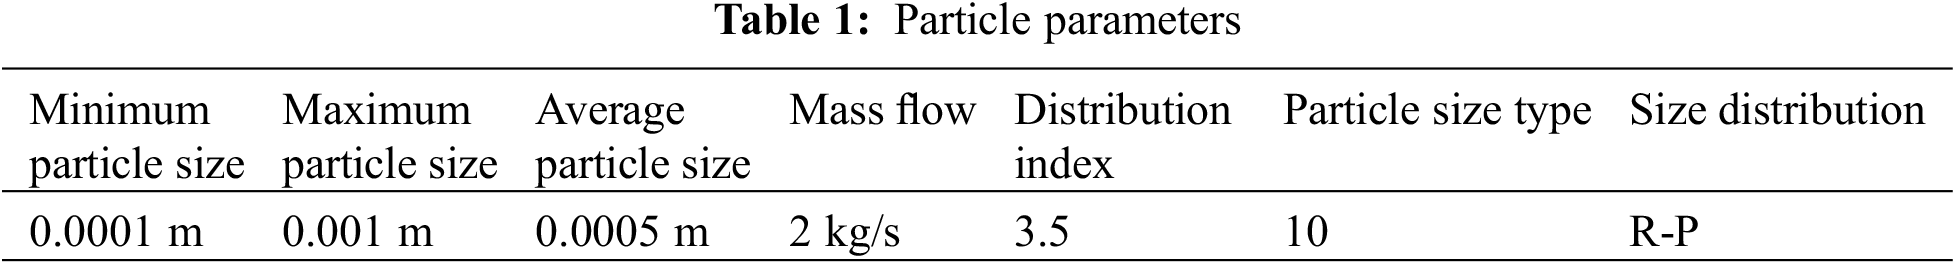
The velocity-inlet and pressure-outlet were selected. The contact condition of gangue particles was escape. The wall of pipeline was set as non-slip interface. The relative roughness was 0.5. The boundary condition of wall was reflected. The initial velocities of discrete and continuous phases were all set at 1.44 m/s. In this paper, gangue particles of existing slurry are measured to determine their particle size. The measured minimum particle size is 0.0001 m, the maximum particle size is 0.001 m, and the average particle size is 0.005 mm. The particle parameters are shown in Table 1.
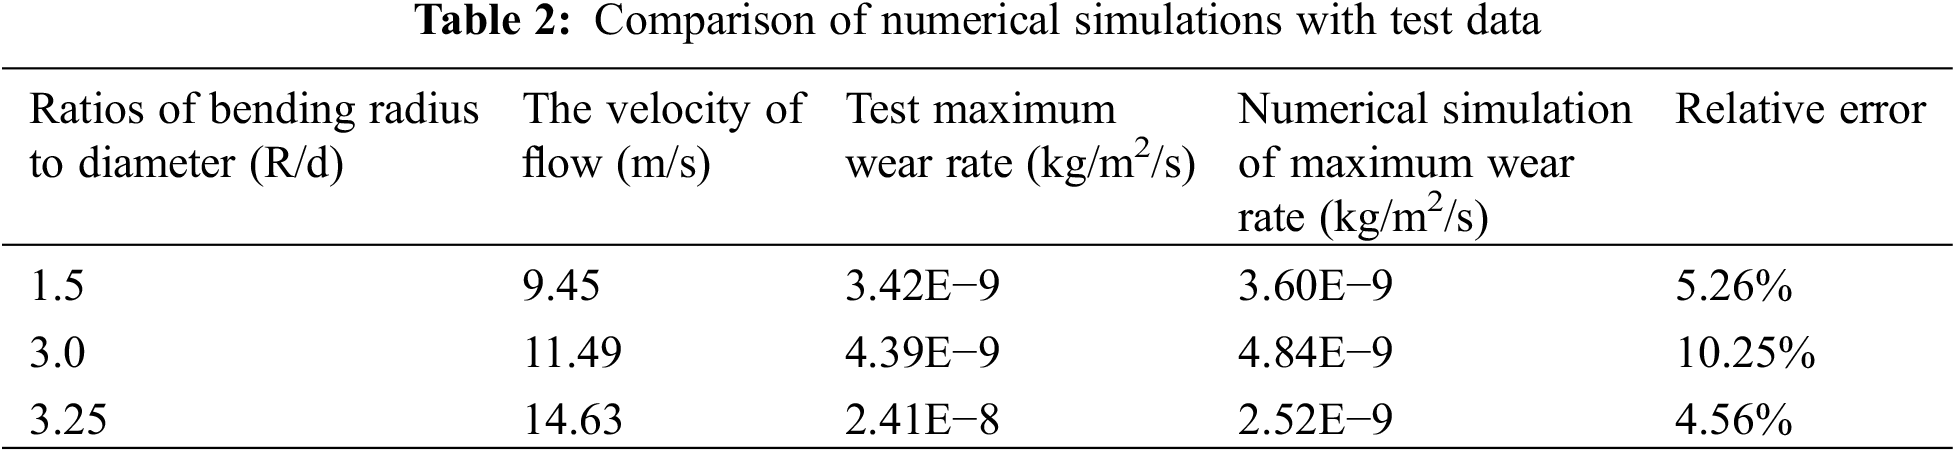
To verify the validity of the erosion wear model, the simulation results were compared with the data obtained from Bourgoyne test [26]. In the test, the fluid phase was mud. The plastic viscosity was 0.006 pa·s. And the particle was a semicircular sand particle with a diameter of 350 μm. The comparison of numerical simulation and test data of erosion-wear was shown respectively in Table 2. It was shown that the maximum wear rate obtained from numerical simulation and experiments was relatively close to each other. And the maximum error was less than 15%. Therefore, the model could be used to simulate the erosion wear of slurry on pipeline.
To study the influence of each factor on the erosion wear of filled pipe, the relationship between the single factor variable and the erosion wear was studied in the paper. The initial level of variables is set as follows. The inlet/outlet diameter ratio was 0.8. The length of the variable diameter section was 100 mm. The bend angle of the elbow was 90°. The roughness of the elbow was 0.0003. The mass concentration of slurry mixture was 78%. The inlet flow rate was 1.44 m/s. The average particle size was 0.5 mm. The mass flow rate was 2 kg/s.
4 Analysis of Calculation Results
4.1 The Effect of Inlet/Outlet Pipe Diameter Ratio on Erosion Wear
In a piping system, when fluid flows from a large-caliber pipe into a small-caliber pipe, the flow velocity of the fluid increases significantly. The increase of flow rate will directly cause the solid particles in the fluid to strengthen the impact force and erosion effect on the inner wall of the pipeline, thus aggravating the erosion wear. In a variable diameter pipeline, the trajectory of solid particles will be affected by the change of pipe diameter, resulting in the change of the collision frequency and Angle between the particles and the inner wall of the pipeline, which will directly affect the degree and position of erosion wear. In some cases, the variable diameter pipe may also lead to the deposition of particles in local areas, and these deposited particles may form an abrasive layer under subsequent fluid erosion, further increasing the erosion wear on the inner wall of the pipe. Therefore, it is of great significance to analyze the influence of inlet and outlet pipe diameter ratio on erosion wear.
According to GB 50215-2015 (Code for design of coal mines) [27], the diameter of cemented filling pipeline was 5 times larger than the maximum particle size of conveying material. The diameter of slurry filling pipeline was mostly selected in the range of 120~200 mm. S was defined as the ratio of inlet and outlet pipe diameter (R2/R1). And eight different pipe diameter ratios (0.6, 0.65, 0.7, 0.75, 0.8, 0.85, 0.9, 0.95) were set for the study. Schematic diagram of erosion wear at different inle-outlet pipe diameter ratios was shown in Fig. 3. It was shown that:
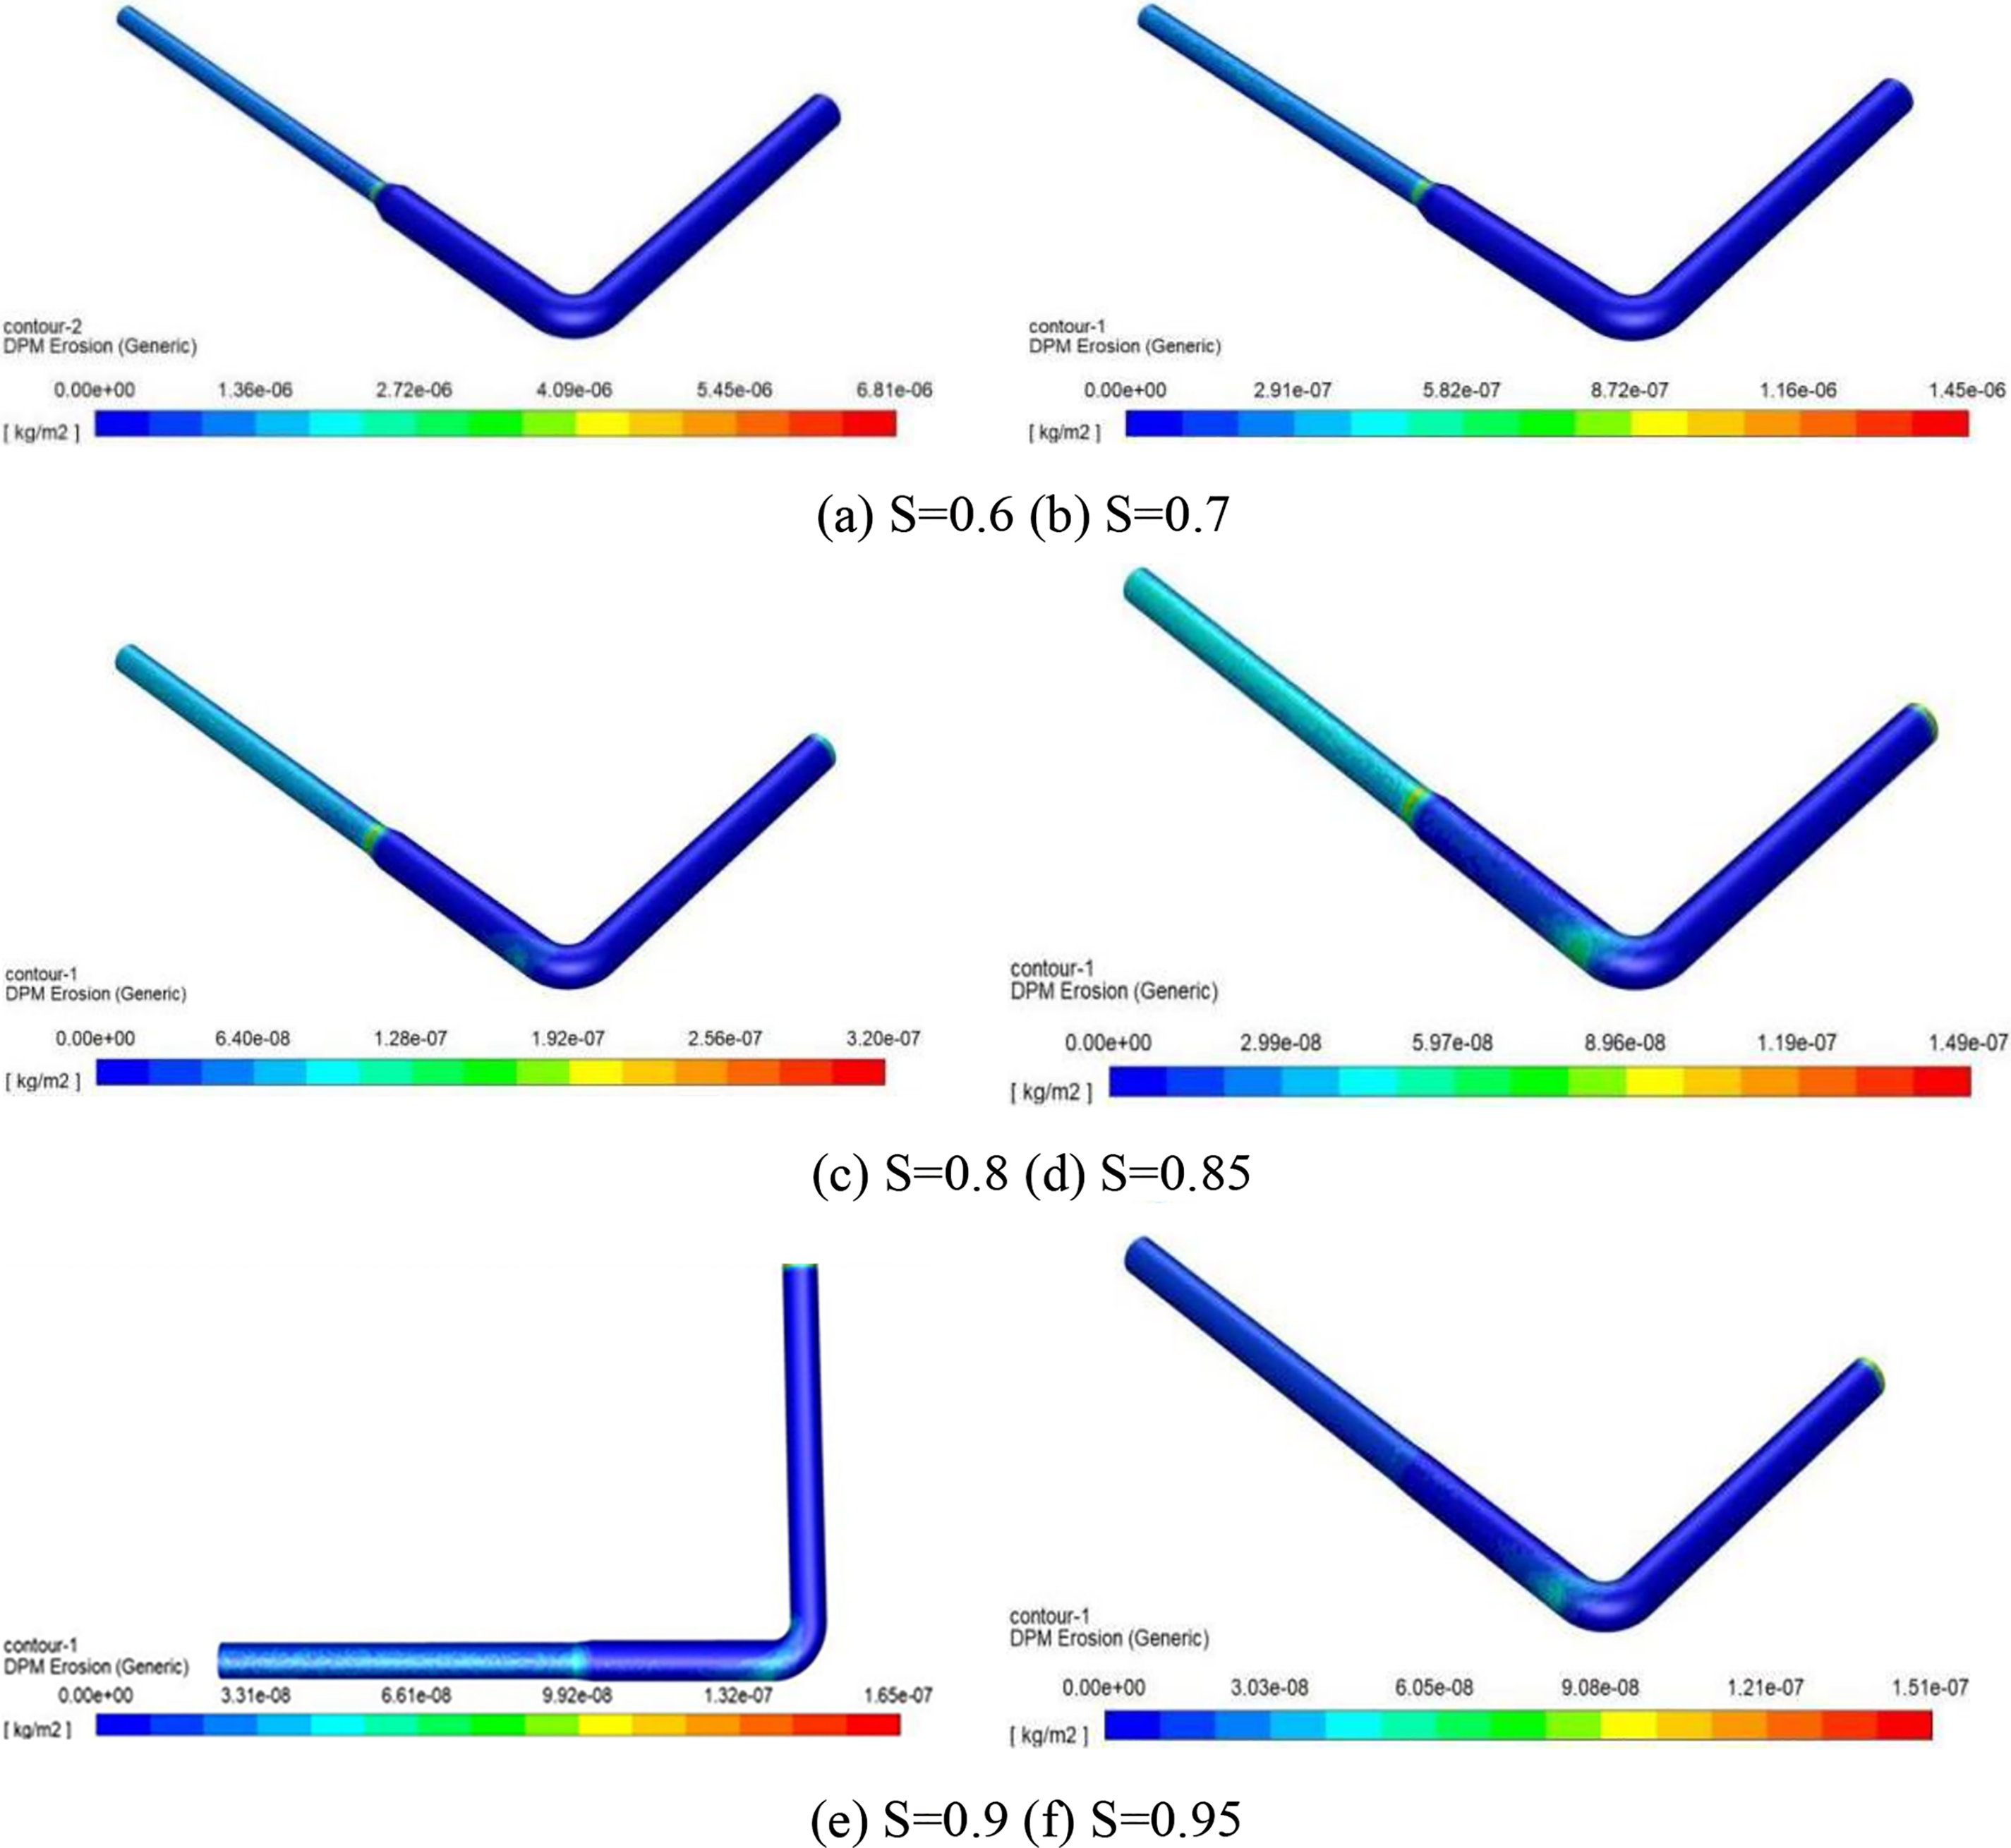
Figure 3: Schematic diagram of erosion wear at different inle-outlet pipe diameter ratios (S was defined as the ratio of inlet and outlet pipe diameter)
(1) The locations of the significant erosion and wear of pipelines were mainly at the inlet, the inner wall of the elbow, the rear of the outer wall, the diameter changing section and the outlet advection section.
(2) The wear at the inlet and the outer wall of the elbow became more obvious with the increase of the ratio of inlet to outlet and the wear at the inlet was distributed along the pipe wall in a circular pattern. The wear on the outer wall of the elbow was concentrated in a certain area and diffused from the center to the outside. The erosion area of the variable diameter section was layered along the flow direction, and the wear degree was the most serious at the end.
(3) When the ratio of pipe diameter exceeded 0.8, the wear of inner and outer wall of elbow increased obviously. When the pipe diameter ratio was 0.85, the wear was the most serious and the wear area was the largest. When the pipe diameter ratio was more than 0.85. The erosion area decreased sharply, and the maximum wear position shifted from the diameter-changing section to the entrance.
(4) In the eight working conditions, only sporadic and speckled wear areas appeared in the advection section. In the outlet section, when the pipe diameter ratio was below 0.9, the wear area was almost all over the whole section and the damage degree gradually increased.
Maximum erosion rate curve at different inlet and outlet pipe diameter ratios was shown in Fig. 4. It was shown that the maximum erosion rate showed a rapid decrease at first and then kept a stable trend with the increase of the inlet and outlet pipe diameter ratio. When the pipe diameter ratio was 0.85, the erosion rate reached its lowest point, and the erosion rate value was 1.49 × 10⁻⁷ kg/m2/s.
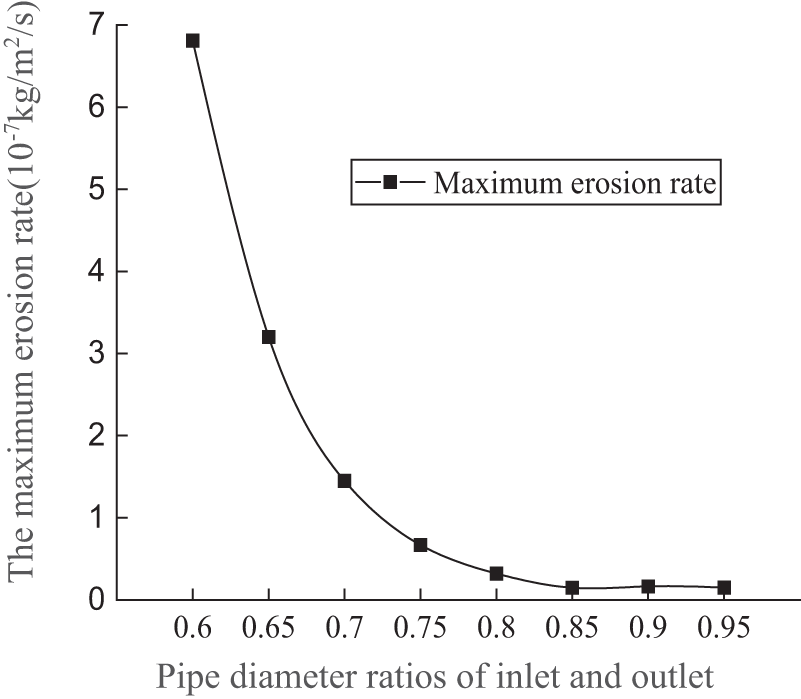
Figure 4: Maximum erosion rate curve at different inlet and outlet pipe diameter ratios
The pressure distribution and velocity change with a pipe diameter ratio 0.8 was shown in Fig. 5. The velocity cloud diagram of partial section with a pipe diameter ratio of 0.8 was shown in Fig. 6. It was shown that the changes of flow field at the outer wall of the bent pipe and the variable diameter section were the most complex. The severe wear at the inner and outer walls of the bend was due to the influence of centrifugal force and continuous phase viscosity. After the slurry entered the bend, the flow core shifted inward at 15° of the bend inlet. And when it was about to flow out of the bend section. The flow core shifted outward. The flow velocity at the inner wall of the bend and the bottom of the exit section of the bend increased, and the probability of collision between gangue particles and the pipeline increased, resulting in higher wear than other bend areas.
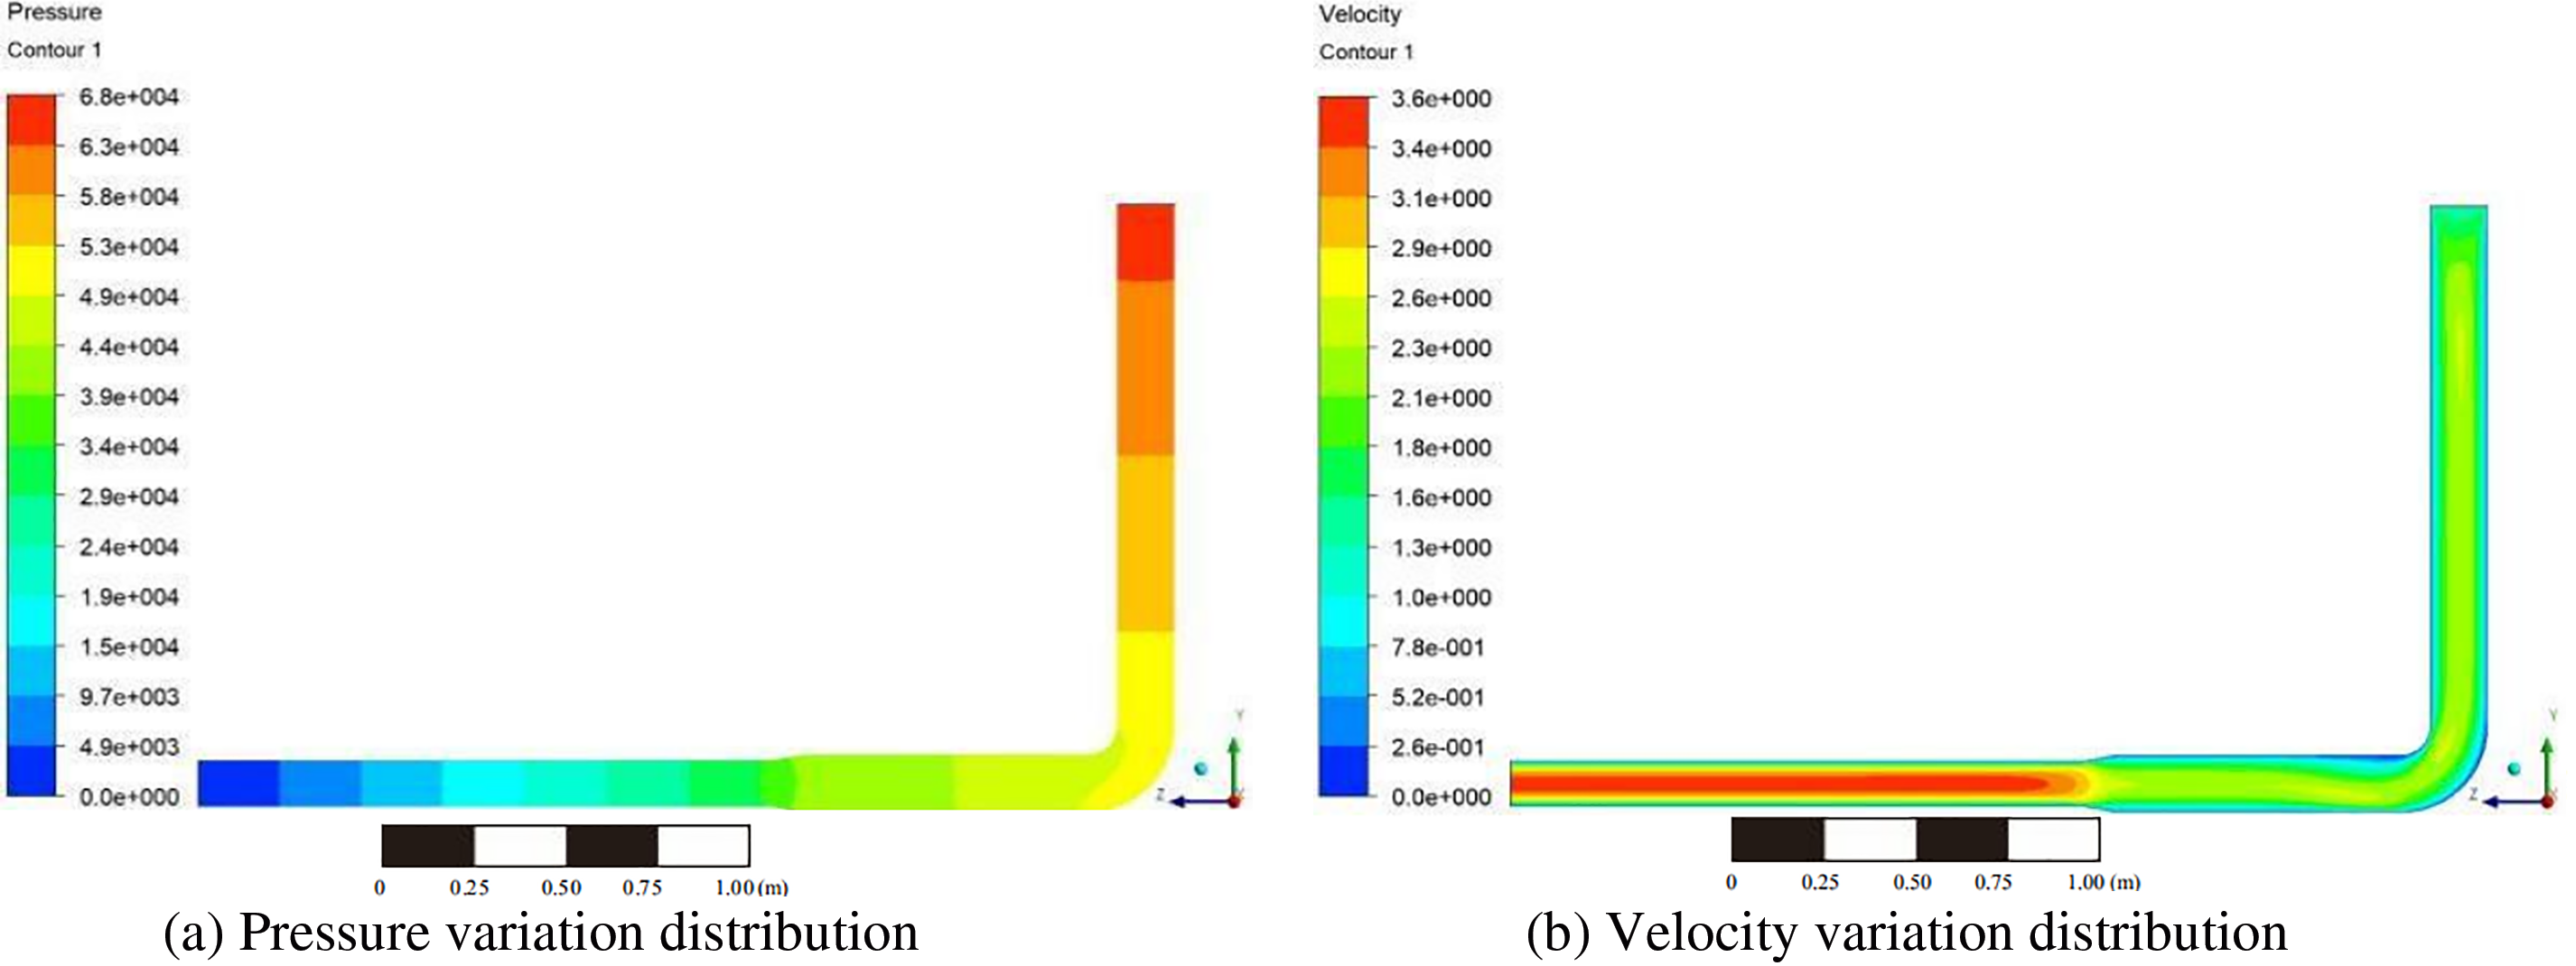
Figure 5: The pressure distribution and velocity change with a pipe diameter ratio 0.8
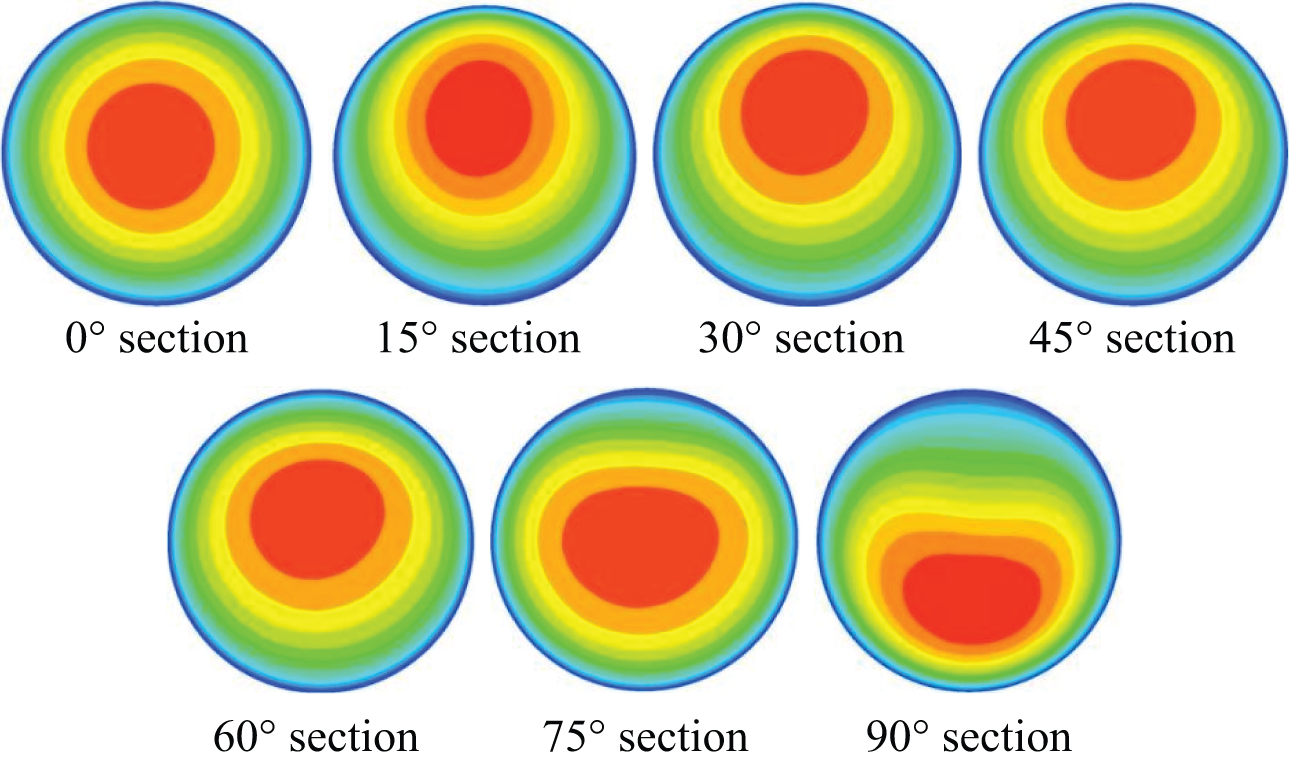
Figure 6: The velocity cloud diagram of partial section with a pipe diameter ratio 0.8
The wear of the variable diameter section was due to the sudden decrease in pipe diameter, and the particles continued to flow under the carrying effect of the fluid. The presence of inertia caused severe collisions between the particles and the pipe wall. At the same time, the density of gangue particles increased sharply, and the contact between particles and the pipe wall was frequent, resulting in the most severe wear in the area.
The overall particle concentration distribution with a pipe diameter ratio 0.8 was shown in Fig. 7. The particle concentration distribution map of the section with a pipe diameter ratio of 0.8 was shown in Fig. 8. It was shown that the slurry exhibited a relatively regular plunger flow in the vertical section. And the particles in the bent section exhibited a turbulent flow phenomenon. In the horizontal flow section, the particles were affected by gravity and flow velocity, and accumulated at the bottom of the pipeline for translational motion. After entering the variable diameter section, the flow rate fluctuated greatly, and the particles were uniformly suspended and distributed in the fluid slurry. Moreover, due to the reduction in pipe diameter, the probability of particle contact with the pipeline wall increased, resulting in an increase in the number of impacts on the pipeline. Therefore, wear in this section also became severe. When flowing through the outlet section, the particle distribution became more uniform, coupled with the combined effect of pipe diameter limitation and high flow velocity, resulting in frequent friction and collision between particles and pipes, resulting in a consistently high wear rate. This further explained the serious damage to the variable diameter and outlet sections.
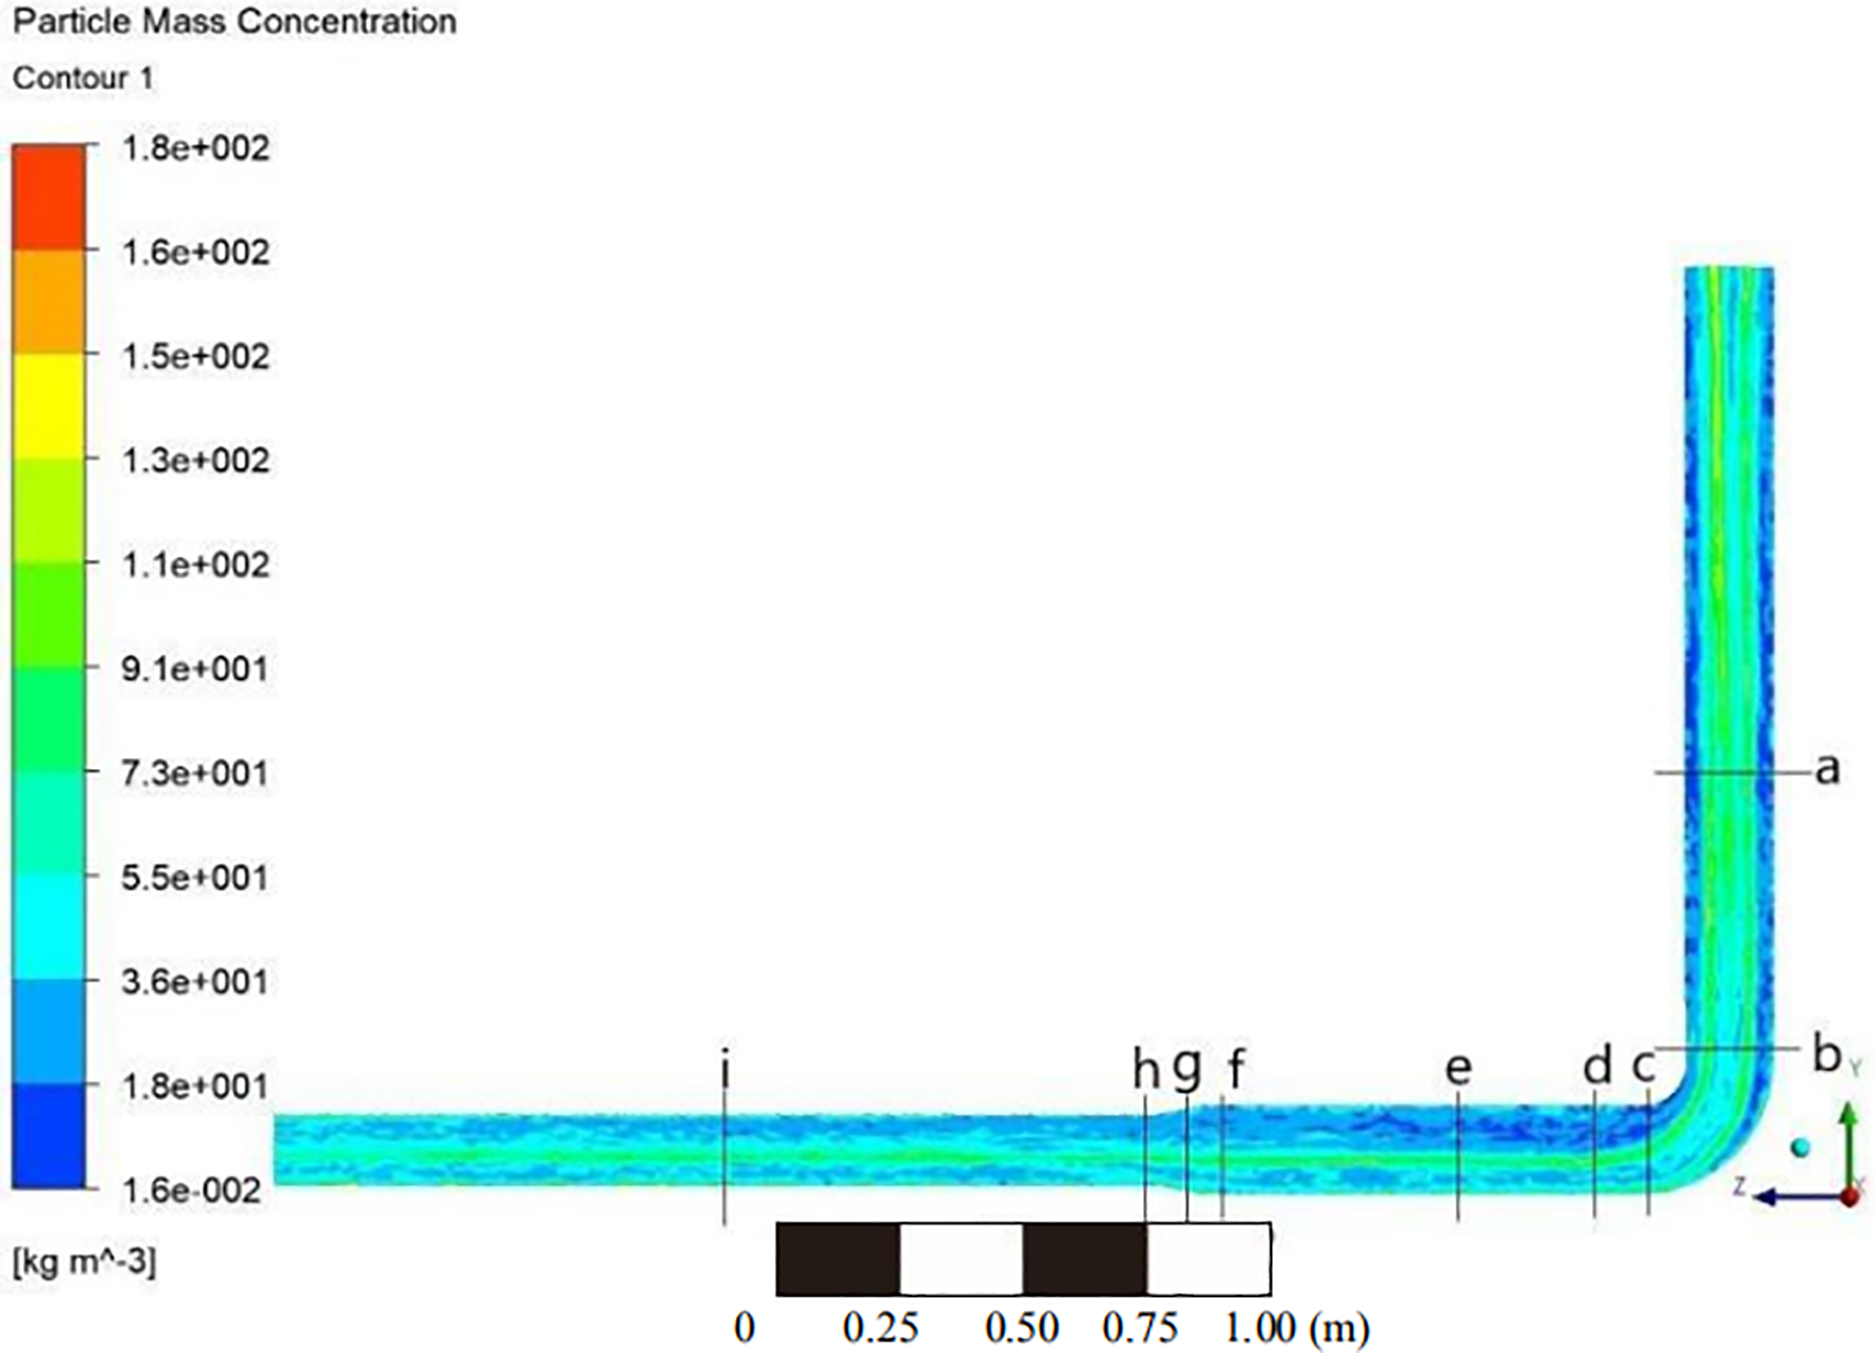
Figure 7: The overall particle concentration distribution with a pipe diameter ratio 0.8
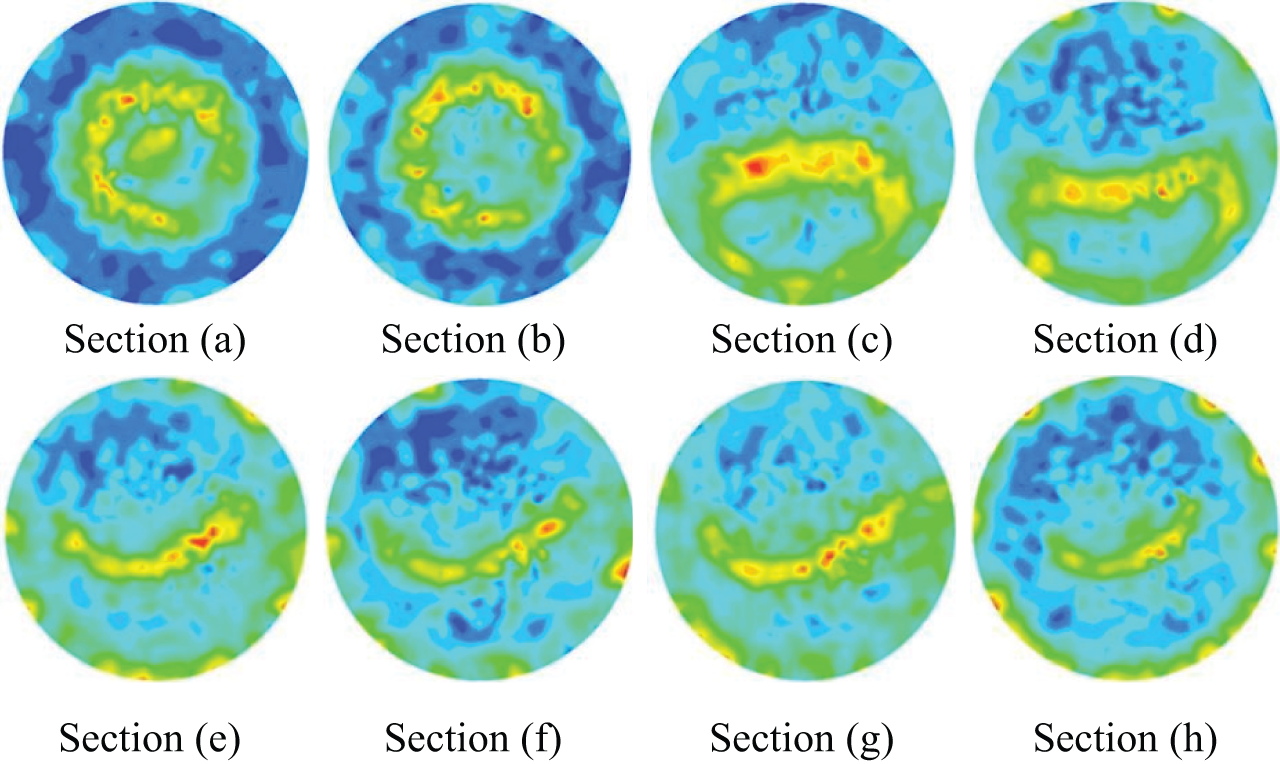
Figure 8: The particle concentration distribution of section with a pipe diameter ratio 0.8 (Sections (a) ~ Sections (h) correspond to the pipe sections in Fig. 7)
From the perspective of speed variation, the reasons for the above pattern were considered. The cross-sectional velocity at different entrance and exit pipe diameter ratios was shown in Fig. 9. It was shown that the flow velocity in the outlet section was always higher than that in the advection section, but as the inlet and outlet pipe diameter ratio increased, the speed difference between the two continuously decreased, thus confirming that the wear condition of the pipe diameter ratio before and after 0.9 was inconsistent. From the trend of velocity variation in section C, it could be concluded that when the pipe diameter ratio exceeded 0.8, there was a slight fluctuation in the flow velocity at the bottom of the bent pipe compared to before, resulting in an increase in the degree of damage at that location.
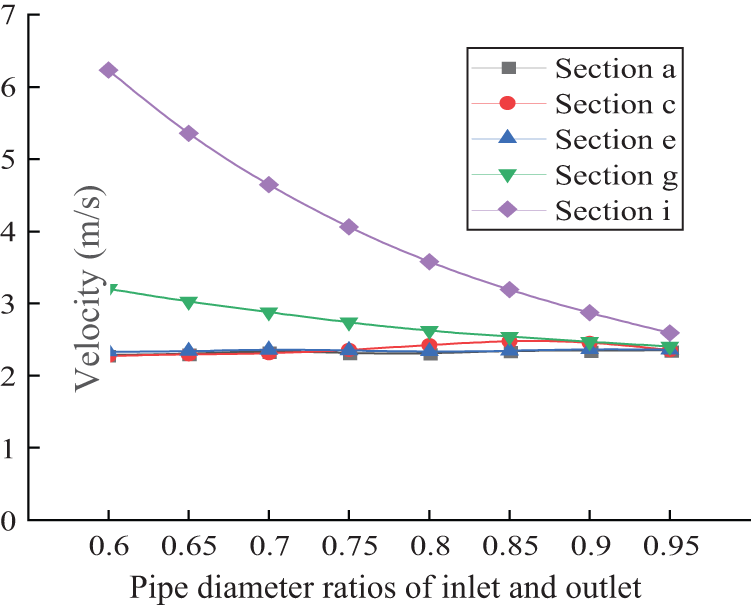
Figure 9: The cross-sectional velocity at different entrance and exit pipe diameter ratios
4.2 The Influence of Variable Diameter Length on Erosion Wear
In the variable diameter section, due to the change of pipe diameter, the flow rate of the fluid will change significantly. Variable pipe may also cause the fluid flow direction to change. The variable diameter length will affect the impact angle of solid particles or droplets in the fluid on the inner wall of the pipe. The variable diameter length also affects the distribution of the wear zone on the inner wall of the pipeline. The variable diameter length directly affects the flow state and energy loss of the fluid in the pipeline, and then determines the rate of erosion wear. The variable diameter length is chosen as one of the factors to study the effect of corrosion resistance on pipeline characteristics because of the special role of variable diameter length in pipeline system and its significant influence on fluid flow state and erosion wear rate. The relationship between variable diameter length and erosion wear can provide important basis for optimal design and maintenance of pipeline system.
The five working conditions for the length of the variable diameter section (40, 80, 120, 160, 200 mm, respectively) was set. The diagram of erosion wear with different diameter section lengths was shown in Table 3 when the pipe diameter ratio was 0.7.
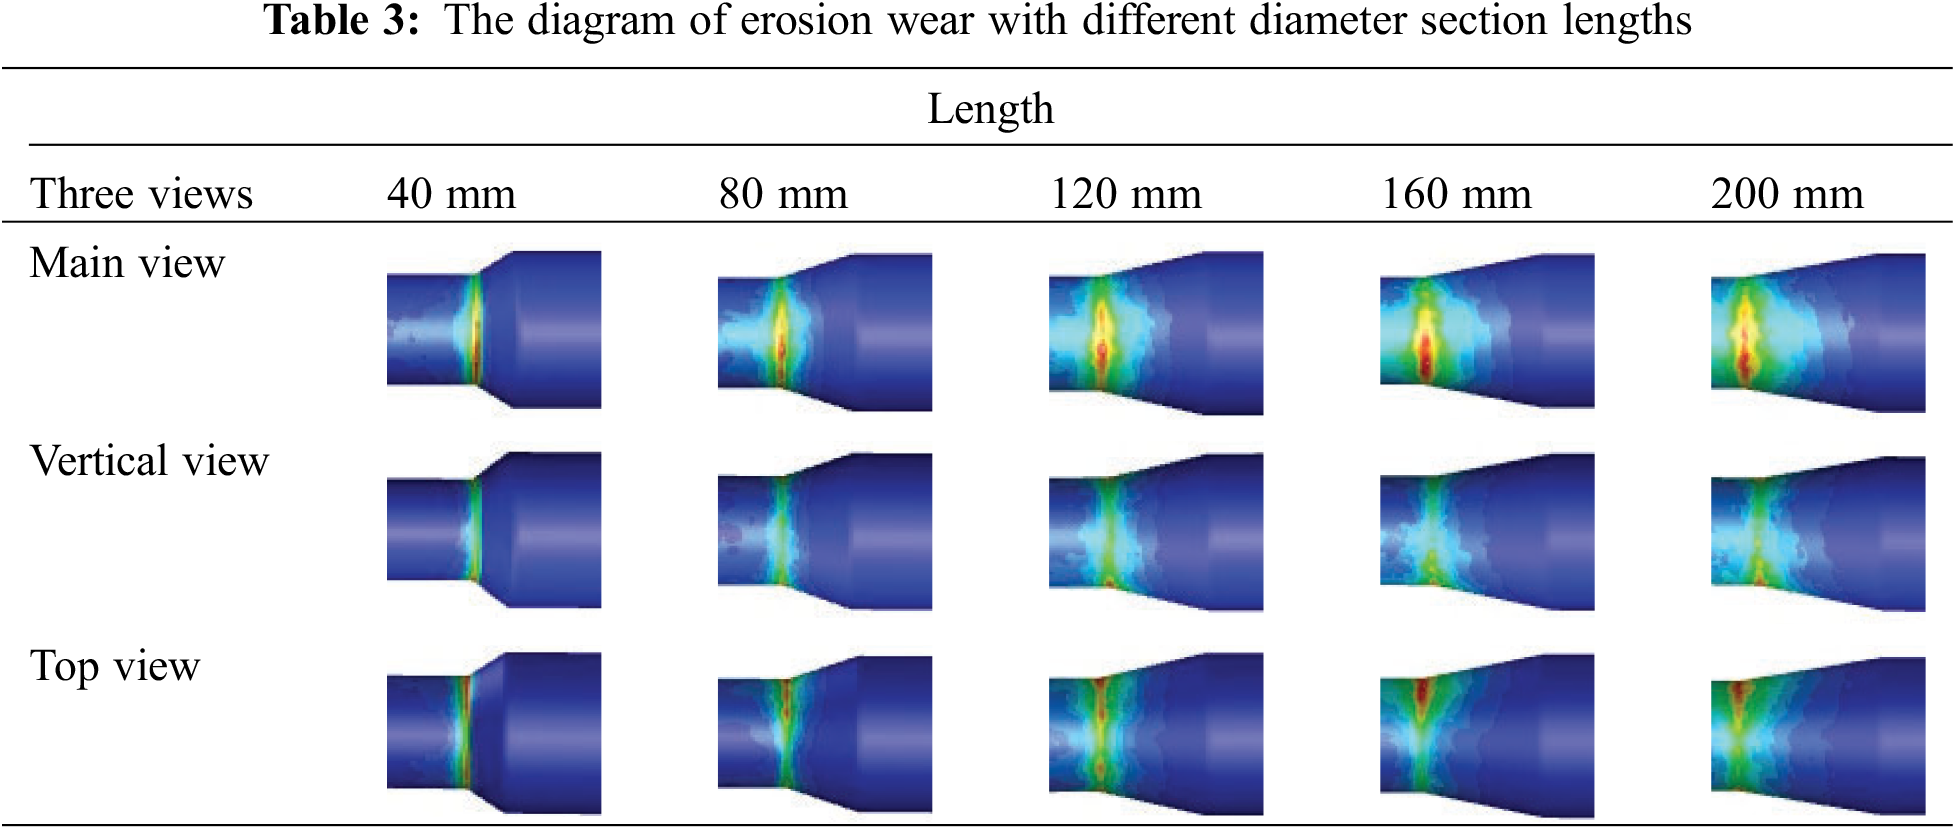
The erosion wear of the variable diameter section presents a regular layered distribution, and the degree of erosion wear gradually strengthened along the downstream direction. The most severe wear occurred at the junction of the variable diameter section and the outlet section. The pipe with a length of 40 mm in the variable diameter section had a relatively small wear range on the pipe body. After exceeding 40 mm, the wear range expanded and gradually covered the entire pipe section. The reason for this pattern was that when the slurry flowed through the variable diameter section, the pipe diameter suddenly shrank, and the fluid state could not be changed in time, forming temporary blockage. Under the push of pressure, the slurry continued to flow along the contracted pipeline, and the slurry around the reduced diameter section was almost in a stagnant state, so it would not cause severe wear on the pipe wall. When the length of the reduced diameter pipe section increased, the slurry on the periphery of the reduced diameter pipe section flowed back and the flow rate changed higher than the center position, causing wear to occur throughout the entire pipe section.
The variation curve of maximum erosion rate with different lengths of variable diameter sections was shown in Fig. 10 when the pipe diameter ratios were 0.65, 0.7, and 0.75. It was shown that:
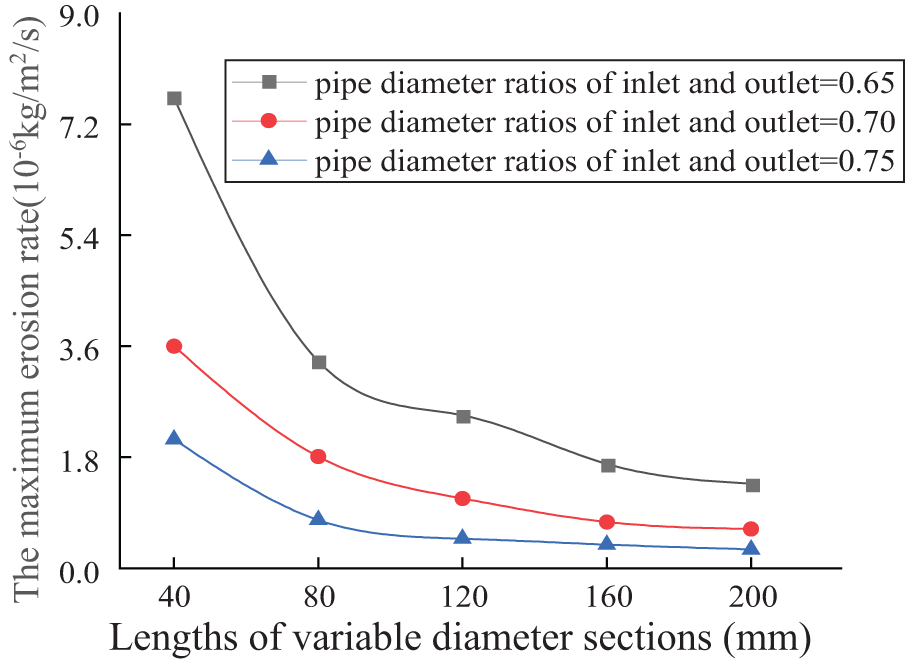
Figure 10: The variation curve of maximum erosion rate with different lengths of variable diameter sections
(1) The length of the variable diameter section had a significant impact on the maximum erosion rate of the pipeline, with pipelines below 80 mm being the most severely affected. The erosion rate showed an exponential downward trend. Firstly, after the slurry entered the variable diameter section from the advection section, the pressure rapidly decreased along the pipeline direction, causing a rapid change in the slurry’s movement state. Secondly, the shorter the length of the variable diameter section was, the smaller the cross-sectional area of the pipeline was, and the higher the concentration of gangue particles in this area was. The angle and frequency of contact with the pipeline were relatively larger, thus enhancing the cutting effect on the pipeline.
(2) When the length of the variable diameter section was between 80–160 mm, the maximum erosion rate steadily decreased with the increase of the variable diameter section length; when the length of the variable diameter section exceeded 160 mm, the erosion rate was basically not affected by the change in length of the variable diameter section. The main reason was that as the length of the variable diameter section increased, the particles were less constrained by the pipeline structure when moving in the watershed, which could provide a longer buffer and make the flow of the slurry in this section smoother, thereby slowing down the erosion and wear of the pipeline.
4.3 The Influence of Wall Roughness on Erosion Wear
The increase of pipe wall roughness will increase the friction resistance of fluid in the pipe. This increased resistance not only affects the flow speed of the fluid, but also may lead to increased pressure loss in the pipeline. The larger roughness makes it easier for the particles in the fluid to collide with the pipe wall during the flow process, and the increase of the collision frequency will aggravate the erosion wear. The increase of roughness will also change the impact angle of fluid particles on the pipe wall, resulting in increased erosion wear. Pipe wall roughness is chosen as an important factor in the study of the effect of corrosion wear on pipe characteristics, because it is directly related to the flow state, friction resistance, pressure drop, erosion wear and other aspects. Through in-depth study of the mechanism of pipe wall roughness against erosion and wear, it can provide powerful theoretical support and technical guidance for the design, construction and maintenance of pipeline engineering.
Roughness (Kc) was one of the important parameters of materials. The surface roughness not only affected the wear mechanism of materials, but also caused changes in the fluid flow state in pipeline systems [28–30]. Keeping other conditions constant, the pipelines with different operating times and corrosion conditions corresponding to different wall roughness conditions was studied.
The schematic diagram of erosion wear at different roughness was shown in Fig. 11. It was shown that when the roughness gradually increased, the wear condition of the pipeline underwent significant changes. The wear area on both cheeks of the bent pipe section rapidly expanded and showed a trend of further deepening. When the roughness increased to 4 mm, the degree of pipeline wear underwent a leapfrog change. Large areas of “spot like” wear appeared at the bottom and both sides of the horizontal flow section, which originally did not produce wear. The wear area of the outlet section covered the entire section, and the local erosion rate exceeded 3.0 × 10⁻⁷ kg/m2/s.
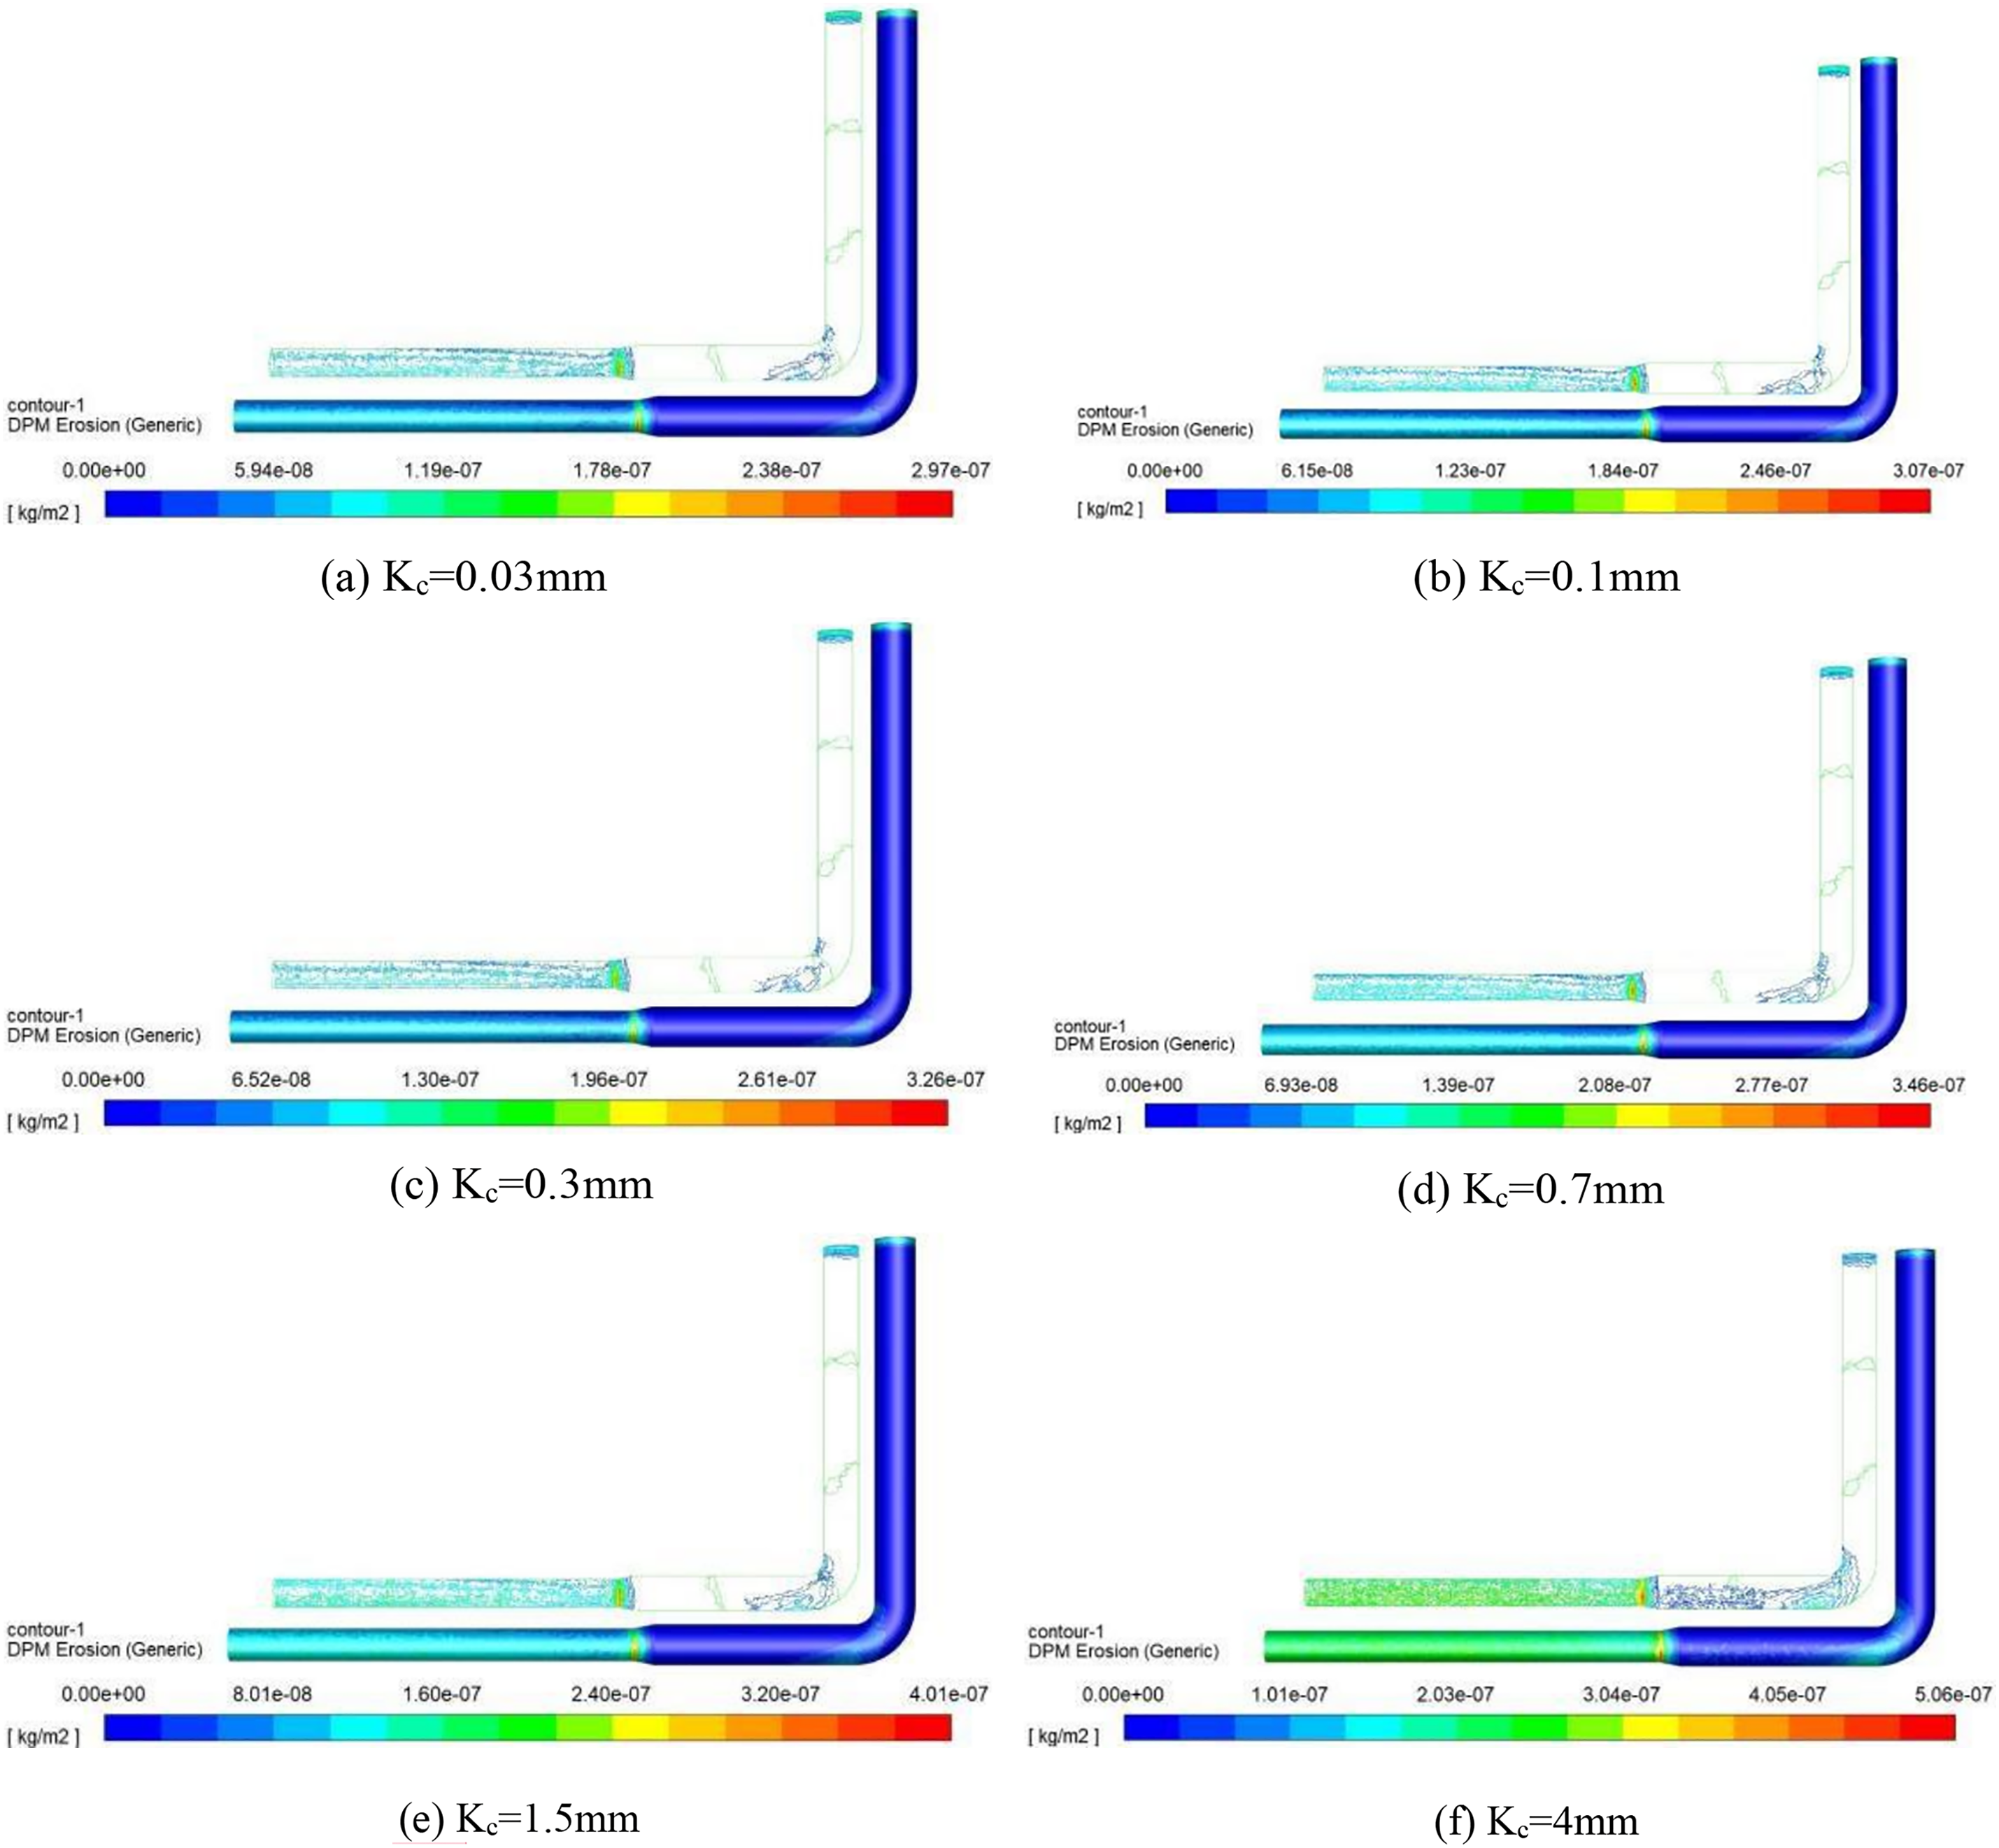
Figure 11: The schematic diagram of erosion wear at different roughness
The schematic diagram of erosion wear at different time steps when the roughness is 4 mm is shown in Fig. 12. As can be seen from the figure, with the gradual advancement of the calculation time step, the wear condition of the pipeline system has undergone a dynamic process from slight accumulation to significant change. At first, in the early stages of the simulation, the wear on the inner wall of the pipe was almost imperceptible, showing only a slight increase in surface roughness and very subtle material loss. However, as the calculated time step increases, the continuous flow of fluid in the pipe begins to show its corrosive effect on the pipe material. As time goes on, the wear process gradually accelerates, the wear area expands from a local area to a wider area, and the wear depth also increases significantly. At the later stage of the simulation, the wear conditions of the pipeline have changed significantly, not only the wear depth has increased significantly, but also the wear patterns have become complex and diverse. This not only affects the service life of the pipeline, but also may lead to a series of safety problems. Therefore, in the design and maintenance process of the pipeline system, the impact of time factors on pipeline wear must be fully considered, and effective measures must be taken to slow down the wear process to ensure the safe and stable operation of the pipeline system.
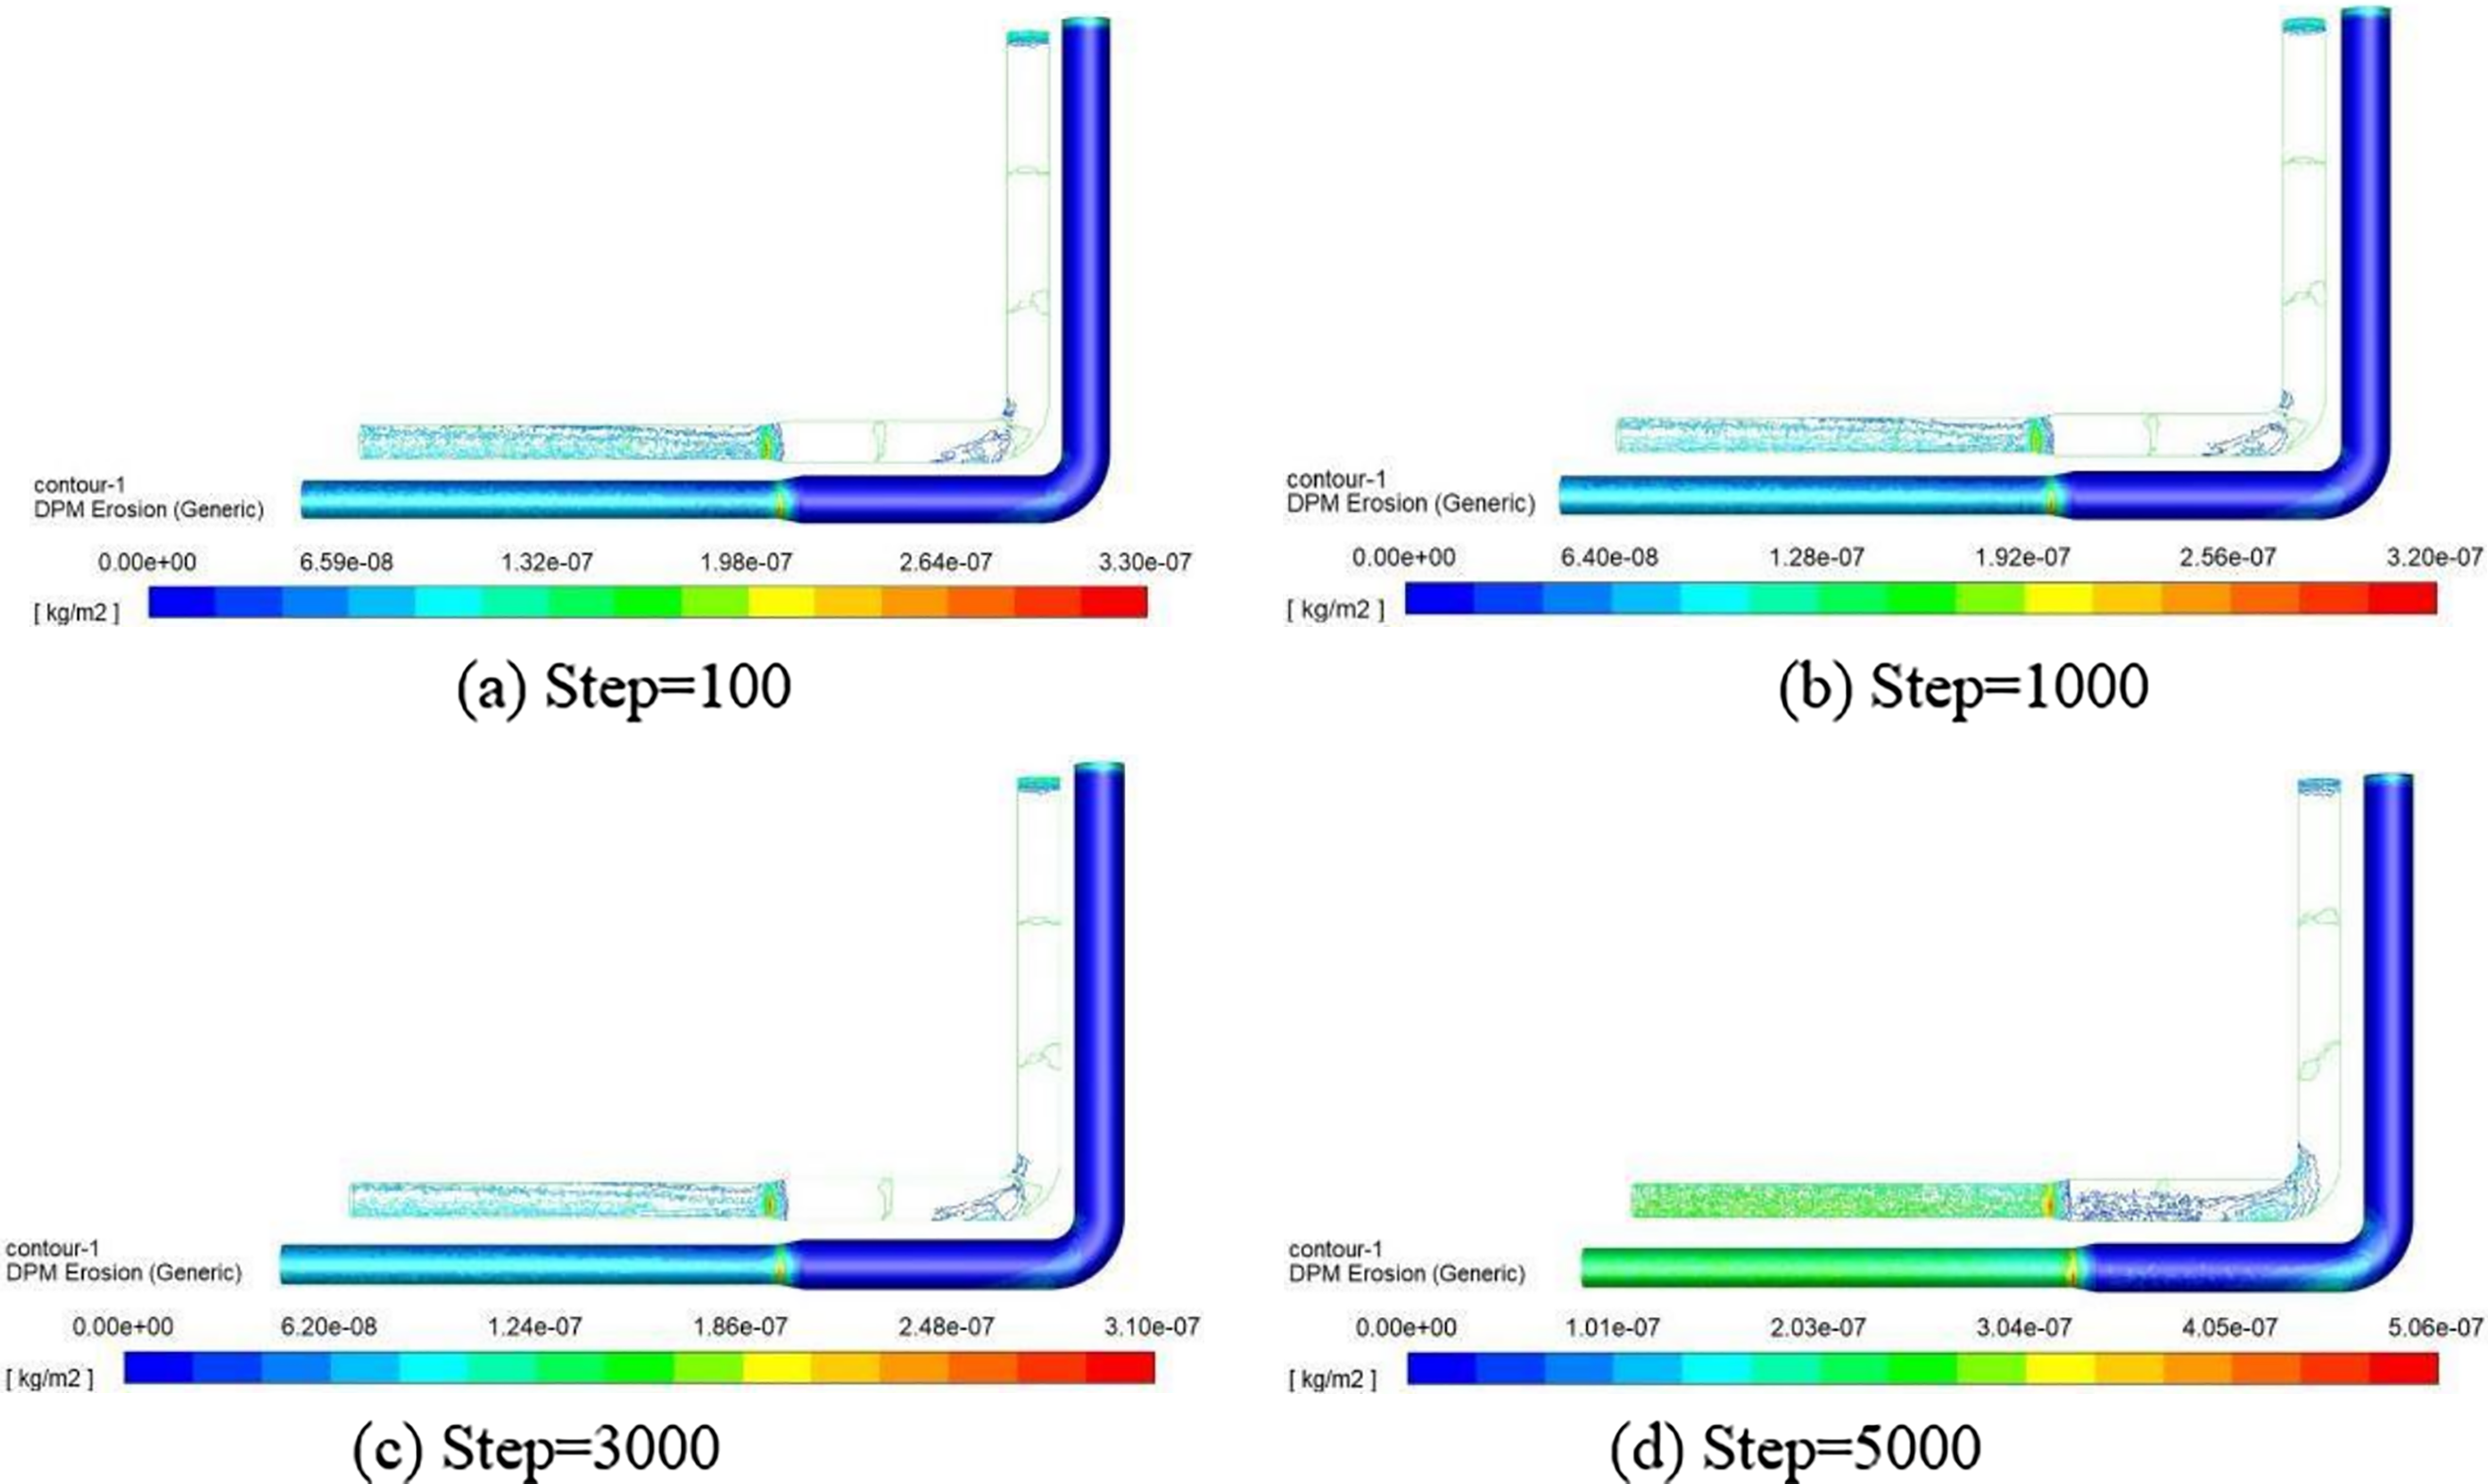
Figure 12: The schematic diagram of erosion wear at different time steps (Kc = 4 mm)
The fluid was subjected to strong interference in pipelines with high roughness, and the frictional resistance when particles came into contact with the wall increases. From the change in pressure drop, it could be seen that the potential energy loss of the fluid during movement in the pipeline was severe, which leaded to differences in the fluid flow state in pipelines with different roughness, causing changes in the wear condition of the pipeline. On the other hand, pipelines with higher roughness had a more uneven wall surface and higher protrusion height, which increased the probability of particles coming into contact with the pipeline. Therefore, there were wear areas in the horizontal flow section, while pipelines with smooth walls would not experience this situation. Frequent collisions between particles and pipelines with high roughness could lead to the detachment of protruding parts on the surface of the pipeline, expanding the contact area between subsequent particles and the wall, and accelerating the loss rate of the pipeline.
(1) The wear at the inlet and the outer wall of the elbow became more obvious with the increase of the ratio of inlet to outlet and the wear at the inlet was distributed along the pipe wall in a circular pattern. The wear on the outer wall of the elbow was concentrated in a certain area and diffused from the center to the outside. The erosion area of the variable diameter section was layered along the flow direction, and the wear degree was the most serious at the end. When the ratio of pipe diameter exceeded 0.8, the wear of inner and outer wall of elbow increased obviously.
(2) When the diameter ratio of the inlet and outlet pipes increased from 0.6 to 0.85, the erosion range continued to expand. When the diameter ratio exceeded 0.85, the erosion area decreased sharply. The pipeline with a length of 40 mm in the variable diameter section showed little wear on the pipe body. After exceeding 40 mm, wear began to occur and the wear range gradually covered the entire pipeline section.
(3) The length of the variable diameter section had a significant impact on the maximum erosion rate of the pipeline, with pipelines below 80 mm being the most severely affected. At this time, the erosion rate showed an exponential downward trend. When the length of the variable diameter section was between 80–160 mm, the maximum erosion rate steadily decreased with the increase of the variable diameter section length; when the length of the variable diameter section exceeded 160 mm, the erosion rate was basically not affected by the change in length of the variable diameter section.
(4) Frequent collisions between particles and pipelines with high roughness could lead to the detachment of protruding parts on the surface of the pipeline, expanding the contact area between subsequent particles and the wall, and accelerating the loss rate of the pipeline. After the roughness of the pipe wall increased from 0.01 to 4 mm, the maximum erosion rate continued to increase and the increase was more than 1.7 times. The higher the likelihood of pipeline damage with higher roughness, therefore pipelines that have been in operation for more than a certain period of time should be updated and replaced in a timely manner.
(5) The current research is mainly based on the single factor analysis method, and the future research can further explore the coupling effect between multiple factors to understand the mechanism of pipeline erosion wear more comprehensively, and provide more accurate prediction models and optimization strategies for engineering practice.
Acknowledgement: This work was supported by the project of the educational department of Liaoning Province and the National Natural Science Foundation of China.
Funding Statement: This work was supported by the project of the Educational Department of Liaoning Province (No. LJKMZ20220825) and the National Natural Science Foundation of China (51774199).
Author Contributions: The authors confirm contribution to the paper as follows: study conception and design: Li Wang, Haipeng Mu; data collection: Jiming Zhu; analysis and interpretation of results: Jiming Zhu, Zhongchang Wang; draft manuscript preparation: Li Wang, Haipeng Mu. All authors reviewed the results and approved the final version of the manuscript.
Availability of Data and Materials: All data for this article can be obtained by contacting the corresponding author.
Ethics Approval: Not applicable.
Conflicts of Interest: The authors declare no conflicts of interest to report regarding the present study.
References
1. Duarte CAR, de Souza FJ, dos Santos VF. Numerical investigation of mass loading effects on elbow erosion. Powder Technol. 2015;283(2):593–606. doi:10.1016/j.powtec.2015.06.021. [Google Scholar] [CrossRef]
2. Cao X, Xiong N, Li J, Xie ZQ, Zang XR, Bian J. Experimental study on the erosion of pipelines under different load conditions. Fluid Dyn Mater Proc. 2022;18(2):233e241. doi:10.32604/fdmp.2022.018505. [Google Scholar] [CrossRef]
3. Khan R, Mourad AHI, Wieczorowski M, Damjanović D, Pao W, Elsheikh A, et al. Erosion-corrosion failure analysis of the elbow pipe of steam distribution manifold. Eng Fail Anal. 2024;160(22):108177. doi:10.1016/j.engfailanal.2024.108177. [Google Scholar] [CrossRef]
4. Khan R, Ullah S, Qahtani F, Pao W, Talha T. Experimental and numerical investigation of hydro-abrasive erosion in the pelton turbine buckets for multiphase flow. Renew Energy. 2022;222(4):119829. doi:10.1016/j.renene.2023.119829. [Google Scholar] [CrossRef]
5. Perera P, Hayward K, Guzzomi F, Vafadar A. Erosion wear characterisation of an open ductile iron butterfly valve subjected to aluminium oxide particle slurry flow. Tribol Int. 2024;191:109199. doi:10.1016/j.triboint.2023.109199. [Google Scholar] [CrossRef]
6. Ejaz F, Pao W, Shakir Nasif MS, Saieed A, Memon ZQ, Nuruzzaman M. A review: evolution of branching T-junction geometry in terms of diameter ratio, to improve phase separation. Eng Sci Technol, Int J. 2021;24(5):1211–23. doi:10.1016/j.jestch.2021.02.003. [Google Scholar] [CrossRef]
7. Yao LM, Liu YV, Xiao ZM, Feng ZM. Investigation on tee junction erosion caused by sand-carrying fracturing fluid. Tribol Int. 2023;179:108157. doi:10.1016/j.triboint.2022.108157. [Google Scholar] [CrossRef]
8. Zhao XY, Cao XW, Zhang JN, Cao H, Zhang J, Peng W, et al. Experimental and numerical investigation of erosion in plugged tees for liquid-solid flow. Int J Multiph Flow. 2022;160:104348. doi:10.1016/j.ijmultiphaseflow.2022.104348. [Google Scholar] [CrossRef]
9. Noorbakhsh Nezhad AH, Mohammadi Zahrani E, Alfantazi AM. Erosion-corrosion of electrodeposited superhydrophobic Ni-Al2O3 nanocomposite coatings under jet saline-sand slurry impingement. Corros Sci. 2022;19:1–20. doi:10.1016/j.corsci.2022.110095. [Google Scholar] [CrossRef]
10. Makwana M, Sutaria BM. Slurry erosion behaviour of Ni-Hard under various impact angle and speed. IOP Conf Ser: Mater Sci Eng. 2020;1004(1):012023. doi:10.1088/1757-899X/1004/1/012023. [Google Scholar] [CrossRef]
11. Abdelrhman Y, Abouel-Kasem A, Emara K, Ahmed S. The effect of boronizing heat treatment on the slurry erosion of AISI 5117. Ind Lubr and Tribol. 2018;70(7):1176–86. doi:10.1108/ILT-01-2017-0009. [Google Scholar] [CrossRef]
12. Liu ZS. Study on rheological properties of filling slurry and wear of conveying pipeline. Beijing, China: China University of Mining and Technology; 2019. [Google Scholar]
13. Xie CJ. Analysis of the influence of wall shape on wear in bend flow channels. China: Zhejiang University of Technology; 2021 (In Chinese). doi: 10.27786/d.cnki.gzjlg.2020.000022. [Google Scholar] [CrossRef]
14. Fu L, Gao BJ. Numerical simulation of the flow field and wear prediction of the elbows of coal oil slurry transporting pipelines. Chem Eng Mach. 2009;36(5):463−466+482. [Google Scholar]
15. Xu AR, Feng CX. Numerical simulation of erosion and wear of sewage pipe based on liquid-solid two-phase flow. Yunnan Chem Tech. 2020;47(1):132–133+136. [Google Scholar]
16. Liu YY, Chen YH, Zhu CW. Analysis of erosive wear of backfilling transportation pipeline. Lubr Eng. 2015;40(7):106–9. doi:10.3969/j.issn.0254-0150.2015.07.022. [Google Scholar] [CrossRef]
17. Zhang HJ, Dong JH, Gao BJ. A type of ballooned bending for coal-oil slurry transporting pipeline and its wear prediction. J Hebei Univ Tech. 2011;40(6):54–8. doi:10.14081/j.cnki.hgdxb.2011.06.008. [Google Scholar] [CrossRef]
18. Guo J, Zhang BX. Numerical investigation of impact erosion in liquid-solid two-phase flow of the backfilling pipe. Sci Tech Rev. 2015;33(11):49–53. [Google Scholar]
19. Wang QC, Huang QY, Wang NR, Wen Y, Ba X, Sun X, et al. An experimental and numerical study of slurry erosion behavior in a horizontal elbow and elbows in series. Eng Fail Anal. 2021;130:105779. doi:10.1016/j.engfailanal.2021.105779. [Google Scholar] [CrossRef]
20. Mao MF, Wang BW, Zhu JR, Chang WH. Study on wear mechanism of gravity transportation pipeline for backfilling slurry. Metal Mine. 2018;4:178–84. doi:10.19614/j.cnki.jsks.201804032. [Google Scholar] [CrossRef]
21. Duarte CAR, de Souza FJ. Innovative pipe wall design to mitigate elbow erosion: a CFD analysis. Wear. 2017;380–381:176–90. doi:10.1016/j.wear.2017.03.01.5. [Google Scholar] [CrossRef]
22. Huang Y, Jiang XD, Shi ZX. Foerecast and prevention of erosion in elbow. Petro Refinery Eng. 2005;2:33–6. [Google Scholar]
23. Qiao XX, Shan B, Chen P. Numerical simulation study on erosion and wear of black water pipeline in solid-liquid two-phase flow. Tribology. 2020;40(6):726–34. doi:10.16078/j.tribology.2020061. [Google Scholar] [CrossRef]
24. Chen Y, Ma GY. Numerical simulation on influence of connection structure and size on erosive wear of tee pipe. J Safety Scie Tech. 2017;13(12):91–7. doi:10.11731/j.issn.1673-193x.2017.12.014. [Google Scholar] [CrossRef]
25. Forder A, Thew M, Harrison D. A numerical investigation of solid particle erosion experienced within oilfield control valves. Wear. 1998;216(2):184–93. doi:10.1016/S0043-1648(97)00217-2. [Google Scholar] [CrossRef]
26. Wang JR, Shirazi SA. A CFD based correlation for erosion factor for long-radius elbows and bends. J Energ Resour Tech. 2003;125(1):26–34. doi:10.1115/1.1514674. [Google Scholar] [CrossRef]
27. GB/50215-2015. Code for Design of Coal Industrial Mines. China, Beijing: China Planning Press; 2015 (In Chinese) [Google Scholar]
28. Gu SC, Zhu LH, Duan YM, Wu XC, Gu BF. Effect of surface roughness on high temperature friction and wear properties of large-diameter M2 high speed steel. Trans Mater Heat Treat. 2020;41(2):127–32. doi:10.13289/j.issn.1009-6264.2019-0344. [Google Scholar] [CrossRef]
29. Menezes PL, Kishore, Kailas SV. Influence of surface texture and roughness parameters on friction and transfer layer formation during sliding of aluminum pin on steel plate. Wear. 2009;267(9):1534–49. doi:10.1016/j.wear.2009.06.003. [Google Scholar] [CrossRef]
30. Rahaman ML, Zhang L, Liu M, Liu W. Surface roughness effect on the friction and wear-of bulk metallic glasses. Wear. 2015;332–333(11):1231–7. doi:10.1016/j.wear.2014.11.030. [Google Scholar] [CrossRef]
Cite This Article
 Copyright © 2025 The Author(s). Published by Tech Science Press.
This work is licensed under a Creative Commons Attribution 4.0 International License , which permits unrestricted use, distribution, and reproduction in any medium, provided the original work is properly cited.
 Downloads
 Citation Tools