
 Submit a Paper
 Propose a Special lssue
 Open Access
ARTICLE

Transient Multiphase Study on the Influence of Well Trajectory on Horizontal Shale Gas Production
1 Engineering Technology Research Institute of PetroChina Southwest Oil & Gasfield Company, Chengdu, 610017, China
2 PetroChina Southwest Oil & Gas Field Company, Chengdu, 610051, China
* Corresponding Author: Anqi Du. Email:
(This article belongs to the Special Issue: Fluid and Thermal Dynamics in the Development of Unconventional Resources II)
Fluid Dynamics & Materials Processing 2025, 21(4), 939-957. https://doi.org/10.32604/fdmp.2024.058553
Received 14 September 2024; Accepted 20 November 2024; Issue published 06 May 2025
 View Full Text
 Download PDF
Abstract
Horizontal wells play a crucial role in enhancing shale gas reservoir production. This study employs transient multiphase simulation to investigate the impact of well trajectory on production optimization throughout a well’s life cycle. The research uses OLGATM as a simulator to examine six well trajectories: toe-up, toe-down, smooth horizontal, undulated toe-up, undulated toe-down, and undulated horizontal. Initial findings indicate comparable production rates across different trajectories during the early production phase, with toe-up wells showing slightly better performances due to minimal slugging. However, as the reservoir pressure decreases, the well trajectory significantly influences production. Horizontal wells achieve the highest accumulated gas production rates due to minimal liquid holdup and back pressure. Toe-up wells experience early liquid accumulation and severe slugging, leading to increased back pressure and smaller production. The study highlights the positive effects of lateral undulations on toe-up and toe-down wells in terms of liquid unloading, however some emphasis is also put on their adverse influence on horizontal wells.Keywords
Supplementary Material
Supplementary Material FileDue to the low permeability of shale reservoirs [1−3], commercial exploitation relies on horizontal drilling and multi-stage hydraulic fracturing, making horizontal wells the preferred development method for shale gas [4−7]. The productivity of gas wells in complex deviated drilling is influenced by the trajectory of the lateral section. Reservoir engineers typically design the wellbore trajectory based on gas production and the permeability of the layers [8]. Additionally, the wellbore trajectory is tailored to increase the contact area between the reservoir and the wellbore, taking into account natural fractures and the formation dip angle of the reservoir [9,10]. As a result, gas well trajectories can be complex, including toe-up, toe-down, and undulating types.
The wellbore trajectory significantly impacts the distribution and gas-liquid two-phase flow, affecting the stability of gas well production [11]. Brito et al. [8,12] conducted extensive experimental studies on the effects of different horizontal section wellbore trajectories on gas well production. They found that under high gas production conditions, the impact of well trajectory is minimal due to stable production. However, under low gas production conditions, slug flow can significantly affect production, with the toe-up well being optimal in production states. In contrast, severe slugs can form in the vertical section of the toe-up well and in the lateral section of toe-down well under extremely low production conditions. Severe slugs refer to substantial, intermittent accumulations of liquid in the wellbore, which can lead to significant operational issues, including severe pressure fluctuations and disruptions in production stability. Nonetheless, experimental studies have limitations, as they cannot fully capture the real structure and pressure distribution of horizontal wells.
The understanding of gas-liquid dynamics in horizontal wells is still limited due to the scarcity of comprehensive field-scale studies in the literature, especially considering the influence of different well trajectories on gas-liquid flow behavior. To effectively capture the complex flow behavior in horizontal wells, tools beyond laboratory experiments are required. Bendiksen et al. [13] extended the two-fluid model in their transient multiphase flow simulator, focusing on flow pattern description and key parameters prediction such as pressure drop, flow pattern, and slug frequency. This makes transient multiphase flow simulation a viable option for evaluating oil and gas well productivity, promoting subsequent studies [14−17] that investigate wellbore dynamics and performance using dynamic flow modeling approaches. Jackson et al. [18] were pioneers in this area, comparing simulated production data with video recording data to verify accuracy. Their simulation results indicated that the toe-up well has the best gas production performance, while the undulating horizontal well performs the worst. However, their study mainly focused on periods with favorable formation conditions and did not account for the impact of formation energy depletion. Tran et al. [15] investigated the impact of horizontal well geometries on production performance, focusing on slug flow formation. Using transient multiphase flow simulations, the study examines five well trajectories—multi-undulations, hump, sump, toe-up, and toe-down—under various reservoir conditions and production rates. Results show that well geometry has minimal impact at high rates but significantly affects slugging at low rates. Toe-down configurations perform best with minimal slugging, whereas toe-up configurations exhibit severe slugging and low production under reduced reservoir pressure. However, the study was limited to specific horizontal shale oil wells, and further research is needed to explore other types of wells under more complex production conditions.
Therefore, this paper assesses the impact of lateral trajectory on gas well dynamics throughout the entire lifecycle using transient multiphase flow simulation. The objective is to quantitatively compare and analyze different production stages for six types of horizontal wells, including toe-up, toe-down, horizontal, undulating toe-up, undulating toe-down, and undulating horizontal wells. This analysis aims to optimize wellbore trajectory and provide scientific guidance for subsequent unloading processes.
2 Transient Wellbore Two-Phase Flow Model
2.1 Multiphase Flow Control Equations
The transient flow simulation of multiphase flow in the wellbore is based on the Euler-Euler two-phase flow model, a two-dimensional model is established for the wellbore, and a differential element is selected in the channel, and the multiphase flow control equation is constructed based on the law of mass conservation [19,20].
(1) Mass Conservation Equation
Gas phase mass conservation equation in the wellbore:
Liquid phase mass conservation equation at the wellbore wall:
Mass conservation equation for droplets in the wellbore:
where Vg, VL and VD are the volume fractions of gas, liquid film, and droplets, respectively, ρ is the density, υ is the velocity, p is the pressure, and A represents the cross-sectional area of the pipe. Ψg is the interphase mass transfer rate, ΨL and Ψd are the entrainment and deposition rates, respectively, and Gf represents the mass source of phase f. The subscripts g, L, i, and D represent gas, liquid, interface, and droplets, respectively.
(2) Momentum Conservation Equation
Momentum equation for gas phase and droplets:
Momentum equation for liquid phase at the wall:
(3) Energy Conservation Equation
Energy equation for gas-liquid mixture:
This paper utilizes the commercial transient multiphase flow simulator OLGATM to analyze two-phase fluid flow in wellbores. The simulation process is illustrated in Fig. 1, with input parameters encompassing reservoir fluid properties, horizontal wellbore structures with fixed vertical sections and varying horizontal sections, and time-evolving reservoir parameters. The study simulates six well configurations: toe-up, toe-down, smooth horizontal, undulating toe-up, undulating toe-down, and undulating horizontal. It examines the impact of the lateral section on gas well productivity at different production stages by analyzing key output parameters such as daily gas production, daily liquid production, wellbore pressure, and liquid holdup.
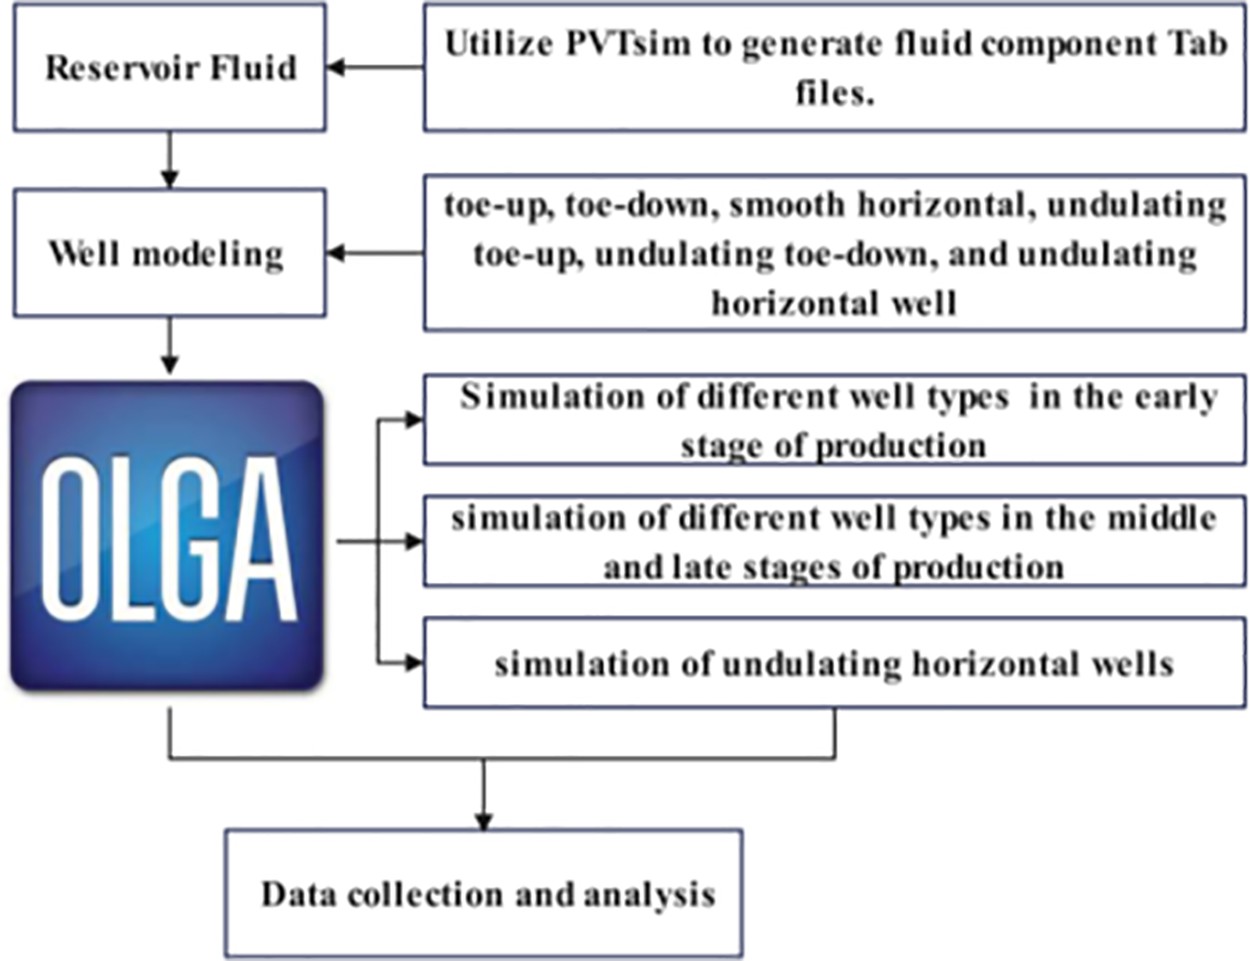
Figure 1: Simulation calculation flowchart
2.3 Reservoir Input Properties
(1) Productivity Equation
This study uses the production data of a typical well in the deep shale gas block in Sichuan as the basis for simulation. The pressure test data of the well is processed and analyzed using the steady-state multiphase flow simulation software PIPESIM, and the dynamic relationship between gas well production and pressure is represented by a backpressure equation, resulting in the productivity equation:
where q is the daily gas production, pR and pwf are the formation pressure and bottomhole flowing pressure, respectively.
(2) Formation Depletion
Since OLGA cannot describe the decrease in production caused by factors such as shale gas reservoir permeability and desorption, it can only reflect the decline in formation pressure, which is difficult to obtain in the field. We used PIPESIM’s Nodal Analysis to estimate pressure over time. By adjusting the formation pressure until the intersection of the IPR (Inflow Performance Relationship) and VLP (Vertical Lift Performance) curves matched the actual production rate, we derived a reasonable estimate of reservoir pressure evolution (Table 1). It should be noted that the reservoir pressure fitting began once the tubing pressure reached stable flow conditions. Therefore, “0” day in Table 1 represents the day when tubing pressure was stabilized, rather than the actual start of production.
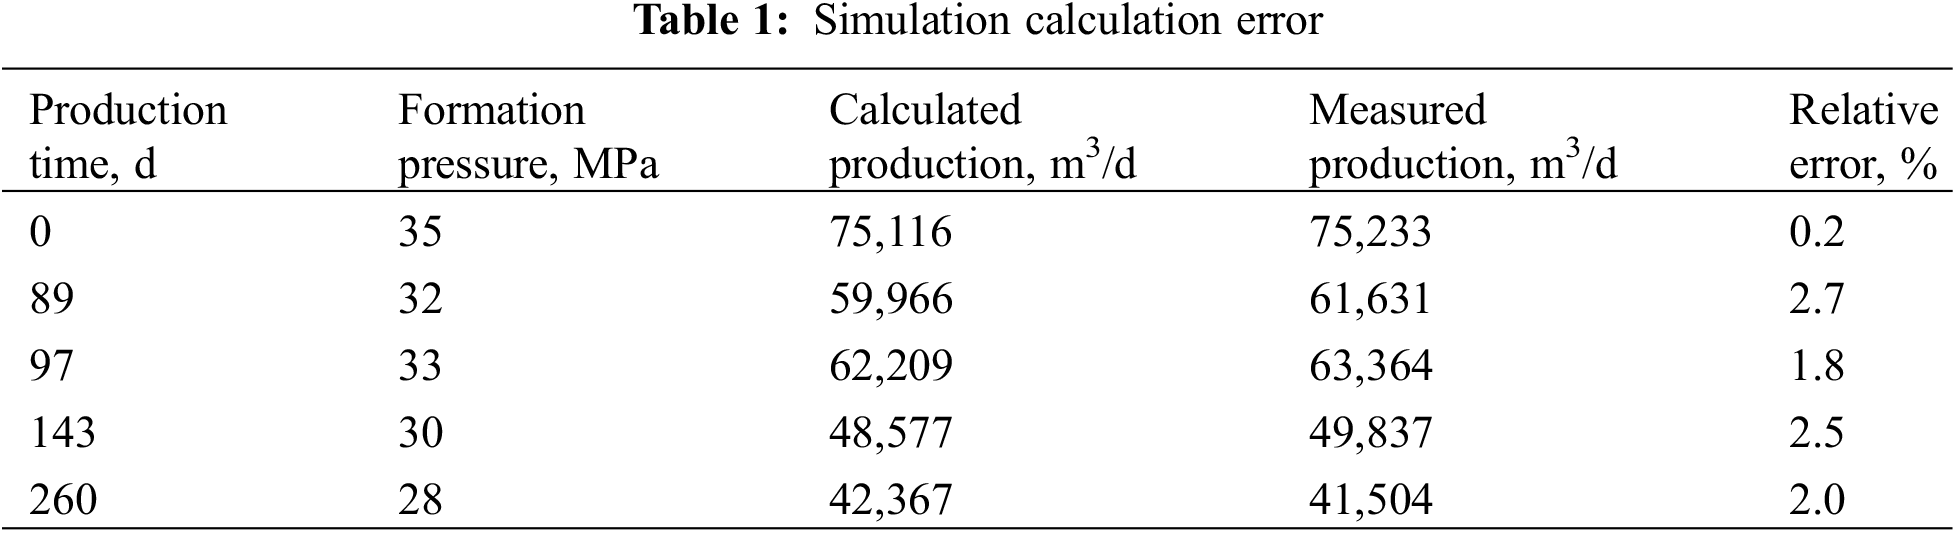
Furthermore, we used the estimated formation pressures at various time intervals, together with the productivity equation, as input parameters for the OLGA model to simulate gas production dynamics over time. The simulated results were compared against actual production data to validate model accuracy. Fig. 2 presents the comparison between simulated and observed production rates, with the red curve representing the simulation and the blue curve representing the observed data. The results demonstrate a good agreement between the simulated and observed data, as shown in Table 1, where the average absolute error between OLGA’s simulation and actual production data is less than 2.7%. This indicates the reliability and accuracy of OLGA in modeling shale gas production from horizontal wells.
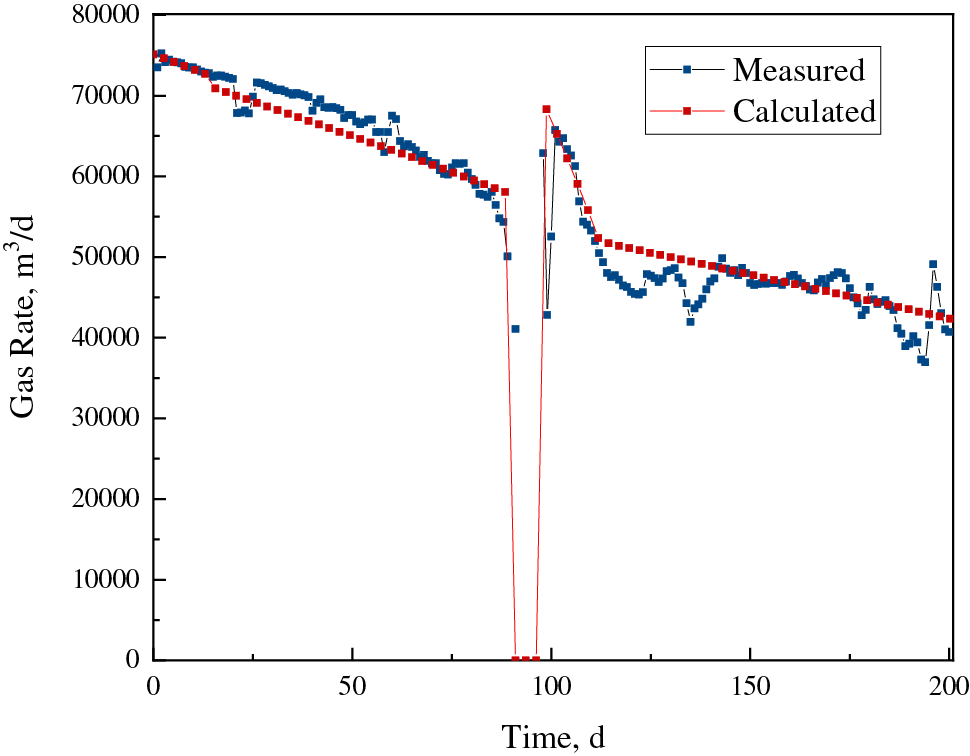
Figure 2: Comparison of simulation calculation results with production data results
In subsequent simulation studies, the formation pressure and productivity equation will be used as input parameters for the multiphase flow model. Due to the high computational demands, the formation pressure decline gradient in Table 1 was adjusted by a factor of 60 to expedite the simulation. As a result of this adjustment, a pressure decline of 7 MPa over 260 days was scaled to a shorter simulation period of 4.5 days in OLGA. In our study, the simulation duration was set to 8 days, but this period effectively represents approximately 480 days of actual production. The first 4 days of the simulation correspond to the early well-life stage, equivalent to the initial 240 days of production after tubing pressure stabilization, during which the formation pressure decreased from 35 to 28 MPa. The following 4 days represent the later well-life stage, corresponding to the 240 to 480 days of production, during which the formation pressure declined from 28 to 21 MPa.
(3) Reservoir Fluid Properties
The main components of the natural gas produced from this gas well are light alkanes, as shown in Table 2. The natural gas phase envelop generated by the PVTsim software is shown in Fig. 3, where the horizontal and vertical coordinates represent temperature (°C) and pressure (Bara), respectively. Since methane accounts for more than 97%, the phase change occurs around −80°C, indicating that the gas phase dominates during the production process of the gas well.
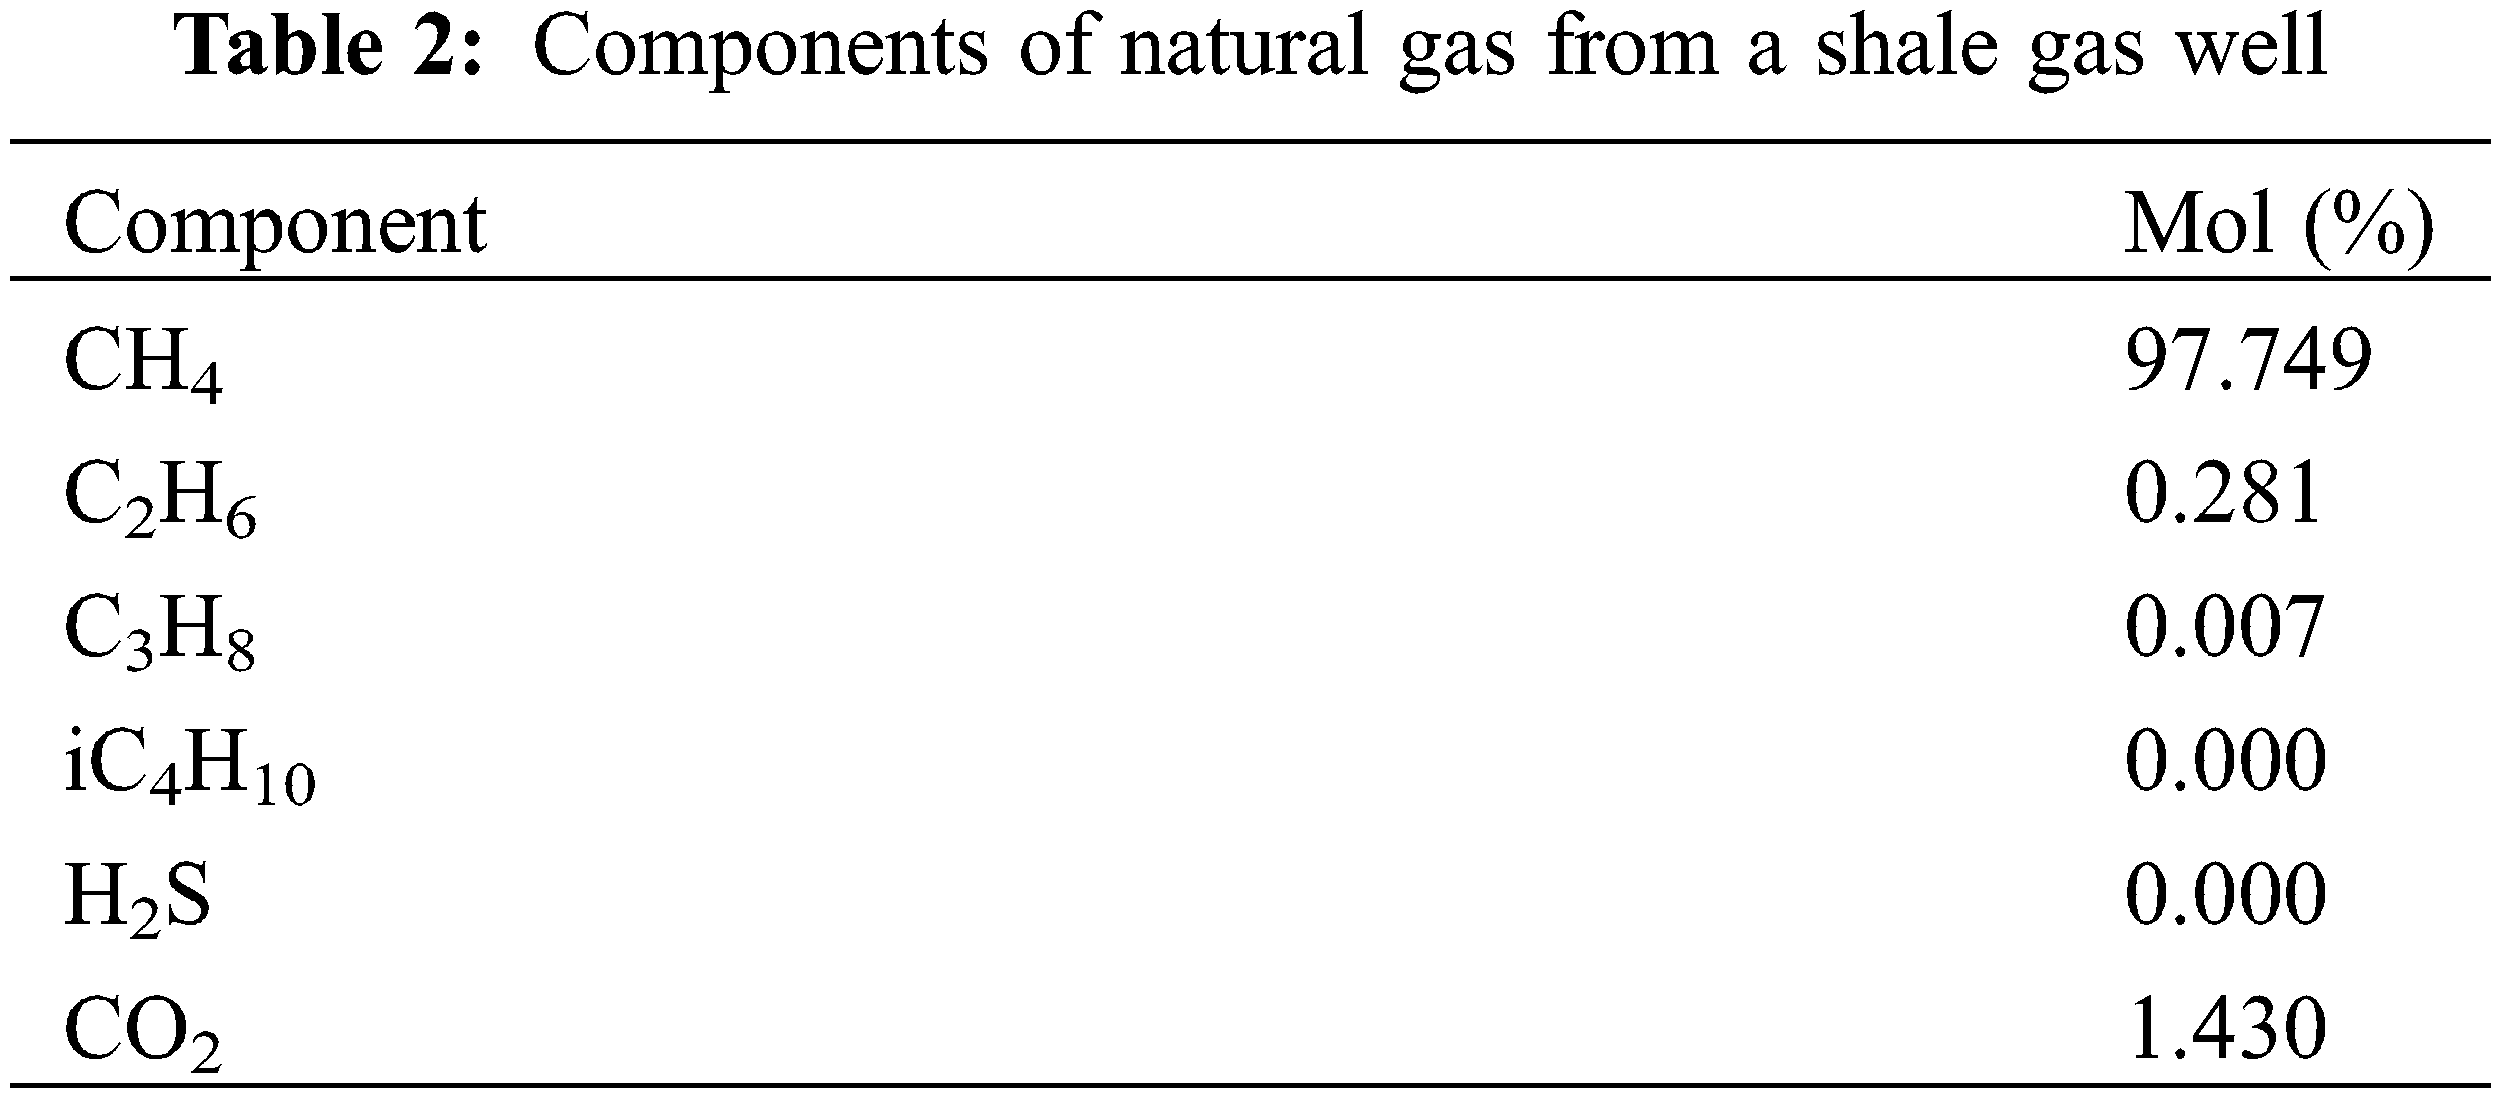
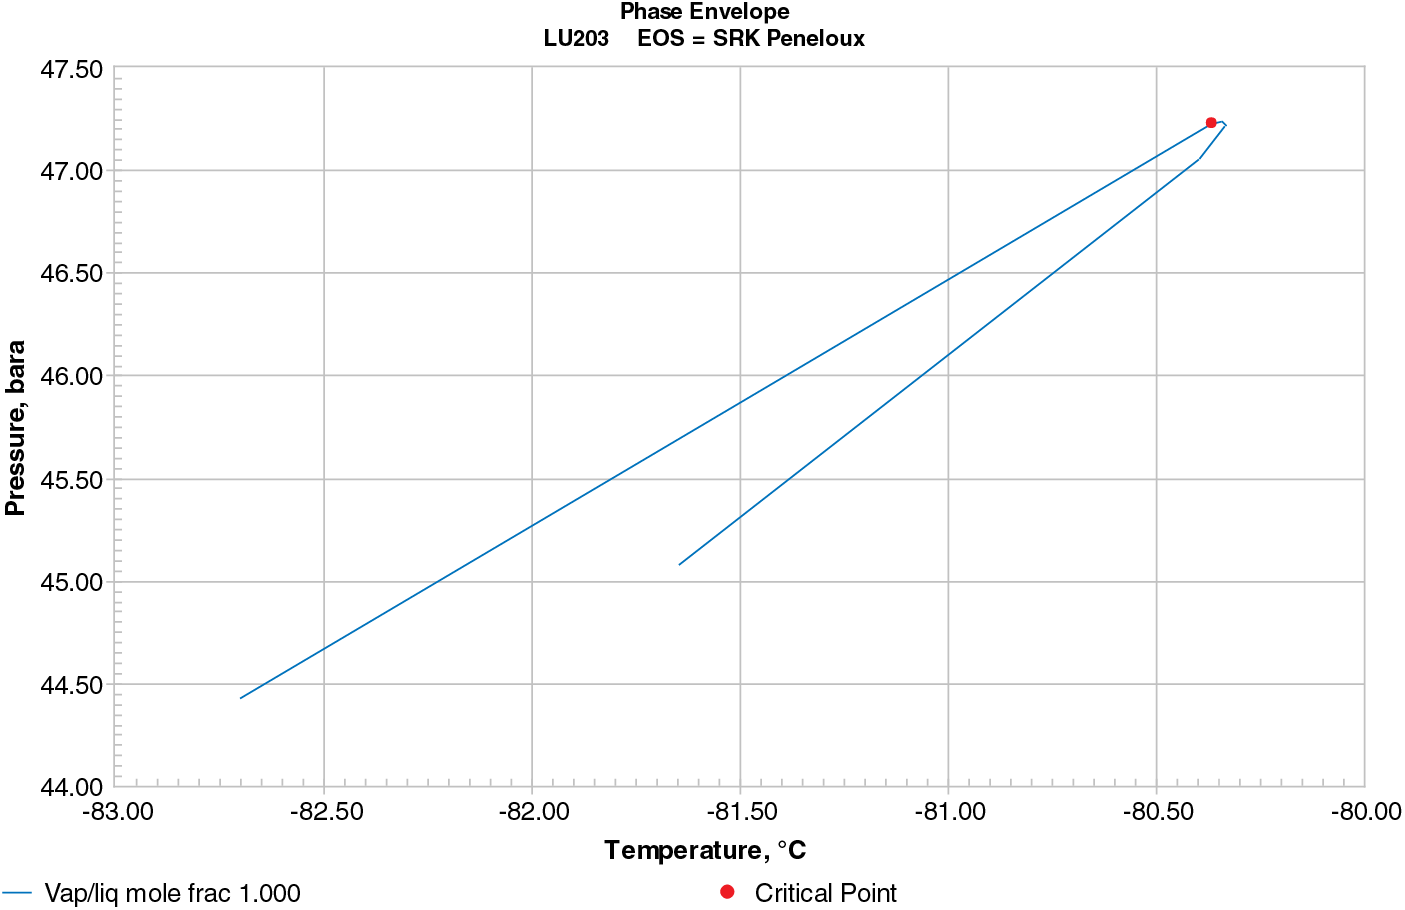
Figure 3: Phase envelop of the reservoir fluid
The paper initially simulates three scenarios: toe-up, toe-down, and smooth horizontal wells (Fig. 4). The total measured depth (MD) of all well types is 6085 m, the true vertical depth (TVD) of the heel of the lateral section is 3800 m, and the length of the lateral section is 2000 m. The actual vertical depths of the toe of the horizontal section for the toe-up, toe-down, and smooth horizontal wells are 3625.68 m (95°), 3974.32 m (85°), and 3800 m (90°), respectively. The production casing size is 5 1/2 in, and the tubing size is 2 3/8 in, with the tubing extending to the heel of the horizontal section (Point A). The wellbore structure and well trajectory are illustrated in Figure S1 in the Supplementary Materials. In all simulation scenarios, the wellhead pressure is fixed at 7 MPa. The lateral section has four evenly spaced perforation stages. The OLGA model used for the simulation is shown in Figure S2 of the Supplementary Materials.
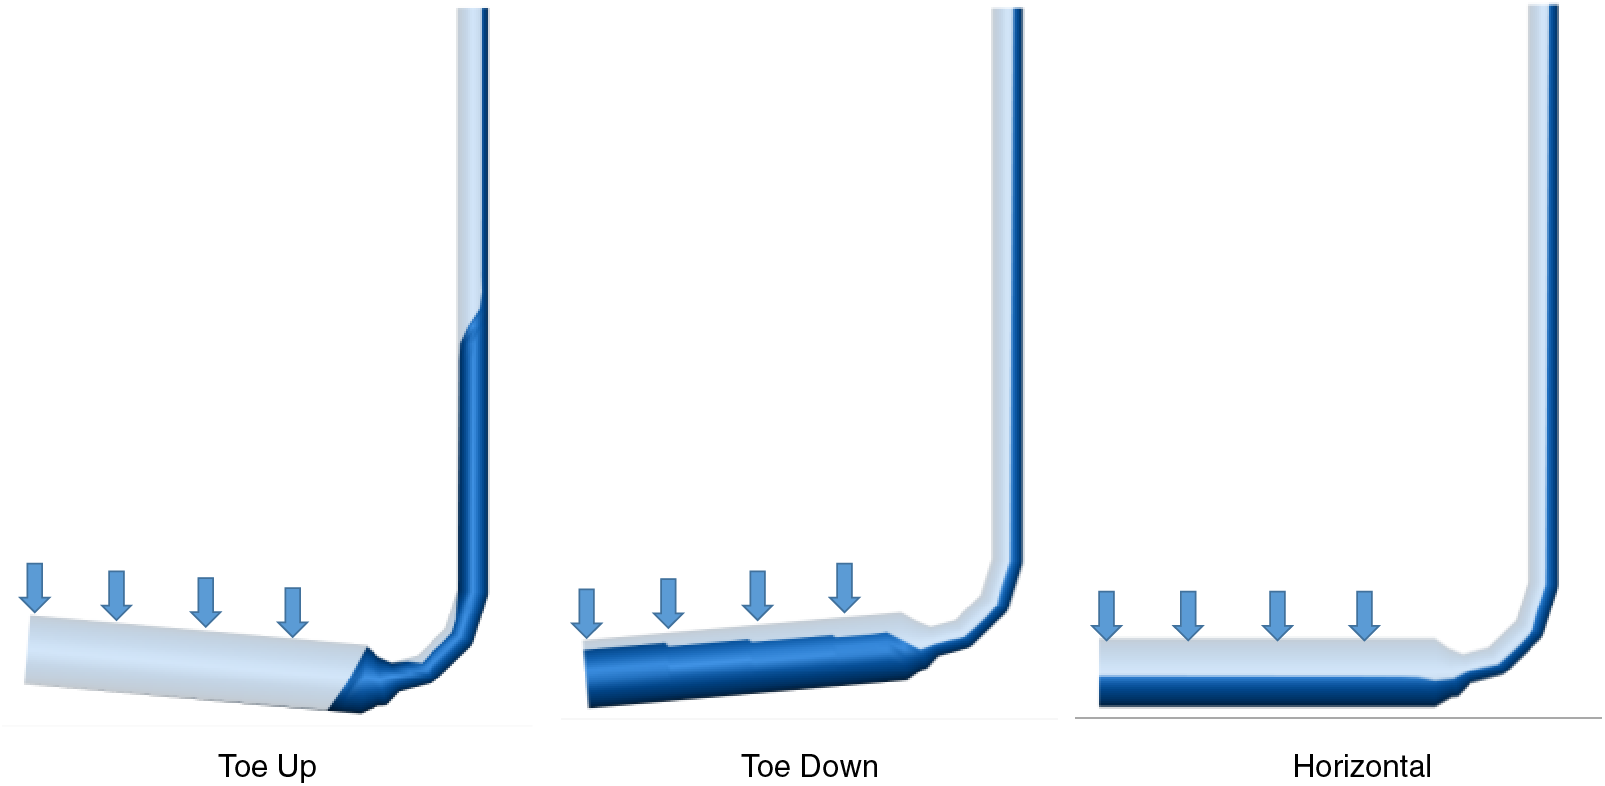
Figure 4: Wellbore geometries simulated (toe-up, toe-down, and smooth horizontal)
However, in field drilling, absolutely smooth horizontal sections are rare. Therefore, considering random fluctuations in the inclination angle, repeated simulations were conducted for the above three well types. This represents the actual production situation in the field, with fluctuations of ±5° around the average angle (Fig. 5). The undulating horizontal well contains three downhill sections, each followed by an uphill section. The undulating toe-up well and undulating toe-down well have five random fluctuations, with average inclination angles of 95° and 85°, respectively. Typically, the flow in the horizontal section is stratified. As the horizontal section undulates, slug flow mainly occurs in the uphill sections, while the downhill sections exhibit stratified flow. The slug flow in the uphill sections may increase back pressure, block some perforation holes, and reduce the gas well’s productivity.
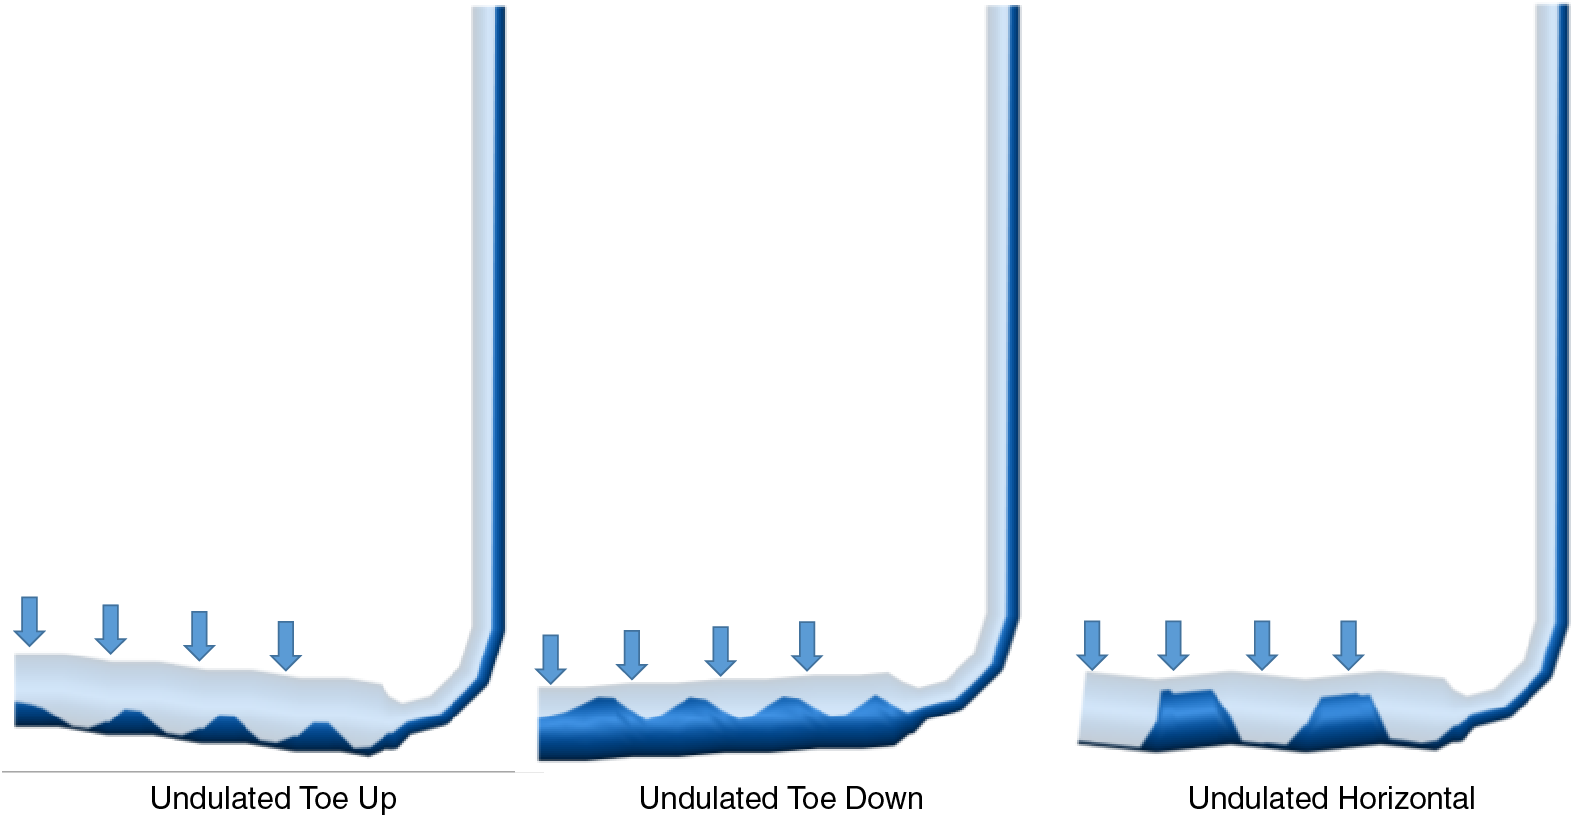
Figure 5: Wellbore geometries simulated (undulated toe-up, undulated toe-down and undulated horizontal)
3.1 Early-Life Well Trajectory Effects
Figs. 6 to 8 illustrate the pressure profiles and liquid holdup distributions of different well types during the early production stage, specifically the initial 240 days after tubing pressure stabilization. For the toe-up well (Fig. 6), gravity aids in the flow, resulting in low liquid holdup in the lateral section and minimal pressure loss. However, severe slippage in the build-up section leads to increased liquid holdup and greater pressure loss. Liquid accumulation mainly occurs at the heel of the lateral section (Point A), causing the highest pressure near Point A. This results in a greater producing pressure differential and gas contribution near the perforated section at the toe of the lateral section. In contrast, horizontal wells exhibit uniform gas-liquid distribution in the horizontal section due to the absence of inclination angle changes, resulting in small pressure loss and higher liquid holdup than in the toe-up well, but overall lower. The gas contribution from the horizontal perforated section is also relatively uniform (Fig. 7). Notably, toe-down wells perform slightly worse compared to toe-up and horizontal wells (Fig. 8). The elevation difference between the toe and heel of the lateral section causes gravity to work against the flow, leading to continuous liquid accumulation from the toe of the lateral section. This results in significantly higher liquid holdup than in toe-up and horizontal wells and a large pressure loss in the lateral section. Consequently, the highest bottomhole pressure in toe-down wells is 24.2 MPa, while the bottomhole pressures in toe-up and horizontal wells are about 23 MPa. This also indicates a greater producing pressure differential and gas contribution near the perforated section at the heel of the toe-down well.
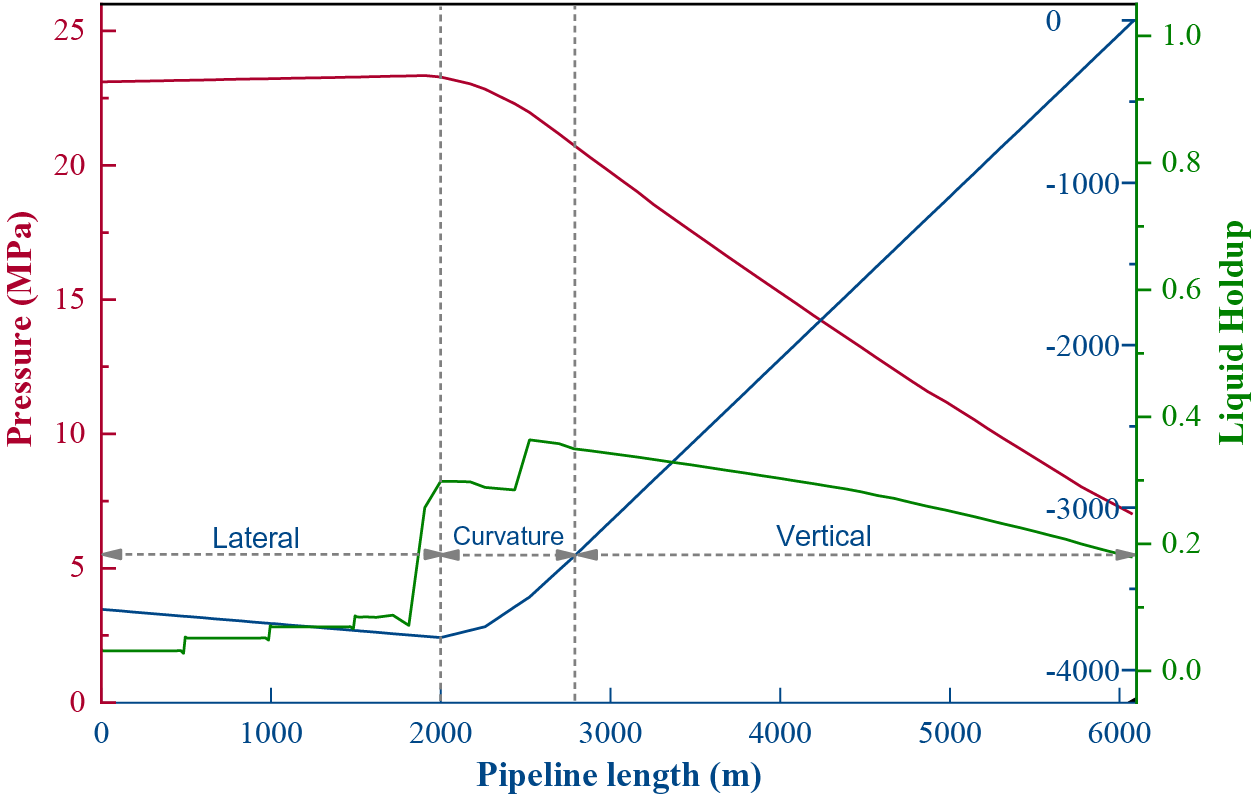
Figure 6: Pressure and liquid holdup distribution along the wellbore (toe-up well)
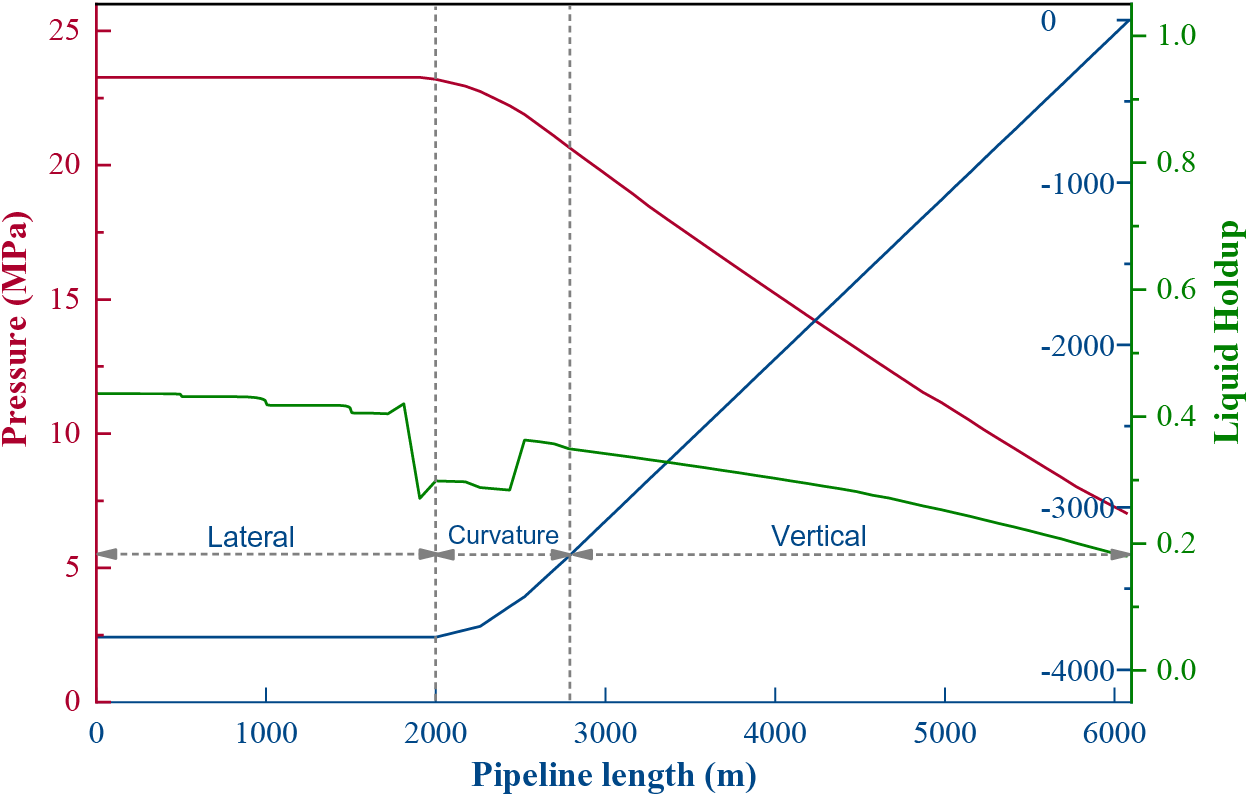
Figure 7: Pressure and liquid holdup distribution along the wellbore (horizontal well)
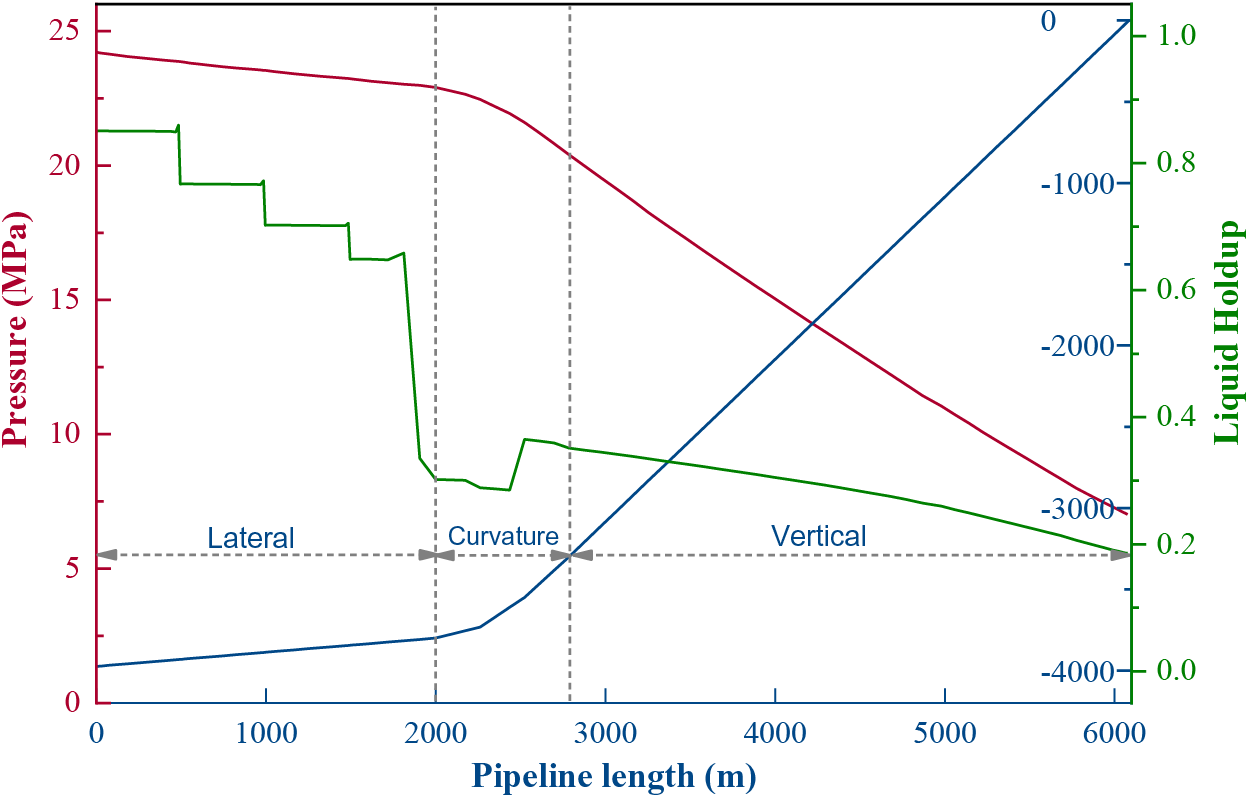
Figure 8: Pressure and liquid holdup distribution along the wellbore (toe-down well)
Figs. 9 and 10 present a comparison of daily gas production and daily liquid production for the three well types mentioned earlier. The production of the three well types is not significantly different. However, due to the optimal liquid unloading effect, the gas contribution from the horizontal section is most effective in toe-up wells, leading to the highest production. In contrast, toe-down wells experience significant hydrodynamic slug flow in the horizontal section, reducing gas production efficiency and resulting in the lowest production. Nonetheless, with sufficient formation energy, the gas can overcome the resistance of liquid slug flow and carry the liquid to the surface, ensuring stable flow.
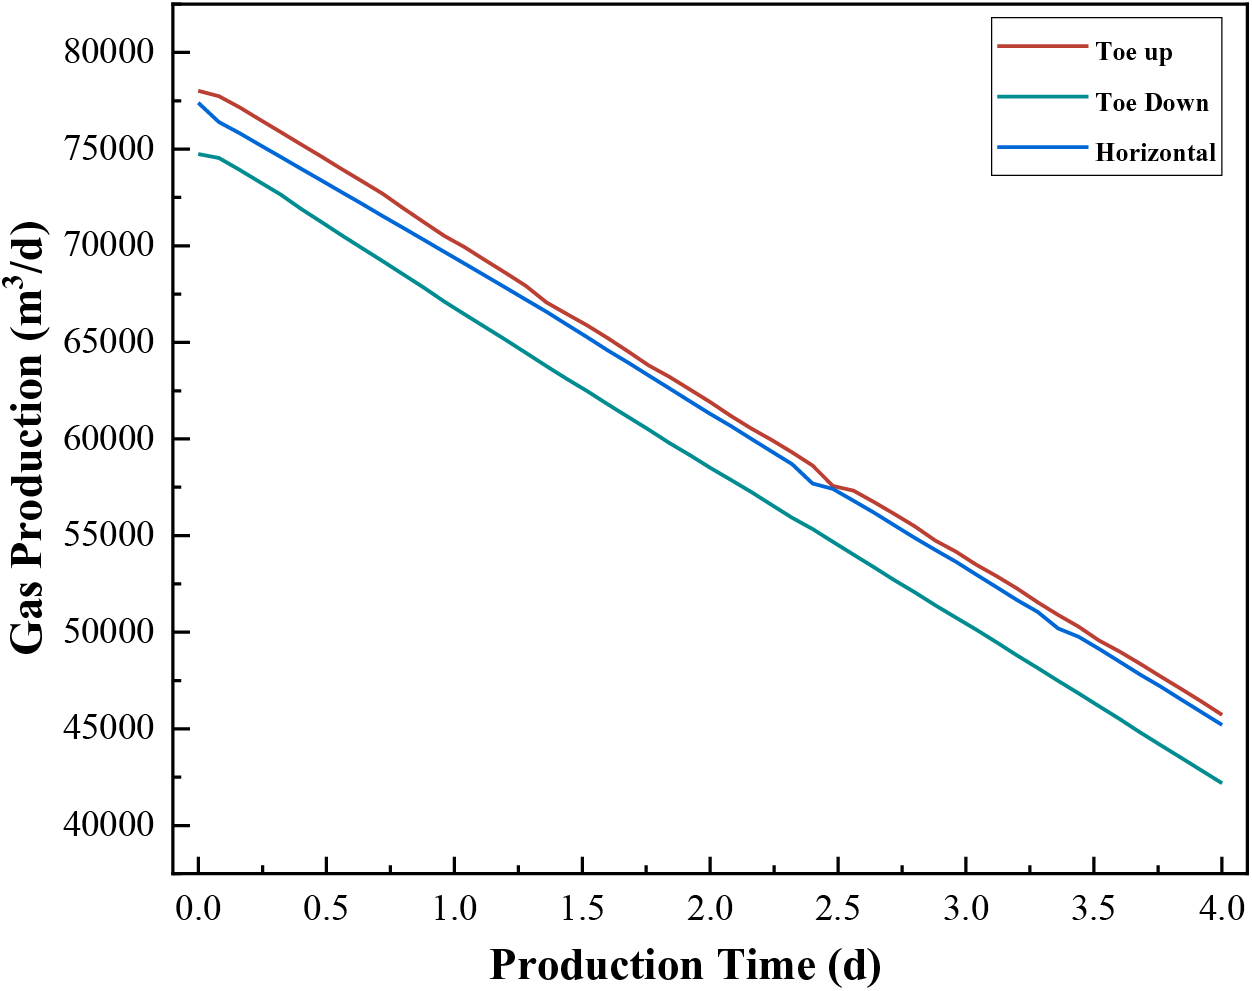
Figure 9: Comparison of daily gas production for three well types in the early production stage
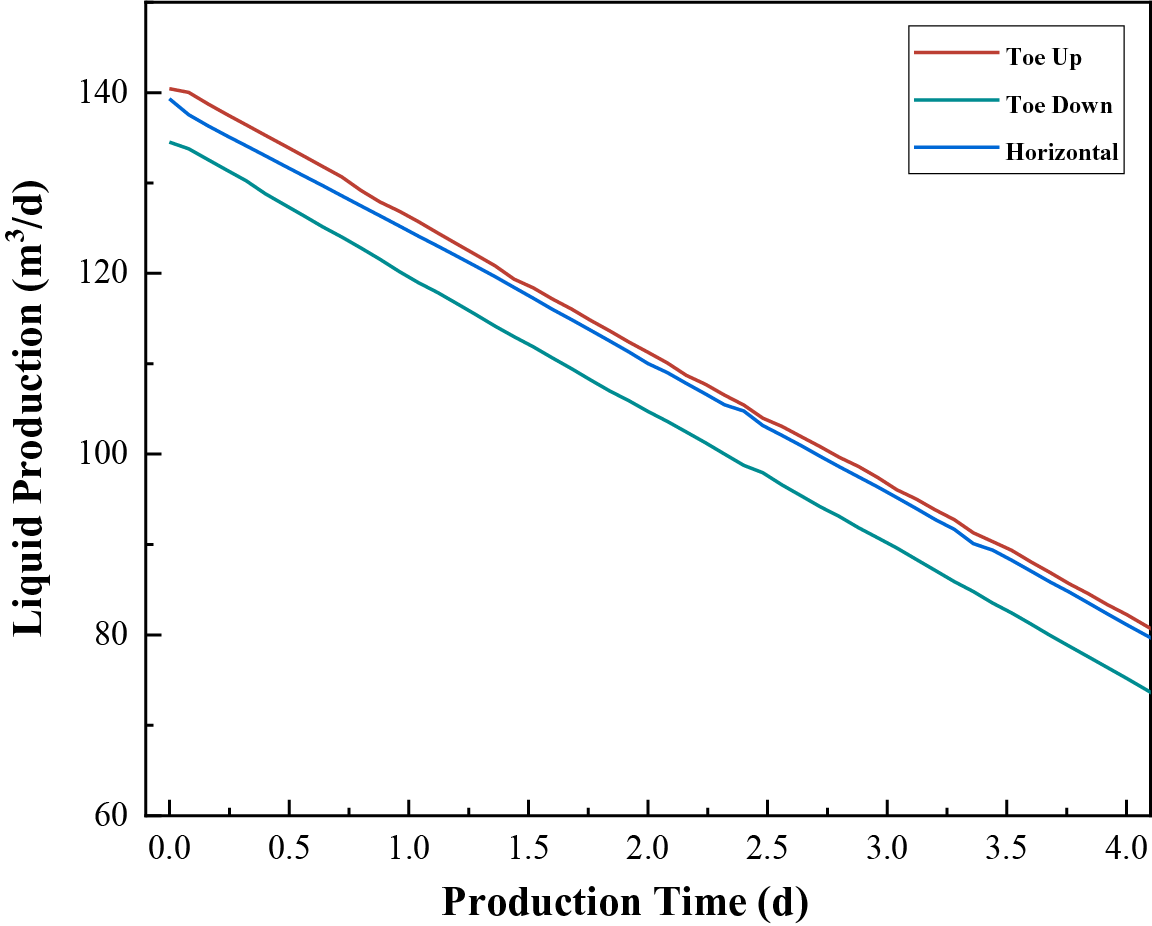
Figure 10: Comparison of daily liquid production for three well types in the early production stage
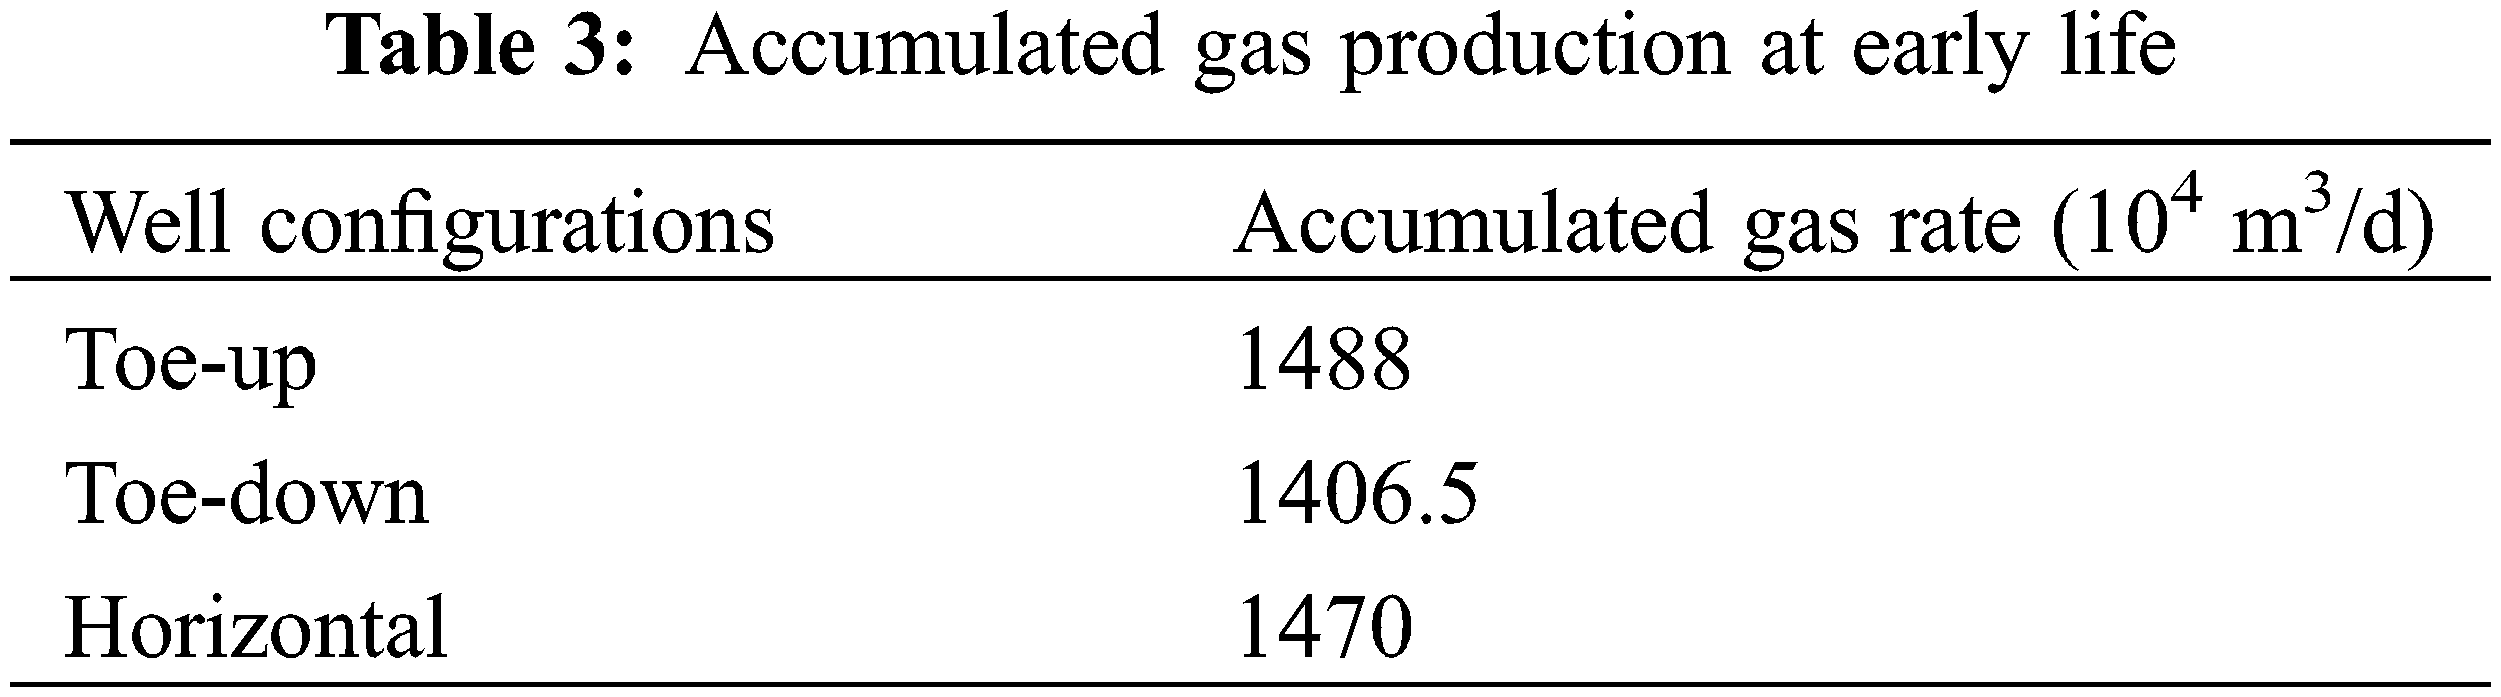
Table 3 presents the accumulated gas production rates for three different well configurations during the early production stages. The data indicates that the toe-up well configuration exhibits the highest accumulated gas production rate. In contrast, the toe-down well configuration experiences slugs in the lateral section, as evidenced by its holdup profile, leading to an accumulated production rate that is approximately 5.5% lower. Despite these differences, the overall accumulated gas production rates for all three well configurations are relatively similar. In summary, during the early production stage, the wellbore trajectory of the horizontal section has a minor impact on gas well productivity, with toe-up wells performing the best and toe-down wells exhibiting relatively lower production.
3.2 Late-Life Well Trajectory Effects
As formation depletion progresses, gas wells may encounter unstable production. The reduction in gas flow velocity exacerbates slug flow, and the accumulation of bottomhole liquid increases formation back pressure, leading to decreased gas well production. Figs. 11 and 12 illustrate the comparison of daily gas production and daily water production for the three well types during the late production stages, specifically the 240 to 480 days after tubing pressure stabilization. From these figures, it is evident that changes in the wellbore trajectory significantly impact gas well productivity. In the late production stages, the gas production of toe-up wells drops sharply, and liquid accumulation in the wellbore occurs earlier, whereas toe-down and horizontal wells maintain stable production. As formation pressure further decreases, the gas production of horizontal and toe-down wells gradually declines until production ceases.
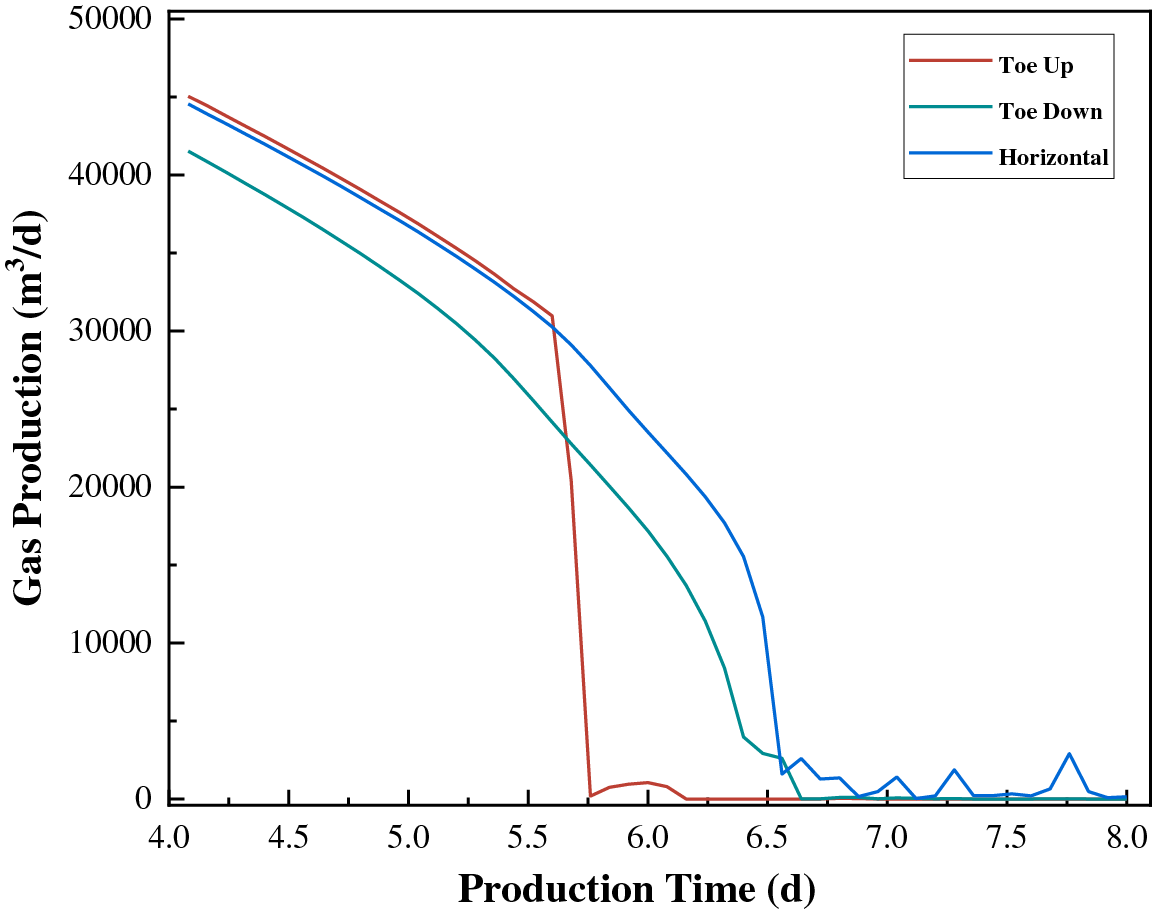
Figure 11: Comparison of daily gas production for three well types during the late production stages
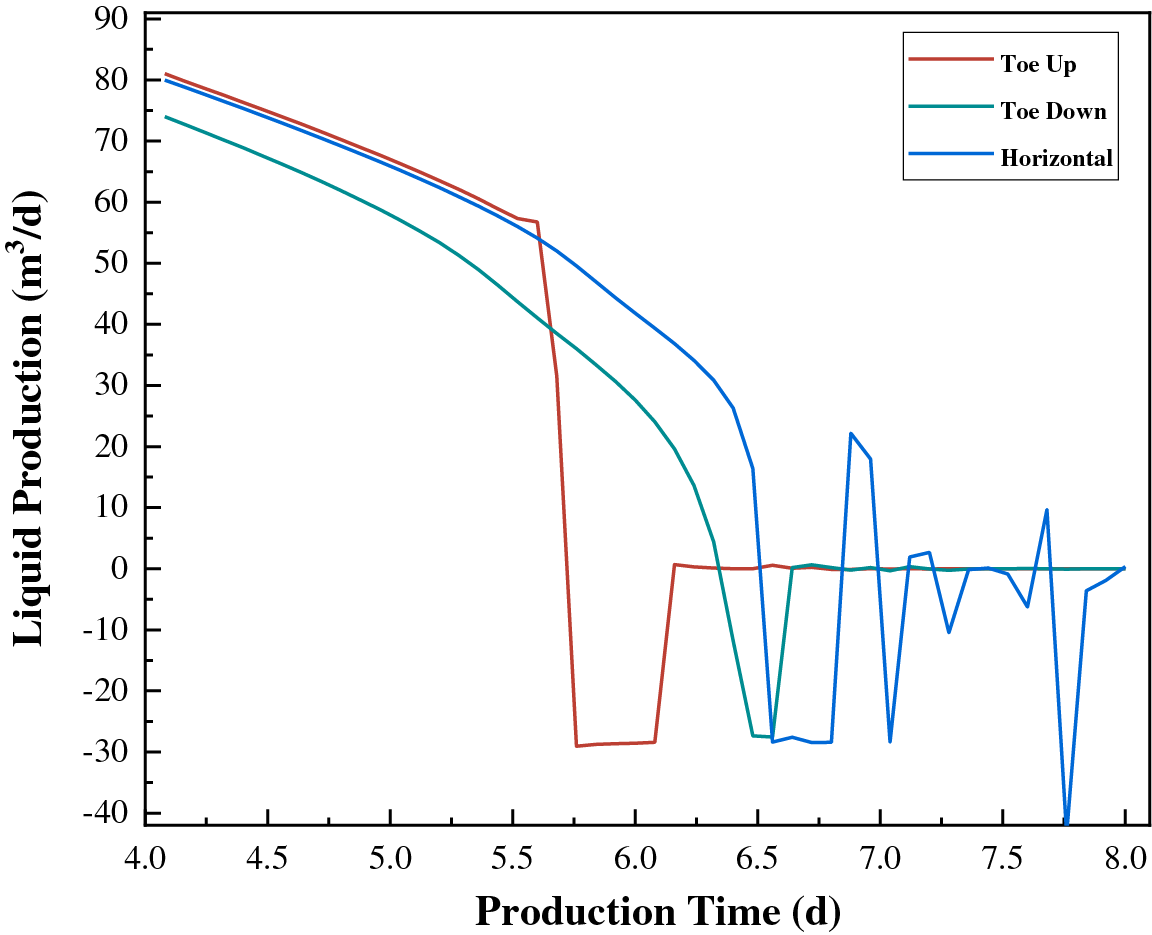
Figure 12: Comparison of daily water production for three well types during the late production stages
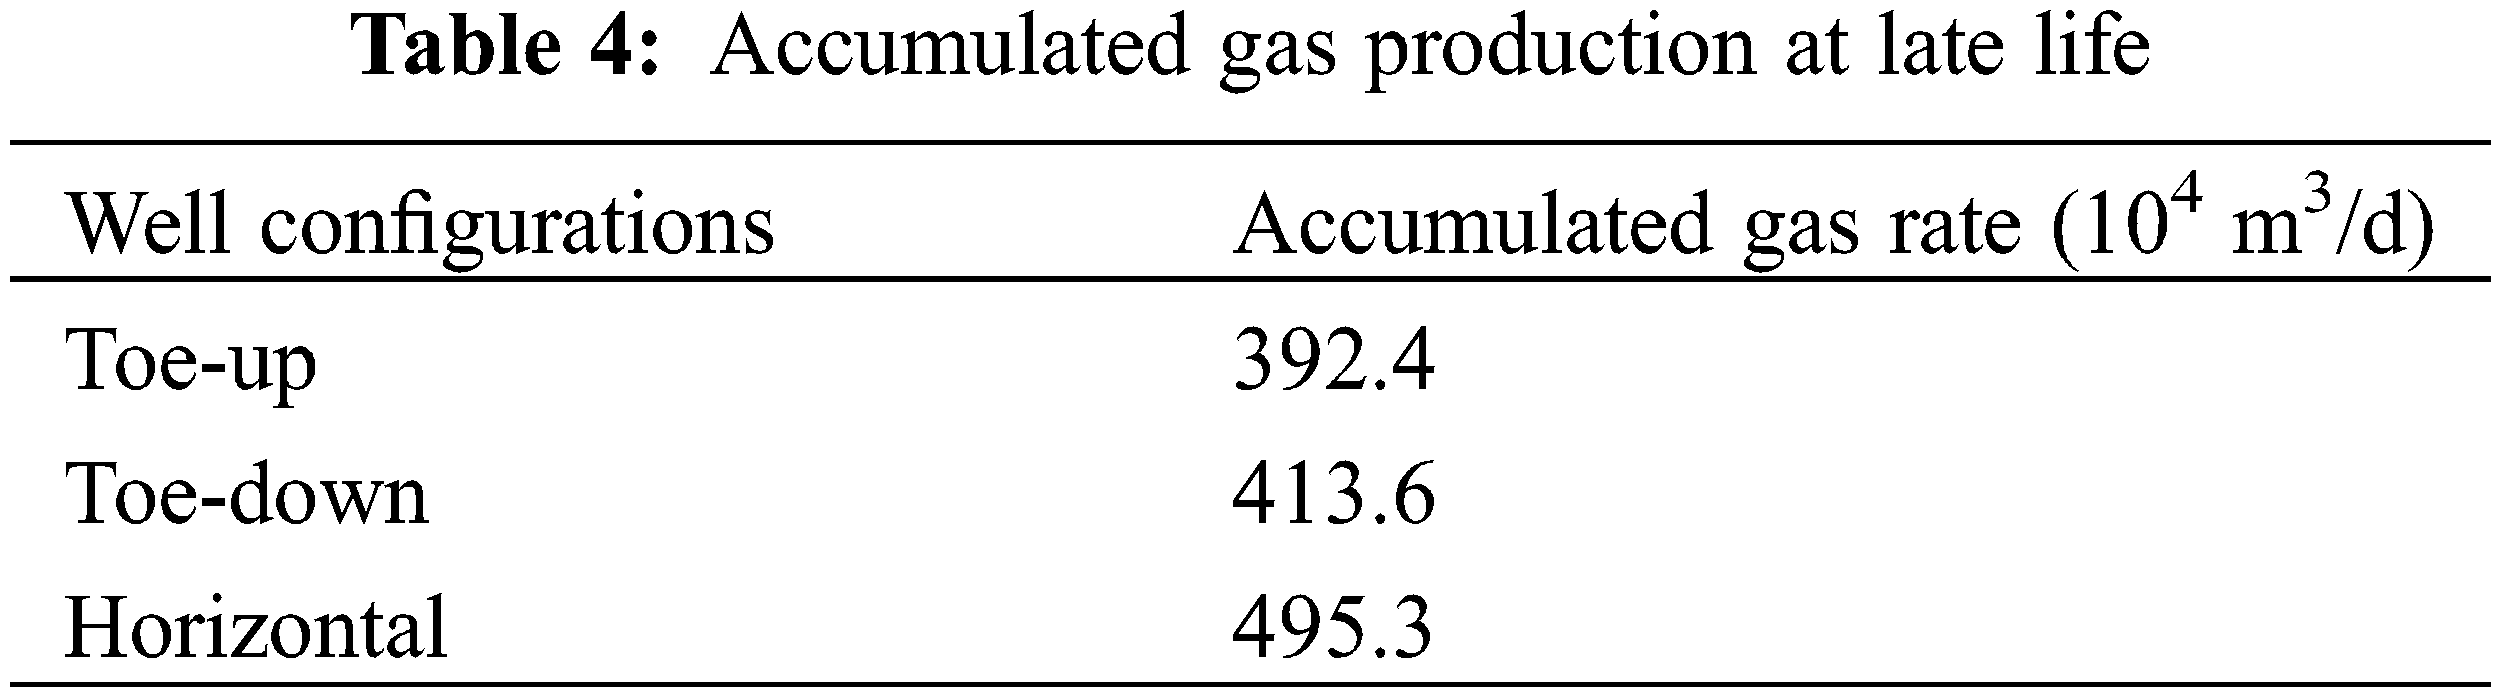
Table 4 presents the accumulated gas production rates for three different well configurations during the late production stages. The data indicates that the horizontal well achieves the highest accumulated gas production rate, followed by the toe-down, with the toe-up having the lowest rate. Specifically, the production rate of horizontal wells is about 26% higher than that of toe-up wells. This is because toe-up wells experience a sharp drop in gas production due to early liquid accumulation in the wellbore. In contrast, toe-down and horizontal wells maintain more stable production. These findings highlight the crucial role of wellbore trajectory in gas production performance, emphasizing the need to select the appropriate well configuration to maximize gas output.
Figs. 13 to 15 illustrate the pressure profiles and liquid holdup distributions for different well types during the late production stages. In toe-up wells, the liquid holdup in the lateral section remains low, with liquid accumulating near Point A, forming a liquid slug. The pressure increase caused by the height of the liquid slug is greater than that caused by gas compression, leading to the liquid slug blocking the bottom of the deviated well section. As gas and liquid continue to flow, the liquid column grows, eventually forming a long slug in the vertical section (Fig. 13). This severe slug significantly increases bottomhole pressure, reduces reservoir production pressure drop, and causes a sharp decrease in toe-up well production. The long slug in the vertical section also confirms Brito et al.’s research [21], which suggests severe slugs may occur in toe-up wells. In toe-down wells, under the same formation conditions, a larger hydrodynamic slug flow is observed in the horizontal section. However, the slug flow does not completely block the perforated section, and the produced gas can still carry liquid, significantly reducing liquid holdup and pressure in the vertical section (Fig. 14). Meanwhile, the performance of horizontal wells is notably better than that of toe-up and toe-down wells. As shown in Fig. 15, the gas-liquid distribution in the horizontal section is uniform, and due to slippage loss, liquid mainly accumulates in the deviated well section. However, the overall flow is stable, with lower liquid holdup and significantly lower bottomhole pressure than in toe-up and toe-down wells, resulting in the highest gas production efficiency. In summary, during the late production stages, horizontal wells are the optimal choice, with toe-up wells experiencing a sharp decline in production due to severe slugs, and toe-down wells having better flow stability.
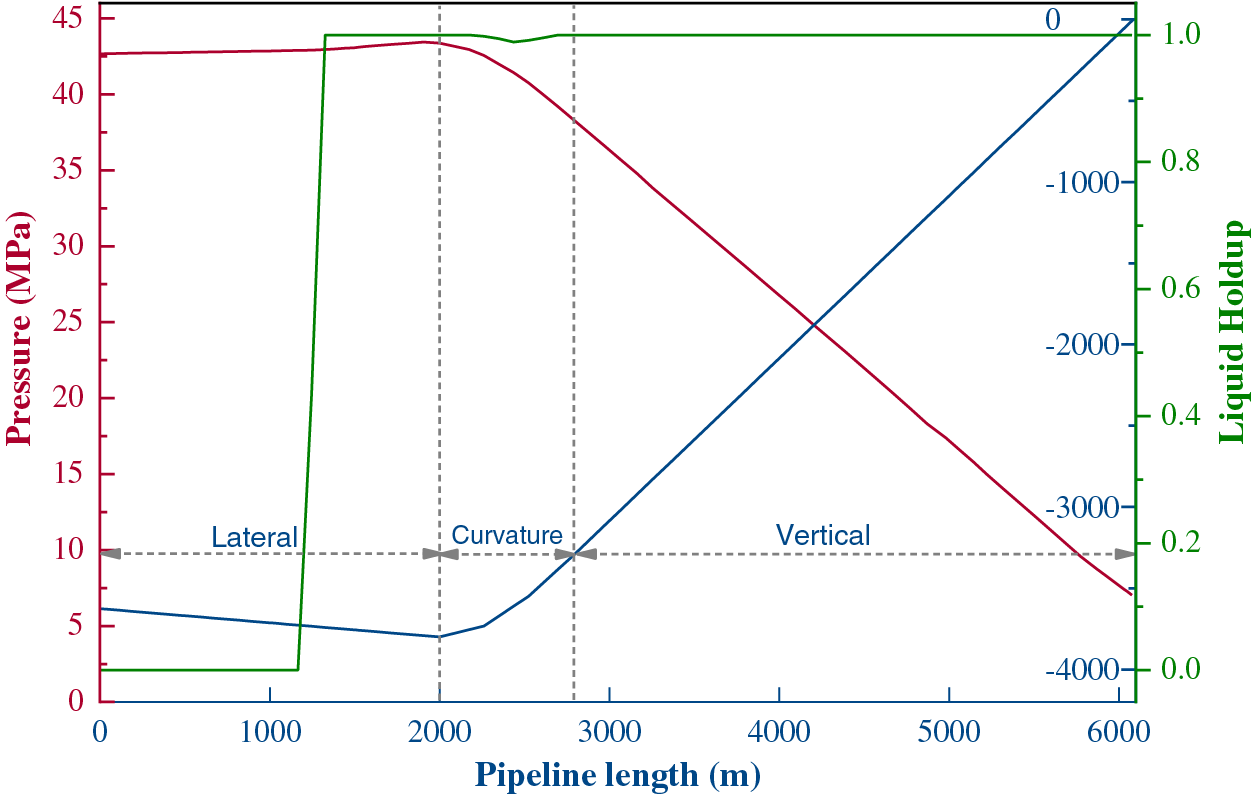
Figure 13: Pressure and liquid holdup distribution along the wellbore (toe-up well)
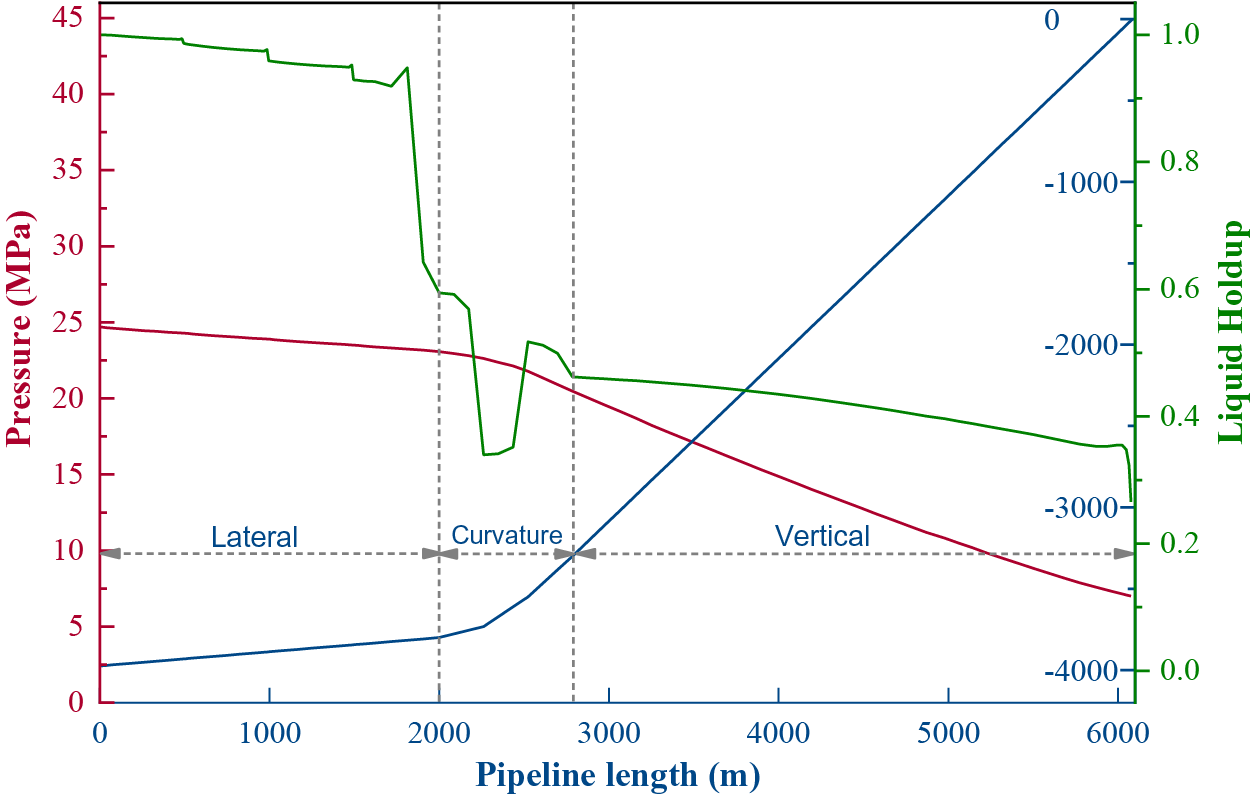
Figure 14: Pressure and liquid holdup distribution along the wellbore (toe-down well)
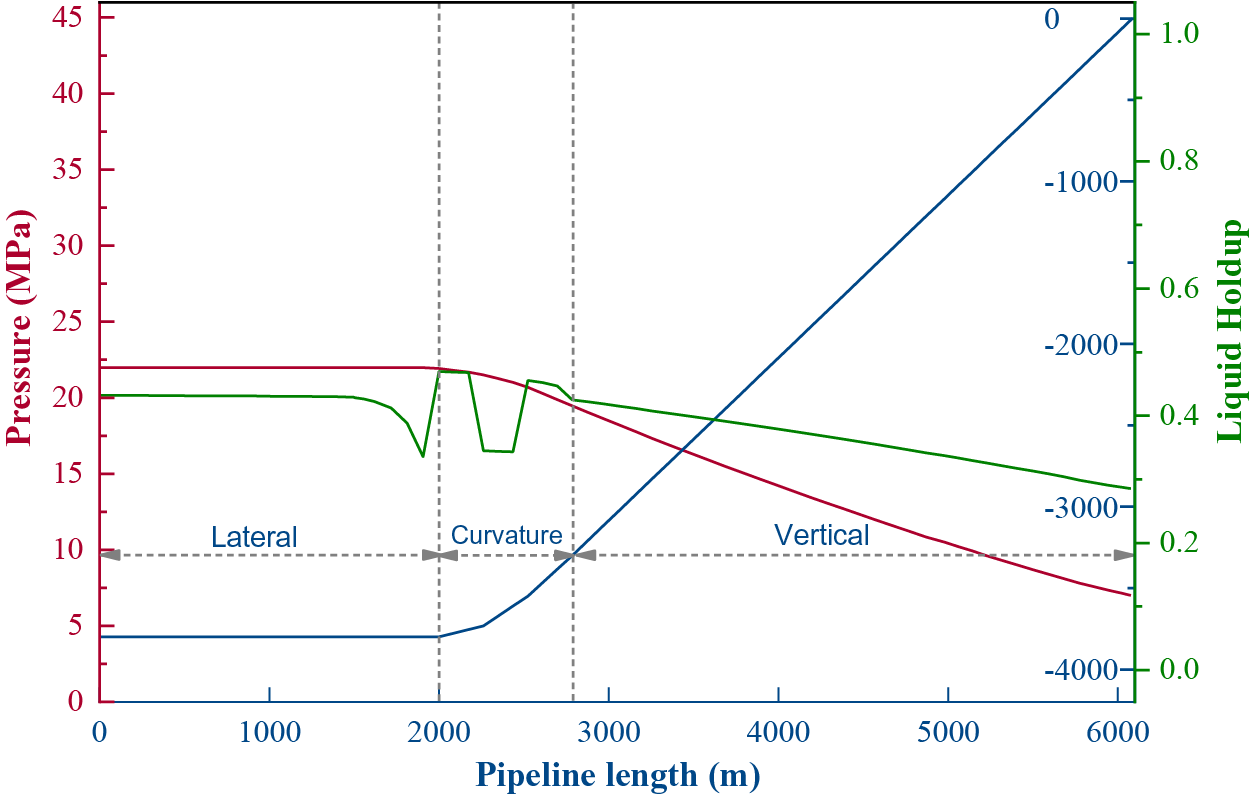
Figure 15: Pressure and liquid holdup distribution along the wellbore (horizontal well)
3.3 Undulation Effects on Production
In previous studies, we simulated the fluid dynamics behavior of three types of horizontal wells with smooth horizontal sections. However, in actual drilling operations, the wellbore trajectory is rarely smooth and often fluctuates randomly within a certain angle range, particularly in the horizontal section. When the aforementioned three well types (toe-up, toe-down, horizontal) are influenced by undulations in the inclination angle, the fluid behavior and productivity of the wells may also be affected.
Fig. 16 depicts the distribution of liquid holdup and pressure along the wellbore of an undulating horizontal well during the late production stages. It is evident from the figure that when the horizontal section is undulating, the liquid holdup in the horizontal section is significantly higher than in a smooth horizontal well (compared to Fig. 15). In the uphill sections, slug flow dominates, while in the downhill sections, stratified flow prevails. Liquid primarily accumulates in the uphill sections, forming slugs that block the perforation holes, resulting in a liquid holdup near 1 in the uphill sections, whereas the liquid holdup in the downhill sections is close to 0. According to a report by Becze et al. [14], Schlumberger conducted an underground video test of a serpentine well and found that slug flow dominates in the uphill sections, with a significant increase in liquid holdup and flow instability, while the liquid holdup in the downhill sections is lower. Our simulation results confirm the experimental phenomena described in the previous study. Fig. 17 is a comparison of the pressure changes at the tubing shoe. Compared to a smooth horizontal well, the undulating horizontal well experiences increased wellbore pressure drop and earlier onset of flow instability due to the impact of slugs in the horizontal section.
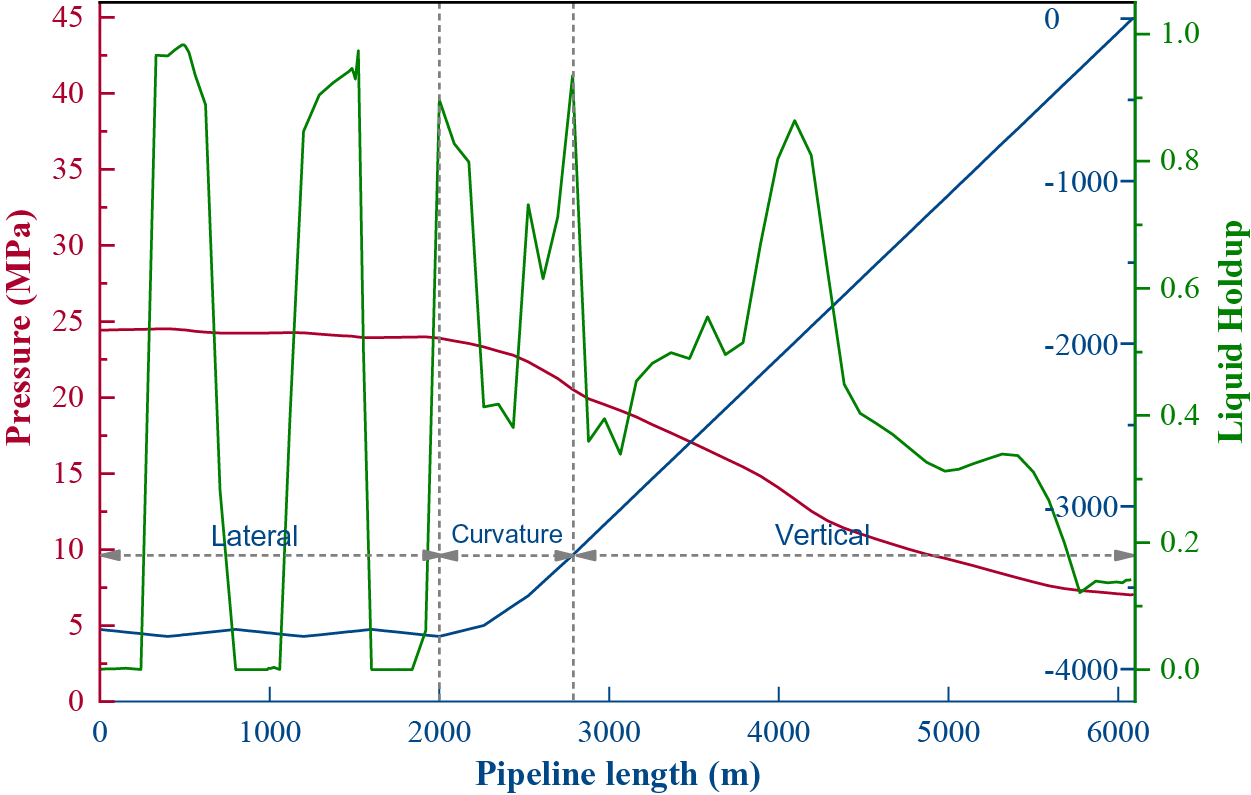
Figure 16: Pressure and liquid holdup distribution along the wellbore (undulating horizontal well)
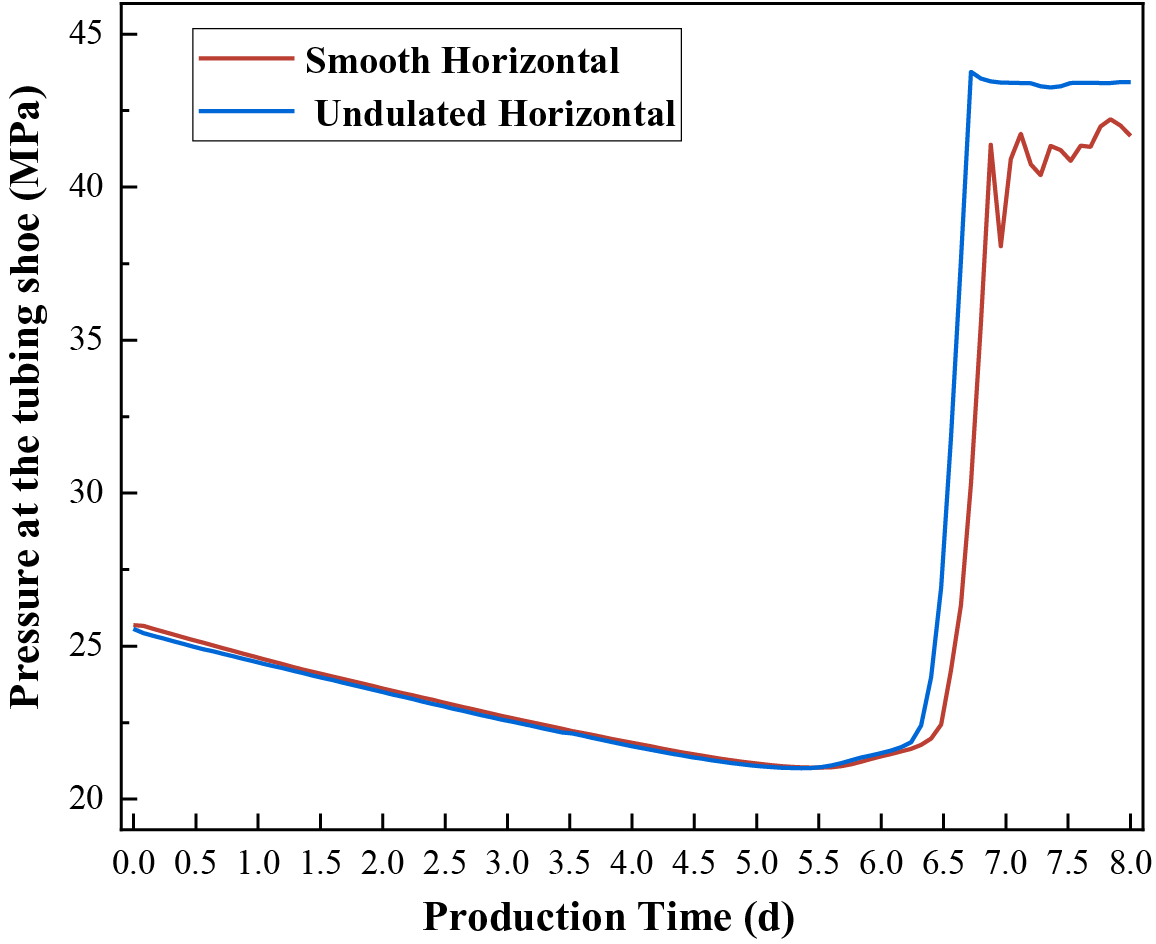
Figure 17: Pressure change at the tubing shoe of an undulating horizontal well
Fig. 18 illustrates the distribution of liquid holdup and pressure along the wellbore of an undulating toe-up well during the late production stages. It is observed that the liquid holdup distribution in the undulating toe-up well is similar to that in a smooth toe-up well, with low liquid holdup in the horizontal section and liquid primarily accumulating in the vertical section, forming a long slug. This results in increased bottomhole pressure, reduced reservoir producing pressure differential, and decreased production. Fig. 19 compares the pressure change at the tubing shoe for the two well types. In the undulating toe-up well, the formation of severe slugs causes the pressure at the tubing shoe to increase sharply to 43.4 MPa. However, compared to a smooth toe-up well, the occurrence of severe slugs in an undulating toe-up well is delayed, resulting in an extended period of stable production for the tubing. The undulations along the lateral section act as a damping buffer, effectively delaying the onset of severe slugging. This phenomenon is attributed to the geometric undulations creating a series of local potential energy wells on a micro-scale, which require the accumulation of a specific volume of fluid before the barrier can be overcome, allowing the flow to proceed to the next low point. This dynamic process demands additional time and energy, resulting in a macro-scale delay in slug formation. Each undulation temporarily stores a portion of the fluid, consequently reducing the overall velocity of the liquid phase along the wellbore. Furthermore, the prolonged period for fluid accumulation leads to a delay in the occurrence of larger volume liquid slugs compared to a smooth wellbore.
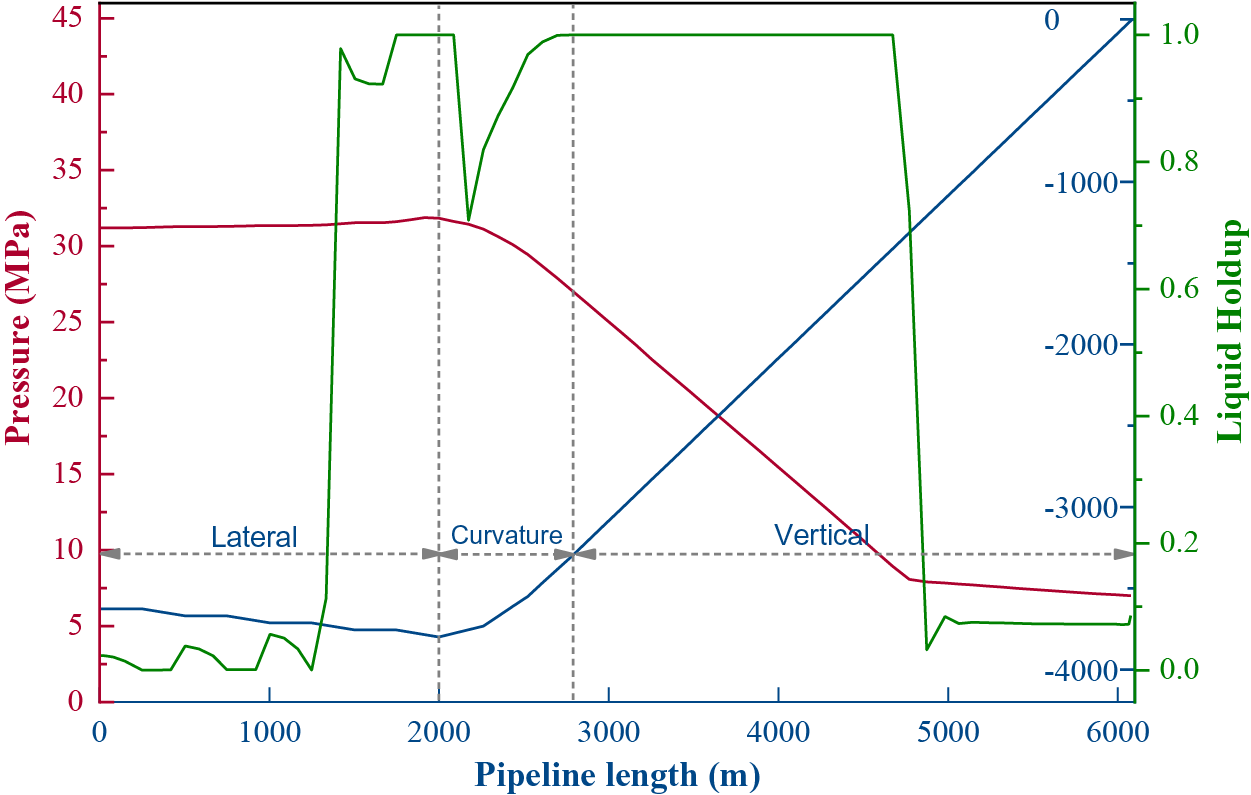
Figure 18: Pressure and liquid holdup distribution along the wellbore (undulating toe-up well)
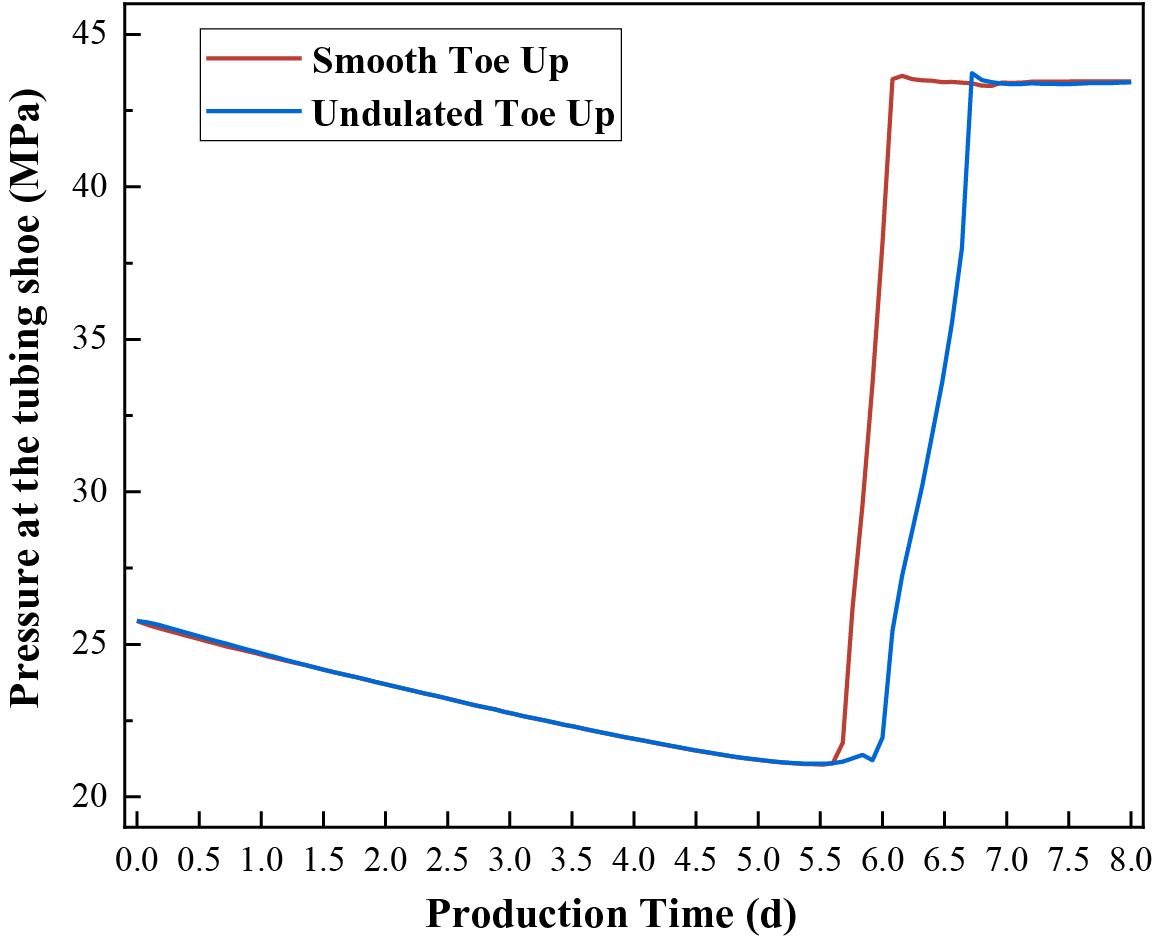
Figure 19: Pressure change at the tubing shoe of an undulating toe-up well
For the undulating toe-down well, hydrodynamic slugs exist in the horizontal section, as shown in Fig. 20. Compared to a smooth toe-down well, the liquid holdup in the horizontal section is lower, the intensity of slug flow is weaker, and the bottomhole pressure is smaller (compared to Fig. 14), enabling gas to carry liquid to the surface. Fig. 21 compares the pressure change at the tubing shoe for the two well types. Similarly, due to the weaker intensity of slug flow, the time for severe slug formation in the undulating toe-down well is delayed, resulting in a longer stable production time for the tubing. The undulated structure effectively enhances the natural separation mechanism of gas-liquid two-phase flow. Liquid accumulation in the concave sections facilitates better passage for the gas phase in the convex sections, promoting phase redistribution and fluid dynamic stability.
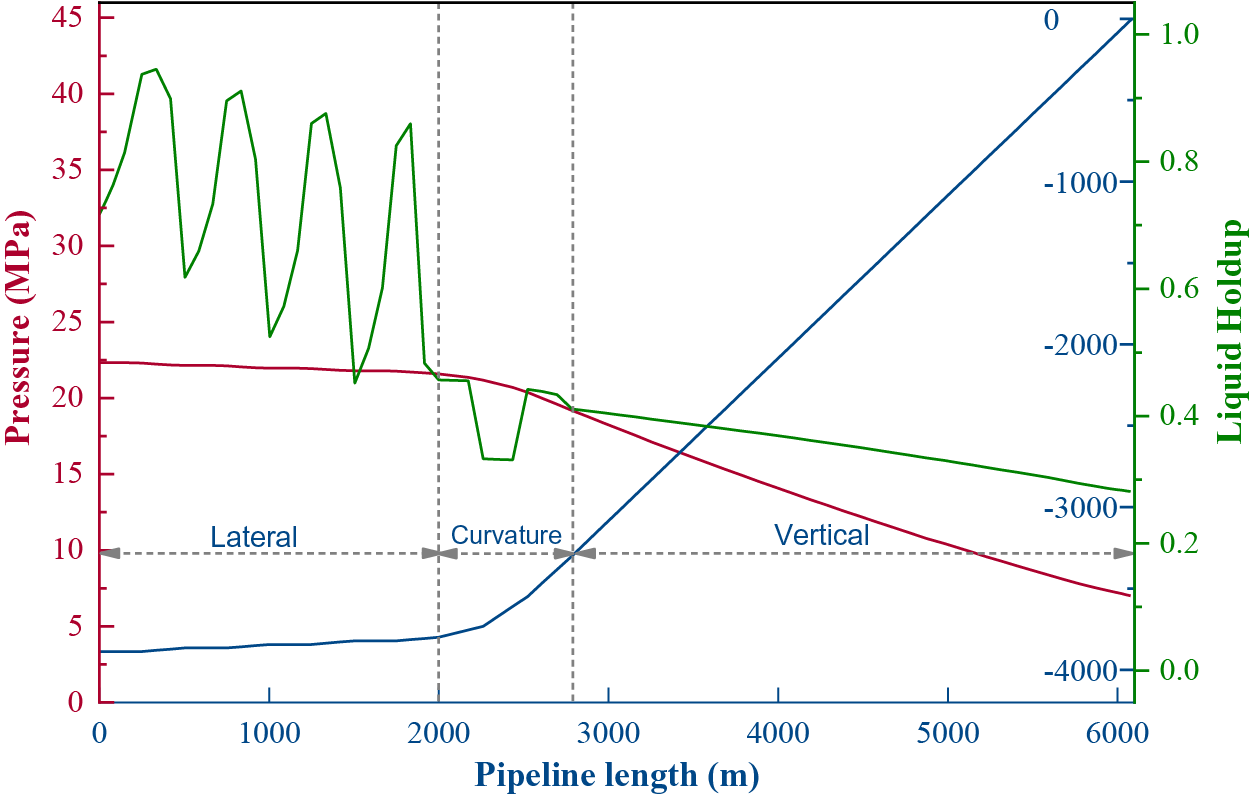
Figure 20: Pressure and liquid holdup distribution along the wellbore (undulating toe-down well)
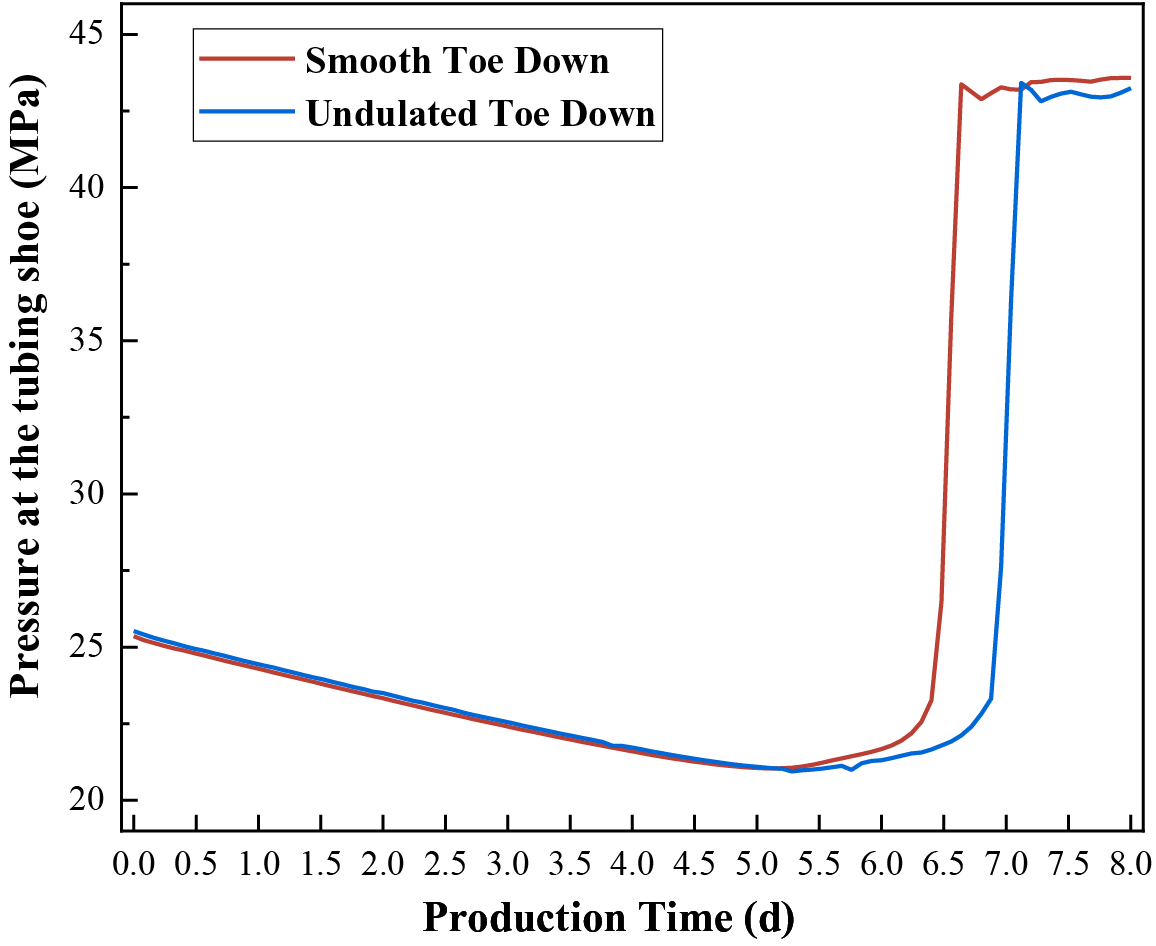
Figure 21: Pressure change at the tubing shoe of an undulating toe-down well
This study provides a comprehensive analysis of the impact of lateral section trajectory on the optimization of horizontal well production throughout the entire life-cycle. The main conclusions are as follows:
(1) In the early production stage, gas wells exhibit stable flow, and the wellbore trajectory of the horizontal section has minimal impact on gas well production, with toe-up wells performing the best. Specifically, the toe-up configuration exhibits the highest accumulated gas production rate, approximately 5.5% higher than the toe-down configuration, which experiences slugs in the lateral section. In the late production stages, gas well productivity is significantly influenced by wellbore trajectory. Horizontal wells achieve the highest accumulated gas production rates, about 26% higher than toe-up wells, due to minimal liquid holdup and back pressure. Toe-down wells perform better than toe-up wells by approximately 5.4%. These findings underscore the critical impact of wellbore trajectory on gas well performance, emphasizing the need for optimal well configuration to maximize output during the late production stage.
(2) The toe-up trajectory causes liquid to accumulate at the Point A in the horizontal section. As formation pressure decreases, the liquid accumulation in the deviated well section develops into severe slugs, increasing the instability of gas well production and causing premature liquid accumulation in gas wells.
(3) The toe-down trajectory causes liquid to accumulate at the toe of the horizontal section, thereby increasing the liquid holdup and bottomhole pressure in the wellbore and reducing gas well production; when the formation energy is insufficient, the liquid falls back and gradually forms severe slugs in the horizontal section.
(4) The undulations along the horizontal section contribute to the flow stability in both toe-up and toe-down wells. By dispersing the kinetic energy of the liquid phase, these undulations can delay the occurrence of severe slugs, thereby helping to maintain stable production. However, for horizontal wells, undulations may have adverse effects. They can cause an uneven distribution of liquid in the horizontal section, leading to the formation of slugs that plug the perforated section and thereby impact flow stability and production.
Acknowledgement: The authors acknowledge Schlumberger for providing the software used in this study.
Funding Statement: This study was supported by a postdoctoral project from PetroChina Southwest Oil and Gas Field Company, titled “Research on Flow Behavior of Horizontal Shale Gas Wellbore Based on Reservoir-Wellbore Coupling” (Project Number: 2024D103-02-08).
Author Contributions: The authors confirm contribution to the paper as follows: Study conception and design: Anqi Du, Ming Wen; Dynamic simulation: Anqi Du, Jian Yang; Analysis and interpretation of results: Anqi Du, Ming Wen; Draft manuscript preparation: Anqi Du. All authors reviewed the results and approved the final version of the manuscript.
Availability of Data and Materials: The datasets generated and/or analyzed during the current study are available from the corresponding author on reasonable request.
Ethics Approval: Not applicable.
Conflicts of Interest: The authors declare no conflicts of interest to report regarding the present study.
Supplementary Materials: The supplementary material is available online at https://doi/10.32604/fdmp.2024.058553.
References
1. Spencer CW. Review of characteristics of low-permeability gas reservoirs in western United States. Am Assoc Pet Geol Bull. 1989;73(5):613–29. doi:10.1306/44B4A23F-170A-11D7-8645000102C1865D. [Google Scholar] [CrossRef]
2. Ding DY, Wu YS, Farah N, Wang C, Bourbiaux B. Numerical simulation of low permeability unconventional gas reservoirs. In: SPE/EAGE European Unconventional Resources Conference and Exhibition, 2014; Vienna, Austria. doi:10.2118/167711-MS. [Google Scholar] [CrossRef]
3. Li Z, Duan Y, Wei M, Peng Y, Chen Q. Pressure performance of interlaced fracture networks in shale gas reservoirs with consideration of induced fractures. J Pet Sci Eng. 2019;178(1):294–310. doi:10.1016/j.petrol.2019.03.048. [Google Scholar] [CrossRef]
4. Chen H, Liu H, Shen C, Xie W, Liu T, Zhang J, et al. Research on geological-engineering integration numerical simulation based on EUR maximization objective. Energies. 2024;17(15):3644. doi:10.3390/en17153644. [Google Scholar] [CrossRef]
5. Pokalai K, Fei Y, Ahmad M, Haghighi M, Gonzalez M. Design and optimisation of multi-stage hydraulic fracturing in a horizontal well in a shale gas reservoir in the Cooper Basin, South Australia. Appea J. 2015;55(1):1–14. doi:10.1071/AJ14001. [Google Scholar] [CrossRef]
6. Guo J, Lu Q, He Y. Key issues and explorations in shale gas fracturing. Nat Gas Ind B. 2023;10(2):183–97. doi:10.1016/j.ngib.2022.12.001. [Google Scholar] [CrossRef]
7. Ben Mahmud H, Ermila M, Bennour Z, Mahmud WM. A review of fracturing technologies utilized in shale gas resources. In: Emerging technologies in hydraulic fracturing and gas flow modelling. UK: IntechOpen; 2022. p. 1–20. doi:10.5772/intechopen.92366. [Google Scholar] [CrossRef]
8. Brito RM. Effect of horizontal well trajectory on two-phase gas-liquid flow behavior (Master’s Thesis). The University of Tulsa: Tulsa, OK, USA; 2015. [Google Scholar]
9. Browning S, Ram J. Effects of Toe-Up vs Toe-Down wellbore trajectories on production performance in the cana woodford. In: SPE/AAPG/SEG Unconventional Resources Technology Conference, 2016; San Antonio, TX, USA. doi:10.15530/urtec-2016-2461600. [Google Scholar] [CrossRef]
10. Peng Y, Luo A, Li Y, Wu Y, Xu W, Sepehrnoori K. Fractional model for simulating long-term fracture conductivity decay of shale gas and its influences on the well production. Fuel. 2023;351(6):129052. doi:10.1016/j.fuel.2023.129052. [Google Scholar] [CrossRef]
11. Norris HLIII. The use of a transient multiphase simulator to predict and suppress flow instabilities in a horizontal shale oil well. In: SPE Annual Technical Conference and Exhibition, 2012; San Antonio, TX, USA. doi:10.2118/158500-MS. [Google Scholar] [CrossRef]
12. Brito R, Pereyra E, Sarica C. Effect of well trajectory on liquid removal in horizontal gas wells. In: SPE Annual Technical Conference and Exhibition, 2016; Dubai, United Arab Emirates. doi:10.2118/181423-MS. [Google Scholar] [CrossRef]
13. Bendiksen KH, Malnes D, Moe R, Nuland S. The dynamic two-fluid model OLGA: theory and application. SPE Prod Eng. 1991;6(2):171–80. doi:10.2118/19451-PA. [Google Scholar] [CrossRef]
14. Becze A, Nascimento CM, Jackson DF, Virués CJ, Wang A. The impact of well trajectory on Horn River shale gas well production in a multi-well pad: a new approach using steady state and transient simulation. In: SPE Canadian Unconventional Resources Conference, 2013; Calgary, AB, Canada. doi:10.2118/167210-MS. [Google Scholar] [CrossRef]
15. Tran N, Karami H. Transient multiphase analysis of well trajectory effects in production of horizontal unconventional wells. In: SPE Annual Technical Conference and Exhibition, 2019; Calgary, AB, Canada. doi:10.2118/195994-MS. [Google Scholar] [CrossRef]
16. Mustafa A. Transient simulation study of well trajectory effect on sand transport in multiphase flow. In: SPE Annual Technical Conference and Exhibition, 2020. doi:10.2118/201587-MS. [Google Scholar] [CrossRef]
17. Khetib Y. Investigation of transient multiphase flow performance in undulating horizontal unconventional wells (Master’s Thesis). The University of North Dakota: Grand Forks, ND, USA; 2022. [Google Scholar]
18. Jackson DFB, Virués CJJ, Sask D. Investigation of liquid loading in tight gas horizontal wells with a transient multiphase flow simulator. In: Canadian Unconventional Resources Conference, 2011; Calgary, AB, Canada. doi:10.2118/149477-MS. [Google Scholar] [CrossRef]
19. Staff G, Biberg D, Vanvik T, Hoyer N, Nossen J, Holm H, et al. Validation of OLGA HD against transient and pseudotransient experiments from the SINTEF large diameter high pressure flow-loop. In: 17th International Conference on Multiphase Production Technology, 2015; Cannes, France. [Google Scholar]
20. Ashfahani AS, Sulistiyo S, Hapsari HS. Dynamic well modeling, where are we?: mahakam operation experience for well diagnostics & optimization. In: SPE/IATMI Asia Pacific Oil & Gas Conference and Exhibition, 2019; Bali, Indonesia. doi:10.2118/196248-MS. [Google Scholar] [CrossRef]
21. Brito R, Pereyra E, Sarica C. Existence of severe slugging in toe-up horizontal gas wells. In: SPE North America Artificial Lift Conference and Exhibition, 2016; The Woodlands, TX, USA. doi:10.2118/181217-MS. [Google Scholar] [CrossRef]
Cite This Article
 Copyright © 2025 The Author(s). Published by Tech Science Press.
This work is licensed under a Creative Commons Attribution 4.0 International License , which permits unrestricted use, distribution, and reproduction in any medium, provided the original work is properly cited.
 Downloads
 Citation Tools