
 Submit a Paper
 Propose a Special lssue
 Open Access
ARTICLE

Spatio-Temporal Variations of River Water Quality for Material Processing Purposes
1 Institute of Continuous Media Mechanics UB RAS, Laboratory of Computational Fluid Dynamics, Perm, 614068, Russia
2 Mining Institute UB RAS, Laboratory of Land Hydrology Problems, Perm, 614000, Russia
3 School of Applied Mathematics, Kazakh-British Technical University, Almaty, 050040, Kazakhstan
* Corresponding Author: Tatyana Lyubimova. Email:
(This article belongs to the Special Issue: Non-Equilibrium Processes in Continuous Media)
Fluid Dynamics & Materials Processing 2025, 21(4), 741-756. https://doi.org/10.32604/fdmp.2025.061649
Received 29 November 2024; Accepted 27 February 2025; Issue published 06 May 2025
 View Full Text
 Download PDF
Abstract
The article presents the results of in-kind measurements and numerical modeling of the formation of water characteristics in the Kama River, which is used for technical water supply in the production of potash fertilizers. In the warm season, risks arise that threaten the sustainability of the water supply. It was found that in the summer, when the studied section of the Kama River is backed up by the Kama Hydroelectric Power Station, there is a significant decrease in flow rates, which leads to vertical stratification of water properties. This, in turn, significantly limits the possibilities of using water from the bottom zone. Under conditions of significant water discharge from the reservoir, this section has river conditions with significantly higher flow rates. Under such conditions, intense vertical mixing of water masses occurs, which improves the consumer properties of water necessary for sustainable water supply. The results of numerical modeling carried out within the framework of the three-dimensional approach confirmed this conclusion. It is shown that with an increase in the flow rate in the channel near the water intake, the concentration of salts decreases, which is an important factor in ensuring high-quality water supply.Keywords
The problem of supplying water to industrial enterprises and the population of large cities is very acute for many countries of the world. The hydrochemical regime, and therefore the quality of water, is determined by a number of factors, both natural and anthropogenic [1–5]. Researchers investigating such problems are often confronted with changes in water quality indicators in the area of water bodies and the depth of water bodies. Currently, there are a large number of works in the literature devoted to the construction of water quality models, solving problems of optimal water resource management, and creating an integrated algorithm for improving the state of the environment [2–6].
In the production of potash fertilizers, the problem of water intake with specified characteristics is acute. The industrial water supply of the Solikamsk-Beznikovsky industrial hub is largely carried out from surface water bodies, primarily from the Kama River (Kama Reservoir). Their hydrochemical regime is formed under the influence of filtration discharges and wastewater discharges formed on the territory of the Verkhnekamskoye potassium-magnesium salt deposit [7–9]. Accordingly, the content of macrocomponents, primarily chlorine ions, as well as sodium, potassium, and magnesium, increases significantly in the water of the Kama River [7–9]. At the same time, modern technological equipment often imposes fairly strict requirements on water quality. For example, if the MAC for chlorides for water bodies used for domestic and drinking purposes is 350 mg/L, for fishery purposes, it is 300 mg/L, and the technological standards for a number of production cycles are 100 mg/L. A violation of the quality of the water taken can lead to the stoppage of production processes and significant financial losses. In this regard, in recent years, interest in the study of the formation of the hydrochemical regime of water bodies located in areas of active technogenesis has increased.
In world practice a great number of works is devoted to the study of properties of water masses, including such peculiarity as the formation of vertical stratification. As a rule, the causes of vertical stratification of water masses are temperature gradients. The reasons for such changes can be different: first of all, it is the influence of climatic [10] and anthropogenic [11] factors, past this feature of geothermal areas in the area of volcanoes [12], the influence of thermal regimes of different water bodies on each other [13] and others.
In solving both applied and fundamental problems, the analysis of temporal variations in the stratification of water masses, the study of the mechanisms of formation of vertical heterogeneity of water masses are of great interest. Therefore, since water temperature is characterised by significant daily and seasonal fluctuations, much more attention is paid to the study of the stratification of water masses due to the temperature factor [14,15]. For example, reference [14] examines the effects of water level fluctuations and short-term climatic variations on the stratification of reservoirs in British Columbia. Influence of seasonal variations in water temperature on water quality stratification in Brazilian reservoirs [16]. The formation of temperature stratification processes in reservoirs is actively studied in the context of ensuring the effective and stable operation of once-through and return cooling systems of large power complexes [17].
However, the stability of the heterogeneous distribution of water masses associated with water mineralisation very often plays a decisive role in solving problems related to ensuring the stability of the functioning of water supply systems and surface water bodies [18]. These issues are particularly relevant for water located in zones of active techno genesis [19], in areas of river confluence characterised by low velocities and significant differences in water mineralisation [20]. As a rule, the considered stable formations of vertical heterogeneity of water masses, caused both by temperature and water mineralisation, have a seasonal character with a duration of ~100 days, however, when solving applied problems, one has to deal with significantly shorter processes of formation of vertical heterogeneity of water masses [21].
The study area of the investigated water body, the Kama reservoir, is located in the temperate climate zone, in the middle latitudes in the area of the second largest city of the Perm Territory of the Russian Federation—the city of Berezniki (Fig. 1). This area is the pinch-out zone of the Kama reservoir. This reservoir is a long-term and seasonal regulation reservoir. It has a length of more than 300 km, a maximum width of about 14 km, and a maximum depth of about 30 m. In the warm season, when the water level in the reservoir is maintained near the normal headwater level—108.5 m abs in its canal part, the depths reach 15–20 m, and low flow velocities of ~0.1 m/s are observed. In winter, there is a significant depletion of the reservoir by 6–7 m, which leads to typical river conditions. In this section of the Kama River (Kama Reservoir), the problems of technical water supply for large enterprises of the Solikamsk-Beznikovsky industrial hub are actively solved. A characteristic feature of this zone is the presence of filtration discharges of highly mineralized brines caused by a complex combination of natural and anthropogenic factors. It is important to note that this area is the center of development of one of the world’s largest deposits of potash and magnesium ores.
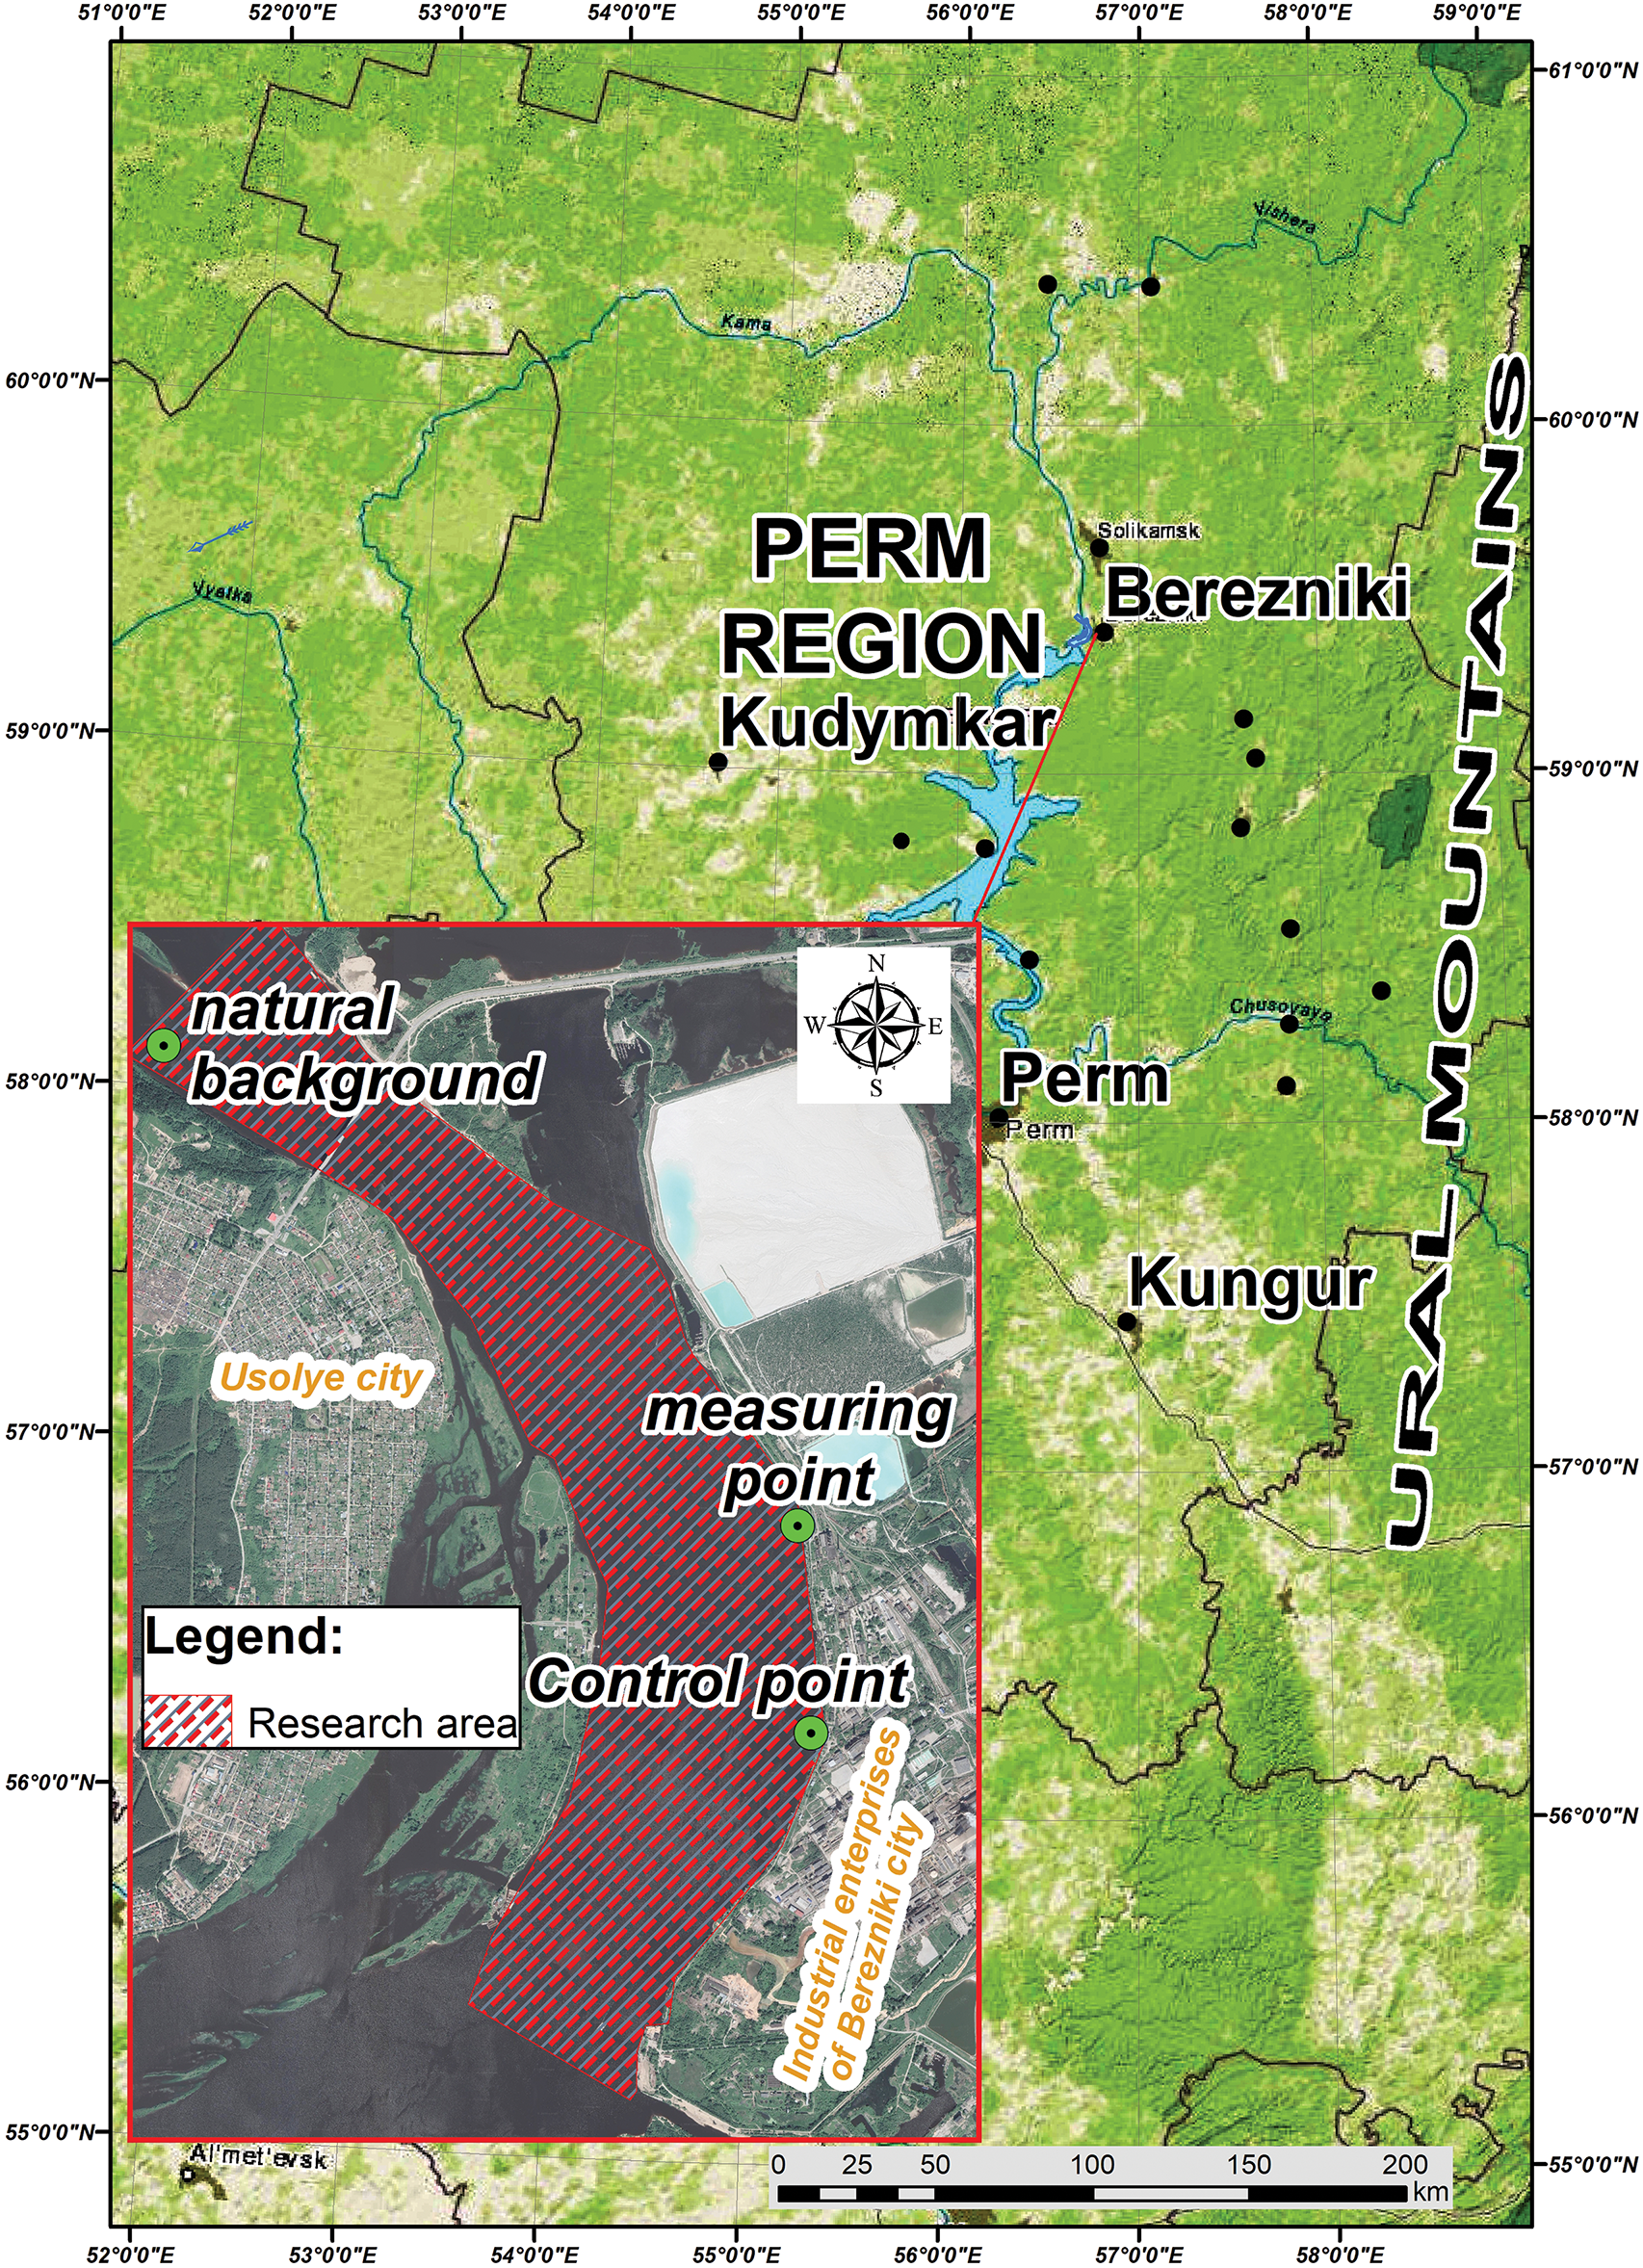
Figure 1: Layout of control verticals on the Kama River in the Berezniki area
A characteristic feature of the hydrochemical regime of the Kama River (Kama Reservoir) in the area of the city of Berezniki is the significant vertical inhomogeneity of water masses observed during the warm period. Since this phenomenon was not observed throughout the entire water area and not throughout the warm period, it has not received due attention until recently, although it was repeatedly recorded by researchers during detailed hydrochemical surveys [9,10]. This was primarily due to the fact that this phenomenon did not fit into the framework of traditional ideas about the formation of the hydrochemical regime of reservoirs, with the labor intensity of such studies, as well as the need to use special means of water sampling and measurements.
The main limiting ingredient determining the quality of water in the considered section of the Kama Reservoir is chloride ion; this indicator is monitored at water intakes. At the same time, the specific electrical conductivity of water is very closely related to the total mineralization of water, determined primarily by the content of chlorides in it. Currently, there is a whole line of certified devices that allow for prompt and highly reliable measurements of the specific electrical conductivity of water, taking into account a number of “interfering” factors, including water temperature. The assessment of changes in the value of total mineralization of water both in the water area of the considered section of the reservoir and in depth was carried out using this indicator. The total length of the section was about 7 km. The distribution of the measurement verticals on it is shown in Fig. 1. In the area of the control point there is a large discharge of wastewater from the industrial unit of this area. During the warm period, measurements of the specific electrical conductivity and water sampling on the verticals were carried out monthly. The interval of measurements by depth was taken as 1 m with insignificant vertical gradients, with a decrease to 0.5 m—in zones of significant vertical inhomogeneity. Conductivity measurements were performed by a portable field conductometer WTW 1970i (manufactured by Germany), equipped with a protected sensor with a cable length of 20 m. Water samples were taken from deep horizons using a specialized bathometer.
Some meteorological and hydrological characteristics observed during field work are presented in Table 1.
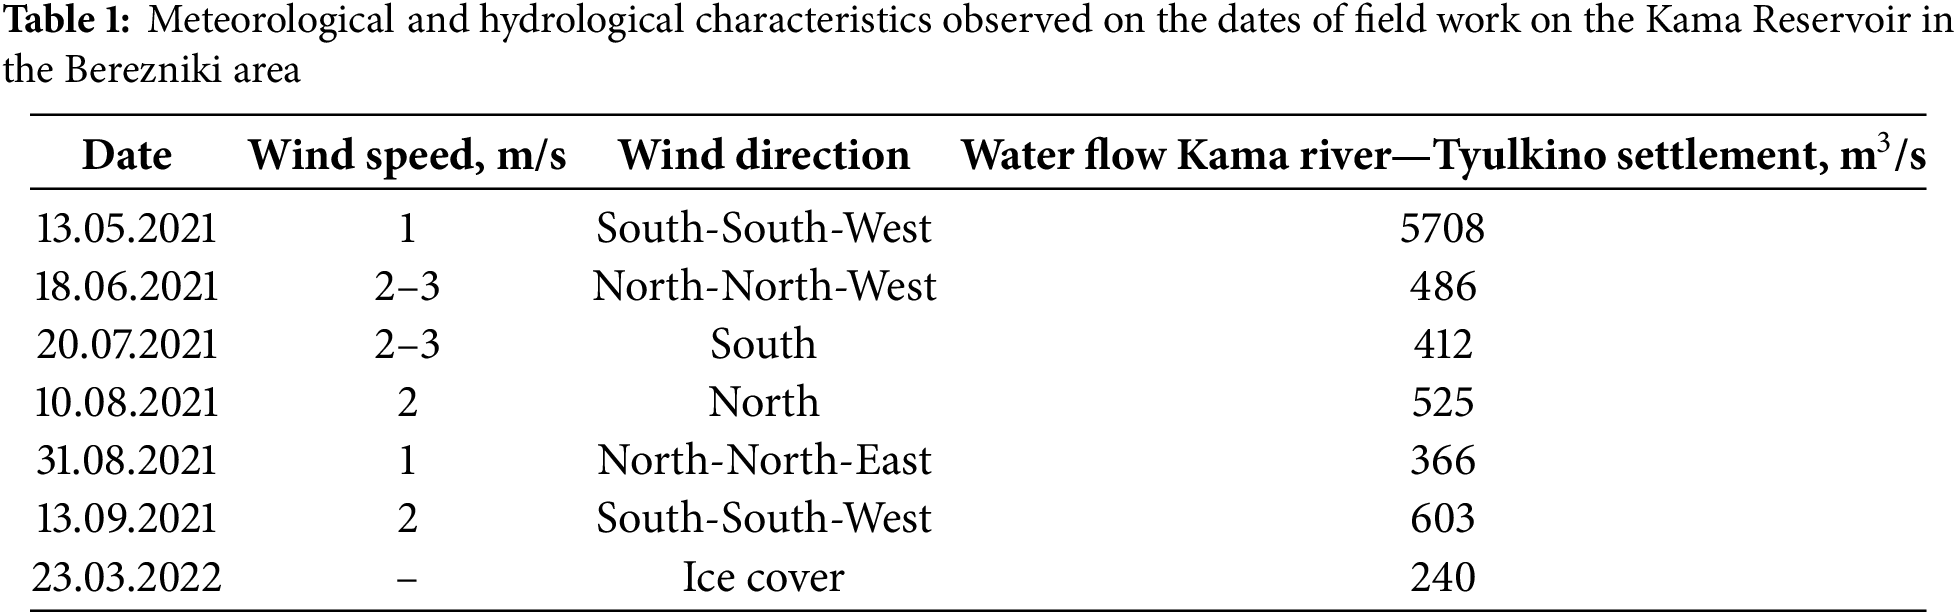
As the measurements have shown, during the passage of the spring flood wave (13.05.21, water flow rate—5708 m3/s), the observed values of specific electrical conductivity were minimal and had a uniform distribution over the reservoir depth. This result is explained by the high share of weakly mineralized surface runoff in the formation of the spring flood, as well as by the significant intensity of vertical mixing of water masses. During the summer-autumn low water period, with significantly lower water flow rates (Q~350–650 m3/s), the situation is different. The natural background vertical shows the homogeneity of water masses in depth (Fig. 2). Significant vertical heterogeneity is recorded on the control vertical adjacent to the main wastewater outlet in Berezniki (Fig. 3).
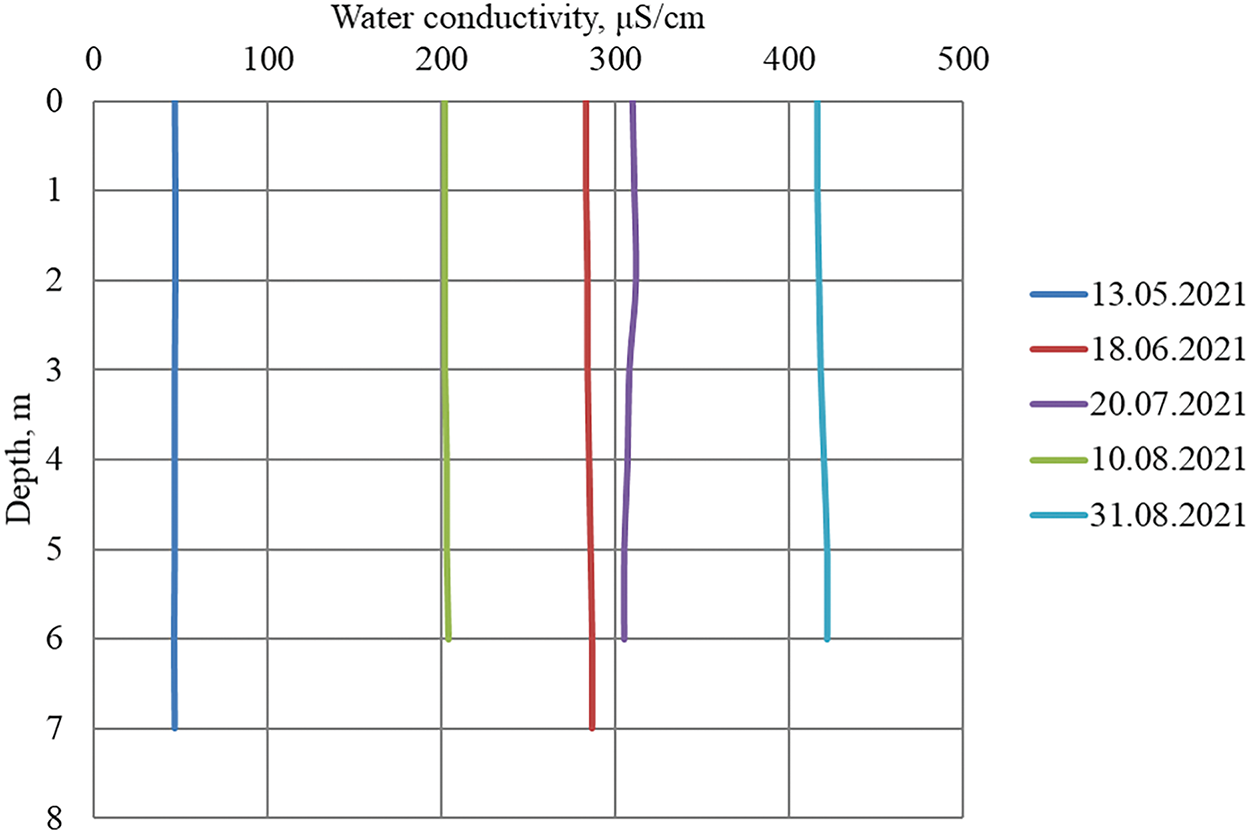
Figure 2: Distribution of water conductivity by depth on the background vertical
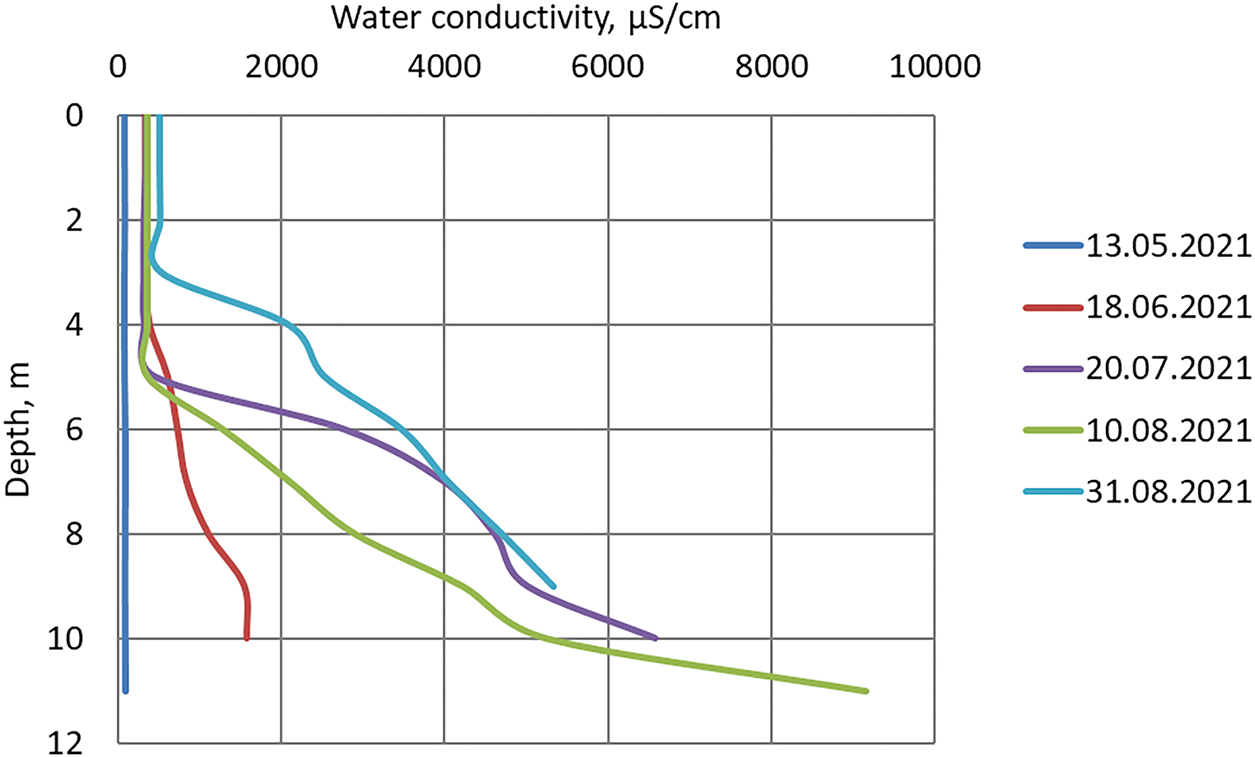
Figure 3: Distribution of specific electrical conductivity of water by depth at the control verticals
At the same time, the presence of stable stratification on verticals located at a considerable distance from this water outlet requires additional special studies. In the work [9], a significant role of diffuse sources in the formation of pollution of water masses of the Kama Reservoir in the Solikamsk-Bereznikovsky industrial hub was shown. Highly mineralized waters, when entering the Kama Reservoir, can create local zones of increased mineralization in the bottom region. A stable density stratification is formed in a water body [9], if the density Froude number is less than the critical value. This number is defined as
A characteristic feature of the section of the Kama Reservoir under consideration is that it is located in the zone of variable backwater from the Kama Hydroelectric Power Station, and accordingly, its hydrodynamic regime is determined not only by the flow rate of the Kama River, but also by the operating mode of the Kama Hydroelectric Power Station.
The nearest hydrometric post, where regular hydrometric observations of water flow are carried out, is located 70 km upstream of the section under consideration—in the village of Tyulkino. Regular measurements of water levels are carried out directly at the Berezniki hydrological post. It should be noted that during the summer low water period from mid-June to early September, water flow varied in a fairly narrow range of 350 ≤ Q ≤ 500 m3/s (Fig. 4).
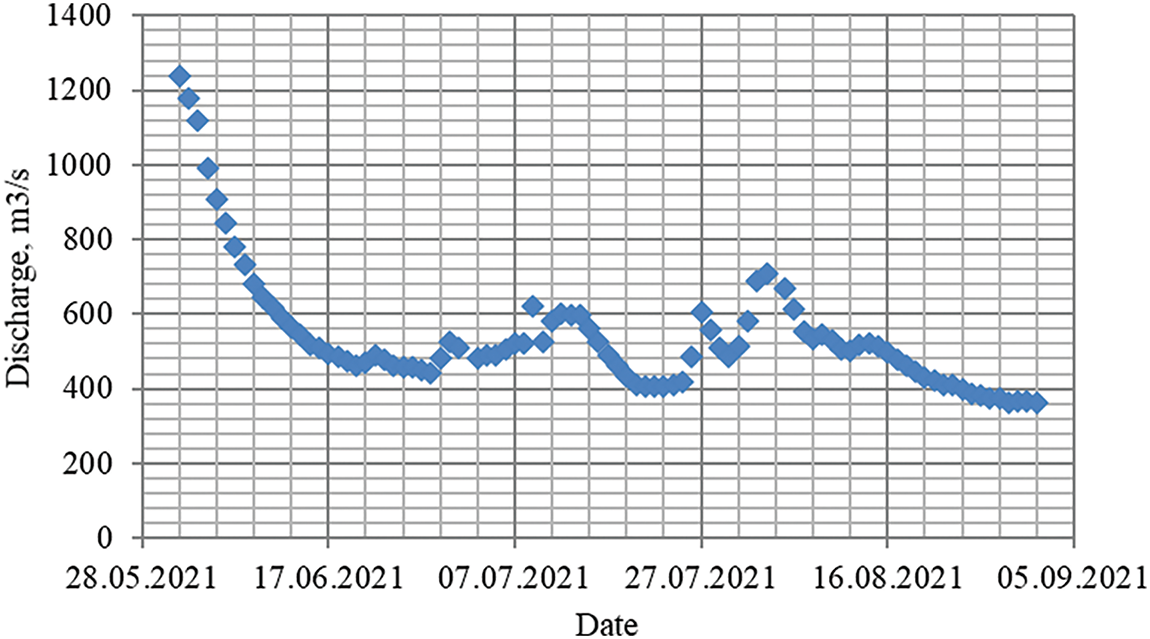
Figure 4: Dynamics of water consumption at the post of the river Kama—the village of Tyulkino
A significant change in the vertical structure of the fields of specific electrical conductivity, and, accordingly, the total mineralization of water, on the verticals located significantly upstream of the large discharge of wastewater in this area is of interest. As a characteristic one can consider a measurement vertical located ~2.3 km upstream of the wastewater outlet, in close proximity to one of the technical water intakes of the industrial unit. As follows from Fig. 5, in certain periods, namely 20.07.21 and 31.08.21, significant stratification of water masses in the area of this vertical was observed. At the same time, on 18.06.21, 10.08.21 and 13.09.21, when water discharges were ~1.5–2 times higher, this vertical inhomogeneity of water masses was not observed (Table 1).
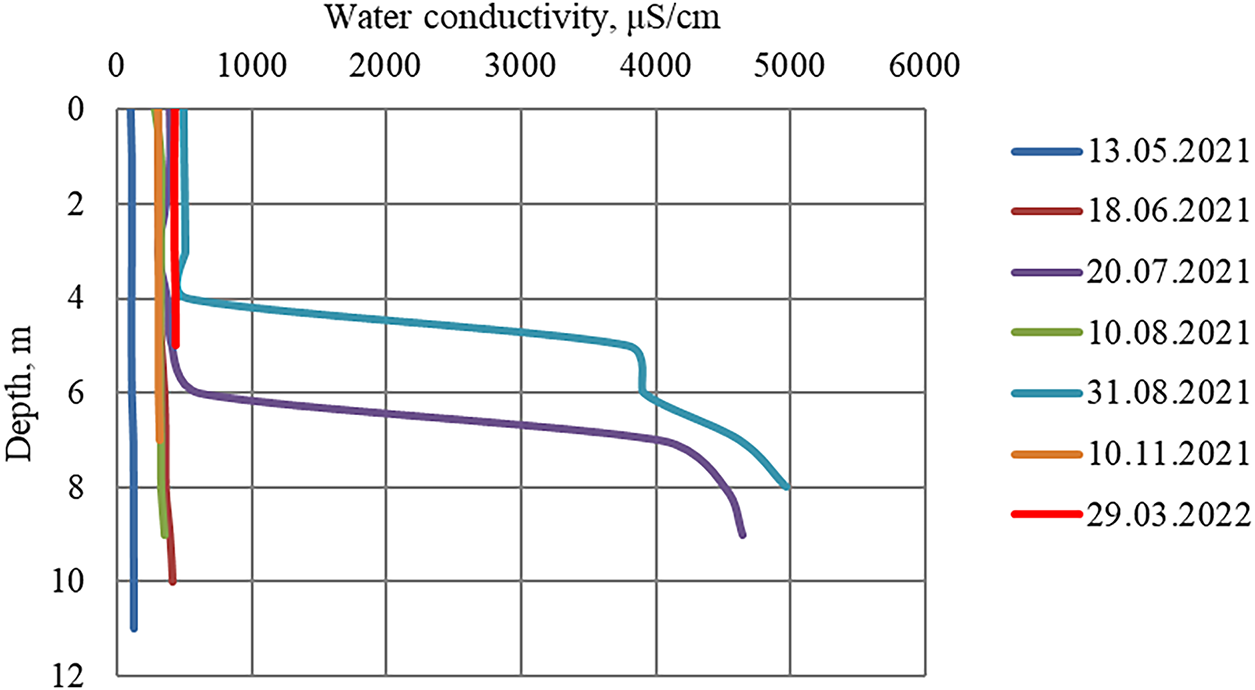
Figure 5: Distribution of specific electrical conductivity of water by depth on vertical line No. 10
A significant transformation of the vertical structure of water masses with the formation of zones of increased mineralization in the bottom region is clearly reflected in the materials of quality control of the water taken at the water intake, carried out with a water sampling frequency of 4 times a day (Fig. 6). Thus, at this water intake, water was taken from the bottom horizon. During periods when vertical stratification of water masses was observed, the chloride content in the water taken increased significantly (Fig. 6).
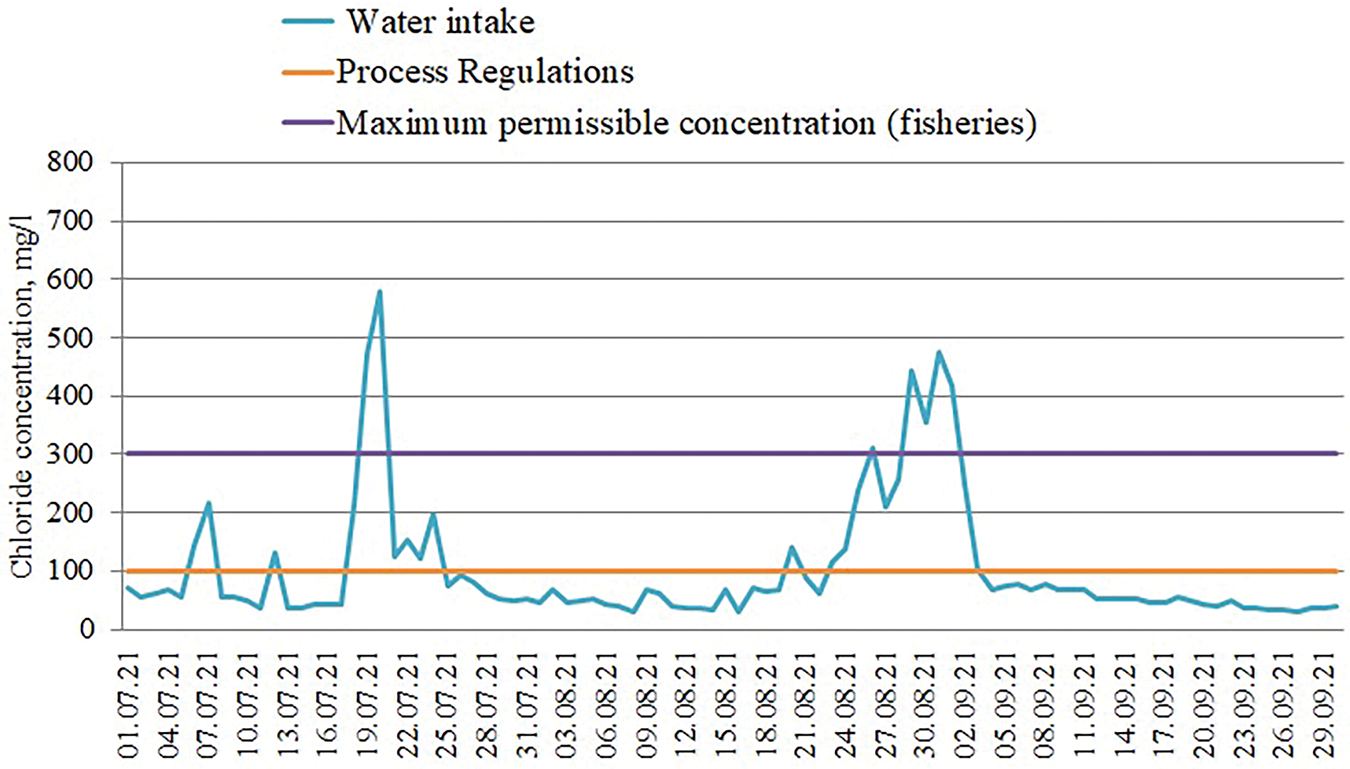
Figure 6: Dynamics of chloride content at the deep water intake in Berezniki
Oscillations in the water level of the Kama River (Kama Reservoir) can reach ~6–7 m per year, so to ensure a stable water supply, many industrial water intakes have deep windows. Under these conditions, the significant vertical heterogeneity of water masses observed in the summer-autumn low water period seriously affects the stability of the entire technical water supply system of Berezniki.
In winter, at significantly lower flow rates and water levels, similar work was performed. Additionally, flow velocity measurements were performed. Measurements were made with the Midas ECM multivariable sensor (Valeport, manufactured by the UK). The studies showed that in the winter period on the considered section of the Kama River, there is active vertical mixing of water masses, respectively, there is no formation of water masses with increased density, which poses the main threat to the stability of technical water supply (Fig. 7).
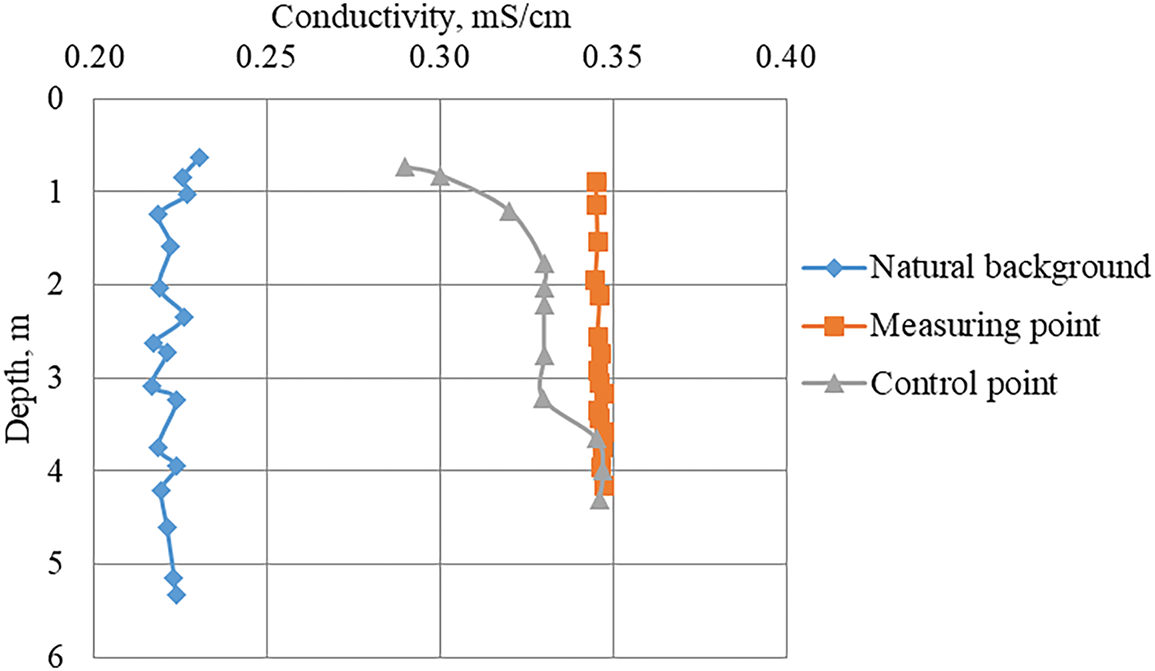
Figure 7: Distribution of specific electrical conductivity by depth on control verticals (March 2022)
Water flow rate in the Kama River in the Berezniki area during the research was about 250 m3/s, which is significantly less than in the warm period. The distribution of current velocities by depth during field work is shown in Fig. 8 (background, control, measuring point).
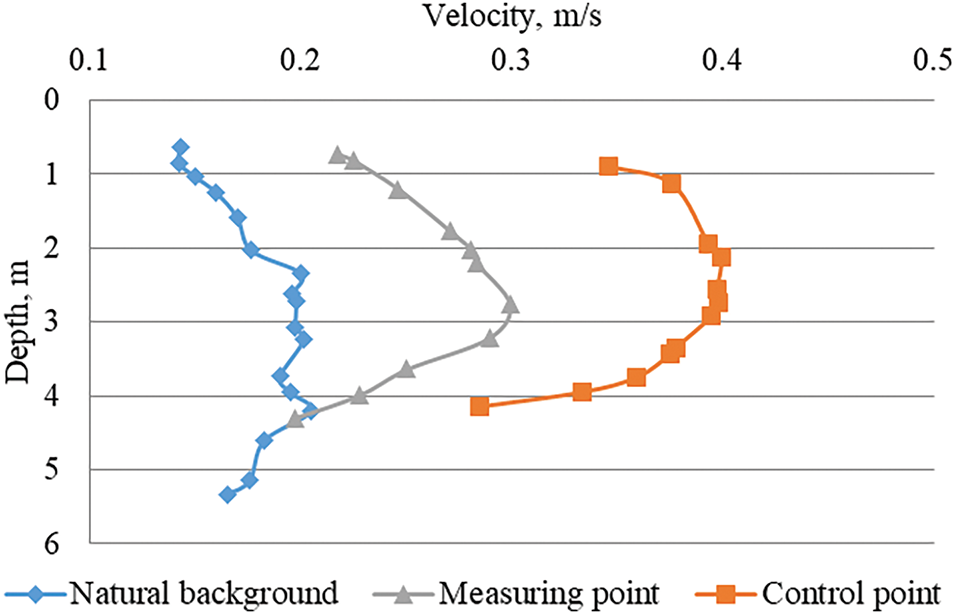
Figure 8: Velocity distribution by flow depth on control verticals
The results of flow velocity measurements presented in Fig. 6 are typical for the winter period: the maximum velocities are not on the surface due to the continuous ice cover, which creates additional resistance in the near-surface layer. The increase in flow rates from the background vertical to the control vertical is associated with a change in the morphometric parameters of the watercourse: the area of the living section in the area of this vertical decreases. In the conditions under consideration, significant vertical mixing of water masses is formed. No threat to the stability of technical water supply is observed.
3 Numerical Model. Geometry and Mesh
In the initial section of the Kama River (Kama Reservoir), it was assumed that the water mineralization is uniformly distributed over the depth. Numerical experiments in a three-dimensional formulation were conducted for several variants of boundary conditions. In the variant described in [9], the pollution source was located in the bottom zone along the left bank at the storage site of sediments of one of the industrial enterprises in the region, the length of the source was 100 m. In this paper, a possible situation is considered when the pollution source is also located in the bottom zone along the left bank, but the length of the source is 200 m. The length of the entire computational domain is 1 km. The brine removal rate is q = 161 kg/s, the water mineralization throughout the bay was assumed to be the same and the maximum technically possible—100 g/L.
Three-dimensional numerical modeling included consideration of the density jump position depending on the flow velocity of the mainstream. In each calculation experiment, a constant discharge of wastewater from a gap located at the bottom along the river bed was investigated, the configuration shown in Fig. 9. The calculation area was a rectangular parallelepiped with dimensions of 200 m in width, 1000 m in length and 12 m in depth. The depth corresponds to the average characteristics of the section containing the supposed section of filtration discharges. The studied area is located near the “measuring point” shown in Fig. 1. This section contains a source in the form of a rectangular gap with a height of h = 0.5 m and a length of l = 200 m, located at the bottom along the left bank of the Kama River. Brine with a mass concentration of flows out of the gap at a constant speed. The intensity of filtration discharge was estimated based on the total salt input, calculated on the total mineralization, which for the section of the Kama River under consideration was q~30 kg/sec. The velocity of the main flow at the first stage was assumed to be constant and equal to V = 0.1, 0.3, 0.5, 1 m/s. Each calculation was carried out until a steady concentration field was reached, and the effect of changing the conditions of the flow velocity was investigated. The flow is turbulent and is characterized by Reynolds numbers of the order of
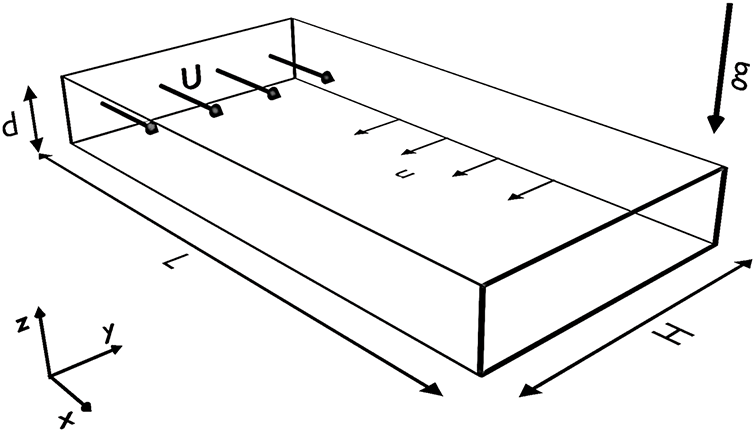
Figure 9: Geometry of the computational domain containing a water outlet in the form of a slit located near the bottom
The computational domain was divided into cells with a refinement near the outlet (Fig. 10). Small element sizes at the lower boundary of surface waters (river bottom) were used to resolve the impurity source, which has a small vertical size. The impurity source was divided vertically into 6 nodes. The number of nodes horizontally was taken to be 164 × 64, vertically—45, the total number of nodes was 472320. The minimum size of the spatial step was 0.001 m, the maximum—2 m. The minimum area of the element of the applied grid is 1.0 × 10⁻⁴ m2 and is located near the discharge source, and the maximum area is 0.1 m2 and is located within the water surface far from the gap.
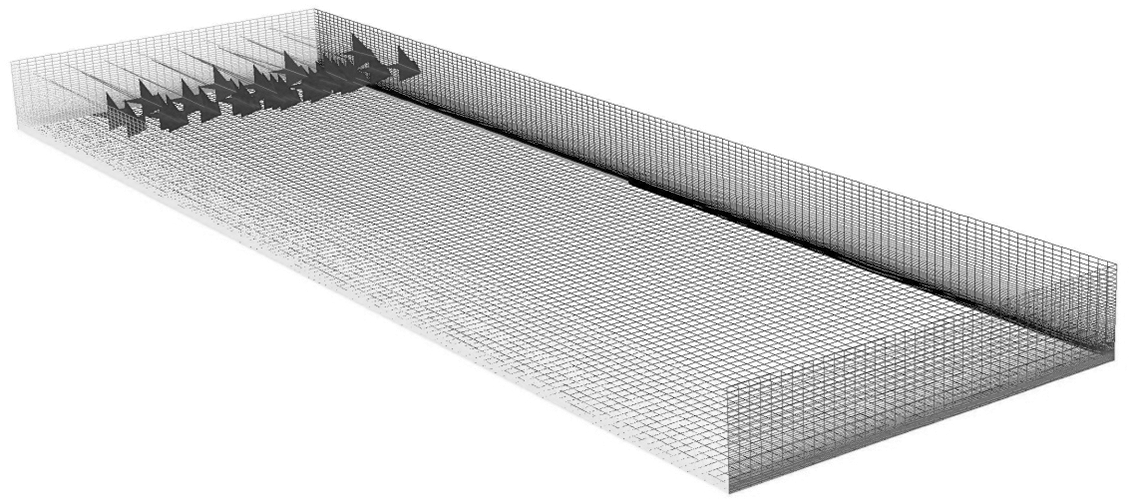
Figure 10: Calculation grid of the study area. Velocity vectors showing the direction of water movement are constructed at the input of the calculation area. On the right is the bank, on the left is the internal boundary of the river, located parallel to the main flow, at the entrance the velocity vectors are shown, the boundary opposite the entrance is the exit
The calculations were performed within the framework of three-dimensional non-stationary isothermal approach. A
The mass and momentum balance equations are
In Eqs. (1) and (2), the following notations are used:
The equations for finding turbulent kinetic energy and turbulent dissipation rate are written as
In Eqs. (3) and (4), the following notations are used:
The equation for turbulent kinetic energy includes a term
The effectiveness of the turbulence model was verified by test calculations using a higher-order model, the Reynolds model. This model solves seven additional equations related to Reynolds stresses. The study found that for different grid configurations, the difference in the obtained data does not exceed 5% for the integral values of the velocity components in different sections.
The equation for solute transport is written as
Eq. (5) contains the following notations:
where
The boundary conditions for Eqs. (1)–(6) are given below for different boundaries of the system.
We set the no-slip condition and the zero mass flow condition at the rigid boundaries (river bottom and banks):
At the entrance to the calculation domain, the velocity of the main flow was set (the velocity vector of the ambient flow is perpendicular to the entrance boundary
The upper boundary of the region corresponding to the free surface of the liquid was assumed to be non-deformable; the conditions of absence of the normal velocity component, tangential stresses and impurity flux were considered to be satisfied on it.
The conditions at the output of the computational domain consisted in fulfilling the mass balance condition:
The parameters used in Eqs. (1)–(6)
For the river bed roughness coefficient, we used a value of 0.035, which corresponds to a homogeneous surface of sand grains and a roughness height of 0.001 m. A second-order scheme was used for the spatial discretization of the equations. The temporal evolution was modelled using an explicit second-order approximation scheme.
5 Results of Numerical Simulation
The density stratification of water is caused by a combination of pollutant sources and hydrodynamic factors that affect the intensity of the vertical mixing of water masses. When highly mineralized waters enter the Kama Reservoir, depending on the hydrodynamics of the flow, they can either form local zones of increased mineralization in the bottom layers or be uniformly distributed over the entire cross-section of the flow. During the warm period, the section of the Kama River near the city of Berezniki is in the backwater zone from the Kama Hydroelectric Power Station, with a normal backwater level of 108.5 m according to the Baltic height reference system. As a result, the hydraulic characteristics of the flow—water level and flow velocity—primarily depend on the operating mode of the hydroelectric complex. When the water discharge through the Kama Hydroelectric Power Station dam is relatively small, as shown by computational experiments and field observation data, the flow velocity can decrease significantly, which creates conditions for vertical stratification of water masses. In turn, this stratification plays an important role in disrupting the stability of technical water supply from deep water intakes during the warm period. The example given clearly demonstrates that in areas of active techno genesis, traditional approaches to regulating technogenic impacts often turn out to be incorrect. As in the example considered, it is necessary to take into account not only the water flow rate, but also the flow velocity, the depth of the watercourse, i.e., factors affecting the intensity of vertical mixing of water masses.
The integral parameter that determines the stability of the boundary between water masses is the Richardson number
In general, water density is determined by several factors, including mineralization, temperature, and suspended solids content. However, in the context of water quality formation in the Kama River near Berezniki, where the suspended solids content in the flow is low, and the water temperature is fairly uniform across the depth, the main factor influencing density is water mineralization.
In the framework of the numerical modeling, a stable inflow of brine with a concentration of 100 g/L from a linear bottom source was considered for the case when the river velocity
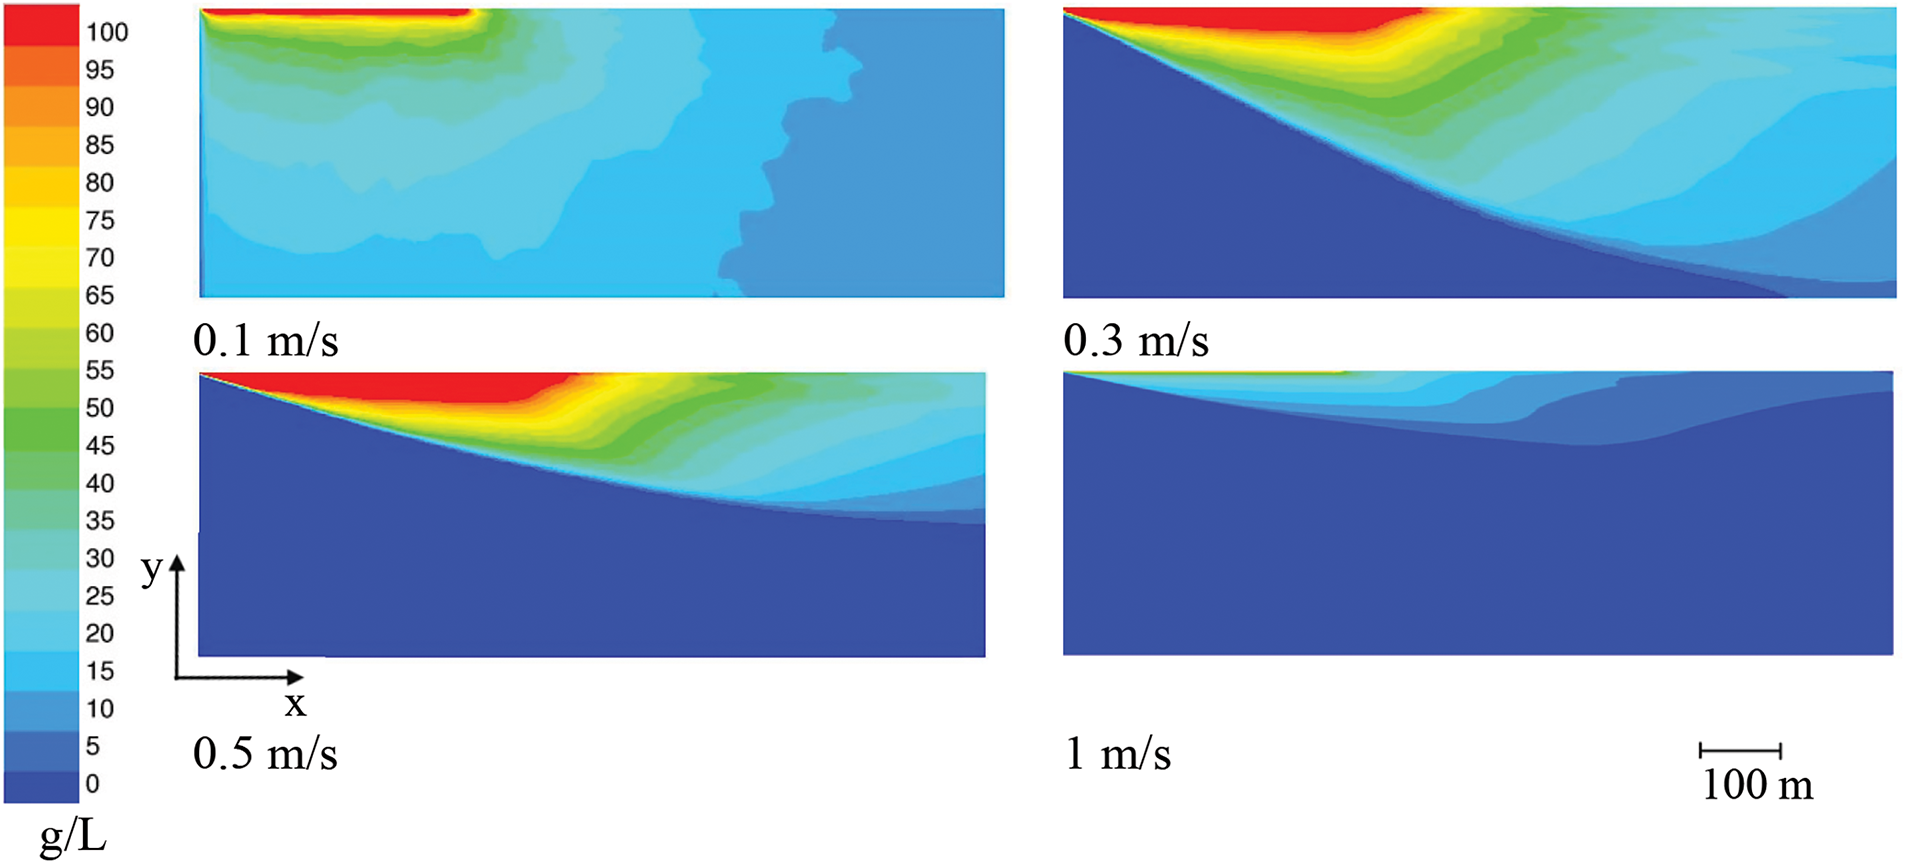
Figure 11: Distribution of impurity concentration (C) by depth (H) near the shore at a distance of 1000 m from the impurity source for different main flow velocity: 0.1 m/s, 0.3 m/s, 0.5 m/s, 1.0 m/s. The river flow is directed along the z-axis
Fig. 12 shows the concentration distributions on the control vertical located near the shore, at a distance of 800 m from the pollutant source. The concentration distributions demonstrate significant vertical heterogeneity and the presence of a pronounced concentration jump at low main flow velocities. For the lowest flow velocity of 0.1 m/s, the jump layer is observed throughout the computational domain at the same depth (5 m from the river bottom). The red line shows the vertical distribution of the pollutant concentration for the case of the main flow velocity of 0.1 m/s. The distribution of the pollutant concentration with distance from the brine source does not affect either the level or the position of the jump layer; however, the maximum value of the pollutant concentration, which is observed on the river bottom, changes. The dynamics of the propagation of the high mineralization zone is such that after a distance of 150 m from the entrance to the study area, the distribution of the pollutant concentration by depth remains the same. After finding the constant in time field of impurity concentration and the steady-state flow velocity in the region under consideration, a computational experiment was conducted to study the influence of the main flow velocity on the impurity distribution and the behavior of the salt concentration jump layer. The steady-state solution was obtained in 41,760 s (11.6 h) of the calculated time. Then the velocity at the inlet increased.
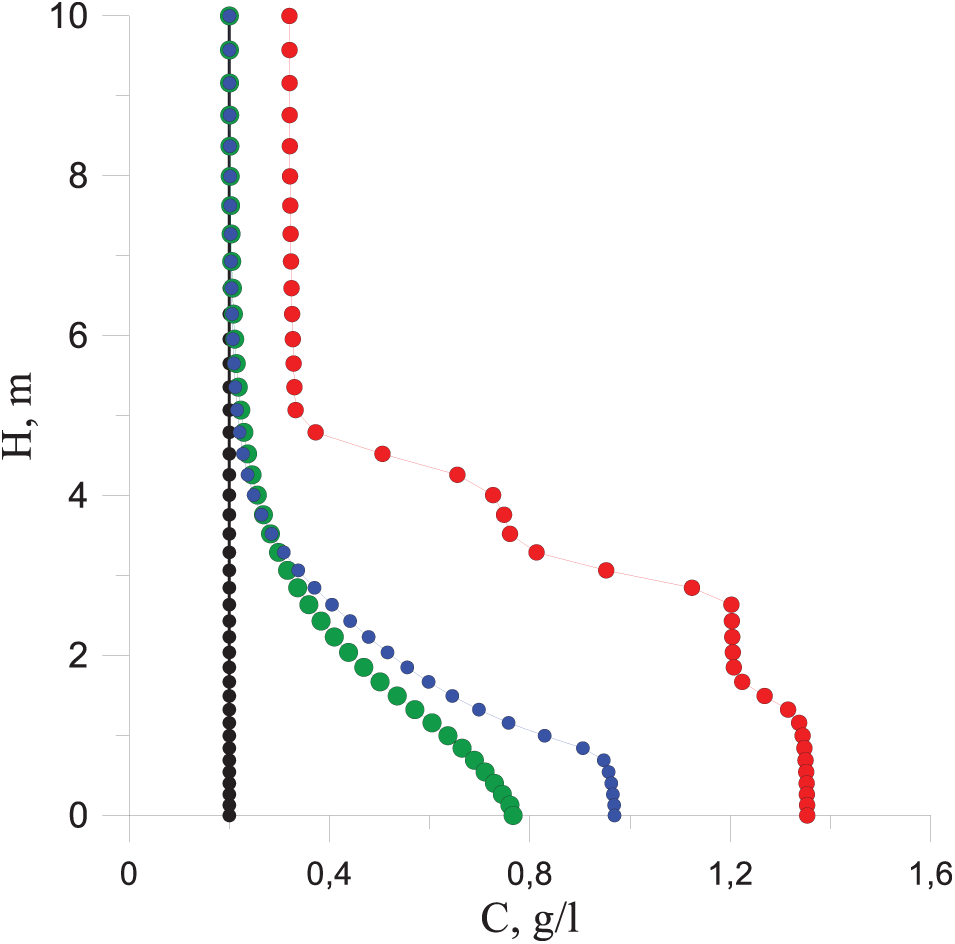
Figure 12: Distribution of impurity concentration (C) by depth (H) near the shore at a distance of 1000 m from the impurity source for different main flow velocity, red line—0.1 m/s, blue line—0.3 m/s, green line—0.5 m/s, black line—1.0 m/s
With an increase in the flow velocity to 0.3 m/s, the change in the impurity concentration along the vertical in Fig. 11 is shown by the blue line. It is seen that no jump in concentration is observed, the concentration changes smoothly near the bottom, undergoing a greater growth gradient at a distance of 1 m from the bottom. When the flow velocity increases further, the impurity concentration changes almost linearly, starting from a depth of 5 m, at such a depth for a velocity of 0.1 m/s a jump in the impurity concentration was observed. With an increase in velocity up to 1 m/s, the concentration on the vertical in question becomes uniform.
The central theme of the article is the interplay between natural and technogenic factors in large water bodies, which gives rise to the conditions for the relatively rapid formation and destruction of vertical stratification of water masses. Such phenomena have the potential to exert a substantial influence on the stability of the functioning of water supply systems. A peculiarity of this study is that similar works on the subject of vertical stratification of water masses are devoted to the study of regularly recurring phenomena, usually of a seasonal nature [11,13,14], while the subject of this work is a temporary, periodic phenomenon. This phenomenon is possible due to significant short-term variations in the Froude Density numbers, which are realised in the transient region of reservoirs located in areas of active techno-genesis.
The phenomenon of sufficiently rapid formation and destruction of vertical stratification of water masses considered in this work has not yet been described in the scientific literature. In this respect, a fairly detailed in-depth study, including both detailed field observations and computational experiments in 3D staging throughout its observation zone, is required. These studies should primarily aim at clarifying its mechanisms, and the influence of a complex of natural and technogenic factors on it. This problem is of considerable theoretical interest and practical importance.
The performed complex of studies showed that the hydrological, hydrochemical regime of the Kama River (Kama Reservoir) in the area of the city of Berezniki in warm and winter regimes differs significantly, which fundamentally affects the stability of the technical water intakes since the quality of the withdrawn water is determined not only by the average depth content of limiting ingredients but also by the vertical stratification of water masses. In the warm period, at water levels close to the NPG, and low current velocities v < 0.1 m/s, with the observed integral intensity of filtration discharges q~30 kg/s, the density Froude number
Acknowledgement: None.
Funding Statement: The study was carried out with financial support from the Government of the Perm Territory within the Framework of Scientific Project No. S-26/828 and the Ministry of Science and High Education of Russia (Theme No. 121031700169-1).
Author Contributions: The authors confirm contribution to the paper as follows: study conception and design: Tatyana Lyubimova, Anatoly Lepikhin; performing calculations: Yanina Parshakova; performing measurements: Andrey Bogomolov; analysis and interpretation of results: Tatyana Lyubimova, Anatoly Lepikhin, Andrey Bogomolov, Alibek Issakhov; draft manuscript preparation: Tatyana Lyubimova, Yanina Parshakova, Andrey Bogomolov. All authors reviewed the results and approved the final version of the manuscript.
Availability of Data and Materials: The data presented in this study are available on request from the corresponding author.
Ethics Approval: Not applicable.
Conflicts of Interest: The authors declare no conflicts of interest to report regarding the present study.
Nomenclature
| Density of the liquid | |
| Velocity vector | |
| c | Concentration |
| p | pressure |
| Cartesian coordinates | |
| Dynamic viscosity of the liquid | |
| Kronecker symbol | |
| Fr | Density Froude number |
| Permeability of porous media | |
| Nabla operator | |
| Vector of the diffusion flow of the impurity | |
| Molecular diffusion coefficient | |
| Effective coefficient of turbulent diffusion |
References
1. Zhai X, Xia J, Zhang Y. Integrated approach of hydrological and water quality dynamic simulation for anthropogenic disturbance assessment in the Huai River Basin, China. Sci Total Environ. 2017;598(9):749–64. doi:10.1016/j.scitotenv.2017.04.092. [Google Scholar] [PubMed] [CrossRef]
2. Wu G, Zhang C. Analysis of water quality prediction in the Yangtze River delta under the river chief system. Sustainability. 2024;16(13):5578. doi:10.3390/su16135578. [Google Scholar] [CrossRef]
3. Calderon MR, Almeida CA, Gonzalez P, Jofre MB. Influence of water quality and habitat conditions on amphibian community metrics in rivers affected by urban activity. Urban Ecosyst. 2019;22(4):743–55. doi:10.1007/s11252-019-00862-w. [Google Scholar] [CrossRef]
4. Macdonald DD, Ingersoll CG, Berger TA. Development and evaluation of consensus-based sediment quality guidelines for freshwater systems. Arch Environ Contam Toxicol. 2000;39(1):20–31. doi:10.1007/s002440010075. [Google Scholar] [PubMed] [CrossRef]
5. Athauda AMN, Abinaiyan I, Liyanage GY, Bandara KRV, Manage PM. Spatio-temporal variation of water quality in the Yan Oya River basin, Sri Lanka. Water Air Soil Pollut. 2023;234(3):207. doi:10.1007/s11270-023-06151-9. [Google Scholar] [CrossRef]
6. Aghel B, Rezaei A, Mohadesi M. Modeling and prediction of water quality parameters using a hybrid particle swarm optimization-neural fuzzy approach. Int J Environ Sci Technol. 2019;16(8):4823–32. doi:10.1007/s13762-018-1896-3. [Google Scholar] [CrossRef]
7. Ushakova E, Perevoshchikova A, Menshikova E, Khayrulina E, Perevoshchikov R, Belkin P. Environmental aspects of potash mining: a case study of the Verkhnekamskoe potash deposit. Mining. 2023;3(2):176–204. doi:10.3390/mining3020011. [Google Scholar] [CrossRef]
8. Glushankova I, Rudakova L, Khayrulina E, Bogush A, Perevoshchikova A. Purification of wastewater generated during the enrichment of potash ores. Envier Earth Sci. 2023;82(24):608. doi:10.1007/s12665-023-11276-5. [Google Scholar] [CrossRef]
9. Lepikhin AP, Voznyak AA, Lyubimova TP, Parshakova YN, Lyakhin YS, Bogomolov SV. Studying the formation features and the extent of diffuse pollution formed by large industrial complexes: case study of the Solikamsk—Berezniki industrial hub. Water Resour. 2020;47(5):744–50. doi:10.1134/S0097807820050127. [Google Scholar] [CrossRef]
10. Mesman JP, Stelzer JAA, Dakos V, Goyette S, Jones ID, Kasparian J, et al. The role of internal feedbacks in shifting deep lake mixing regimes under a warming climate. Freshw Biol. 2021;66(6):1021–35. doi:10.1111/fwb.13704. [Google Scholar] [CrossRef]
11. Sharip Z. Stratification and water quality variations in three large tropical reservoirs. Intern J of Ecol and Environ Scien. 2017;43(3):175–84. [Google Scholar]
12. Chikita K, Yasuhiro O, Hideo O, Yoshitaka S. Geothermal linkage between a hydrothermal pond and a deep lake: Kuttara Volcano. Japan Hydrology. 2019;6(1):4. doi:10.3390/hydrology6010004. [Google Scholar] [CrossRef]
13. Nowlin WH, Davies JM, Nordin RN, Mazumder A. Effects of water level fluctuation and short-term climate variation on thermal and stratification regimes of a British Columbia reservoir and lake. Lake Reserv Manage. 2004;20(2):91–109. doi:10.1080/07438140409354354. [Google Scholar] [CrossRef]
14. Zhao W, Jia Y, Fan J, Li R, Xi N, Li J, et al. Thermal structure variations and influence factors in a subtropical reservoir, China: explanations from multiple research methods. Hydr Scien J. 2024;69(12):1616–30. doi:10.1080/02626667.2024.2383884. [Google Scholar] [CrossRef]
15. Abirhire O, Hunter K, Davies JM, Guo X, de Boer D, Hudson J. An examination of the long-term relationship between hydrologic variables and summer algal biomass in a large Prairie reservoir. Canadian Water Res J. 2019;44(1):79–89. doi:10.1080/07011784.2018.1531064. [Google Scholar] [CrossRef]
16. Fantin-Cruz I, Pedrollo O, Bonecker CC, Zeilhofer P. Key factors in vertical mixing processes in a reservoir bordering the Pantanal floodplain. Brazil Hydro Sci J. 2015;60(9):1508–19. doi:10.1080/02626667.2014.933224. [Google Scholar] [CrossRef]
17. Issakhov A. Mathematical modeling of the discharged heat water effect on the aquatic environment from thermal power plant under various operational capacities. Appl Math Model. 2016;40(2):1082–96. doi:10.1016/j.apm.2015.06.024. [Google Scholar] [CrossRef]
18. Lepikhin AP, Bogomolov AV, Lyakhin Yu S, Luchnikov AI. Sustainable water use in zones of active technogenesis: a casestudy of the upper Kama potassium-magnesium salt deposit. Mining J. 2023;11(11):97–103. doi:10.17580/gzh.2023.11.17. [Google Scholar] [CrossRef]
19. Molenda T. Impact of a saline mine water discharge on the development of a meromictic pond, the Rontok Wielki Reservoir. Poland Mine Water Environ. 2018;37(4):807–14. doi:10.1007/s10230-018-0544-y. [Google Scholar] [CrossRef]
20. Gualtieri C, Ianniruberto M, Filizola N. On the mixing of rivers with a difference in density: the case of the Negro/Solimões confluence, Brazil. J Hydrology. 2019;578(4):124029. doi:10.1016/j.jhydrol.2019.124029. [Google Scholar] [CrossRef]
21. Lyubimova TP, Lepikhin AP, Parshakova Ya N, Bogomolov AV, Lyakhin Yu S. Influence of non-stationary river discharge on the quality of water withdrawal in the presence of density stratification. Comp Contin Mech. 2022;15(2):133–44. doi:10.7242/1999-6691/2022.15.2.10. [Google Scholar] [CrossRef]
22. Launder BE, Spalding DB. Lectures in mathematical models of turbulence. New York: Academic Press; 1979. p. 176. [Google Scholar]
Cite This Article
 Copyright © 2025 The Author(s). Published by Tech Science Press.
This work is licensed under a Creative Commons Attribution 4.0 International License , which permits unrestricted use, distribution, and reproduction in any medium, provided the original work is properly cited.
 Downloads
 Citation Tools