
 Submit a Paper
 Propose a Special lssue
 Open Access
ARTICLE

Hole Cleaning and Critical Transport Rate in Ultra-Deep, Oversized Wellbores
1 China National Petroleum Corporation, Chuanqing Drilling Engineering Company Limited, Chengdu, 610051, China
2 State Key Laboratory of Oil and Gas Reservoir Geology and Exploitation, Southwest Petroleum University, Chengdu, 610500, China
* Corresponding Author: Shiqian Xu. Email:
(This article belongs to the Special Issue: Fluid and Thermal Dynamics in the Development of Unconventional Resources II)
Fluid Dynamics & Materials Processing 2025, 21(4), 799-817. https://doi.org/10.32604/fdmp.2025.062862
Received 29 December 2024; Accepted 14 March 2025; Issue published 06 May 2025
 View Full Text
 Download PDF
Abstract
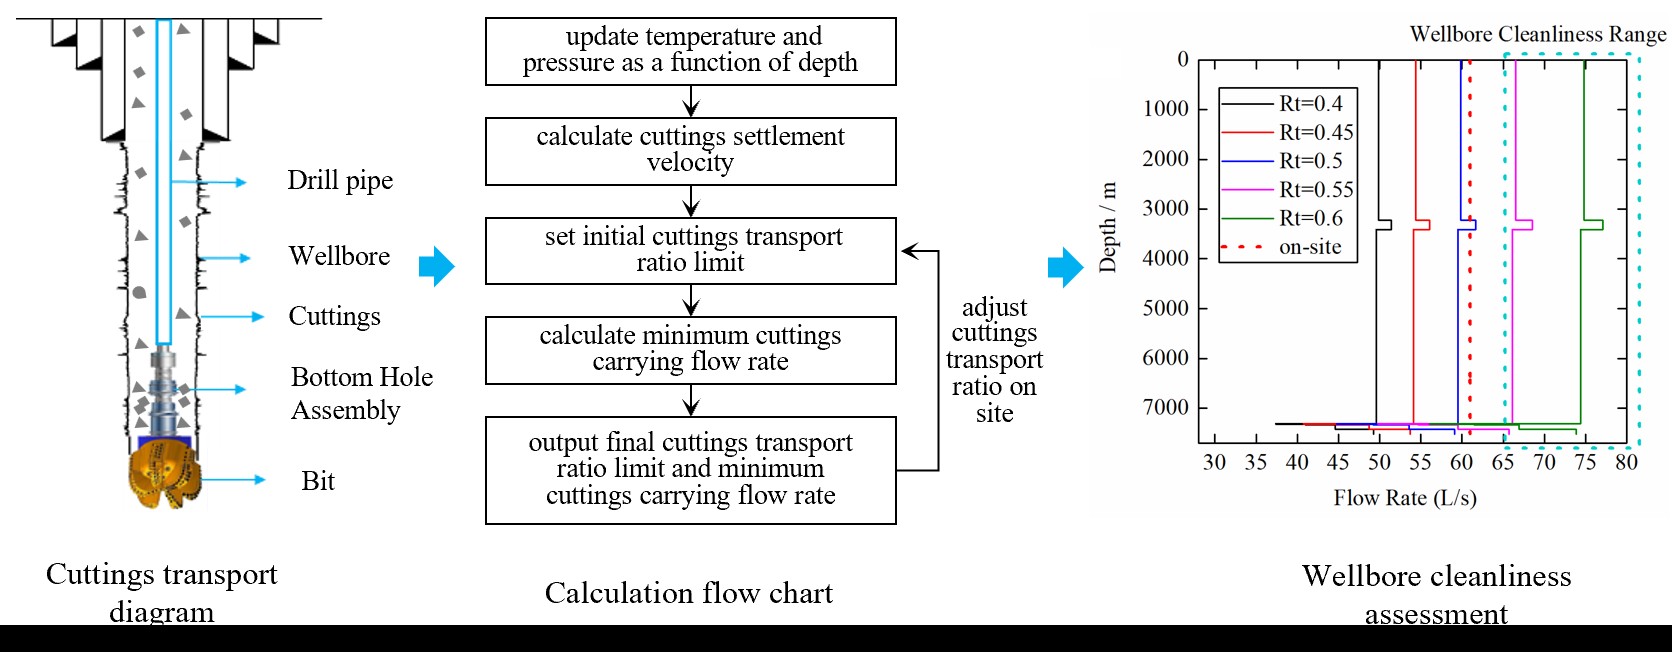
In ultra-deep and large well sections, high collapse stresses and diminished annular return velocity present significant challenges to wellbore cleaning. With increasing depth, rising temperature and pressure constrain the regulation of displacement and drilling fluid rheology, impairing the fluid’s capacity to transport cuttings effectively. A precise understanding of cuttings settlement behavior and terminal velocity is therefore essential for optimizing their removal. This study accounts for variations in wellbore temperature and pressure, incorporates non-spherical cuttings and wellbore diameter parameters, and develops accordingly a simplified model to predict terminal settlement velocity. The cuttings carrying ratio is introduced as a metric for evaluating wellbore cleanliness. Findings reveal that temperature and pressure fluctuations can alter terminal velocity by up to 3.4%. Cuttings shape plays a crucial role, with block-shaped cuttings requiring higher annular return velocity than flake-shaped ones at the same carrying ratio. As wellbore size increases, the minimum required carrying flow rate rises nonlinearly, though the rate of increase gradually declines. For a Φ444.5 mm wellbore, a carrying ratio of at least 0.6 is recommended. Terminal velocity decreases with increasing consistency coefficient, particularly in high-viscosity regimes. The proposed carrying ratio offers a more accurate and practical assessment of wellbore cleanliness.Graphic Abstract
Keywords
The Sichuan Basin in China is renowned for its abundant deep and ultra-deep gas resources, particularly at depths that exceed 6000 m. In recent years, the design of wellbore structures for deep and ultra-deep wells has exhibited two significant changes. The first is an increase in the depth of the large well section, while the second is an increase in the size of the wellbore. For example, the drilling depth of a Φ444.5 mm borehole has increased from an initial 30 m to approximately 3400 m. There are several challenges in ultra-deep wellbore cleaning. First, the stress of wellbore collapse is relatively high [1]. Second, annular velocity drops sharply [2,3]. Third, the adjustment range for the flow rate and rheological properties of the drilling fluid is limited by pump conditions [4]. These concerns severely restrict the ability of the drilling fluid to return cuttings. Meanwhile, when considering the safety of drilling tools in ultra-deep wells, extremely high requirements for maintaining a small deviation in the upper sections must be met. If necessary, the Rate of Penetration (ROP) is decreased to control wellbore deviation. The difficulty of wellbore cleaning increases under complex well conditions, such as low ROP in an oversized wellbore and wall sloughing.
In the small well deviation section, cuttings tend to settle on the lower wellbore wall and move along the wellbore axis. The settlement of cuttings plays a dominant role when the inclination angle is small. Previous researchers have mostly established settlement resistance coefficient models through experimental methods for the settlement of particles in Newtonian fluids [5−7]. The majority of drilling and fracturing fluids are classified as non-Newtonian fluids [8]. Shah et al. [9] developed an analytical approach for determining the settling velocity of particles in power-law non-Newtonian fluids by using the drag coefficient, which incorporates the influence of the flow behavior index. Sun et al. [10] experimentally measured the correlation between the viscous drag and pressure difference drag experienced by particles settling in a power-law fluid, the flow behavior index, consistency coefficient, and particle Reynolds number. Ezekiel et al. [11] experimentally measured the sedimentation rates of particles with different sizes and shapes in Newtonian and non-Newtonian fluids. They found that the sedimentation rate of a given particle decreased as the fluid became more viscous. Mahmoud et al. [12] investigated the effects of anionic properties and fibers on the cuttings transport capacity of polymer suspensions. Okesanya et al. [13] formulated explicit mathematical models for drag coefficient and particle settling velocity in viscoelastic and visco-inelastic fluids. However, cuttings are typically not spherical particles, but instead, exhibit irregular morphologies. Xu et al. [14] established a drag coefficient prediction model and an explicit prediction model for terminal settling velocity by introducing the projected area in the settlement direction and particle sphericity. Zastawny et al. [15] formulated the drag, lift, and torque coefficients for four nonspherical particle shapes over a wide spectrum of flow and rotational Reynolds numbers. Sun et al. [16] introduced a 2D shape descriptor parameter to establish a model for predicting the drag coefficient of irregularly shaped drill cuttings in Herschel–Bulkley fluids. Most researchers have remained confined to theoretical and experimental stages, with limited studies considering the effects of temperature and pressure variations under actual wellbore conditions on the settlement of irregular rock cuttings. Applications for assessing cleaning efficiency in ultra-deep and large-diameter wellbores are relatively scarce. Currently, available mature commercial software, such as Wellplan, exhibits a relatively large error in calculating cuttings concentration to determine cleanliness under complex well conditions [17,18]. Furthermore, modifications to evaluation parameters based on practical engineering applications are noticeably absent.
Considering the effects of temperature and pressure on drilling fluid density, and the influence of nonspherical cuttings on terminal settling velocity in power-law fluids, we established a predictive model for the terminal settling velocity of irregular cuttings in large-diameter vertical wellbore sections. Meanwhile, we proposed an evaluation index for wellbore cleanliness based on cuttings carry ratio. The current study analyzes the effects of temperature, pressure, particle shape, rheological parameters, and displacement volume on terminal settling velocity and cuttings transport capacity. Minimum cuttings transport volumes and optimal rheological parameters for different wellbore sections are determined, offering suggestions for the regulation of engineering measures (Fig. 1).
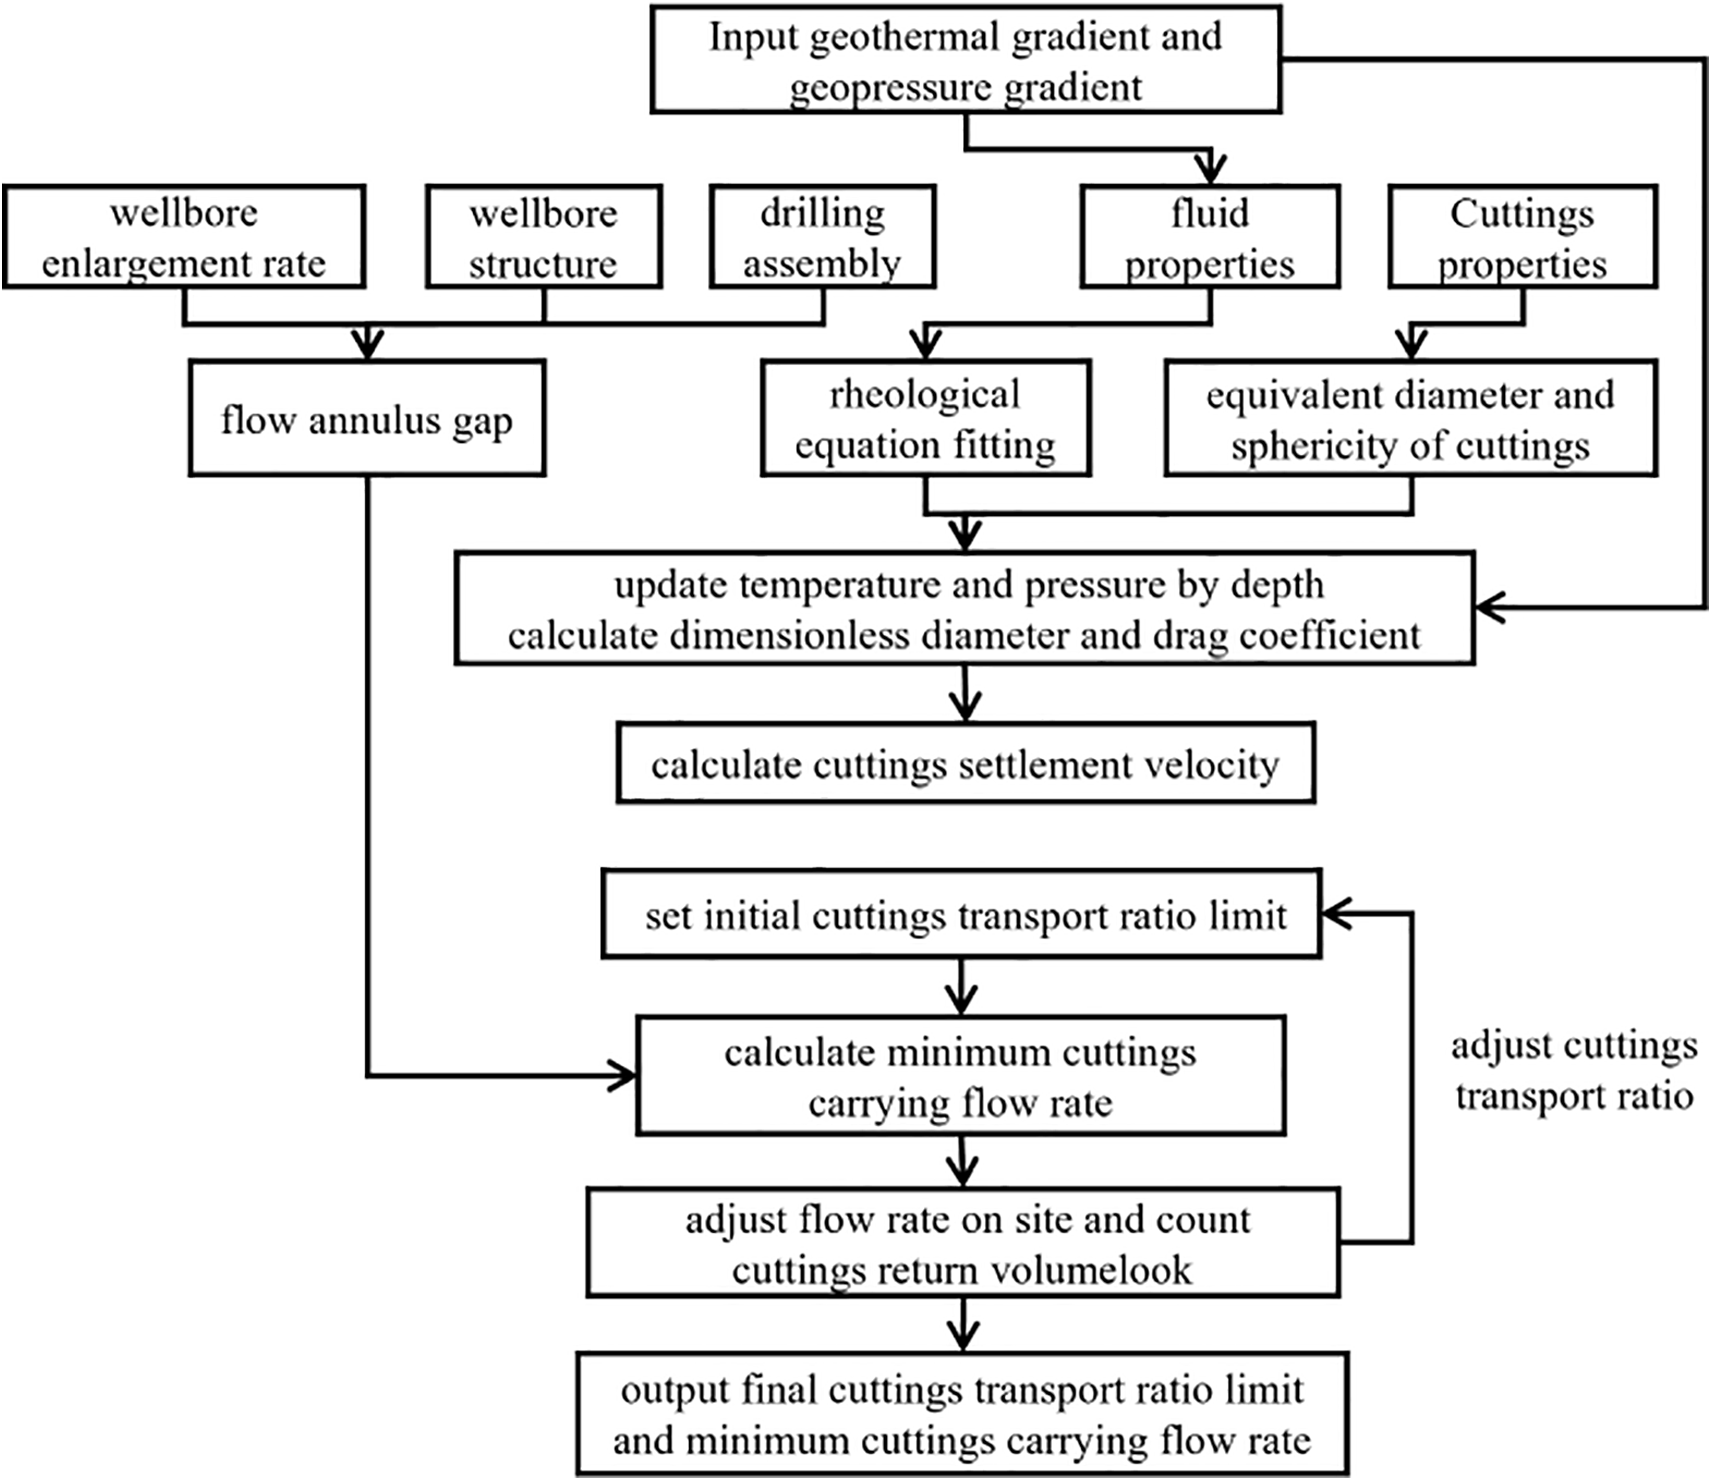
Figure 1: Flowchart of our work
2 Wellbore Cleanliness Calculation Model and Evaluation Index
2.1 Calculation Model for the Terminal Settling Velocity of Nonspherical Particles
The cuttings generated during drilling or the blocks due to wellbore instability exhibit irregular shapes, and the drilling fluid system is mostly non-Newtonian.
The shape characteristics of nonspherical particles can be characterized by sphericity, as follows [10]:
where Vm is the volume of rock debris, m3. de is the equivalent volumetric diameter of a nonspherical particle, m. Se is the equivalent volumetric surface area of a sphere, m2. Sa is the surface area of a nonspherical particle, m2. φ is the particle sphericity. In most engineering handbooks [19], the prediction model for nonspherical particles is modified by introducing the concept of sphericity; that is, the greater the deviation of sphericity from 1, the more irregular a nonspherical particle is. The method for obtaining the sphericity range of on-site cuttings is as follows. Samples of returned cuttings are obtained from the vibrating screen at regular intervals. The maximum and minimum sizes of the cuttings are recorded. Their length, width, and height are measured. The size range of the cuttings is documented. Then, we convert the measured size range of the cuttings into a sphericity range by using Eqs. (1) and (2).
The drag coefficient of nonspherical particles was calculated using Eq. (3), as follows:
where Cd is the drag coefficient for nonspherical particles. ρf and ρp are the density of the drilling fluid and particles, respectively, kg/m3. g is the gravitational acceleration, m/s2. V is the particle settling velocity, m/s.
Ultra-deep wells typically feature high formation temperatures and pressures, with temperature and pressure exerting significant effects on the density of the drilling fluid. Here, we propose an approach to correct the influences of temperature and pressure in Eqs. (4) and (5) [20]:
where p0 is the surface pressure, MPa. T0 is the surface temperature, °C. Ω (p, T) represents the drilling fluid density that varies with temperature and pressure. ξp, ξT, ξpp, ξTT, and ξpT are model regression coefficients based on rheological experiments. p and T are the wellbore pressure and temperature, respectively, MPa, °C.
High molecular weight polymers are typically added to drilling fluids, and the dispersion of most polymers conforms to the power-law model. The particle Reynolds number in power-law fluids is calculated using Eq. (7) from Agarwal et al. [5]:
where τ is the yield stress, Pa. γ is the shear rate, s−1. Rep is the particle Reynolds number. K is the consistency coefficient of the power-law fluid, Pa·sn. n is the flow behavior index of the power-law fluid, and it can be determined by fitting a rheological equation to the 6 rpm reading of the actual drilling fluid system on-site.
In the current work, we used the Fann35A (Coriolis-207198) viscometer to measure the rheology of the drilling fluid. In accordance with the American Petroleum Institute Recommended Practice, these measurements record the readings of the rotational viscometer at rotational speeds of 600, 300, 200, 100, 6, and 3 r/min in the relationship between the shear rate and shear stress of the fluid. The readings of the Fann viscometer can be expressed by the following equations:
where γ is the shear rate at the rotational speeds of the viscosimeter, s−1. Vrotational is the rotational speed, r/min. τ is the shear stress, Pa. r is the readings of the viscosimeter.
To obtain an explicit settling velocity equation that can be applied to spherical and nonspherical particles in power-law fluids, Xu et al. [14,21] proposed a dimensionless particle diameter. They fitted the relationship between the drag coefficient and the dimensionless particle diameter based on experimental data.
Similar to the processing of the flow behavior index in Shah et al. [9] and based on 553 tests, Xu et al. [14] proposed the following calculation method:
where
By substituting Eqs. (11) into (3), we can obtain the prediction model for the terminal settling velocity of nonspherical particles in non-Newtonian fluids.
where Vp is the predictive model for the terminal settling velocity of nonspherical particles in non-Newtonian fluids, m/s. Xu et al. [14] compared the measured and predicted settling velocities calculated using Eqs. (12) and (13). The average relative error is 13.9%.
2.2 Evaluation Index for Wellbore Cleanliness
At present, simulation software, such as Wellplan, uses a cuttings concentration of less than 5% as the threshold for calculating the cuttings carrying capacity flow rate. However, this value is no longer applicable in situations with ultra-deep and large-diameter wells wherein the rate of penetration is low. The cuttings carrying capacity in vertical well sections can be typically represented by the cuttings transport ratio (Rt). In engineering applications, different thresholds for the cuttings transport ratio can be established to predict the efficiency of wellbore cleaning.
where Va is the return flow velocity in the annulus, m/s. kr is the wellbore enlargement rate, which is calculated from caliper logging data. Rt is the cuttings transport ratio, which represents cuttings carrying capacity. Q is the minimum flow rate required to satisfy the cuttings transport ratio, m/s. D and d are the inner and outer diameters of the flow space, respectively, m.
To maintain a balance between the cuttings generated and the returned cuttings, the cuttings transport ratio (Rt) is generally required to be greater than or equal to 0.5. This condition implies that the annular return velocity of the drilling fluid should be at least two times the terminal settling velocity of the cuttings. Therefore, the cuttings carrying capacity flow rate under various cuttings transport ratios is calculated through engineering experiments based on different conditions. This calculation helps determine the boundary conditions for the cuttings transport ratio under the current well conditions, and thus, guide engineering measures accordingly.
3 Analysis of Factors That Affect Wellbore Cleanliness
Using Rt = 0.5 as a reference value, we quantitatively analyze the influences of temperature, pressure, cuttings shape, wellbore size, flow rate, and drilling fluid rheological parameters on terminal settling velocity and cuttings carrying capacity in large well sections.
3.1 Influences of Temperature and Pressure
To analyze the influences of wellbore temperature and pressure on the settlement velocity of the drilling fluid and the minimum cuttings carrying flow rate, the simulation parameters are as follows: the ground density of the drilling fluid is 1.75 g/cm3, rock density is 2.7 g/cm3, the inner diameter of the upper casing is 332.7 mm, wellbore size is 323.85 mm, drill string assembly is Φ323.85 mm drill bit + Φ244 mm straight screw + Φ229 mm spiral drill collar + Φ168.3 mm heavy drill pipe + Φ139.7 mm drill pipe + Φ149.2 mm drill pipe, the size of the cuttings is 7 × 5 × 1.5 cm3, the consistency coefficient of the drilling fluid is 0.97 Pa·sn, and the fluidity index is 0.51.
We calculated the equivalent static density distribution of the drilling fluid in a wellbore based on the actual wellbore temperature distribution, which is represented by the blue line in Fig. 2a and illustrated by the red line in the same figure. When considering the influences of temperature and pressure on the density of the drilling fluid, the calculated settlement velocity is lower than that when temperature and pressure are not considered. The maximum difference reaches 3.4% under the calculation conditions, as shown in Fig. 2c. The calculated minimum cuttings carrying flow rate is also lower than that when these factors are not considered, with the maximum difference between the two reaching 1.81 L/s, as shown in Fig. 2b.
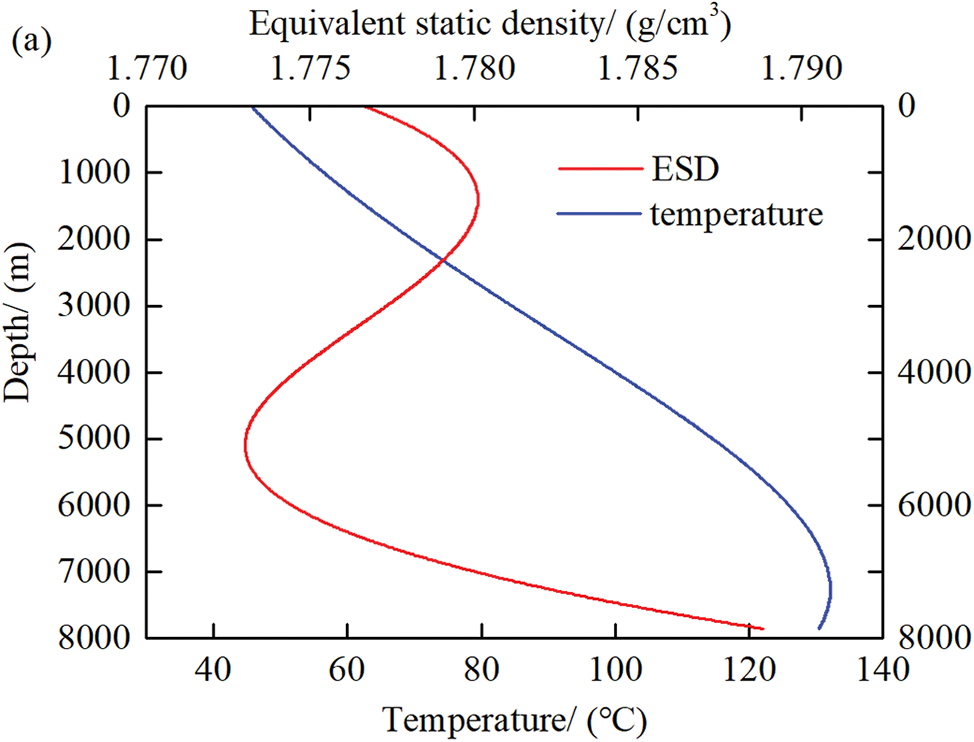
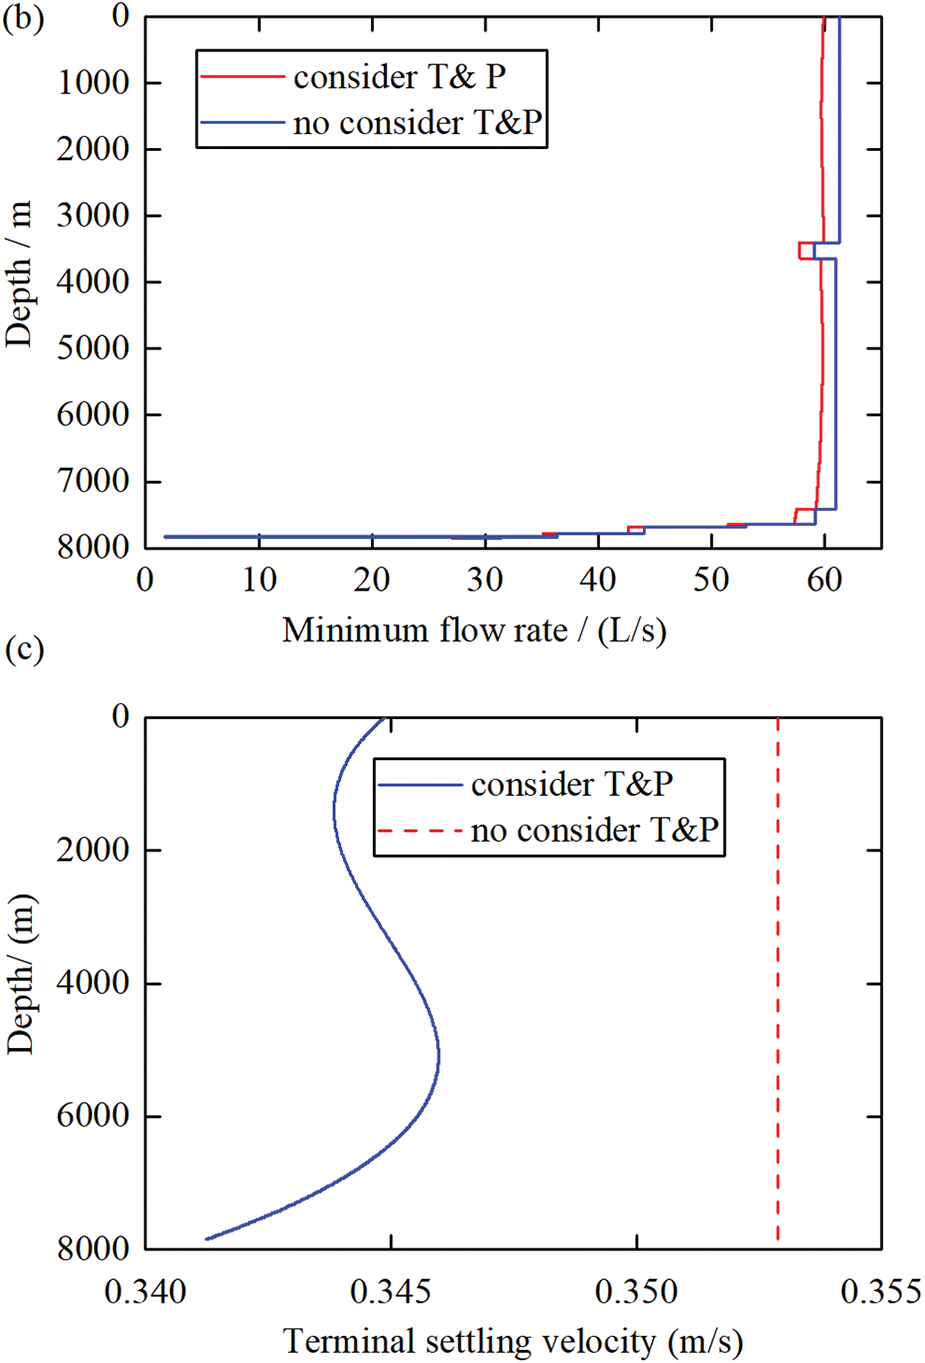
Figure 2: Influences of temperature and pressure. (a) Influence of temperature on equivalent static density; (b) Influences of temperature and pressure on the minimum cuttings carrying flow rate; (c) Influences of temperature and pressure on settlement velocity
3.2 Influence of Cuttings Shape
Statistical analysis was conducted on the shapes and size ranges of the cuttings/debris from the Feixianguan to Maokou formations at the drilling site. Under the same drilling fluid density and rheological properties, and with the rock type being limestone, the terminal settling velocities of the cuttings/debris with different sizes and shapes were simulated and calculated. The results are provided in Table 1.
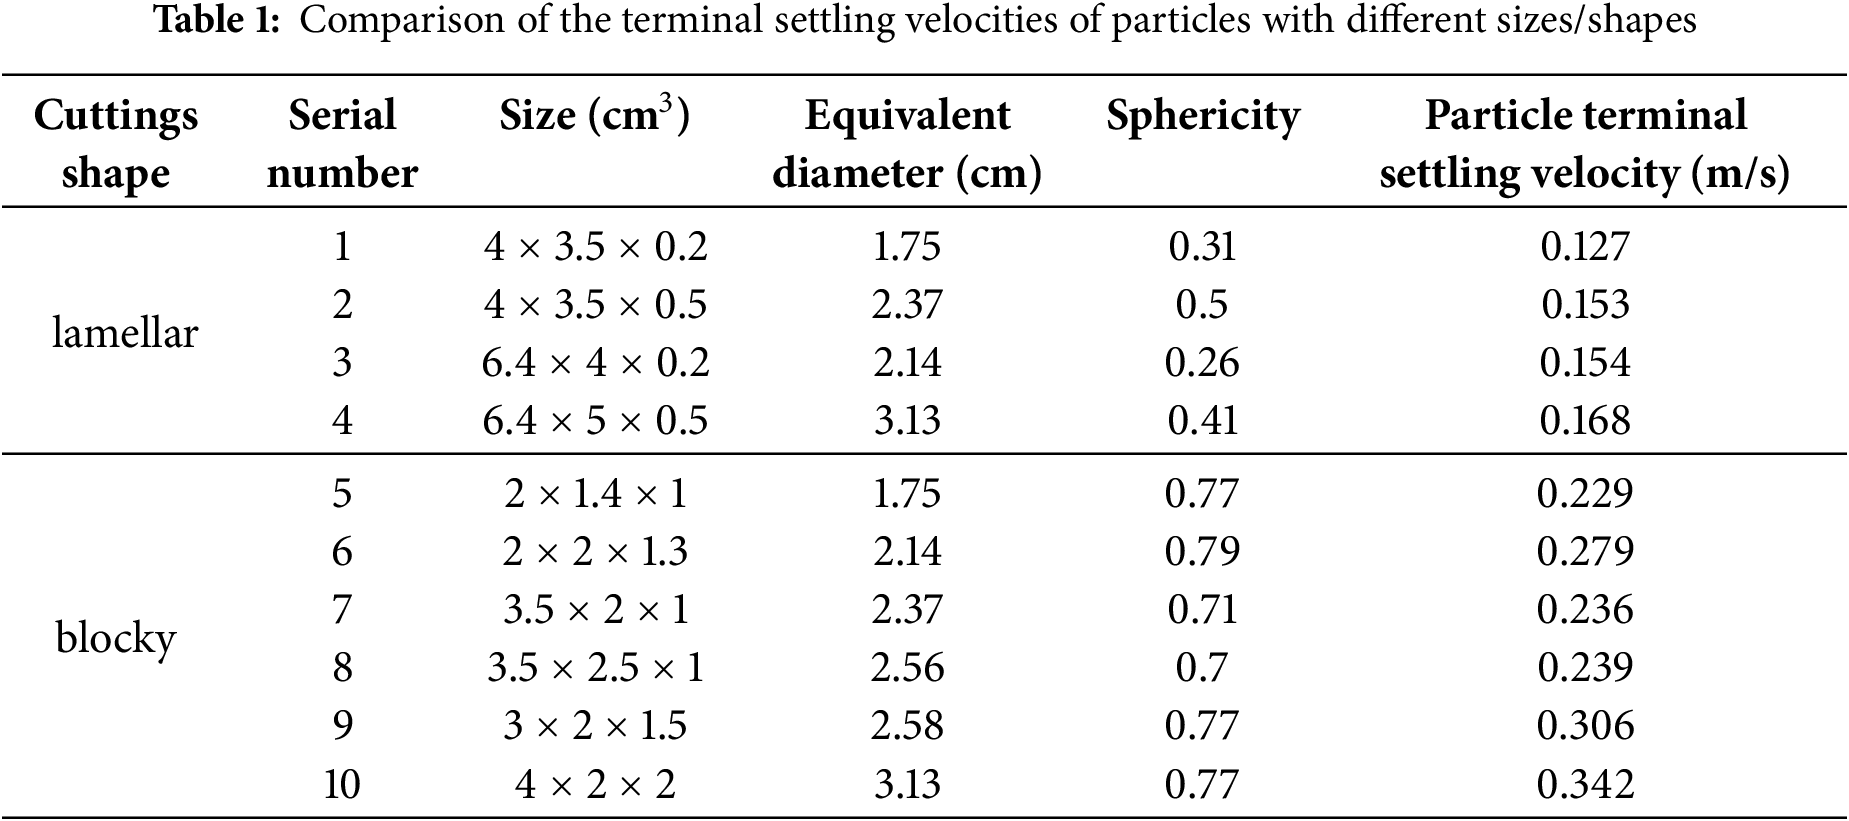
From the calculation results, the settlement velocities of blocky cuttings/debris with the same equivalent diameter, as shown in Fig. 3a, are all higher than those of flake-like cuttings/debris, with an average increase of 79.8%. This finding indicates that the annular return velocity required to carry blocky cuttings/debris out of the well is higher than that for flake-like cuttings under the same cuttings transport ratio. That is, in engineering applications, if a certain flow rate is adopted in the same well section to carry flake-like cuttings out of the well, then this flow rate may not be necessarily adopted for the same volume of blocky cuttings, affecting the efficiency of wellbore cleanliness. Meanwhile, as the equivalent diameter of the cuttings increases, the settlement velocity of the cuttings also increases, resulting in an increase in the required annular return velocity, as shown in Fig. 3b.
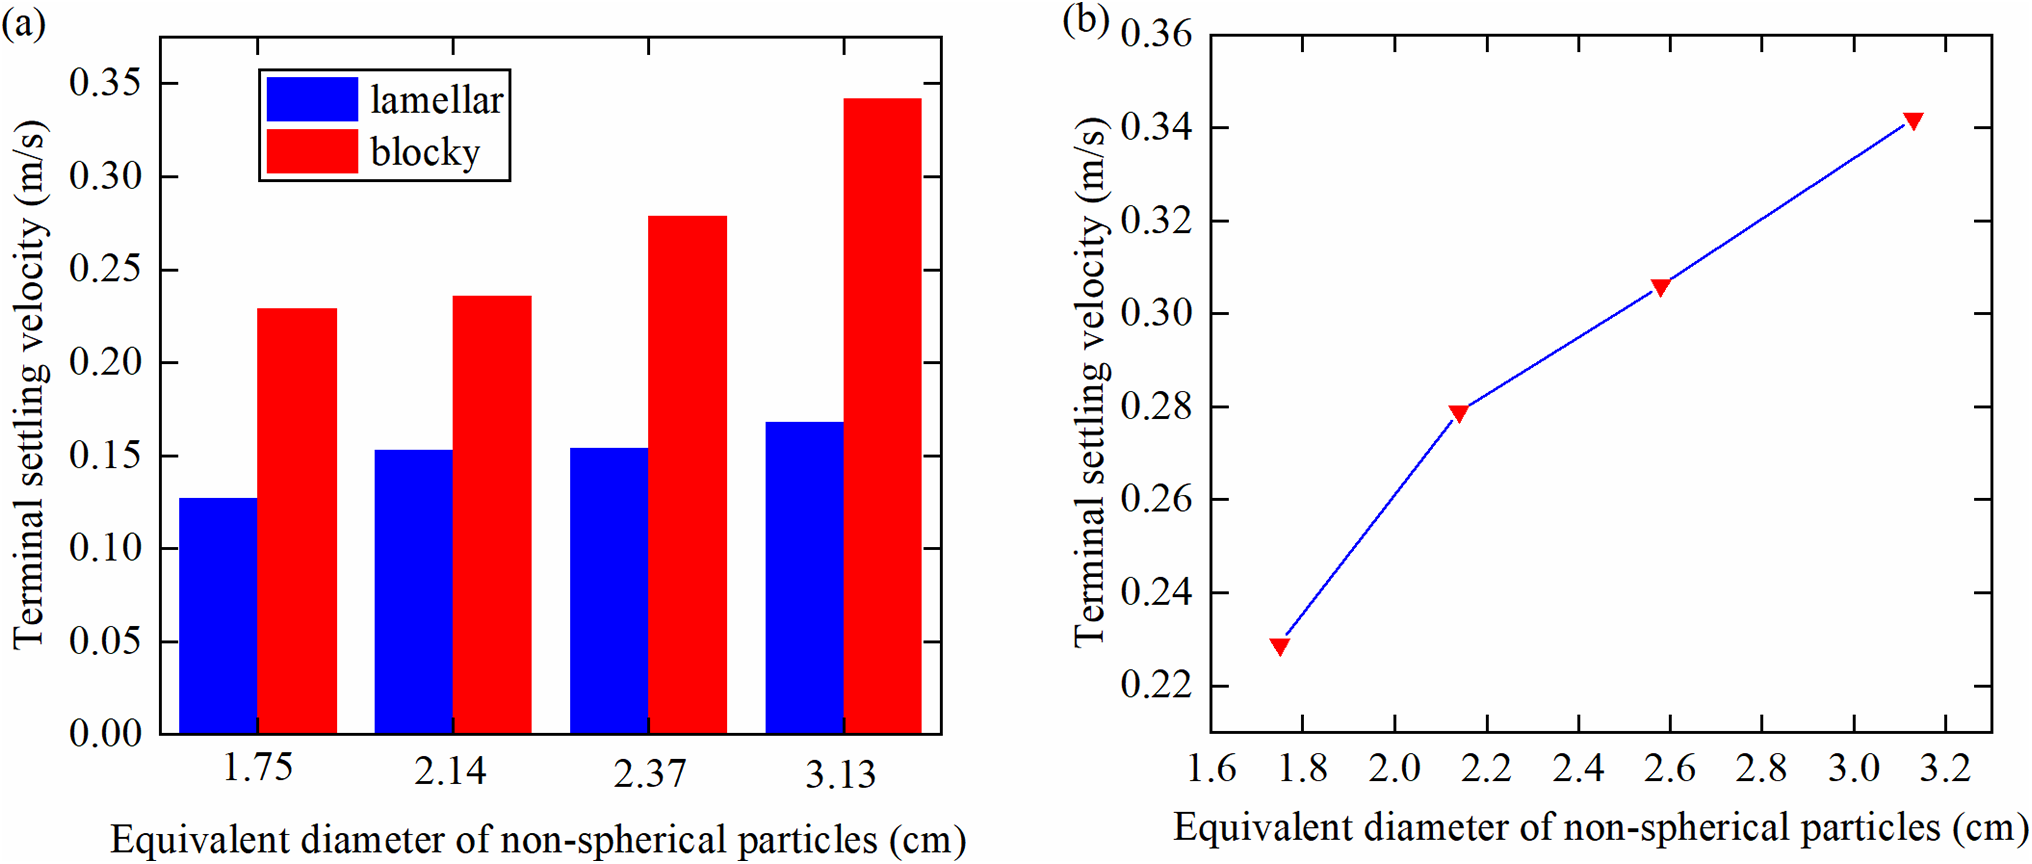
Figure 3: Relationship between the settlement velocity of nonspherical particles and the equivalent diameter. (a) Comparison of the terminal settling velocities of cuttings with different shapes; (b) Terminal settling velocity varies with the equivalent diameter
3.3 Influence of Wellbore Size
The annular gap widens with increasing wellbore diameter, causing a sharp decline in annular fluid velocity. Assuming constant drilling fluid properties, rheological parameters, and cuttings size, we calculated the critical cuttings transport velocity with various wellbore sizes and proportional hole enlargement rates at the same size. The simulation parameters are as follows: drilling fluid density of 1.95 g/cm3, rock density of 2.68 g/cm3, inner diameter of the upper casing of 451.4 mm, wellbore size of 444.5 mm, outer diameter of the drill pipe of 168.3 mm, casing shoe depth of 1005.4 m, cuttings size of 3.5 × 2.5 × 1 cm3, power-law fluid consistency coefficient of 0.49 Pa·sn, and fluidity index of 0.64.
As indicated by the calculation results shown in Fig. 4, in which a 444.5 mm wellbore is used as an example, the minimum cuttings carrying flow rates are 63.6, 71.2, 79.2, 87.6, and 96.5 L/s when the wellbore enlargement rates are 1%, 5%, 10%, 15%, and 20%, respectively. For every 5% increase in wellbore enlargement rate, the minimum cuttings carrying flow rate increases by approximately 10%, with a gradual decrease in the rate of increase. As wellbore size increases from 215.9 to 593.7 mm, the minimum cuttings carrying flow rate increases nonlinearly, with the growth rate initially increasing and then slowing down, indicating that the influence of size effect on the minimum cuttings carrying flow rate diminishes as wellbore size increases further. In addition, the minimum cuttings carrying flow rate varies across different wellbore sections, and thus, the highest value should be adopted as the boundary condition in engineering applications. Attention should be given to the fact that the case section requires a higher cuttings carrying flow rate than the open-hole section to prevent issues, such as insufficient cuttings/debris cleaning in the case section.
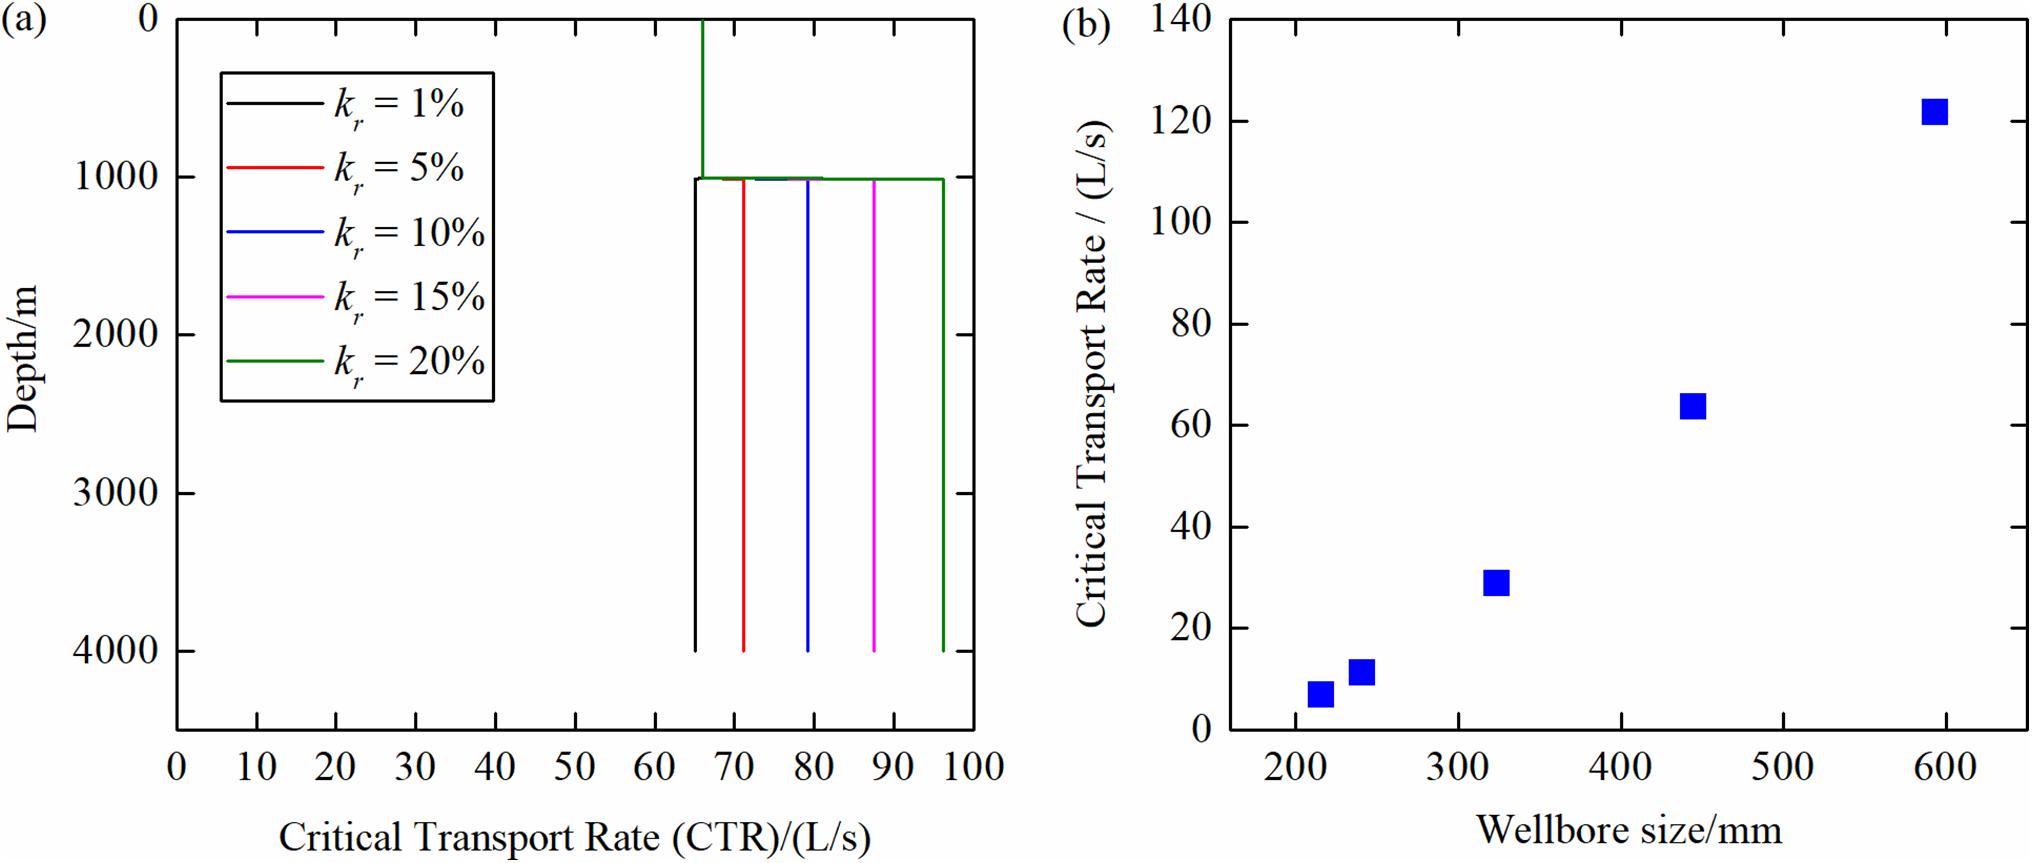
Figure 4: Relationship between the minimum cuttings carrying flow rate and wellbore size. (a) Influence of different wellbore enlargement rates on the critical cuttings carrying flow rate. kr represents the wellbore enlargement rate; (b) Critical cuttings carrying flow rate for different wellbore sizes
Flow rate directly affects the annular return velocity of cuttings, and different flow rates are required to achieve varying levels of wellbore cleanliness. Keeping the simulation parameters the same as above, we calculated the changes in the minimum cuttings carrying flow rate required to achieve different levels of cleaning efficiency. As shown in Fig. 5, using a 444.5 mm wellbore as an example, the results indicate that the minimum cuttings carrying flow rates should be 54.9, 59.9, 65.9, 73.3, and 82.4 L/s to achieve cuttings transport ratios of 0.4, 0.45, 0.5, 0.55, and 0.6, respectively. As the cuttings transport ratio increases proportionally, the increment in the required cuttings carrying flow rate gradually increases.
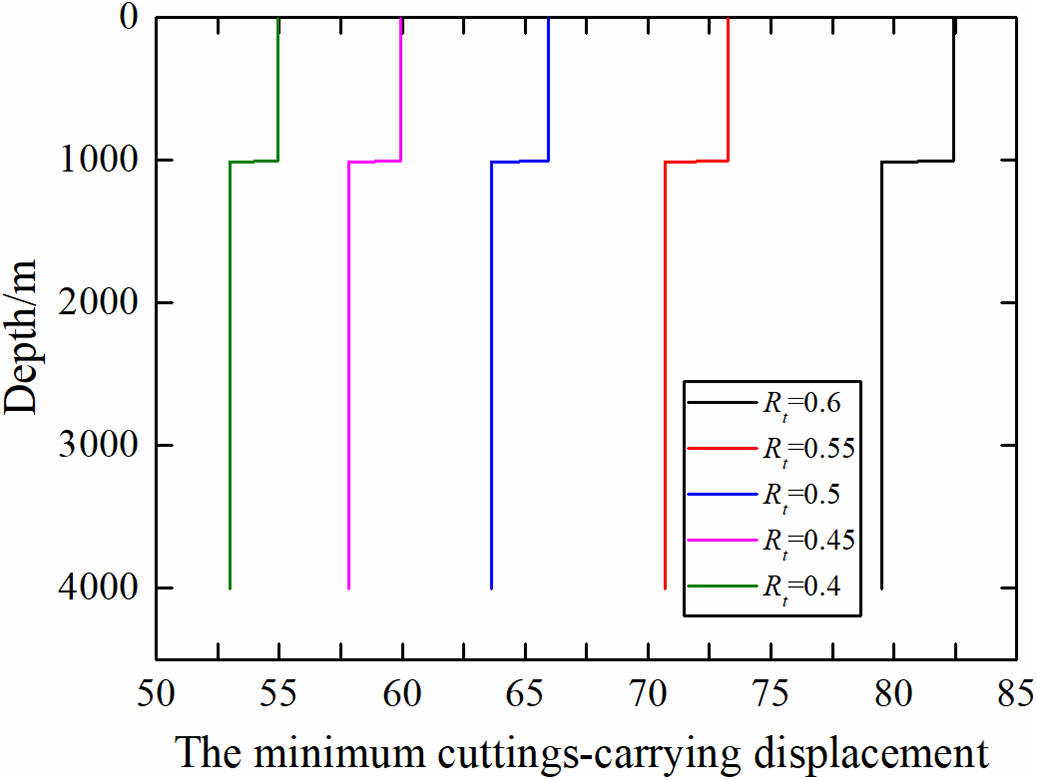
Figure 5: Relationship between the minimum cuttings carrying flow rate and wellbore cleaning efficiency
3.5 Influence of Drilling Fluid Rheology
The rheological characteristics of drilling fluids play a pivotal role in influencing the computation of drag coefficient and particle Reynolds number. In practical applications, substantial quantities of various additives are frequently incorporated into drilling fluids. Consequently, based on actual readings, as shown in Table 2, a rheological model of the drilling fluid is formulated and fitted to enable a quantitative analysis of the effects of drilling fluid rheological parameters on particle settlement velocity.
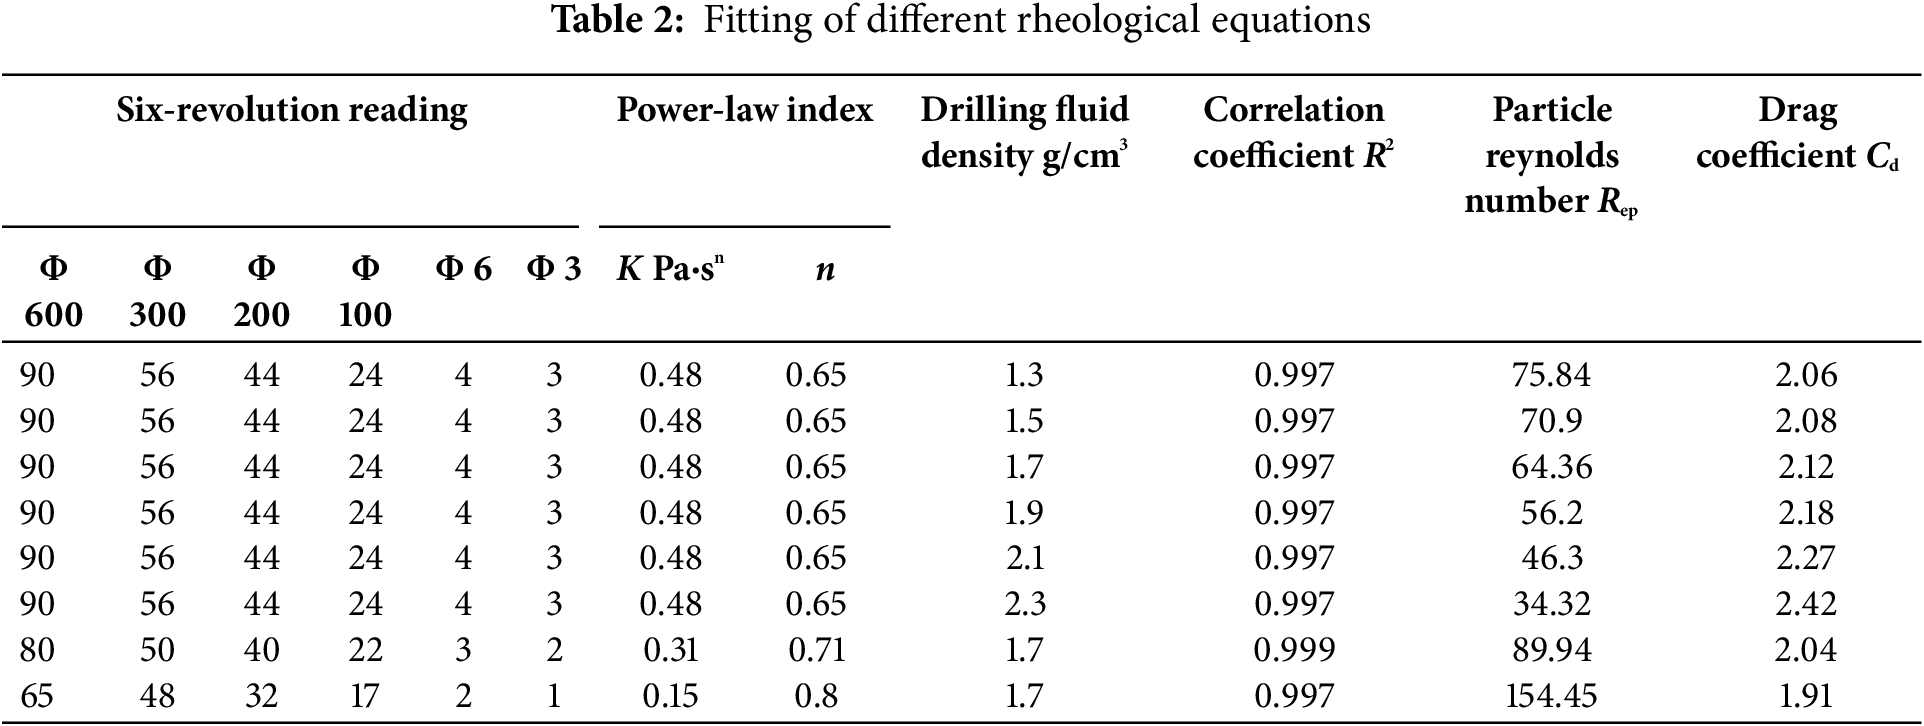
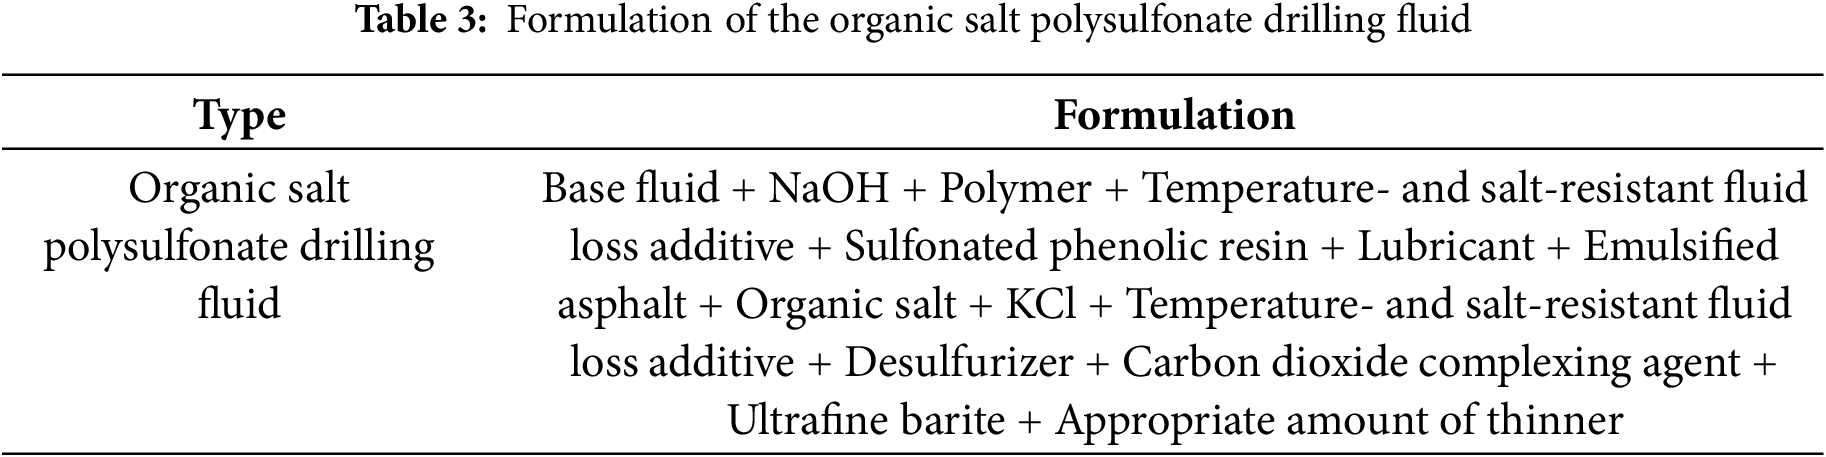
Simulation parameters: The wellbore size is 444.5 mm, the outer diameter of the drill pipe is 168.3 mm, the casing shoe is at 1005.4 m, and the cuttings size is 3.5 × 2.5 × 1 cm3. Through power-law fitting, the consistency index and flow behavior index under the power-law model were obtained for each combination, with all the correlation coefficients R2 greater than 0.97, as shown in Fig. 6. The drilling fluid system is the organic salt polysulfonate drilling fluid, and its composition and formulation are provided in Table 3.
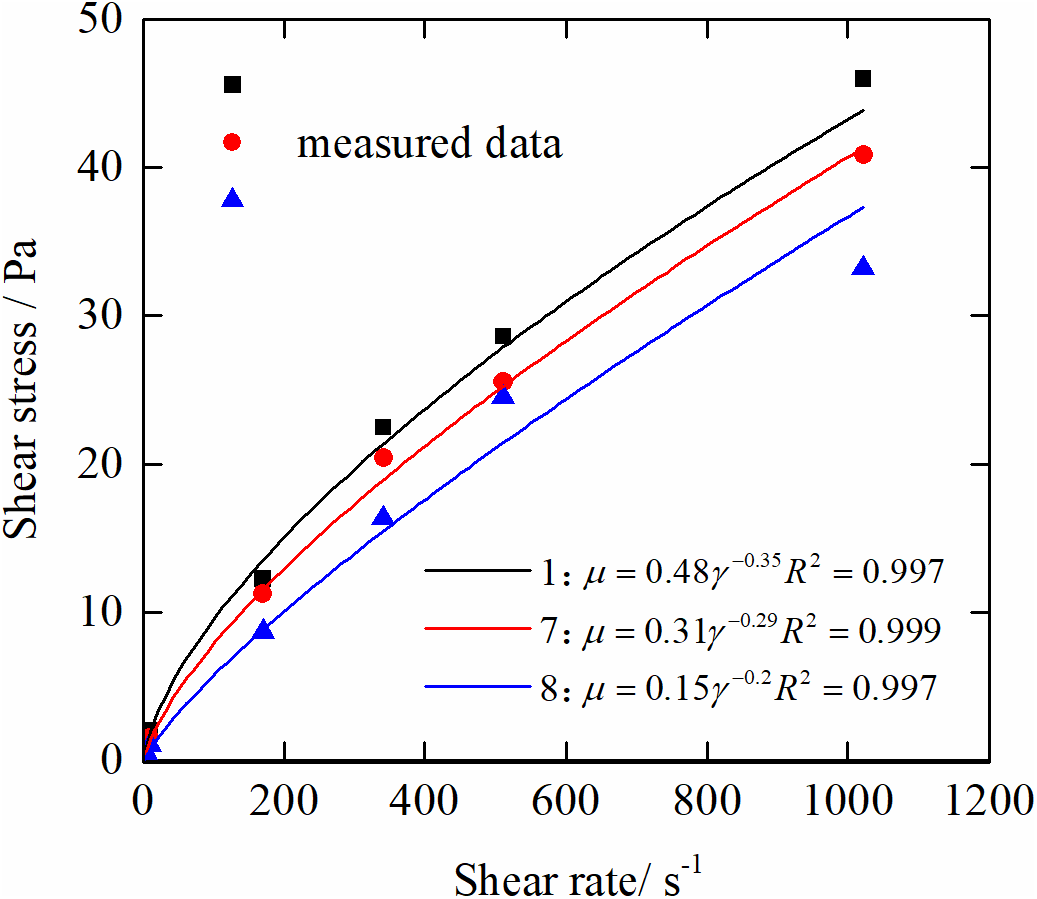
Figure 6: Fitting of rheological parameters for the power-law flow pattern
As illustrated in Fig. 7a, particle settlement velocity decreases significantly as the density of the drilling fluid increases, while the drag coefficient index increases accordingly. As shown in Fig. 7b, the particle Reynolds number increases, while the drag coefficient undergoes a decrement. However, this decremental trend exhibits a deceleration at elevated Reynolds numbers. The effects of rheological parameters on terminal settling velocity are relatively intricate, with the drilling fluid system demonstrating substantial variability.
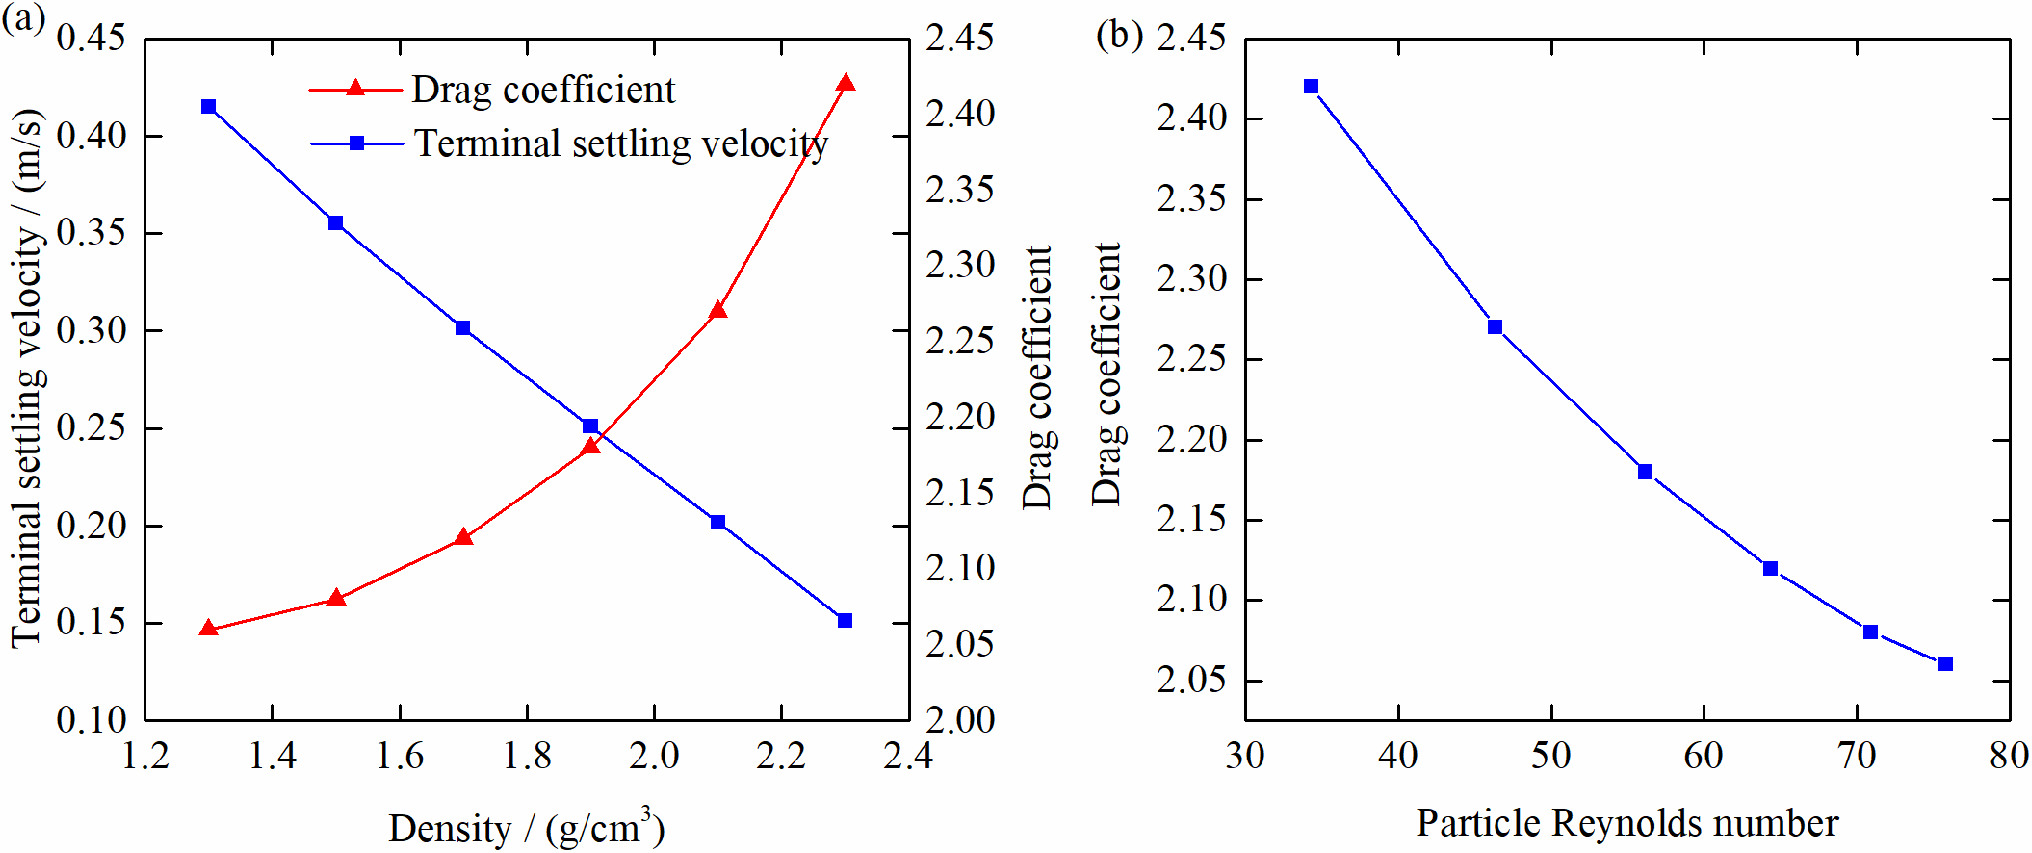
Figure 7: Relationship between terminal settling velocity and drilling fluid density. (a) Drag coefficient and terminal settling velocity vary with density; (b) Relationship between drag coefficient and particle Reynolds number
Collectively, as depicted in Fig. 8a, an increase in the consistency coefficient leads to a decrease in terminal settling velocity, with the decremental rate slowing down within the high-viscosity range. In addition, for a constant consistency coefficient, a decrement in the flow behavior index results in an increment in terminal settling velocity. As the flow index decreases, the shear-thinning effect of the fluid gradually increases. This phenomenon leads to smaller apparent viscosity [22,23] and higher sedimentation velocity. During on-site performance adjustments, when the consistency coefficient increases while the flow behavior index decreases, as shown in Fig. 8b, the contributions of the two factors to the alteration of terminal settling velocity diverge, resulting in a more complex pattern of variation in terminal settling velocity.
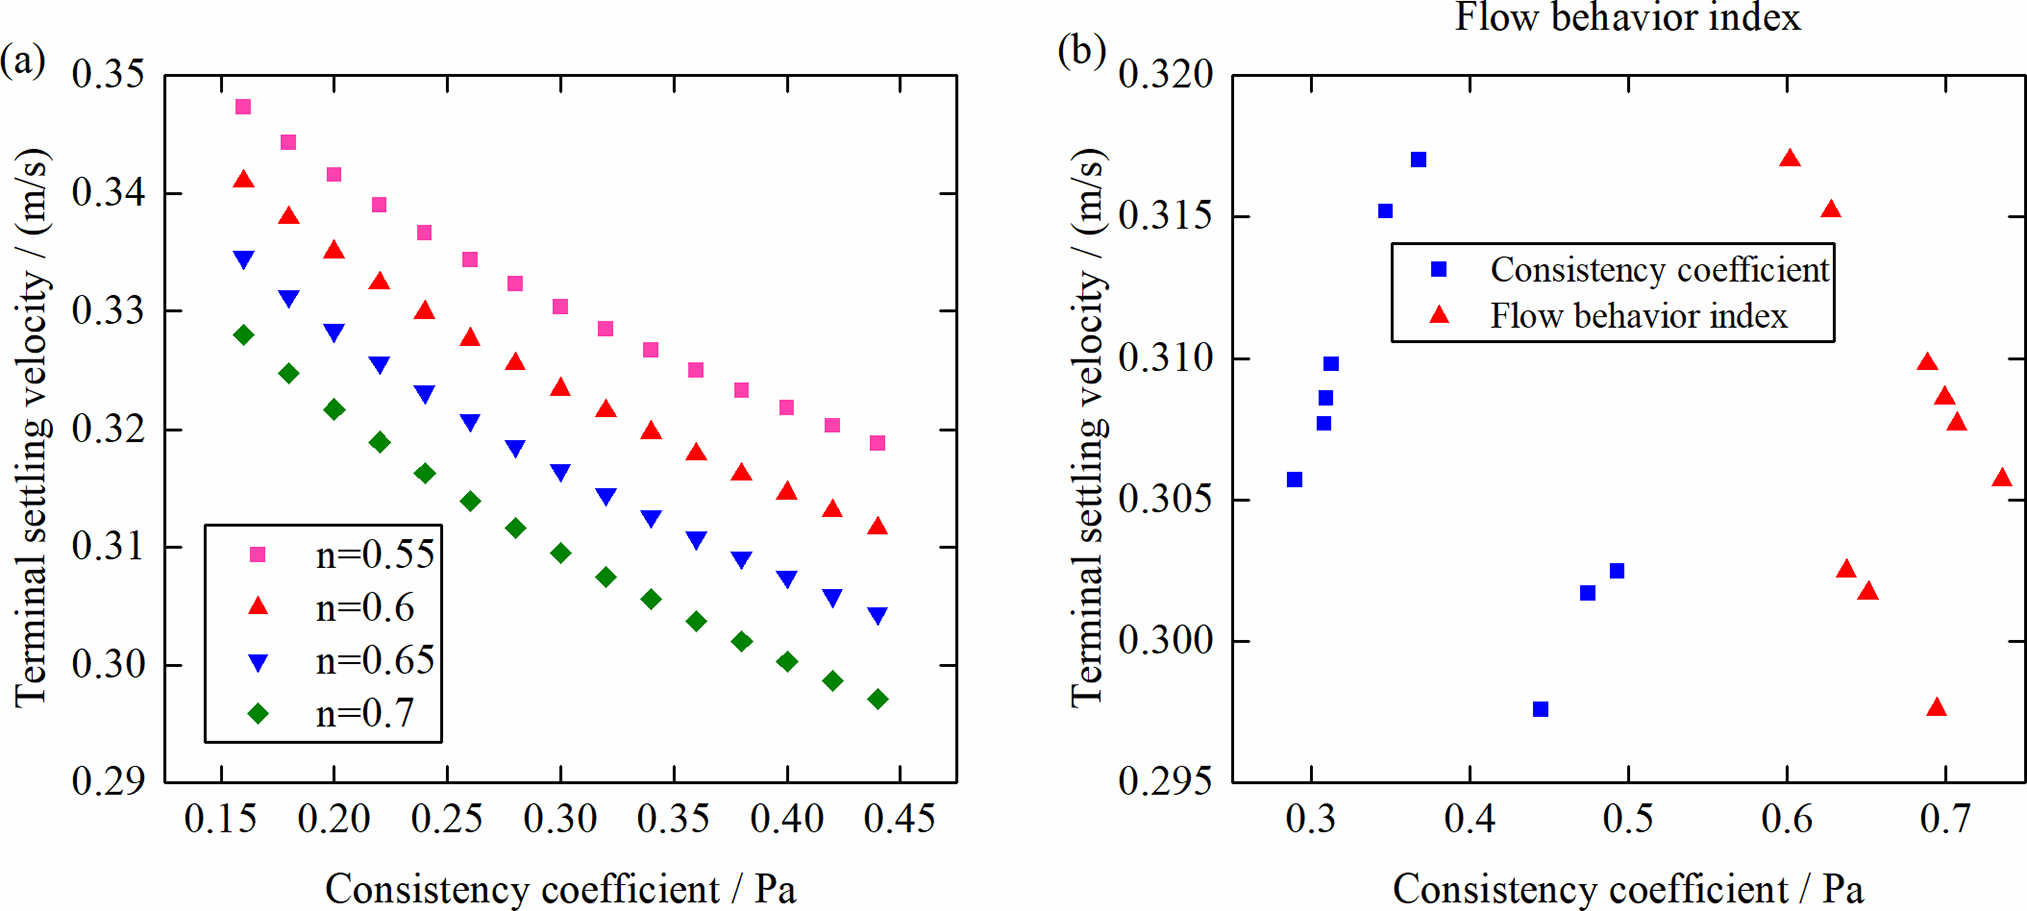
Figure 8: Relationship among the consistency coefficient, flow behavior index of the power-law flow pattern, and terminal settling velocity (a, b)
4 Engineering Calculation Example
An ultra-deep well in the Sichuan Basin with a casing of 492.13 mm + 485.78 mm was drilled to a depth of 3611 m, as shown in Fig. 9. The 444.5 mm section was drilled using a drilling fluid with a density range of 1.86–1.95 g/cm3 and a flow rate between 80 L/s and 100 L/s. Well deviation was controlled within 1.5°. The drilling assembly consisted of the following: Φ444.5 mm Polycrystalline Diamond Compact (PDC) bit + 286 mm screw + inclination measuring sub + 279.4 mm spiral drill collar + 442 mm reaming stabilizer + 279.4 mm spiral drill collar + 440 mm conventional stabilizer + 279.4 mm spiral drill collar + 254 mm + 228.6 mm spiral drill collars + 203.2 mm spiral drill collar + 168.3 mm drill pipe. The wellbore enlargement rate was 5%. A strategy for regulating flow rate and rheological parameters was formulated by comparing trial calculations using mature commercial software and simplified calculation methods. Analyzing the trend of the segmented minimum cuttings carrying flow rate based on the returned cuttings and debris from the site.
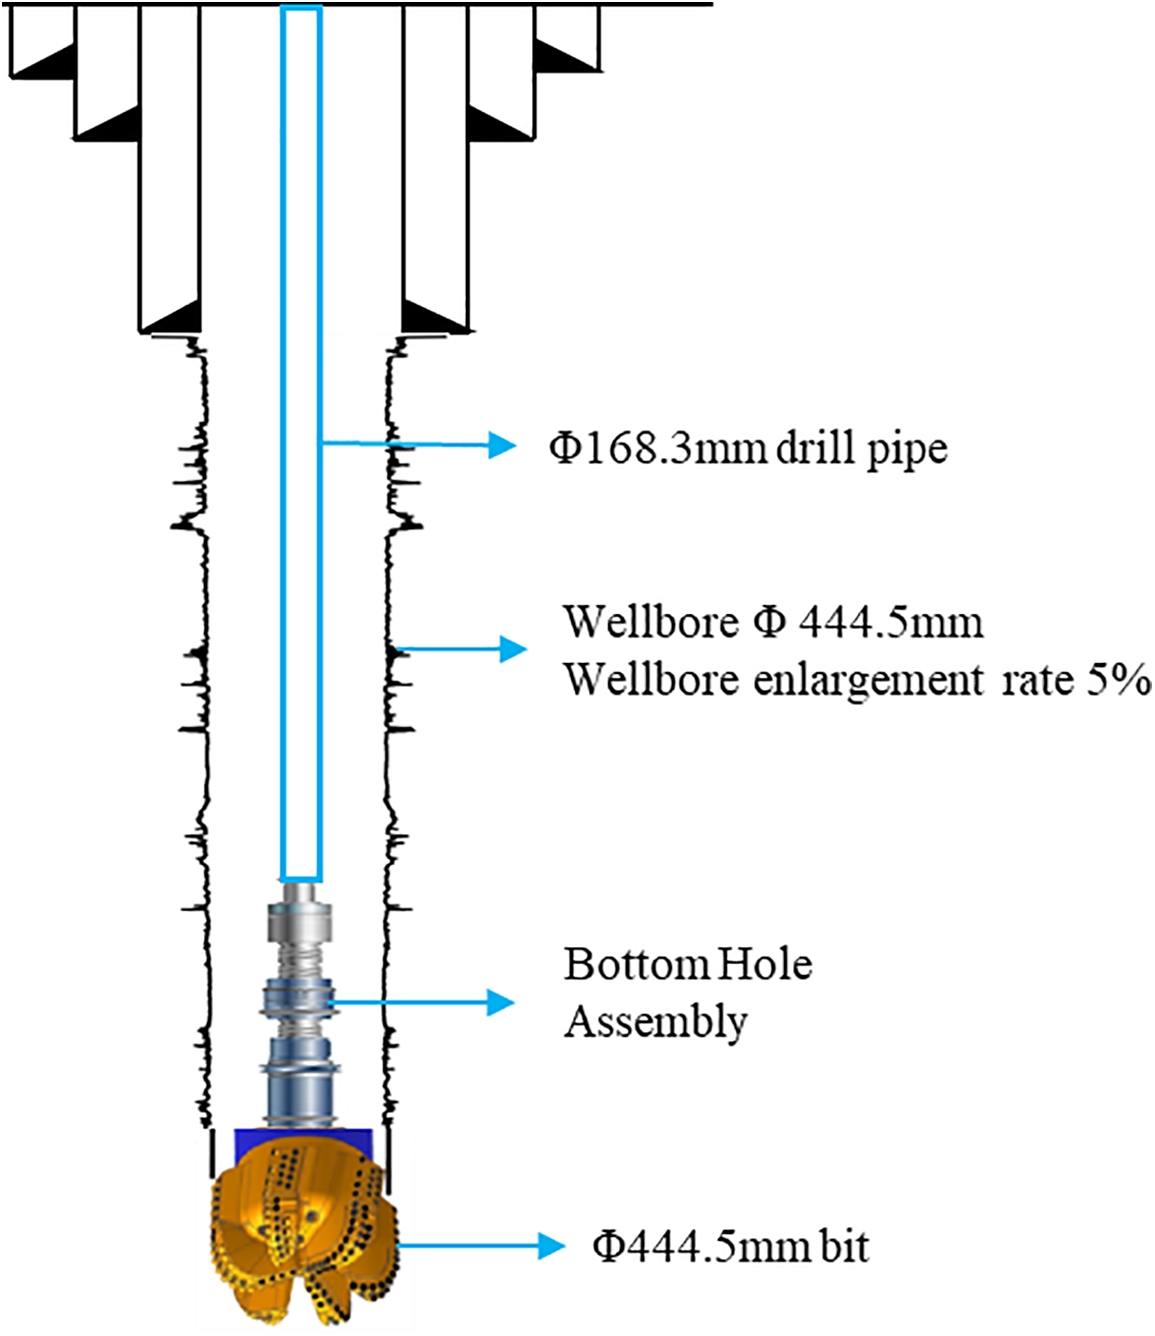
Figure 9: Schematic of the wellbore
For the first engineering parameters (Table 4), we conduct a comparative analysis of the minimum cuttings carrying flow rate derived from the established commercial software Wellplan and our proposed methodology. Figs. 10–12 show the assessment of wellbore cleanliness, which is based on the minimum flow rate necessary to transport the largest debris particles, utilizing the cuttings transport ratio as an indicator. Considering the maximal debris dimensions of 5.0 × 3.0 × 1.0 cm3, the corresponding minimum annular velocities vary with the achieved level of wellbore cleaning. In particular, when Rt (a parameter indicative of cleaning efficiency) is set at 0.4, 0.45, 0.5, 0.55, and 0.6, the minimum annular velocities are calculated as 0.385, 0.42, 0.462, 0.512, and 0.578 m/s, respectively. Based on these velocities and considering an upper limit for safety, the recommended minimum cuttings carrying flow rates for various wellbore sections and cleaning levels are 57.33, 62.54, 68.79, 76.44, and 86 L/s, respectively.
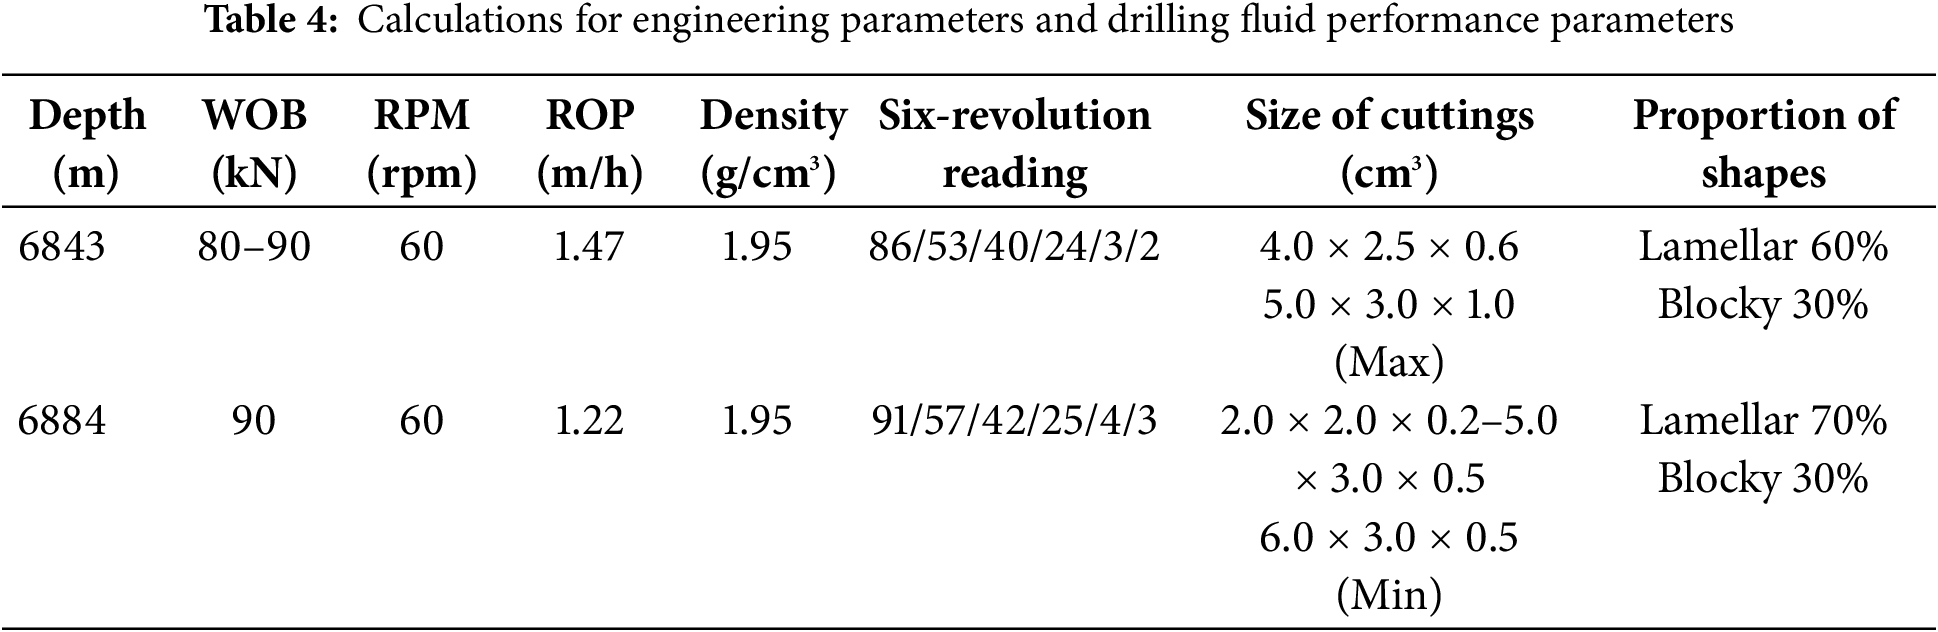
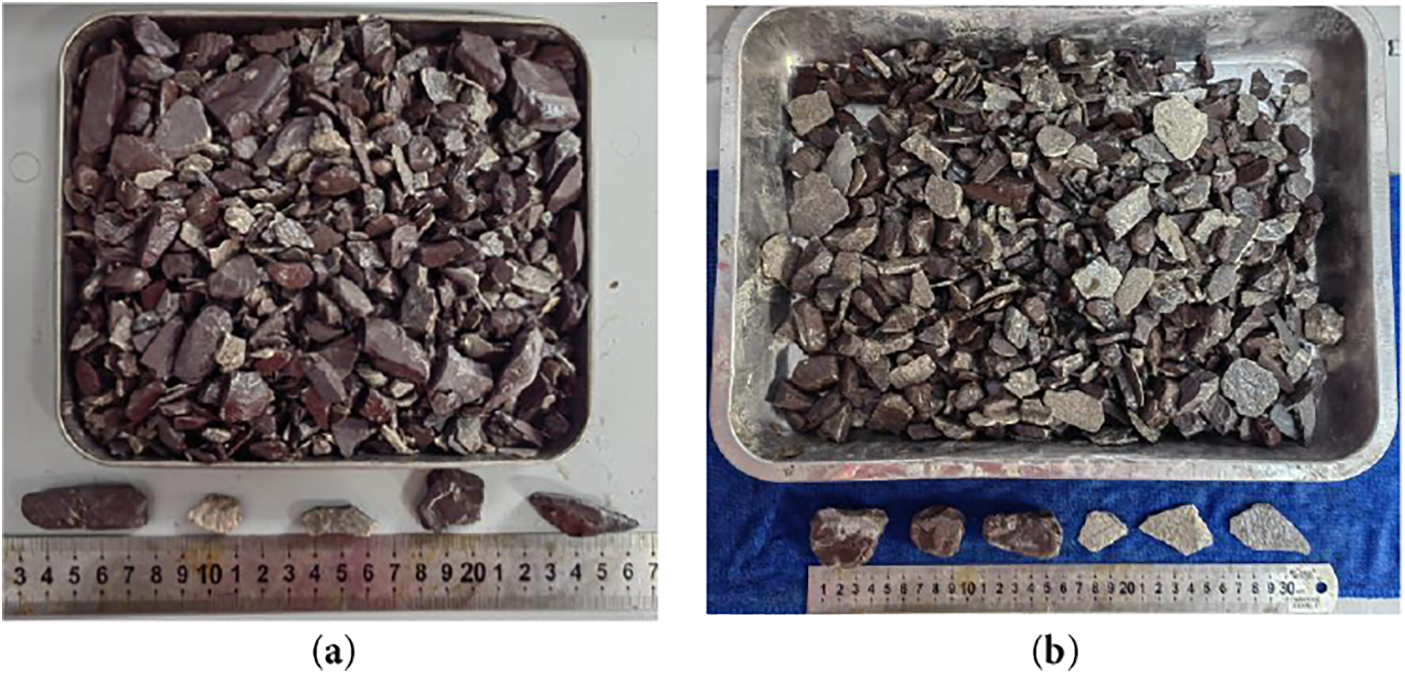
Figure 10: Statistics of cuttings/debris size. (a) 6843 m; (b) 6884 m
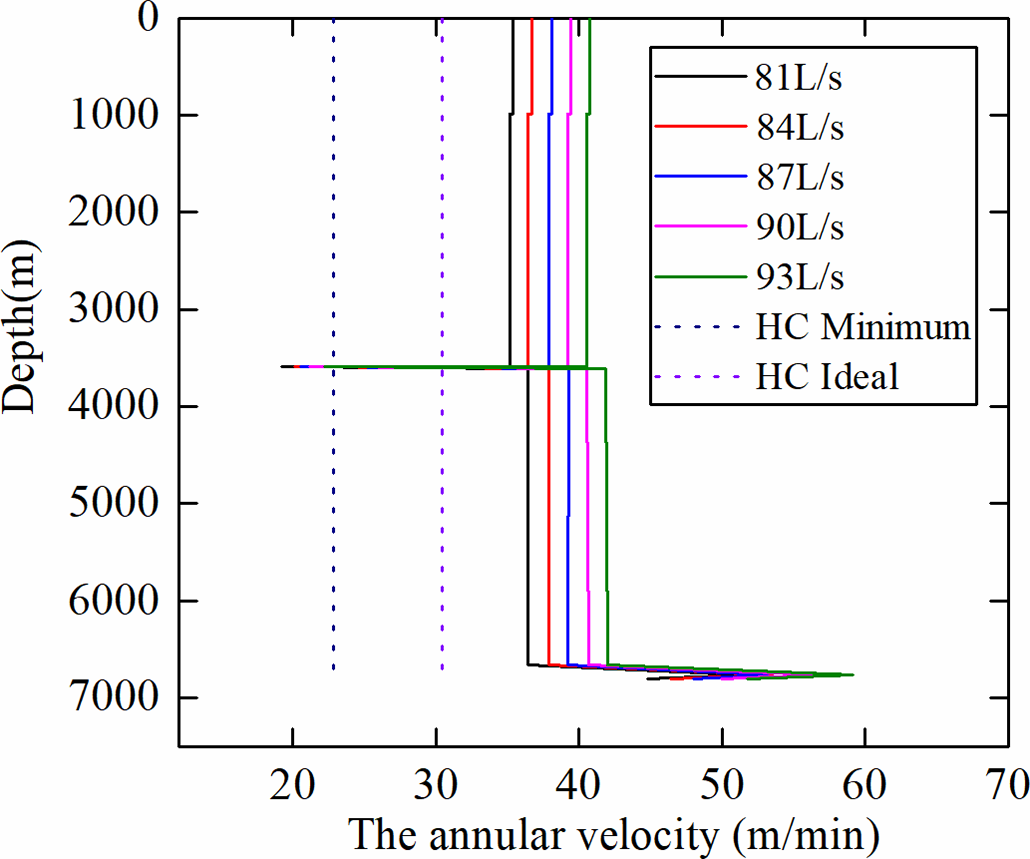
Figure 11: Wellplan calculation of minimum annular velocity and cuttings transport rate.
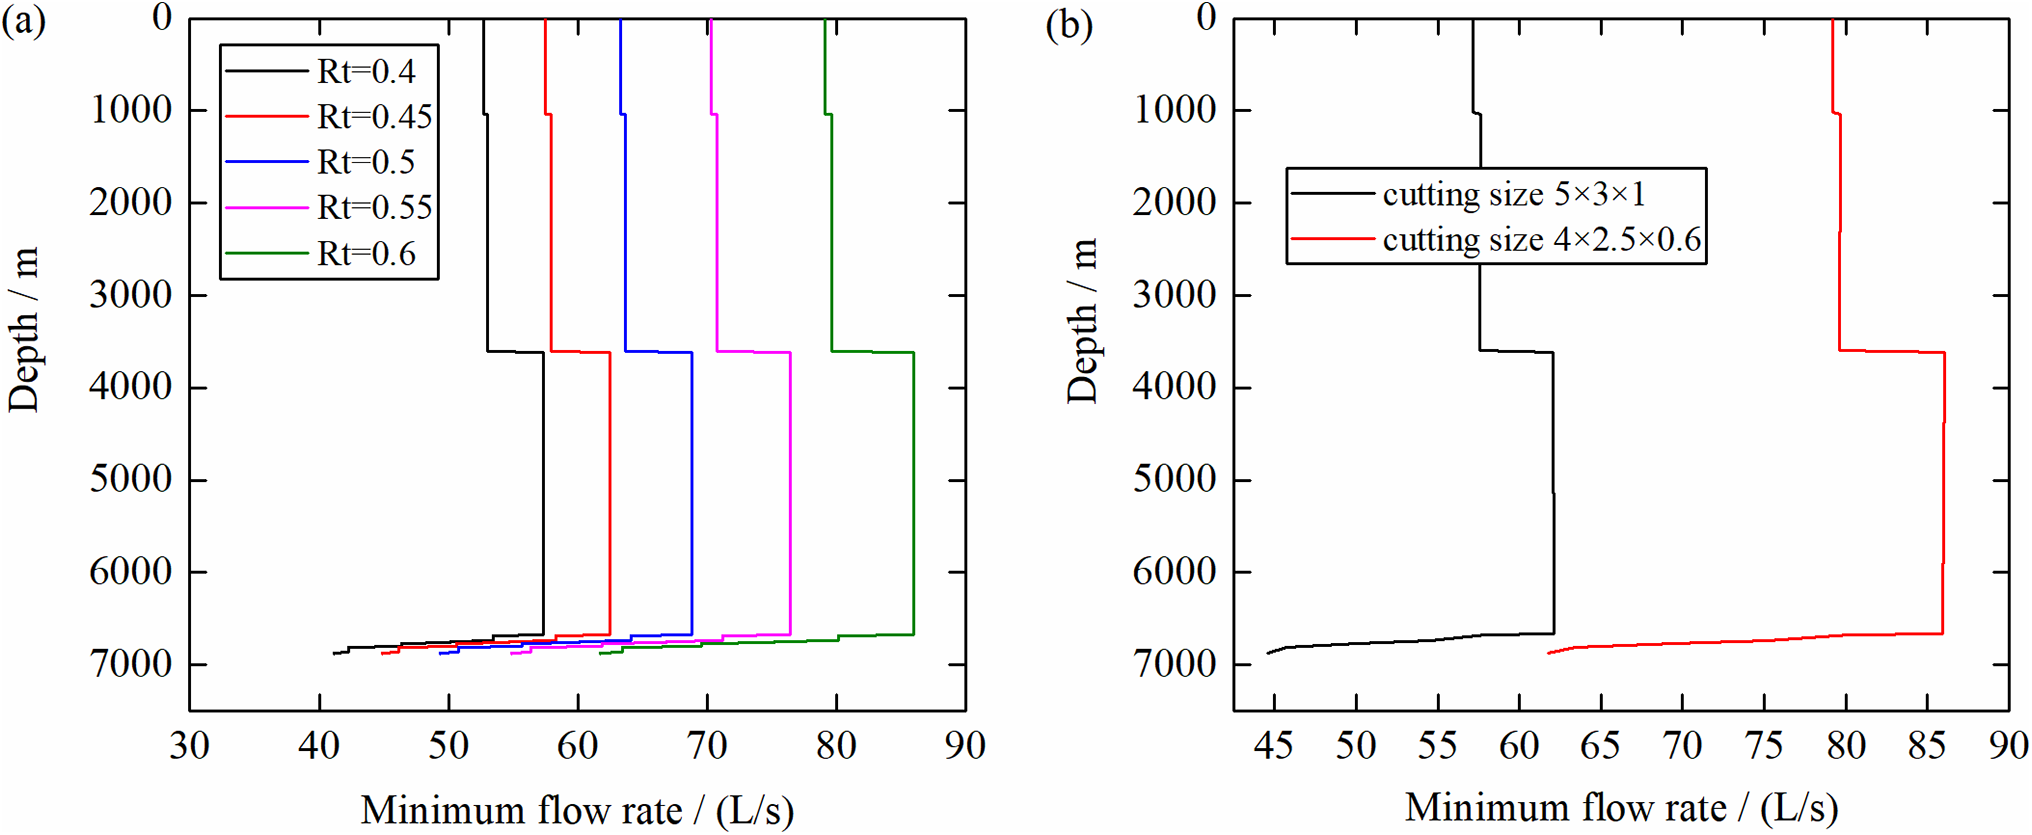
Figure 12: Minimum cuttings carrying flow rate required to achieve different conditions by using the method proposed in this study. (a) Minimum cuttings carrying flow rate required to achieve various levels of wellbore cleaning; (b) Minimum cuttings carrying flow rate required to achieve various levels of wellbore cleaning
Meanwhile, Wellplan suggests a minimum annular velocity of 0.367 m/s and an ideal velocity of 0.5 m/s, both of which are slightly less than the values obtained through our method. During field operations, the actual flow rate was recorded as 81 L/s, which corresponds to a wellbore cleanliness level for blocky cuttings, approximately ranging between Rt values of 0.55 and 0.6. The computed minimum cuttings carrying flow rate required for these conditions is 86 L/s. However, the calculated minimum flow rate notably drops to 62.11 L/s due to the higher proportion of 4.0 × 2.5 × 0.6 cm3 flake-like cuttings, suggesting that blocky cuttings necessitate a higher sand carrying capacity. This observation is aligned with the actual shape distribution of the debris returned from the wellbore during field operations.
A comparative analysis of the cuttings return phenomenon after the adjustment of rheological parameters is presented, contrasting the outcomes observed in the first and second groups. As illustrated in Fig. 13, the drilling fluid system of the first group exhibits power-law fluid characteristics with a consistency coefficient of 0.3015 Pa·sn and a flow behavior index of 0.7096. Conversely, the second group demonstrates a consistency coefficient of 0.4804 Pa·sn and a flow behavior index of 0.6525. Under identical carrying ratios, the computed cuttings settling velocities are 0.2311 and 0.2281 m/s for the first and second groups, respectively, indicating a more significant influence imparted by the alteration in the consistency coefficient in this adjustment.
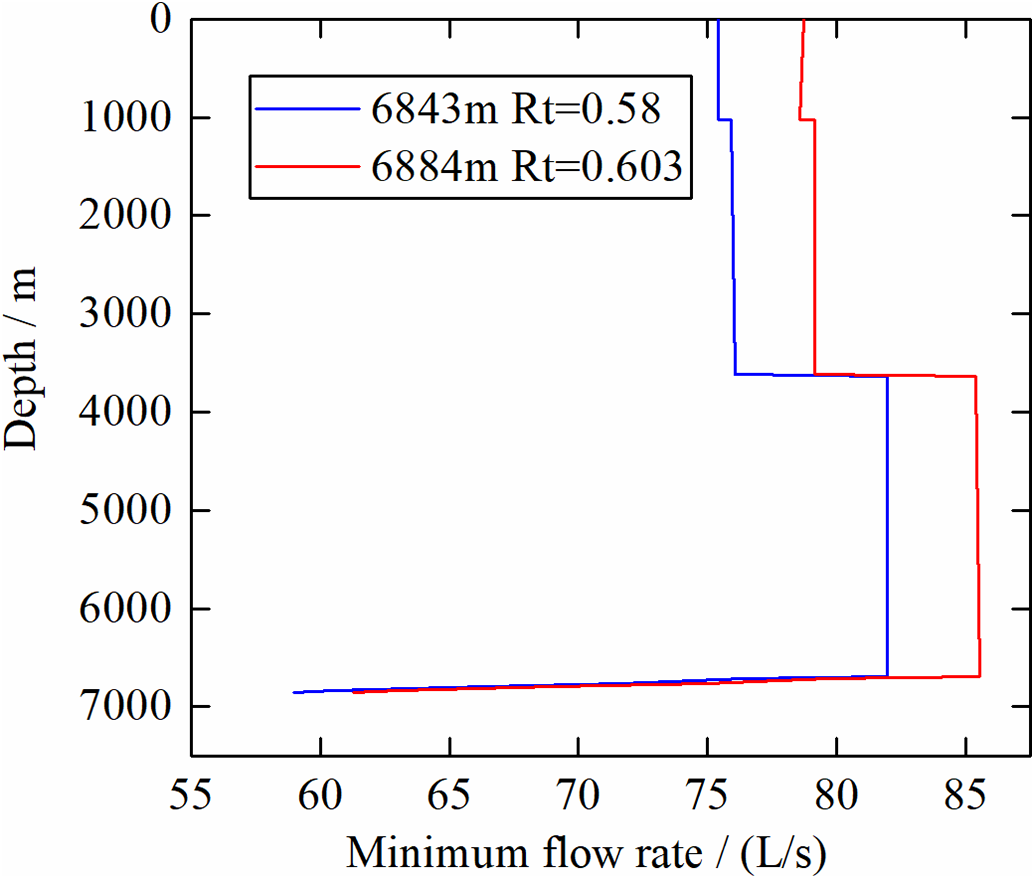
Figure 13: Evaluation of wellbore cleaning capability before and after rheological adjustment
With regard to drilling operations, the first group operates at a flow rate of 81 L/s, yielding a reverse-calculated Rt value of 0.58. By contrast, the second group operates at a flow rate of 85.4 L/s, resulting in a reverse-calculated Rt of 0.603. This difference suggests superior wellbore cleaning efficiency in the second group. Furthermore, when considering the volume of cuttings returned by heavy mud at a designated point, the first group exhibits a sand return volume of 1.1 m3, which surpasses the second group’s sand return volume of 0.6 m3. The calculation results are consistent with the cuttings returned results.
The ultra-deep well in Case 1 was continuously drilled to a depth of 7528 m. The composite casing (374.65 + 361.95 mm) was installed at 7418 m. The hole size for this drilling section was 323.85 mm. To guarantee wellbore cleanliness, a method that combined the use of heavy mud and sand lifting was employed to efficiently transport cuttings from the wellbore bottom to the surface. Therefore, to maximize wellbore cleanliness during drilling, the model was used to evaluate wellbore cleanliness under two different well conditions, providing recommendations for the minimum fluid displacement rate. The drill string assembly was as follows: Φ323.85 mm PDC bit + 168.3 mm heavyweight drill pipe + 203.2 mm drilling jar + 139.7 mm drill pipe + 149.2 mm drill pipe. The drilling fluid system was a white oil-based drilling fluid.
Table 5 presents the drilling fluid density, six-revolution reading, wellbore enlargement rate, and maximum size of returned cuttings when drilling to depths of 7528.2 and 7548 m. Based on our model, we back-calculated the cuttings carrying ratio in the wellbore under the current displacement rate and drilling fluid properties. Judging from the maximum size of returned cuttings, the second group is significantly larger than the first group. When drilling fluid properties exhibit no significant change, the second group can carry out larger cuttings, indicating higher cuttings carrying ratio and better wellbore cleanliness. In addition, in accordance with the recommended drilling fluid displacement rate range based on the minimum carrying ratio for large cuttings, which is 0.55 to 0.6 as calculated in Case 1, the first group does not meet this displacement rate requirement, while the second group does, as illustrated in Fig. 14. The red line represents the displacement rate adopted on-site, while the blue box indicates the recommended minimum displacement rate range. This finding further demonstrates the effectiveness of our proposed cuttings carrying ratio evaluation. Furthermore, based on the recommended carrying ratio range established in Case 1, we can recommend the appropriate displacement rate for different large wellbore sizes based on commonly used drilling fluid properties.
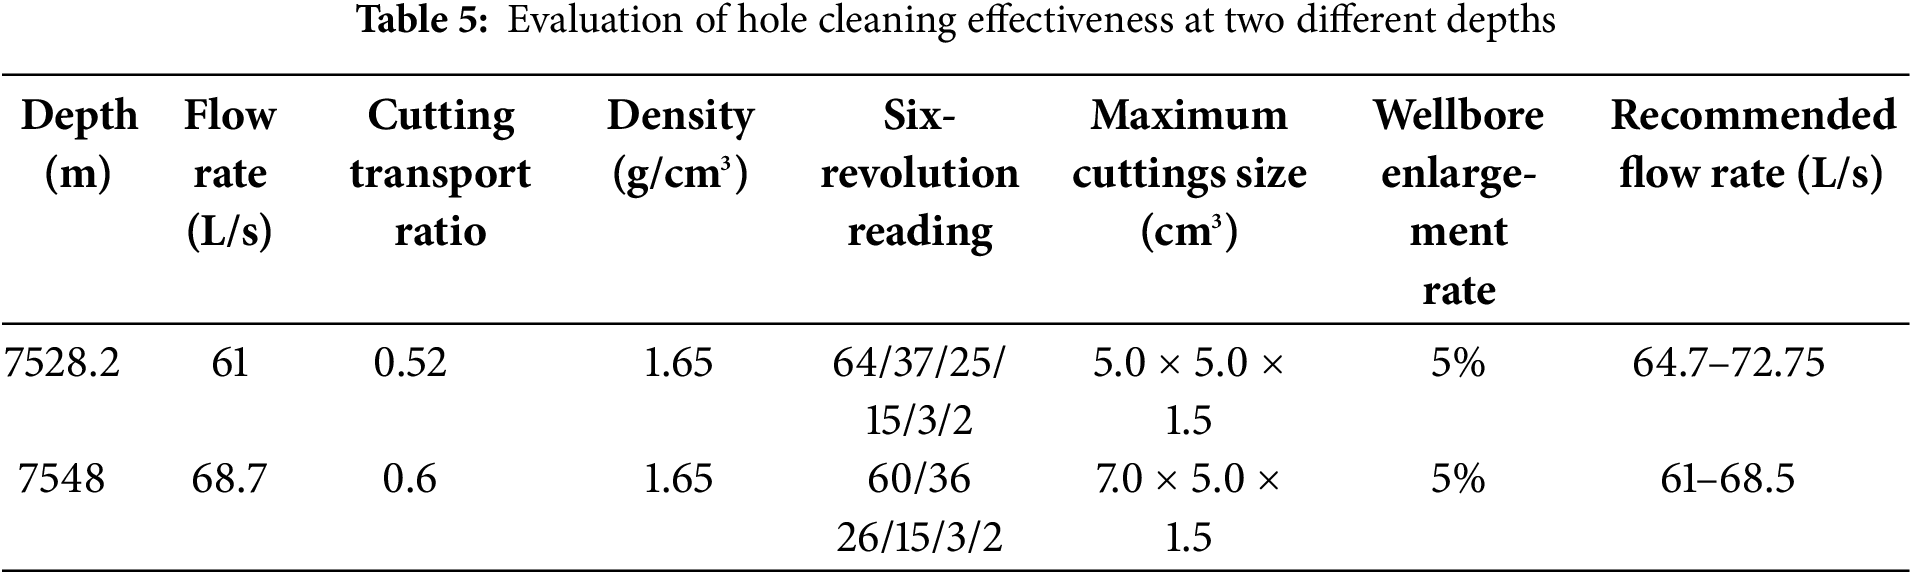
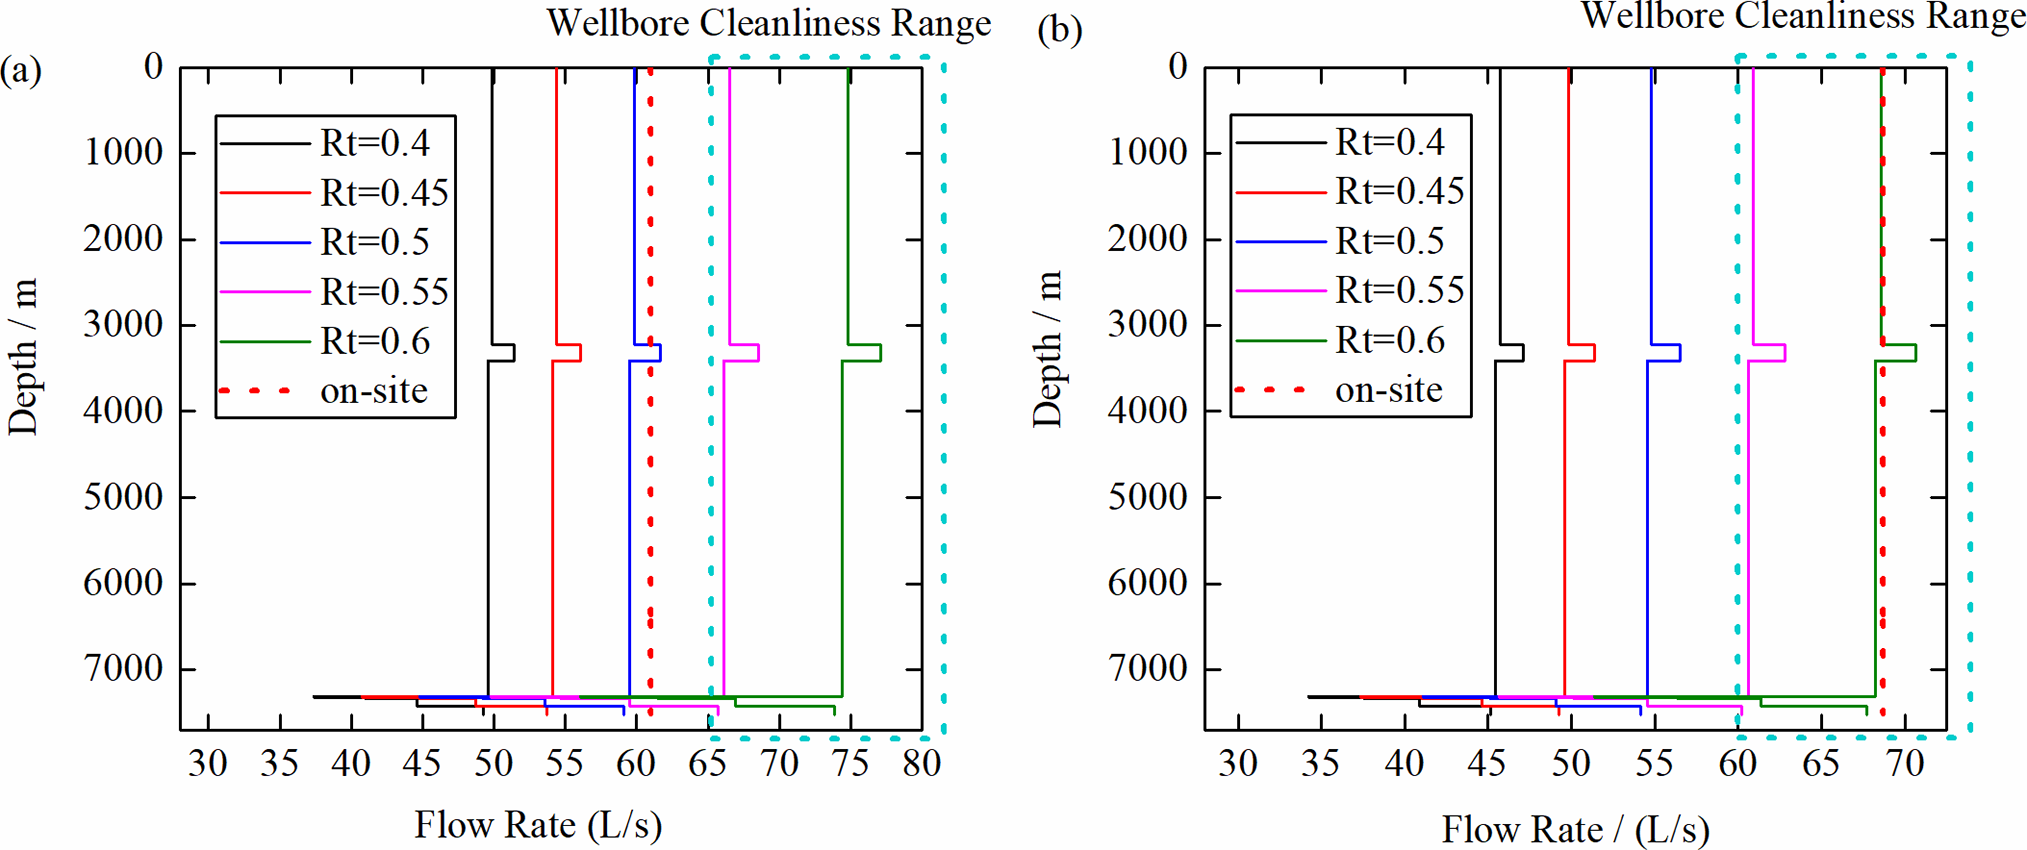
Figure 14: Displacement rate range that satisfies wellbore cleanliness. Recommended displacement for different transport efficiencies, with the basket representing the recommended minimum displacement range and the red dashed line representing the actual displacement used on-site. (a) 7528.2 m; (b) 7548 m
(1) Temperature and pressure in ultra-deep wells exhibit wide variation ranges, and these conditions exert a certain effect on the density of the drilling fluid, which, in turn, affects settlement velocity. Under the calculation conditions, the actual wellbore temperature and pressure can influence terminal settlement velocity by up to 3.4%.
(2) Cutting shape significantly influences settlement velocity, with higher annulus return velocity required for block-shaped cuttings compared with flake-like cuttings at the same carrying ratio. Terminal settlement velocity decreases with an increase in consistency coefficient, and the rate of increase slows down in the high-viscosity region. Wellbore size effect on minimum cuttings carrying displacement diminishes as size increases. For a Φ444.5 mm wellbore diameter, the recommended cuttings carrying ratio is at least 0.6.
(3) Using a cuttings concentration of <0.5% as a cleanliness criterion underestimates the minimum cuttings carrying displacement compared with the cuttings carrying ratio.
(4) This study primarily considers the vertical wellbore section and the power-law flow pattern. However, the settlement behavior of cuttings in other flow patterns, such as the Herschel–Bulkley and Casson flow patterns, the influences of temperature and pressure on rheological properties, and the effects of complex wellbore trajectories in highly deviated and horizontal wells, will be investigated in future work.
Acknowledgement: Not applicable.
Funding Statement: This work is partly supported by the National Natural Science Foundation of China (52304045), the Open Fund (PLN2023-40) of the National Key Laboratory of Oil and Gas Reservoir Geology and Exploitation (Southwest Petroleum University), and the Open Fund (2024-KFKT-08) of China National Petroleum Corporation Science and Technology Research Institute.
Author Contributions: The authors confirm their contributions to this paper as follows: study conception and design: Yuyao Li; analysis and interpretation of results: Mingjie Cai and Mingmin He; draft manuscript preparation: Shiqian Xu. All authors reviewed the results and approved the final version of the manuscript.
Availability of Data and Materials: The data will be available upon the request of readers.
Ethics Approval: Not applicable.
Conflicts of Interest: The authors declare no conflicts of interest to report regarding the present study.
Glossary
| BHA | The bottom-hole assembly |
| Cd | The drag coefficient for non-spherical particles |
| CTR | Critical transport rate/minimum cuttings-carrying flow (L/s) |
| d* | The dimensionless particle diameter |
| D, d | The inner and outer diameters of the flow space (m) |
| de | The equivalent volumetric diameter of a non-spherical particle (m) |
| ESD | Equivalent static density of drilling density (g/cm3) |
| g | The gravitational acceleration (m/s2) |
| K | The consistency coefficient of power-law fluid (Pa·sn) |
| kr | The wellbore enlargement rate (%) |
| M, N, P | Experimentally fitted values |
| n | Flow behavior index of power-law fluid |
| p, T | The wellbore pressure (MPa), temperature (°C) |
| p0 | The surface pressure (MPa) |
| PDC | Polycrystalline diamond compact drill bit |
| Q | Minimum flow rate (m/s) |
| r | The readings of the viscosimeter |
| R2 | Correlation coefficients |
| Rep | The particle Reynolds number |
| ROP | Rate of penetration (m/h) |
| RPM | Rotations per minute (r/min) |
| Rt | The cutting transport ratio |
| Sa | The surface area of a non-spherical particle (m2) |
| Se | The equivalent volumetric surface area of a sphere (m2) |
| T0 | Surface temperature (°C) |
| Va | The return flow velocity in the annulus (m/s) |
| Vm | Volume of rock debris (m3) |
| Vp | The terminal settling velocity of the particle (m/s) |
| Vrotational | The rotational speed (r/min) |
| WOB | Weight on bit (kN) |
| γ | The shear rate at the rotational speeds of the viscosimeter (s−1) |
| ξp, ξT, ξpp, ξTT, ξpT | Model regression coefficients |
| ρf | Density of the drilling fluid (kg/m3) |
| ρp | Density of the particle (density of rock) (kg/m3) |
| τ | The shear stress (Pa) |
| φ | Particle sphericity (%) |
| Ω(p,T) | The drilling fluid density that varies with temperature and pressure |
References
1. Trang H. Wellbore collapse failure criteria and drilling optimization [dissertation]. Stavanger, Norway: University of Stavanger; 2019. [Google Scholar]
2. Cai MJ, Luo X, Chen LL, He M, Peng H, He B. Ultra-large borehole drilling technologies of 10,000-meter-deep well SDCK1. Pet Drill Tech. 2024;52(2):87–92. doi:10.11911/syztjs.2024030. [Google Scholar] [CrossRef]
3. Cui Y, Qu Z, Zhao J, Wang P. Unified strength theory solution for wellbore collapse pressure considering size effect. J Guangxi Univ Nat Sci Ed. 2016;41(4):1153–61. doi:10.13624/j.cnki.issn.1001-7445.2016.1153. [Google Scholar] [CrossRef]
4. Yahya MN, Norddin MNAM, Ismail I, Rasol AAA, Risal AR, Yakasai F, et al. Graphene nanoplatelet surface modification for rheological properties enhancement in drilling fluid operations: a review. Arab J Sci Eng. 2024;49(6):7751–81. doi:10.1007/s13369-023-08458-5. [Google Scholar] [CrossRef]
5. Agarwal N, Chhabra RP. Settling velocity of cubes in Newtonian and power law liquids. Powder Technol. 2007;178(1):17–21. doi:10.1016/j.powtec.2007.04.002. [Google Scholar] [CrossRef]
6. Cheng NS. Comparison of formulas for drag coefficient and settling velocity of spherical particles. Powder Technol. 2009;189(3):395–8. doi:10.1016/j.powtec.2008.07.006. [Google Scholar] [CrossRef]
7. Terfous A, Hazzab A, Ghenaim A. Predicting the drag coefficient and settling velocity of spherical particles. Powder Technol. 2013;239(2):12–20. doi:10.1016/j.powtec.2013.01.052. [Google Scholar] [CrossRef]
8. Kamisli F. Rheological behavior of drilling muds and developing a rheological model. J Macromol Sci Part B. 2024;19:1–34. doi:10.1080/00222348.2024.2386771. [Google Scholar] [CrossRef]
9. Shah SN, El Fadili Y, Chhabra RP. New model for single spherical particle settling velocity in power law (visco-inelastic) fluids. Int J Multiph Flow. 2007;33(1):51–66. doi:10.1016/j.ijmultiphaseflow.2006.06.006. [Google Scholar] [CrossRef]
10. Sun X, Zhang K, Chen Y, Li W, Qu J. Study on the settling velocity of drilling cuttings in the power law fluid. Powder Technol. 2020;362:278–87. doi:10.1016/j.powtec.2019.11.025. [Google Scholar] [CrossRef]
11. Ezekiel EE. Experimental study of drilling mud rheology and its effect on cuttings transport [dissertation]. Trondheim, Norway: Norwegian University of Science and Technology; 2012. [Google Scholar]
12. Mahmoud H, Alhajabdalla M, Nasser MS, Hussein IA, Ahmed R, Karami H. Settling behavior of fine cuttings in fiber-containing polyanionic fluids for drilling and hole cleaning application. J Petrol Sci Eng. 2021;199:108337. doi:10.1016/j.petrol.2020.108337. [Google Scholar] [CrossRef]
13. Okesanya T, Kuru E, Sun Y. A new generalized model for predicting the drag coefficient and the settling velocity of rigid spheres in viscoplastic fluids. SPE J. 2020;25(6):3217–35. doi:10.2118/196104-PA. [Google Scholar] [CrossRef]
14. Xu Z, Song X, Li G, Pang Z, Zhu Z. Settling behavior of non-spherical particles in power-law fluids: experimental study and model development. Particuology. 2019;46(1):30–9. doi:10.1016/j.partic.2018.07.006. [Google Scholar] [CrossRef]
15. Zastawny M, Mallouppas G, Zhao F, van Wachem B. Derivation of drag and lift force and torque coefficients for non-spherical particles in flows. Int J Multiph Flow. 2012;39:227–39. doi:10.1016/j.ijmultiphaseflow.2011.09.004. [Google Scholar] [CrossRef]
16. Sun X, Sun M, Li Z. A novel prediction model of the drag coefficient of shale cuttings in Herschel–Bulkley fluid. Energies. 2022;15(12):4496. doi:10.3390/en15124496. [Google Scholar] [CrossRef]
17. Cheng Z, Li N, Ding X, Chen Y, Han X, Li T, et al. Evaluation and optimization method for hole cleaning effect in shallow extended-reach wells. J Xi’an Shiyou Univ Nat Sci Ed. 2022;37(6):60–6 96. [Google Scholar]
18. Li Q, Wen L, Sun G, Wen X. Development and application of borehole cleaning model with practicality and simplicity in highly-deviated well. Sci Tech and Eng. 2014;14(9):155–9. [Google Scholar]
19. Crowe CT. Multiphase flow handbook (mechanical and aerospace engineering series). 1st ed. Boca Raton, FL, USA: CRC Press; 2005. [Google Scholar]
20. Kutasov IM. Water FV factors at higher pressures and temperatures. Oil Gas J. 1989;87(12):102–4. [Google Scholar]
21. Xu Z, Song X, Li G, Liu Q, Pang Z, Zhu Z. Predicting fiber drag coefficient and settling velocity of sphere in fiber containing Newtonian fluids. J Petrol Sci Eng. 2017;159(4):409–18. doi:10.1016/j.petrol.2017.09.046. [Google Scholar] [CrossRef]
22. Huang B, Li X, Fu C, Wang Y, Cheng H. Study rheological behavior of polymer solution in different-medium-injection-tools. Polymers. 2019;11(2):319. doi:10.3390/polym11020319. [Google Scholar] [PubMed] [CrossRef]
23. Yang LL, Li B, Chen XD, Yu L, Jing FM, Zhang D. Experimental and numerical study of the rheological characteristics and flow law of water-based drilling fluids in high-temperature and high-pressure wellbores. J Hydrodyn. 2024;36(5):954–67. doi:10.1007/s42241-024-0062-2. [Google Scholar] [CrossRef]
Cite This Article
 Copyright © 2025 The Author(s). Published by Tech Science Press.
This work is licensed under a Creative Commons Attribution 4.0 International License , which permits unrestricted use, distribution, and reproduction in any medium, provided the original work is properly cited.
 Downloads
 Citation Tools