
 Submit a Paper
 Propose a Special lssue
 Open Access
ARTICLE

Development of an Index System for the Optimization of Shut-In and Flowback Stages in Shale Gas Wells
1 Shale Gas Research Institute, PetroChina Southwest Oil & Gasfield Company, Chengdu, 610051, China
2 Shale Gas Evaluation and Exploitation Key Laboratory of Sichuan Province, Chengdu, 610051, China
* Corresponding Author: Ziqin Lai. Email:
Fluid Dynamics & Materials Processing 2025, 21(6), 1417-1438. https://doi.org/10.32604/fdmp.2025.060956
Received 13 November 2024; Accepted 21 March 2025; Issue published 30 June 2025
 View Full Text
 Download PDF
Abstract
In the context of post-stimulation shale gas wells, the terms “shut-in” and “flowback” refer to two critical phases that occur after hydraulic fracturing (fracking) has been completed. These stages play a crucial role in determining both the well’s initial production performance and its long-term hydrocarbon recovery. By establishing a comprehensive big data analysis platform, the flowback dynamics of over 1000 shale gas wells were analyzed in this work, leading to the development of an index system for evaluating flowback production capacity. Additionally, a shut-in chart was created for wells with different types of post-stimulation fracture networks, providing a structured approach to optimizing production strategies. A dynamic analysis method for flowback was also developed, using daily pressure drop and artificial fracture conductivity as key indicators. This method offers a systematic and effective approach to managing the shut-in and flowback processes for gas wells. Field trials demonstrated significant improvements: the probability of sand production was reduced, gas breakthrough time was extended, artificial fracture conductivity was enhanced, and the average estimated ultimate recovery (EUR) per well increased.Keywords
Shale gas is a pivotal contributor to gas production growth in many countries. As an example, in 2023, the country’s shale gas production in China reached 250 × 108 m3, with over 95% sourced from a marine shale-dominated region [1,2]. After more than 10 years of exploration and development, commercial shale gas development has been realized in mid-deep shale shallower than 3500 m [3–5]. A shale gas production capacity of 50 × 108 m3/a had been built in 2020 in its main part of Changning (CN) shale gas field, a typical mid-deep shale [6], with a production of 5.21 × 10⁸ m3 in 2023. Currently, more than 540 wells have been put into production, with gas production of 1191 × 104 m3/d, the average estimated ultimate recovery (EUR) of wells is 1.1 × 10⁸ m3, and the cumulative gas production of 315.7 × 10⁸ m3.
Shale gas wells are stimulated with large-scale hydraulic fracturing, and their high and stable production is mainly realized by the post-stimulation fracture network. Affected by high burial depth, high temperature and high pressure, the post-stimulation fracture network is highly stress-sensitive [7–9]. The proppants supporting the permeability of the fracture network are prone to migration, crushing and embedding in the initial production stage due to unreasonable production pressure differences, which causes serious damage to the long-term production capacity of gas wells [10–12]. Reasonable initial production of gas wells is very important.
Initial production of post-stimulation shale gas wells is divided into shut-in (dissolving bridge plug and communicating fracture network), flowback (rapid drainage of near-wellbore frac fluids to evaluate gas well productivity), and water drainage and gas production (reasonable production allocation and stable production) [13–15]. The shut-in phase occurs when the well is temporarily closed at the wellhead, preventing any flow of gas or fluids. This period allows pressure to build up within the formation and facilitates the redistribution of fracturing fluids within the newly created fractures. One of the key objectives of shutting in the well is to enhance gas desorption from the shale matrix into the fractures, which can improve the overall productivity of the well once it is opened. Once the shut-in phase is complete, the well is opened to initiate the flowback process. Flowback refers to the return of injected fracturing fluids to the surface, often accompanied by the formation water, hydrocarbons, and dissolved gases. The primary goal of this phase is to clean up the wellbore by removing excess fluids while allowing natural gas or oil to start flowing. The rate at which flowback is managed is critical, as an excessively aggressive approach can cause proppant displacement, potentially leading to fracture closure and reduced permeability. Conversely, a controlled flowback process ensures that fractures remain open, optimizing long-term gas production. The duration of the flowback period depends on factors such as reservoir pressure, fluid viscosity, and the amount of injected fracturing fluid that needs to be recovered. Typically, it lasts anywhere from a few days to several weeks. The relationship between shut-in and flowback is complex, and scholars hold different views on the shut-in method. Yaich et al. found that shut-in is beneficial to 75% of wells through analysis of Marcellus shale gas wells and suggested that it is difficult to increase production significantly only by build-up of formation energy. They did not explain the reasons for the high yield after shut-in. Makhanov et al. presented that imbibition in shale during shut-in contributes to the migration of free gas. Wijaya N et al. believed that flowback first is helpful to improve the relative permeability and proposed that flowback should be carried out immediately following hydraulic fracturing [16–18]. The above studies show that there is still controversy in the effects of shut-in on fracturing flowback of shale gas wells by field data analysis, and it is rare to analyze the shut-in decision and the shut-in time by the geological method. In addition to the shut-in, frac fluid inhibition in shale reservoirs, massive frac fluid retention in shale, and possible damage to shale reservoirs are also studied. In the current study, it is suggested that the water phase is difficult to flow back and remains in micro-fractures under the combined action of many factors such as capillary force, percolation pressure, hydration force, hydrogen bond force, van der Waals force, surface adsorption of micro-fractures and gas breakthrough. You et al. carried out a core mechanics experiment and suggested that shale hydration can induce fracture initiation and communication with micro-fractures. Yang Hai et al. carried out a two-phase flow experiment and concluded that the retained frac fluid plays a role in liquid propping in the micro-fracture network of shale reservoirs, and the gas permeability is not a monotone function of water saturation, and there is an optimal flowback rate to maximize the gas permeability. Currently, shale hydration and liquid propping are basically not considered in numerical simulation, resulting in a large difference between the numerical simulation result and the actual production data [19,20]. To sum up, a lot of efforts have been put into the experimental analysis and numerical simulation of post-stimulation shut-in and flowback in shale gas wells, and a complete process of simulating fracturing flowback in shale gas wells has not been established. It is difficult to provide a solution to the problems in post-stimulation flowback and illustrate the geological factors of fracturing flowback in shale gas wells.
Thus, it is needed to carry out an analysis of the characteristic flow mechanism of post-stimulation shut-in and flowback of shale gas wells through laboratory experiments, mechanism analysis, big data analysis and numerical simulation, to find out the mechanism and factors affecting the high and stable production of gas wells, design and formulate the optimal production plan and provide support for sustained and stable production of gas wells.
2 Dynamic Characteristics of Shut-In and Flowback of Shale Gas Wells
2.1 Typical Curves of Flowback of Shale Gas Wells
At the initial flowback stage of shale gas wells, the frac plugs are usually drilled. According to pressure and production before and after drilling plugs, production of gas wells before and after flowback (Fig. 1) is divided into: (1) shut-in, with continuous pressure drop and pressure inflection; (2) flowback before drilling plugs, with increasing the chokes step by step, the continuous pressure decline, and low gas production or no production; (3) flowback with peak pressure after drilling plugs, increased gas production, gradual increase of gas-liquid ratio, and continuous pressure to the peak pressure; (4) flowback after the peak pressure, with stable gas and fluid production after the peak production, and stable decline of the wellhead pressure.
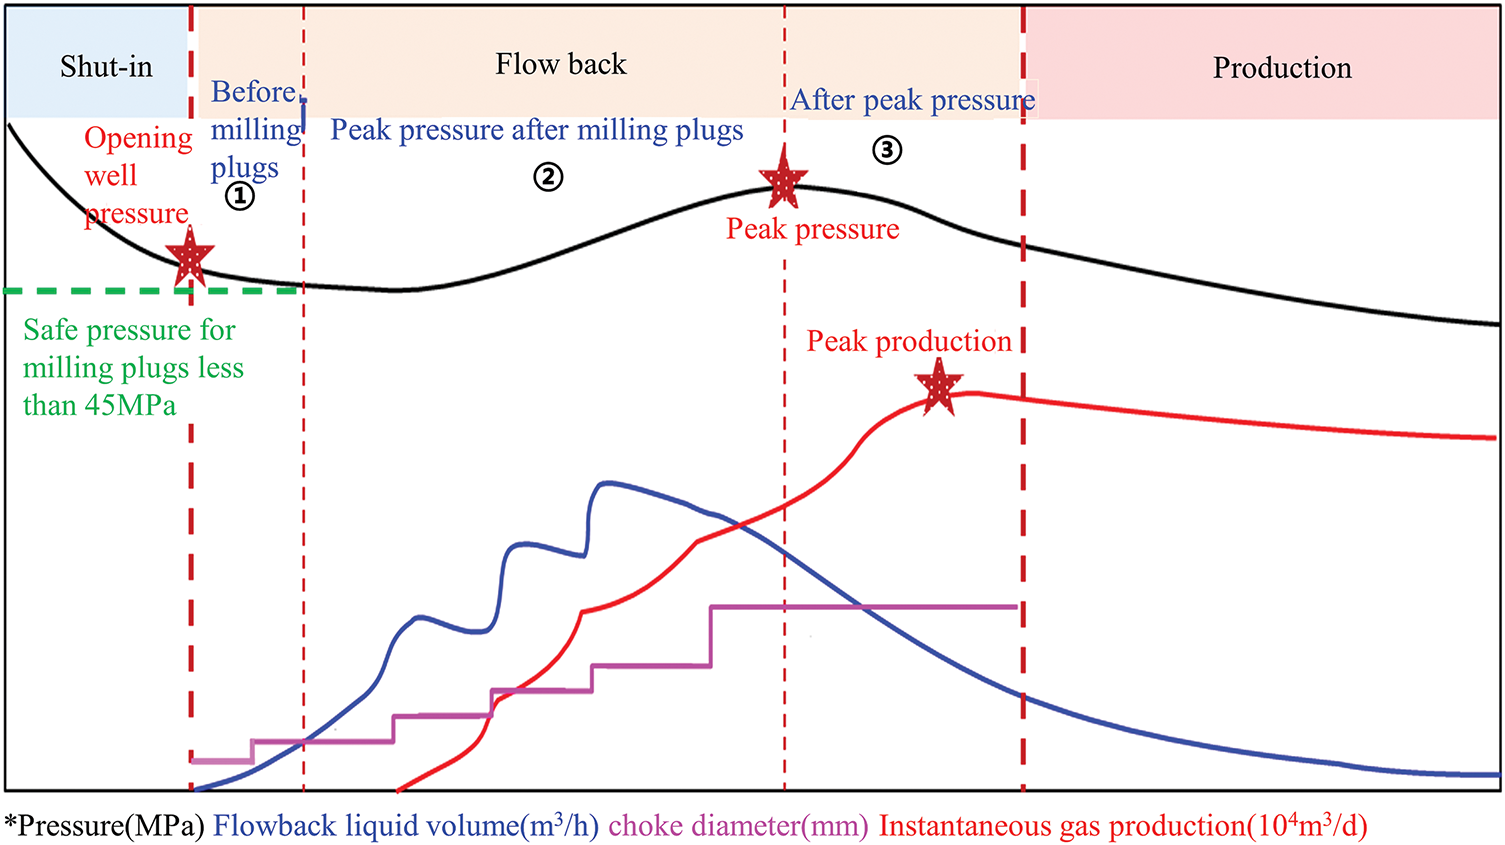
Figure 1: Shale gas flowback stage division
2.2 Difference of Flowback Indexes and Characteristic Curve of Shale Gas Wells
Calculation of flowback indexes of more than 1000 shale gas wells shows that there are obvious differences in 5 of 10 flowback indexes, ranging from 15% to 90%. For mid-deep and deep blocks, there are small differences in the gas breakthrough time, the flowback rate at gas breakthrough time, the flowback rate at peak production time, and large differences in the opening well pressure, peak pressure and peak production, with an average difference of 52% (Fig. 2).
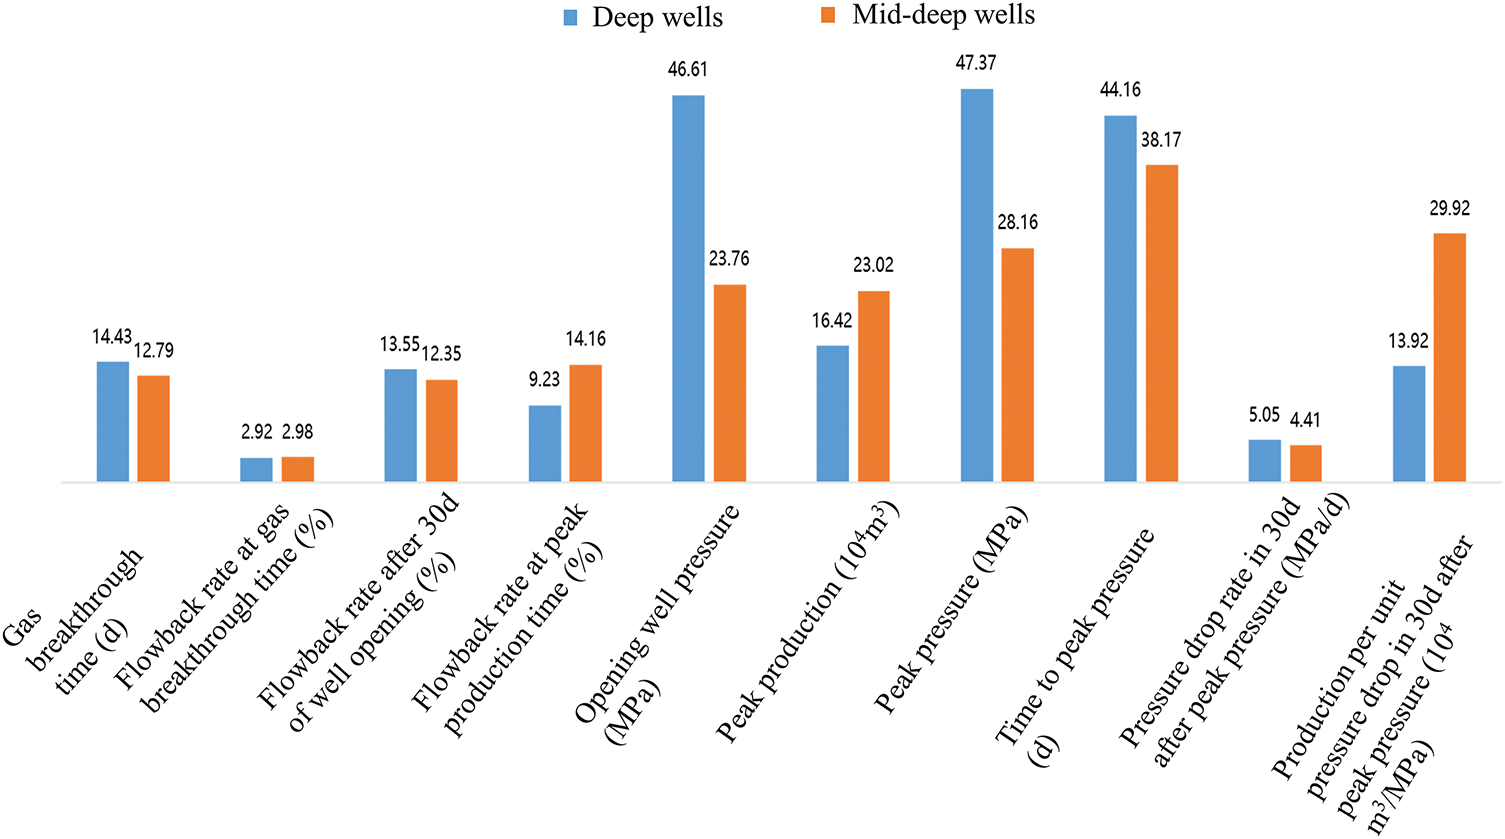
Figure 2: Distribution of flowback indexes of deep and mid-deep gas wells
2.2.1 Large Difference of Flowback Indexes of Mid-Deep Shale Gas Wells
Peak pressure, peak production and gas production per unit pressure drop have a good correlation with the EUR of gas wells, and they can be used as evaluation indexes of flowback effect. Compared with mid-deep gas wells, deep gas wells show the characteristics of high pressure and low yield, with 62% higher peak pressure, 30% lower peak production, and 52% lower gas production per unit pressure drop (Fig. 3).
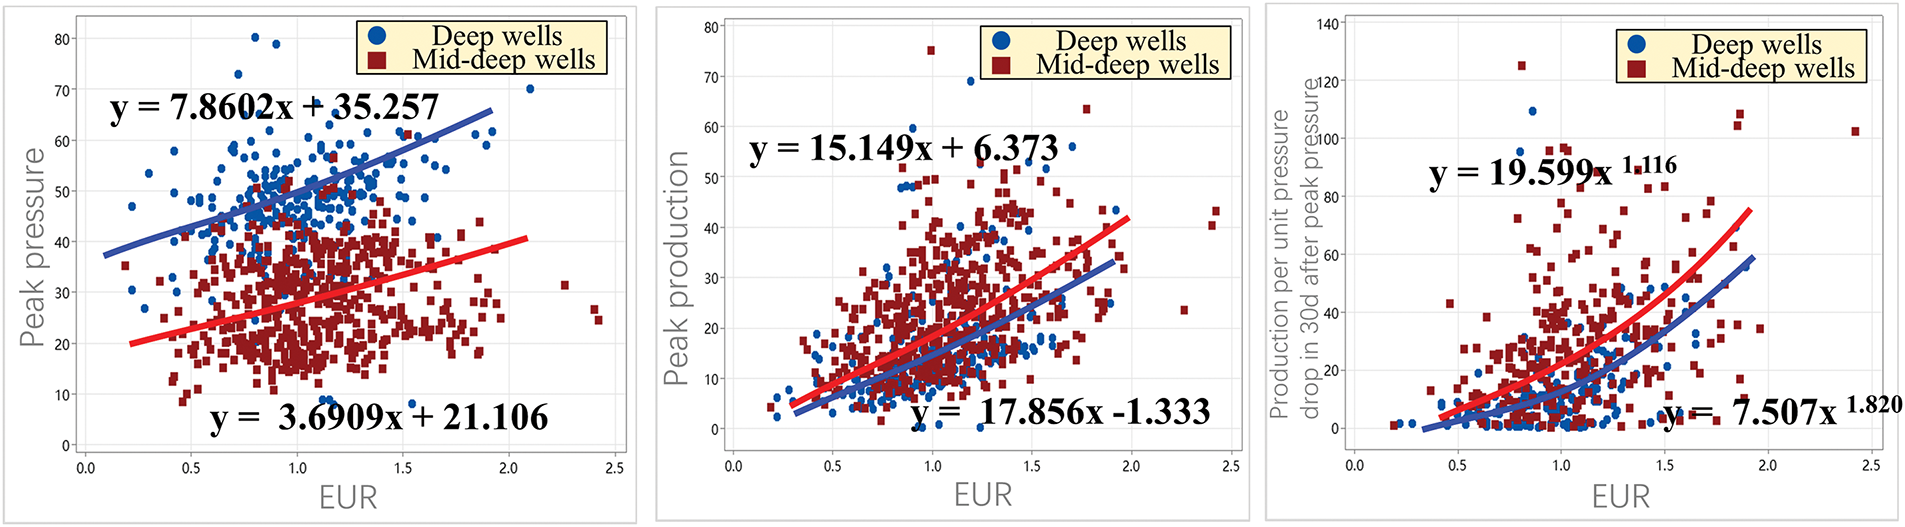
Figure 3: Scatter plots of peak pressure, peak production, gas production per unit pressure drop and EUR of deep and mid-deep shale gas wells
2.2.2 Mid-Deep Open Flow Wells Show the Characteristics of “High Peak Pressure, High Peak Production and Low Yield per Unit Pressure Drop” and High Water-Gas Ratio and Flowback Rate
Compared with controlled pressure gas wells, the open flow gas wells have about 16% higher peak pressure, generally higher than 29 MPa. At the flowback stage, the open flow gas wells have larger chokes, and about 72% higher peak production, generally higher than 25 × 104 m3/d, and about 10% lower gas production per unit pressure drop, generally less than 27 × 104 m3/MPa (Fig. 4).
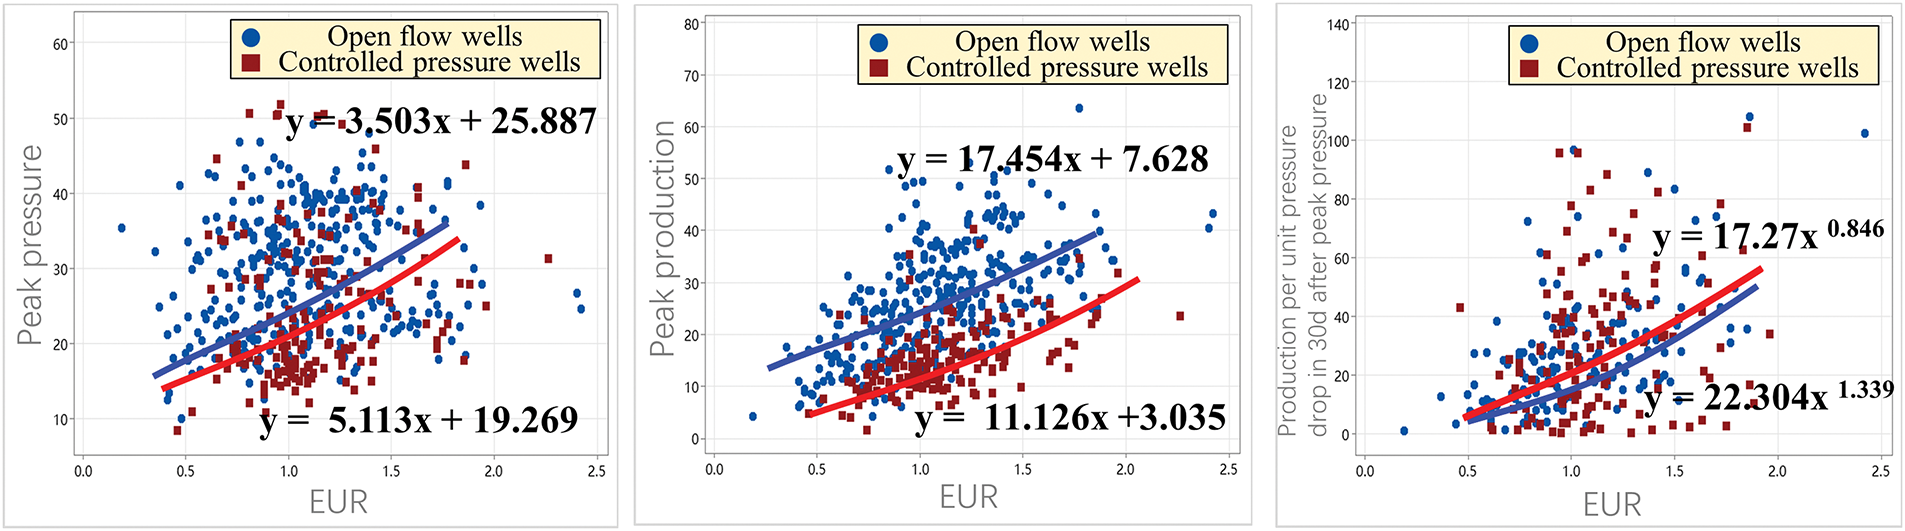
Figure 4: Scatter plots of peak pressure, peak production, gas production per unit pressure drop and EUR of mid-deep open flow and controlled pressure shale gas wells
The water-gas ratio decreases rapidly at the early stage and slowly at the later stage. The water-gas ratio of controlled pressure wells decreases slowly and inflection occurs earlier. Decrease of the water-gas ratio of mid-deep controlled gas wells and open flow wells slows down after 8 and 14 d of well opening, respectively, and tends to be consistent after 17 d (Fig. 5).
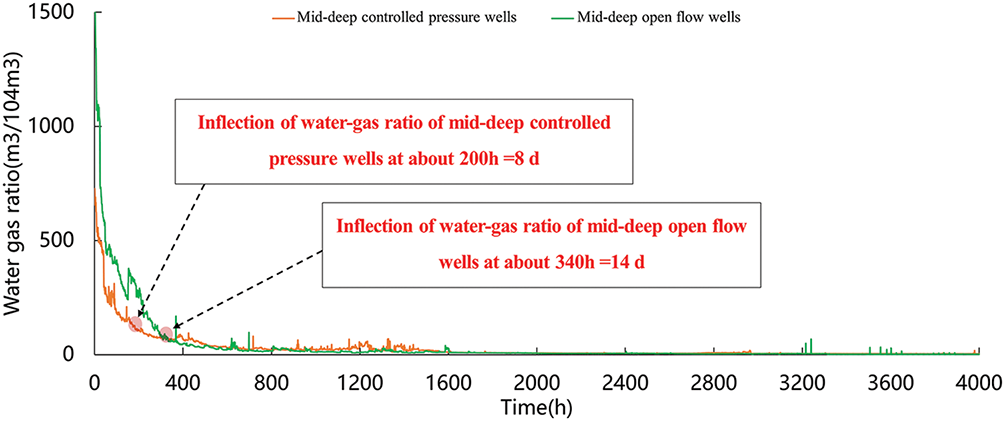
Figure 5: Curves of water-gas ratio in mid-deep controlled pressure and open flow gas wells
2.2.3 Deep Controlled Pressure Well Show the Characteristics of “High Peak Pressure, Low Peak Production and Low Yield per Unit Pressure Drop” and High Water-Gas Ratio and Flowback Rate
Compared with mid-deep controlled gas wells, deep controlled pressure gas wells have about 47% higher peak pressure, generally greater than 47 MPa, the choke diameter within 8 mm, about 12% lower peak production, generally less than 13 × 104 m3/d, 52% less gas production per unit pressure drop, generally less than 15 × 104 m3/MPa (Fig. 6).
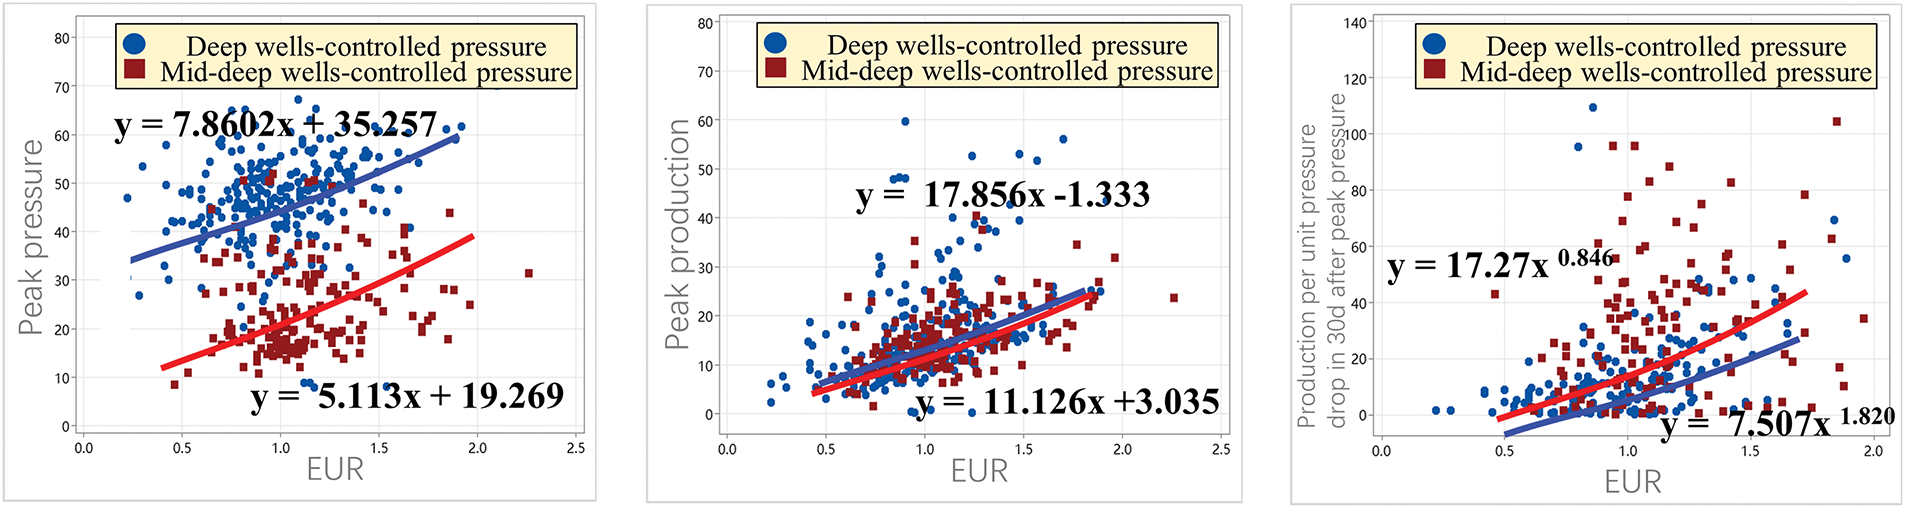
Figure 6: Scatter plots of peak pressure, peak production, gas production per unit pressure drop and EUR of mid-deep and deep controlled pressure shale gas wells
The water-gas ratio decreases rapidly at the early stage and slowly at the later stage, and it declines rapidly in deep wells and inflection occurs late. The water-gas ratio of deep controlled pressure gas well slows down after 14 d of well opening, and the water-gas ratio surged after about 25 d of frac hit, which does not comply with the general characteristics (Fig. 7).
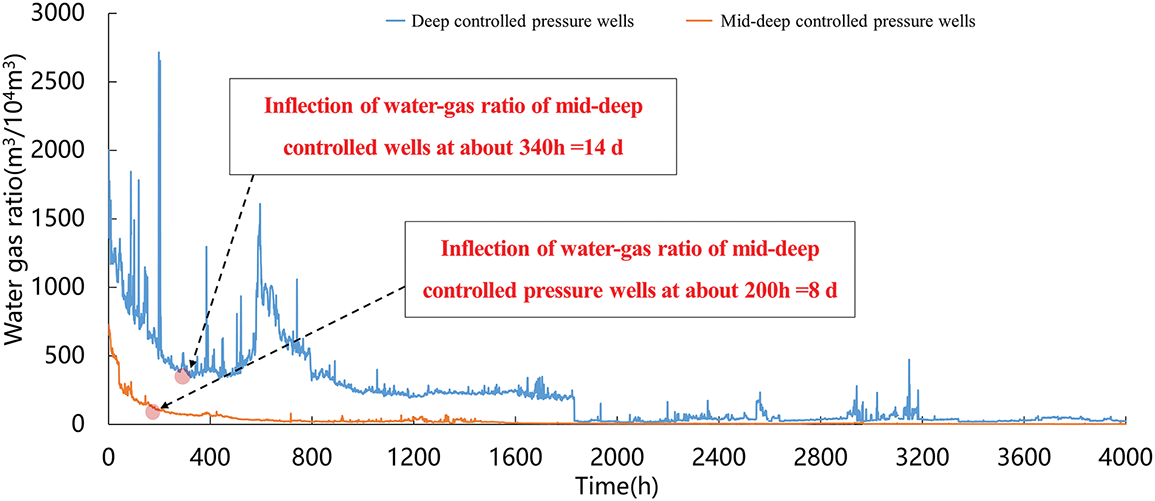
Figure 7: Curves of water-gas ratio in deep and mid-deep controlled pressure gas wells
According to statistics of key indexes at the flowback stage of mid-deep open flow and controlled pressure gas wells and deep controlled pressure gas wells, a typical chart (Fig. 8) was established, which provides a basis for real-time tracking and comparative analysis of mid-deep gas wells.
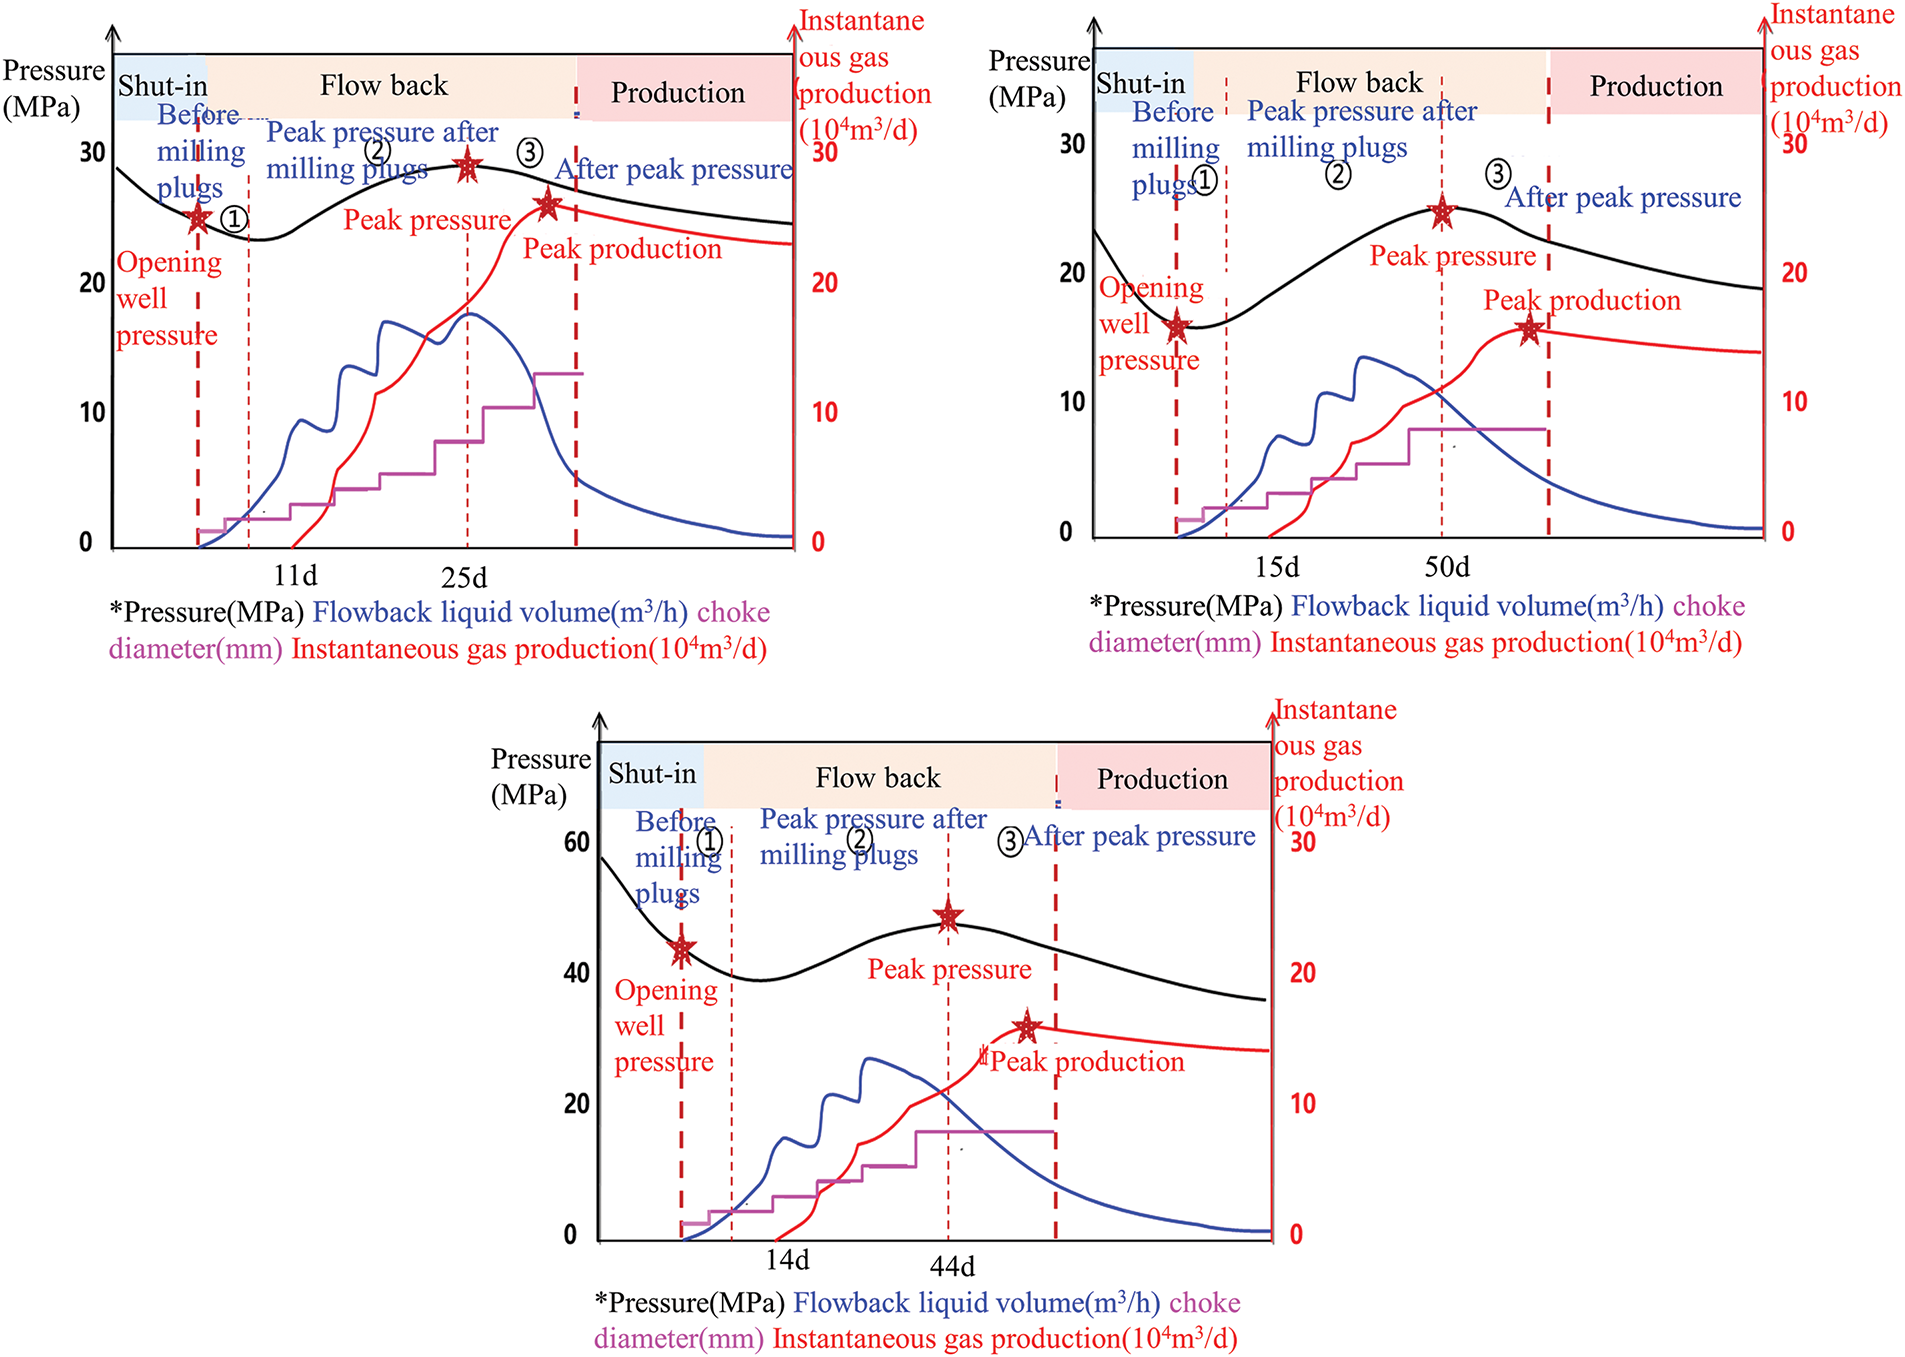
Figure 8: Typical flowback curves of mid-deep open flow and controlled pressure wells and deep controlled pressure wells
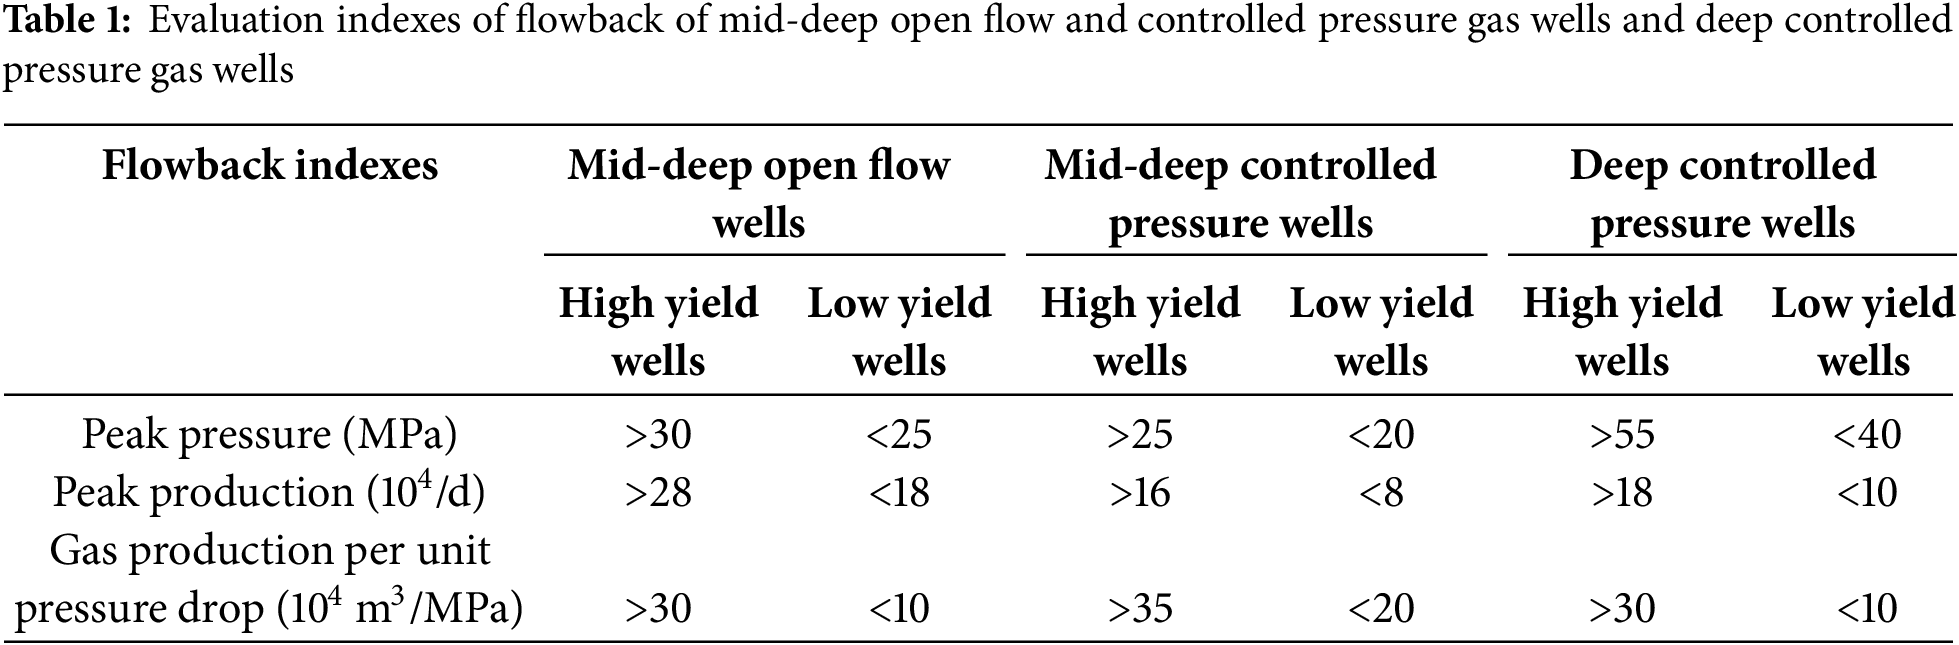
Table 1 establishes an evaluation index system of flowback effects of high yield wells (EUR > 1.50 × 10⁸ m3) and low yield wells (EUR < 100 × 108 m3), providing reference for the analysis of flowback characteristics and productivity evaluation of gas wells.
3 Interpretation Model of Pressure Drop in Shut-In Wells and Design of Shut-in Scheme
3.1 Model of Pressure Drop in Shut-In Wells Considering Gas-Liquid Displacement
Shale gas reservoirs are developed by the multistage hydraulic fracturing technology. The injected frac fluid in the major fracture continues to communicate with the complex natural fracture. The major is fracture is propped by proppants, the communicated natural fractures are propped by frac fluid, and some frac fluids leak off into the matrix. At the shut-in stage after stopping pumps, frac fluids flow in the triple medium of major fracture, secondary fracture and matrix, and the permeability of the major and secondary fractures is much higher than that of the matrix. Shale gas mainly occurs in natural fractures and pores in a free state and in the surface of rock particles and pores in the reservoir in an adsorbed state, and the adsorbed gas is desorbed to free gas as the reservoir pressure drops [21–24]. The model is a dual-pore and dual-permeability model with the major and secondary fractures as the main flow channels and the matrix as the main gas storage medium.
The shale gas multistage hydraulic fracturing shut-in model mainly includes horizontal wellbore, hydraulic major fracture, secondary natural fractures and matrix. The horizontal wellbore is in the lateral center of the model, and the main hydraulic fracture extends perpendicular to the wellbore, the secondary fractures are perpendicular to the major fracture, and the secondary fractures are generally natural fractures communicating with the major fracture. Frac fluid is injected into the major fracture through the horizontal wellbore and flows into the secondary fractures. There is a process of gas and water channeling between major and secondary fractures and between the matrix systems. Frac fluid in the major and secondary fracture system leak off into the matrix, and shale gas is replaced from the matrix [25–27]. The major fracture is mainly propped by proppants and secondary fractures are propped by frac fluids. The physical model of the wellbore-fracture-matrix system is shown in Fig. 9, and the mass transfer process is shown in Fig. 10.
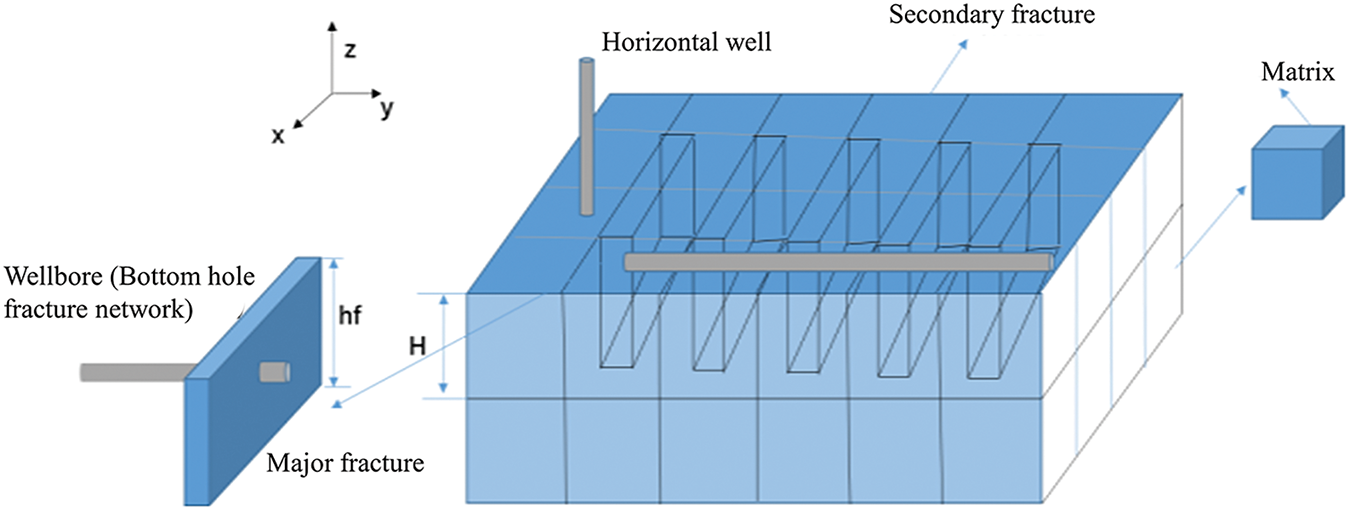
Figure 9: Schematic of physical model of a shale gas fractured horizontal well
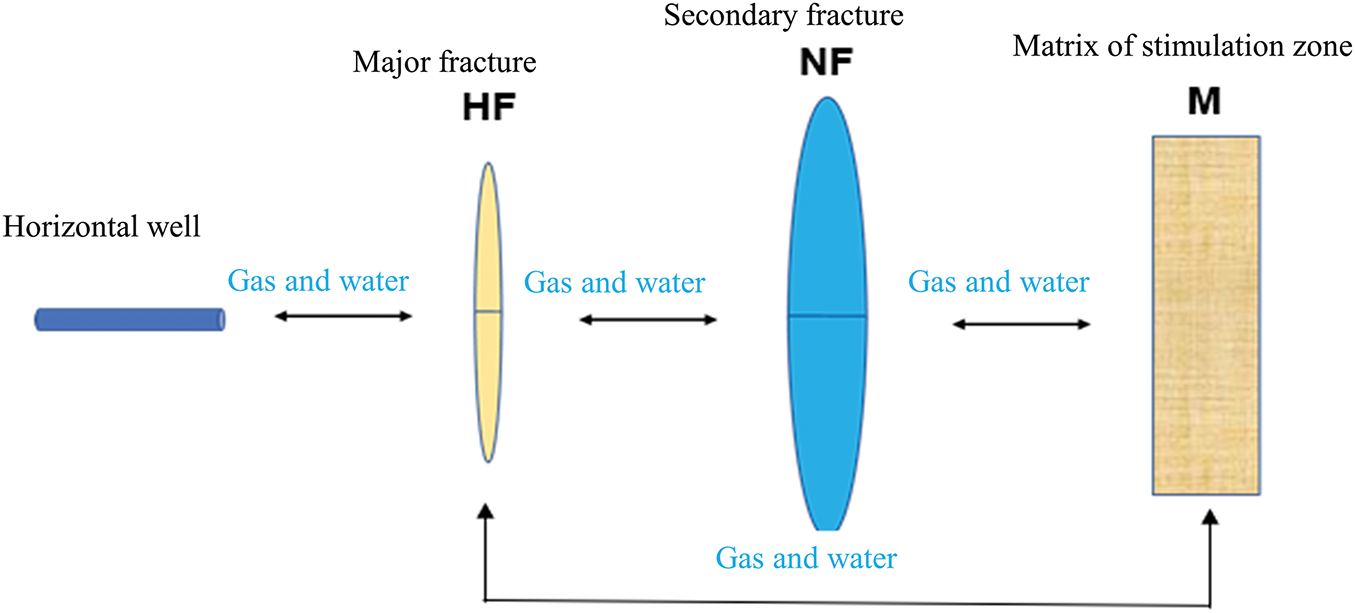
Figure 10: Schematic of mass transfer process during shut-in
Assumptions: 1. the shale gas well fracturing model is composed of horizontal wellbore, major fracture, secondary natural fractures and matrix system; 2. the shale gas well fracturing zone is a dual-pore and double-permeability model; 3. gas-water dual-phase flow and isothermal seepage are considered; 4. the stress sensitivity the permeability and porosity of the matrix system and fracture system is considered; 5. the major fracture is regarded as a symmetric vertical fracture in the wellbore, and the fracture height extends through the reservoir; 6. the effects of frac fluid imbibition and displacement with reservoir fluids are considered.
Shale gas reservoirs are different from conventional reservoirs. Numerical simulation in this study considers complex the physical and chemical processes in shut-in of shale gas wells, including gas-liquid relative permeability, capillary force, shale gas adsorption and desorption, and stress sensitivity. A two-phase (gas and water) and multi-media (matrix M, major fracture HF, secondary fracture NF) fracturing shut-in model was established [28–30].
(1) Gas-liquid relative permeability
The relative permeability of the matrix system determines the flow capacity of gas and liquid phases. The relative permeability of the matrix system is measured by the relative permeability experiment. Due to the high conductivity of the major fracture system, only gravity is considered. The relative permeability of the secondary fracture system is expressed as:
where Swc—initial water saturation; Sg—gas saturation; μw—water phase viscosity, mPa·s; μg—gas phase viscosity, mPa·s.
(2) Capillary force
The capillary force is value of the non-wetting phase pressure subtracted by the wetting phase pressure and is expressed as the difference between pressure of two phases. The shale gas reservoir has low porosity and permeability, and a large capillary force which is in-negligible. The permeability of the major and secondary natural fractures is much higher than the matrix permeability, and the capillary force of the fracture system is negligible. The capillary force is expressed as:
where Pg,F—gas phase pressure of the major fracture, MPa; Pw,F—water phase pressure of the major fracture, MPa; Pg,f—gas phase pressure of secondary fractures, MPa; Pg,m—gas phase pressure of the matrix, MPa; Pw,m—water phase pressure of the matrix, MPa; Pc,m—capillary force of the matrix, MPa.
(3) Stress sensitivity
When the effective stress of strata changes, both effective porosity and permeability of the shale reservoir change, and they are not constant. This property is regarded as stress sensitivity.
The effective pressure is the difference between the overlying rock pressure and pore pressure. When the effective pressure increases, the reservoir permeability and porosity decrease. In actual fracturing operation, the overlying rock pressure is generally considered as a constant. The effective pressure is only related to the pore pressure, and change of pore pressure causes change of the reservoir permeability and porosity, and this relationship is expressed as follows:
where
The model was established with IMEX module of CMG. The model consists of matrix (M), hydraulic fracture (HF) and secondary fractures (NFs). The typical shut-in pressure drop characteristic curve is fitted by adjusting parameters of major and secondary fractures. The shape of shut-in pressure drop characteristic curve in this well zone is different from the typical W shape of CN Block, and it is a relatively gentle V shape and rapid pressure drop. The fitting results show that the model is a simple fracture model with rare secondary fractures, and the flow dynamics of 150 d shut-in was simulated. Then, simulation of gas-water displacement, pressure field change and sensitive factors of the pressure drop characteristic curve of the fracture system and the matrix were simulated.
Setting of the numerical model parameters is based on the fracturing operation and reservoir parameters of fractured horizontal wells in this well zone: a five-stage fractured horizontal well model with a size of 300 m × 212 m × 40 m, and a 296 m long lateral wellbore in the middle, fracturing from toe end to heel end, injection of 2 h in each stage with 5 clusters, a total injection volume of 8225 m3, shut-in for 150 d after injection, the major fracture with the half-length of 78 m and symmetrically distributed around the lateral wellbore, secondary fractures evenly distributed perpendicular to the major fracture direction, and the small secondary fracture density. This simulates the pressure drop in the case of simple fractures. The shale gas reservoir is a dry gas reservoir, and the phase change of shale gas is not considered.
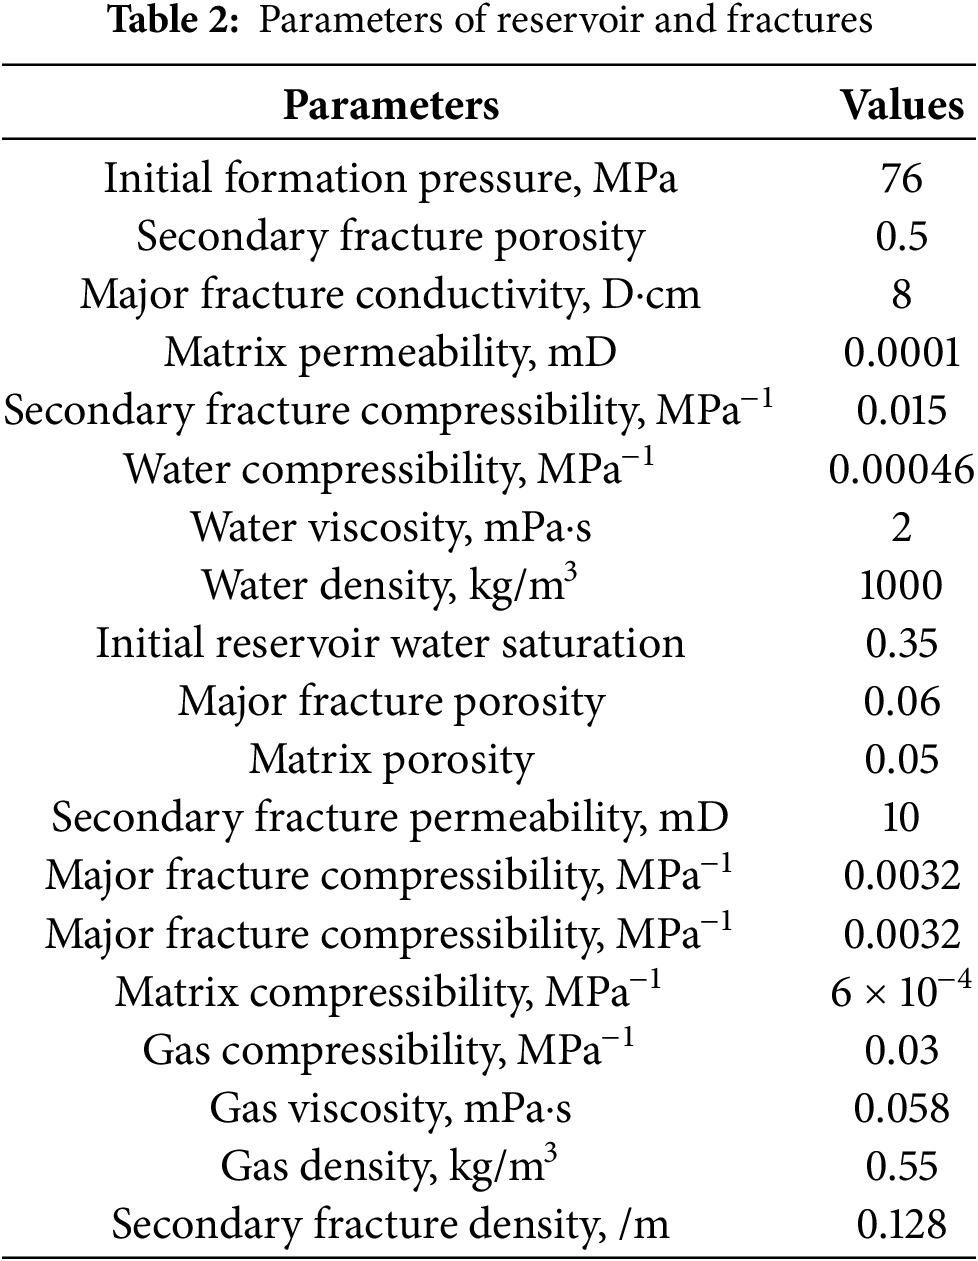
The parameters of major andsecondary fractures and reservoir physical of the numerical model are listed in Table 2.
Both major and secondary fractures are meshed by the logarithm refinement method. The gas-water relative permeability curves of major and secondary fractures and the matrix and the capillary force of matrix are shown in Fig. 11.
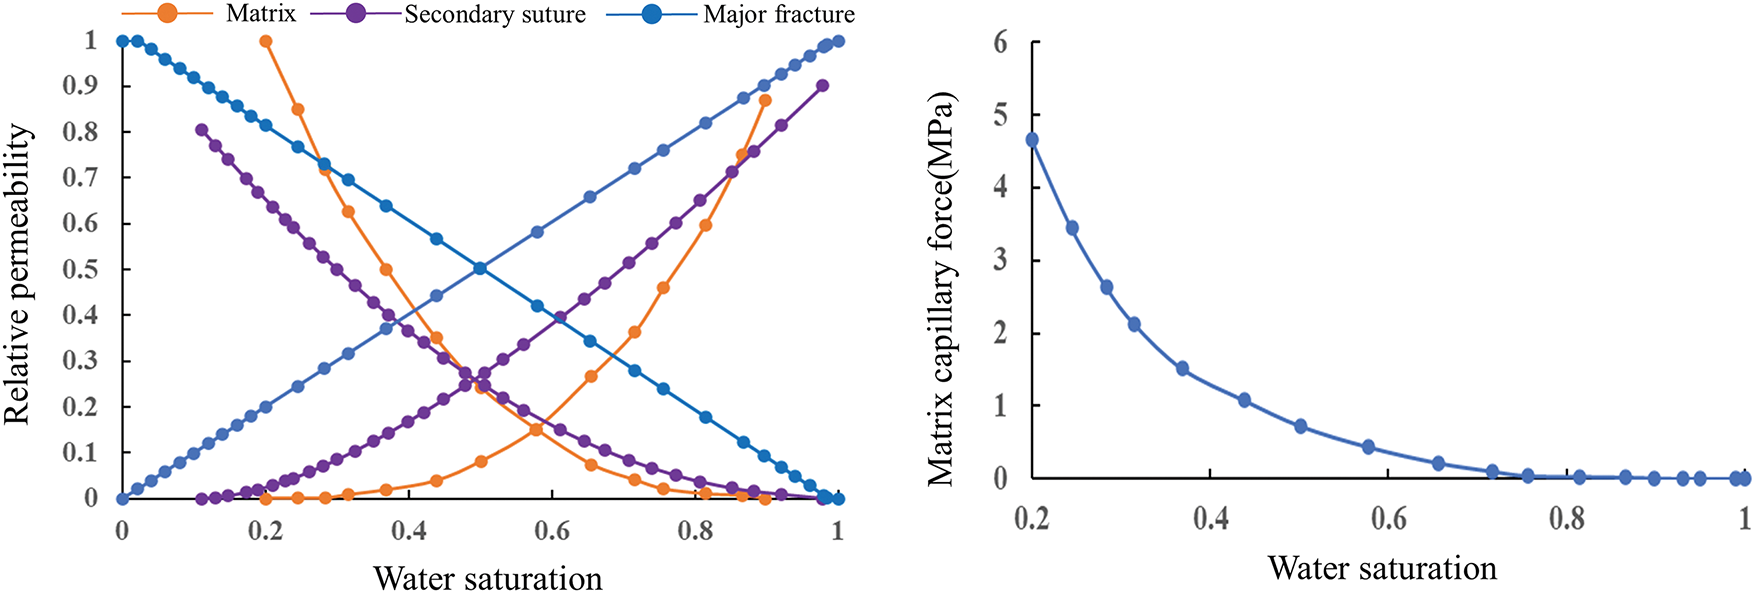
Figure 11: Gas-water relative permeability and matrix capillary force of fracture and matrix
At the end of 150 d of shut-in, the frac fluid occupies 3.3% of the major fracture system and 3.9% of the secondary fracture system. The leakoff frac fluid replaces the shale gas in the matrix into the fracture. The cumulative water absorption and the water absorption rate of matrix, the cumulative gas exchange volume and the gas exchange rate of the fracture system during shut-in are shown in Fig. 12. The cumulative water absorption of matrix is stabilized gradually at the end of shut-in, and the channel flow rate from the fracture system to the matrix is high at the early stage of shut-in and then decreases rapidly. The gas inflow into fracture system increases obviously after 0.6 d, and then gas inflow increases rapidly. There is good connectivity between major and secondary fractures and small volume of secondary fractures. The water absorption rate of matrix shows an approximately unit negative slope on the log-log curve, and there is relatively small fluctuation.
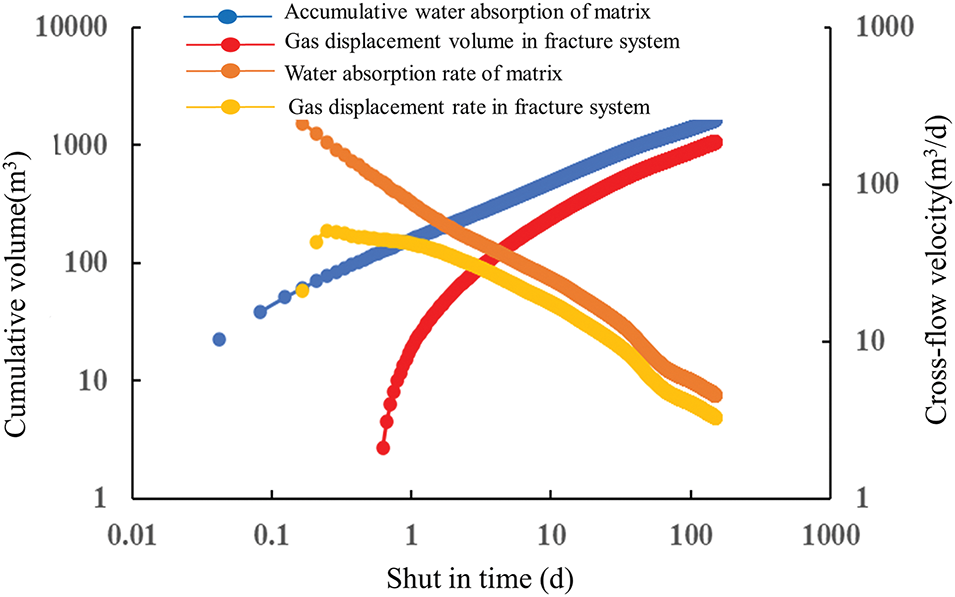
Figure 12: Gas-water displacement relationship during shut-in
In gas-water displacement between the matrix and the fracture system during shut-in, the gas exchange rate of the fracture system is negative in Stages (1)–(3). According to the flow pattern of the pressure drop and the gas-water displacement relationship between the matrix and the fracture system during shut-in, the flow pattern is divided on typical log-log curves of numerical simulation (Fig. 13).
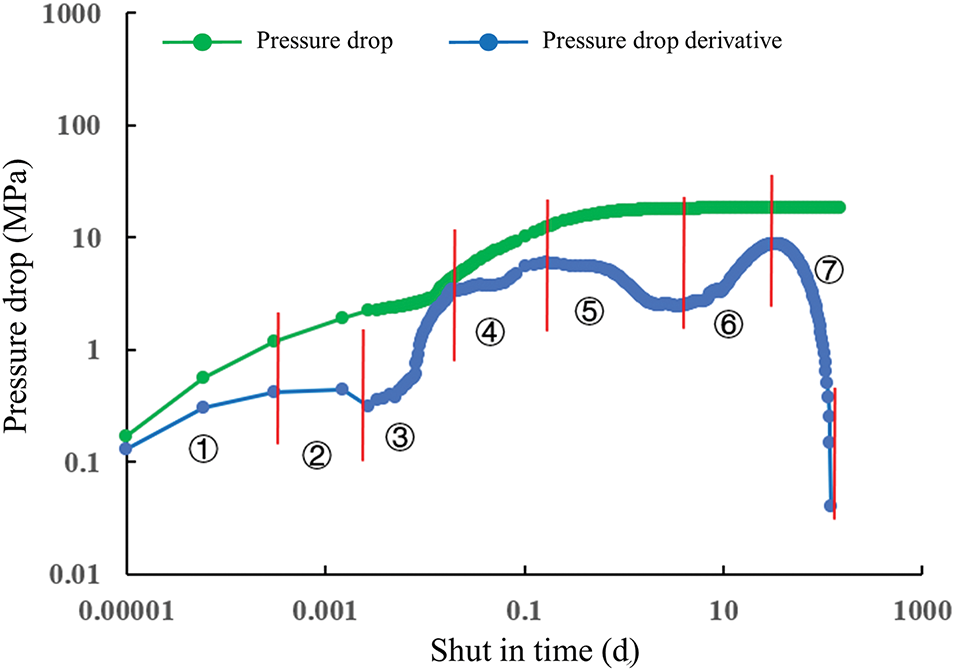
Figure 13: Division of flow patterns in numerical simulation bottom-hole pressure drop characteristic curve
Based on the post-stimulation shut-in pressure drop model of shale gas horizontal wells with a simple fracture, simulation and sensitivity analysis of parameters of major and secondary fracture and reservoir involved in the model, including matrix permeability, major fracture conductivity, secondary fracture permeability, major fracture half-length and secondary fracture density, were carried out to study the pattern of the log-log bottom hole pressure drop curve under different reservoir physical parameters (Figs. 14–16). In sensitivity analysis, only the sensitive factors are changed, and other parameters such as injection fluid volume and shut-in time are not changed.
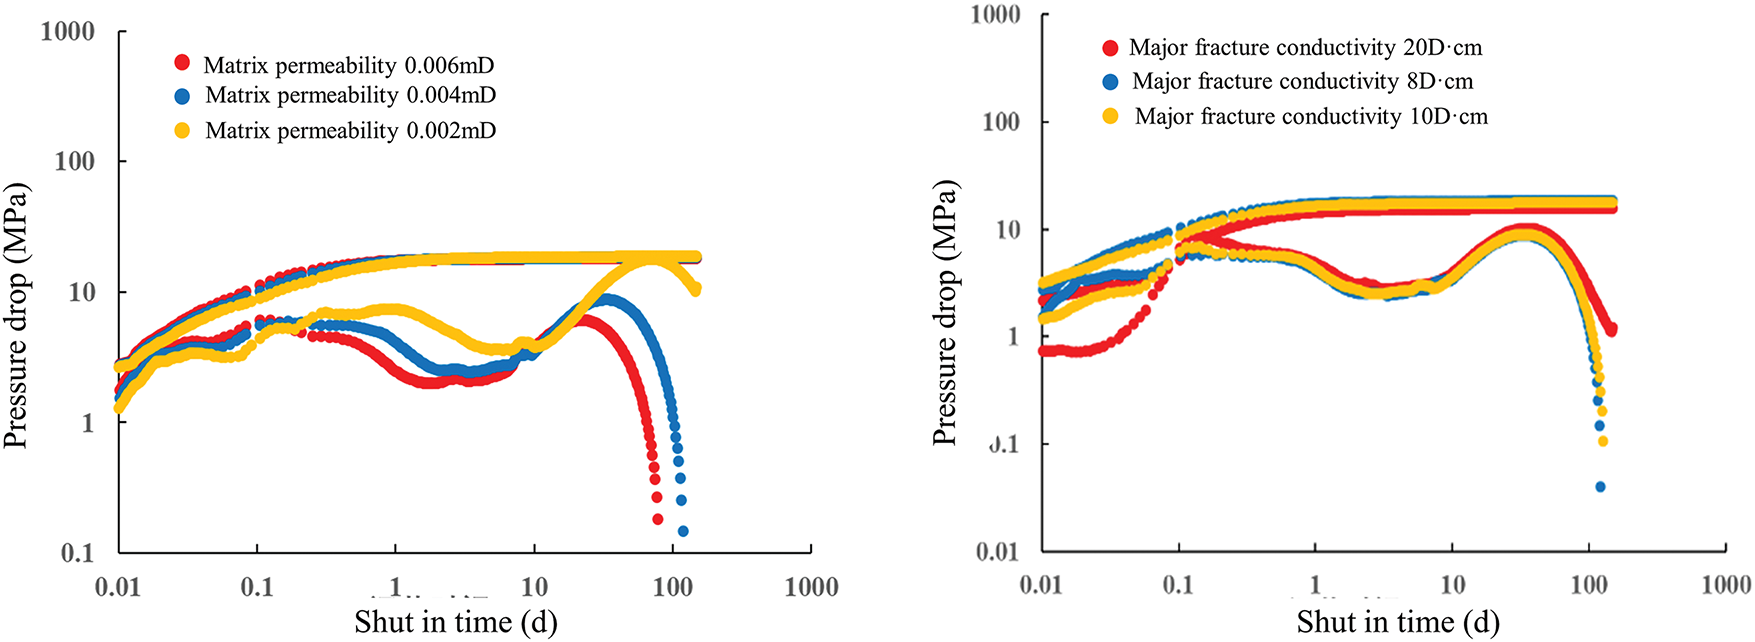
Figure 14: Pressure drop characteristic curves of LZ block under different simulated major fracture conductivity
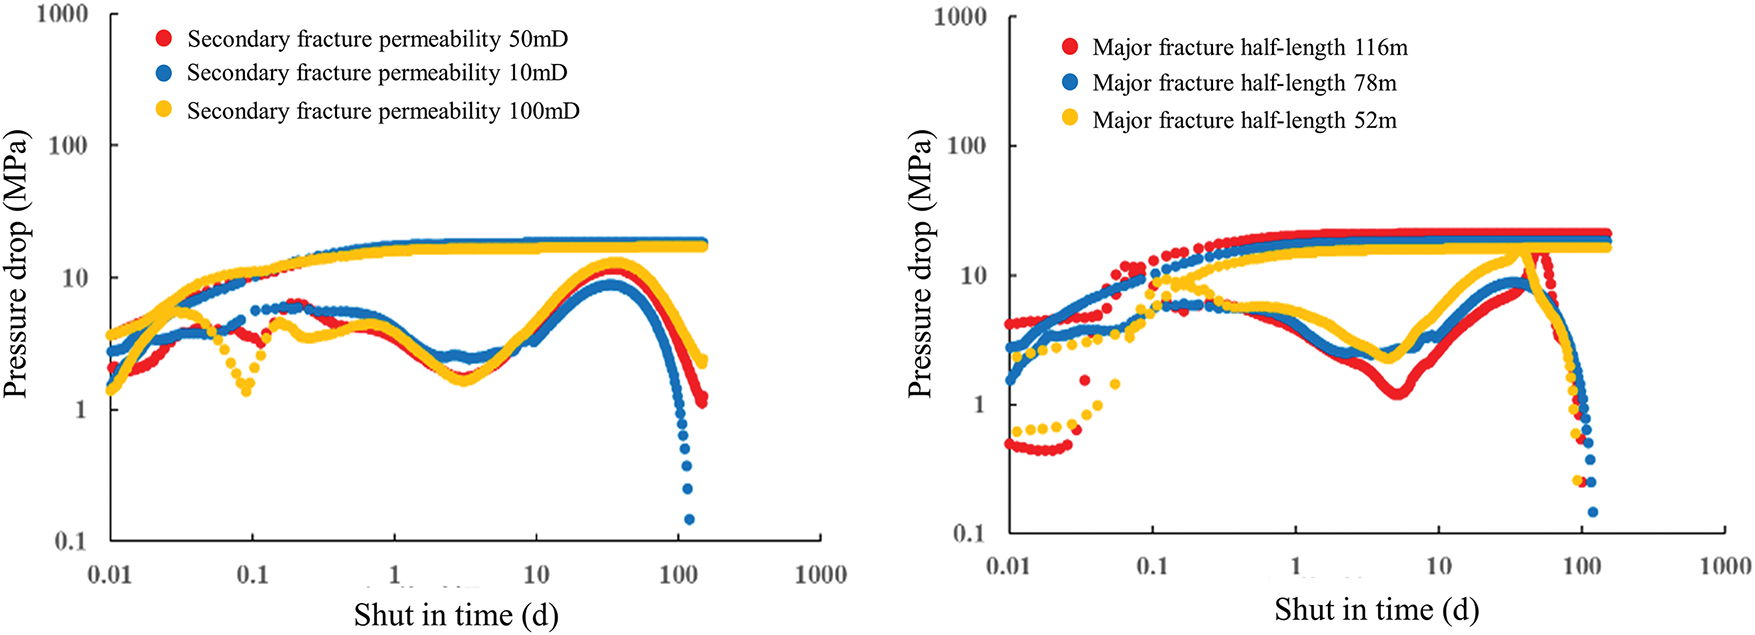
Figure 15: Pressure drop characteristic curves of LZ block under different simulated major fracture half-length
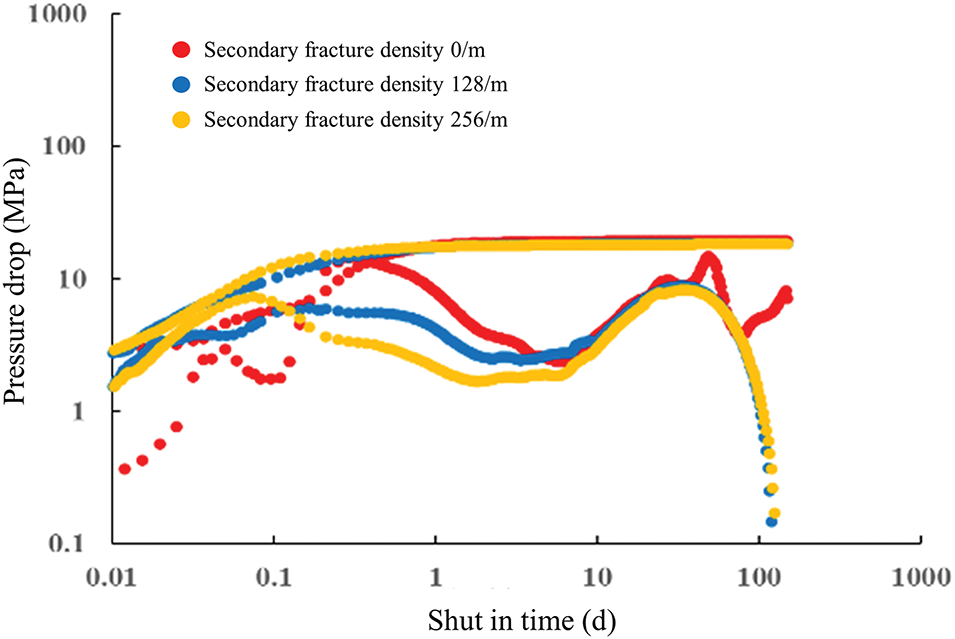
Figure 16: Pressure drop characteristic curves of LZ block under different simulated secondary fracture densities
3.2 Design of Shut-In System Chart
According to the development degree of natural fractures, the deep shale gas blocks are divided into network fracture zone and single direction fracture zone.
The network fracture zone indicates that the natural fractures in this area are mainly multi-directional, low energy level, and short fracture spacing, which have little impact on shale gas well drilling and fracturing. After using volume fracturing, it is easy to form a more complex artificial fracture network; single direction fracture zone represents a natural fracture in the area that is mainly developed in a single direction, with a large energy level and long spacing. These natural fractures are generally wide and have a long extension length, which can easily lead to drilling leakage and complex fracturing processes, resulting in casing deformation and pressure breakthrough. In actual construction, attention should be paid to identification and avoidance, and construction intensity should be appropriately controlled.
In typical wells in the network fracture zone, there is no matrix flow dominated stage, and no imbibition and energy enhancement effects, and flow in the wellbore, major fracture, and secondary fractures are dominant. In the single direction fracture zone, gas-liquid displacement in the fracture system is basically completed in 8–12 d, and matrix flow starts to be dominated, and the imbibition fracturing efficiency reaches a peak (Fig. 17).
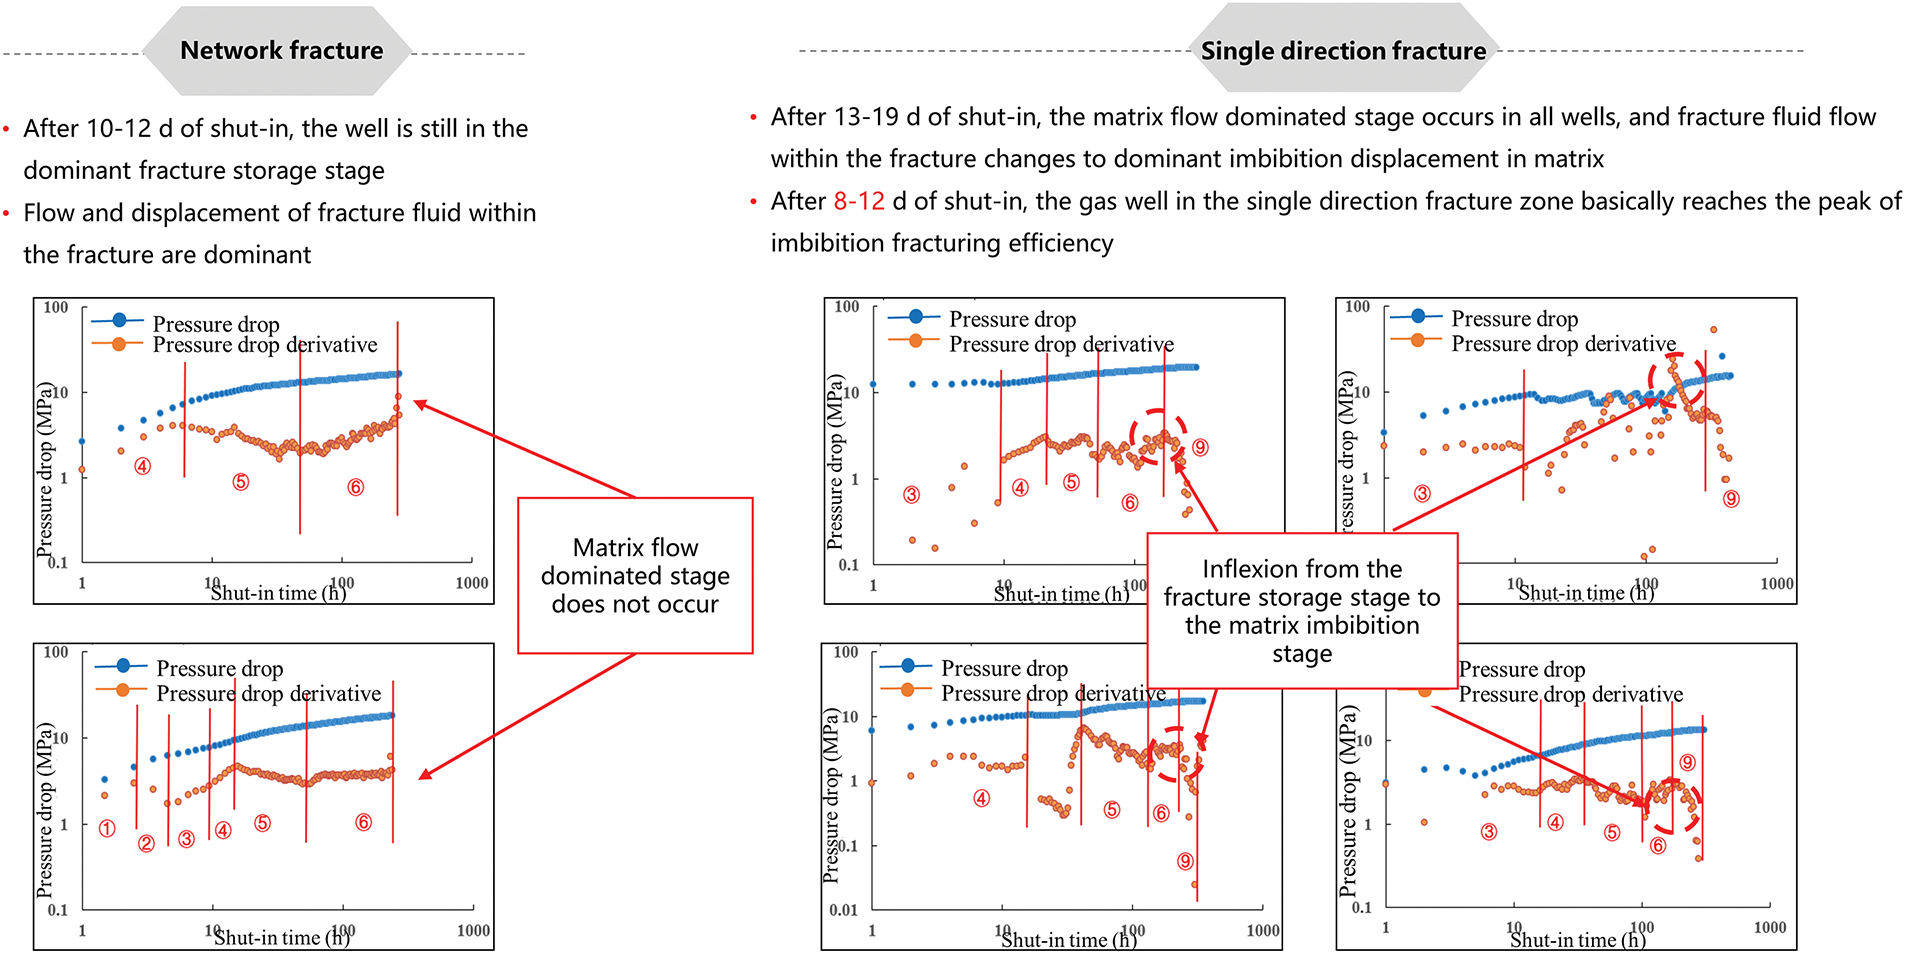
Figure 17: Comparison of the log-log pressure drop curves of typical shut-in wells
The chart for shut-in technical scheme optimization (Fig. 18) was established. It is concluded that the shortest shut-in time is when the bottom hole pressure is below the closure pressure, and its purpose is to reduce the risk of sand production. This shortest shut-in time is generally 2–4 days.
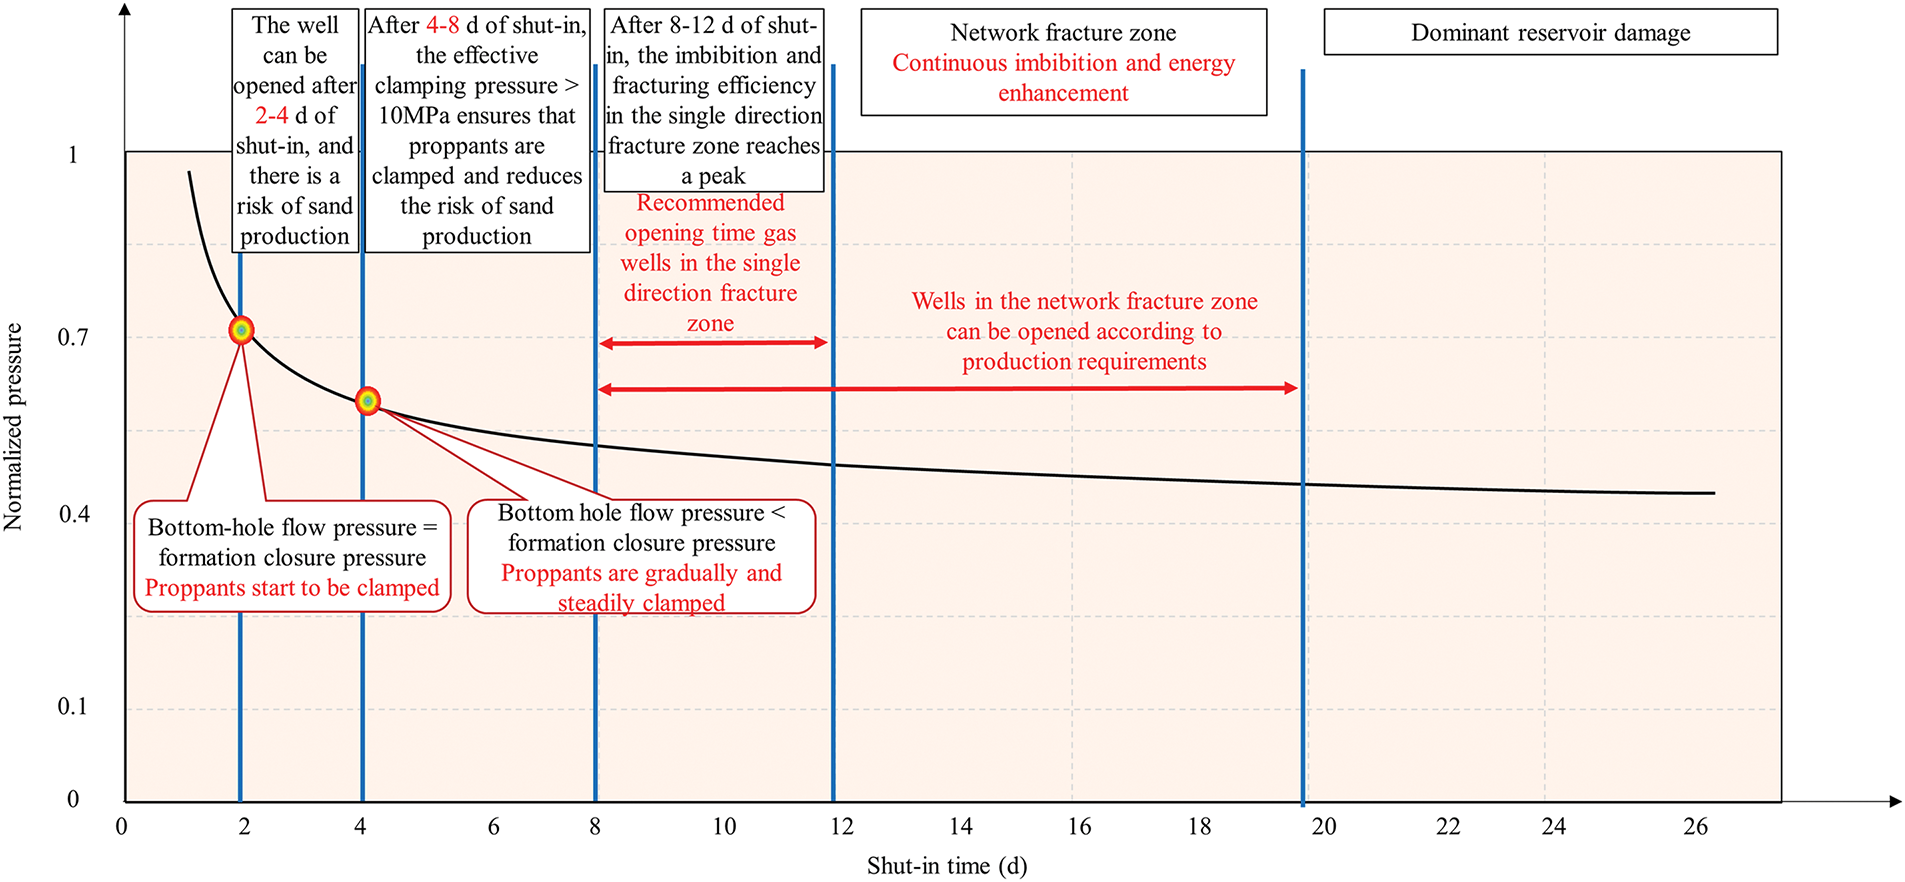
Figure 18: Chart for shale gas well shut-in design
The imbibtion fracturing capacity of gas wells in the single direction fracture zone is weaker than that in network fracture zone, and the well can be opened earlier. The recommended shut-in time is 4–8 d for gas wells in the single direction fracture zone. The shut-in time of gas wells in network fracture zone can be extended appropriately to obtain a maximum fracturing effect.
4 Optimization of Gas Well Flowback Mode
4.1 Numerical Simulation of Flowback System Design
Based on the actual fracturing parameters and logging interpretation results of gas wells, a fracture network mechanism model was established by using EDFM numerical simulation technology. The model has a mesh number of 166, 60 and 10 in x, y and z directions, respectively, a size of 10 m × 10 m × 2 m, a total number of 99,600, a 1560 m long lateral section, 42 fractures clustered near point B, and an initial fracture half-length of 250 m and an initial fracture height of 20 m (Fig. 19).
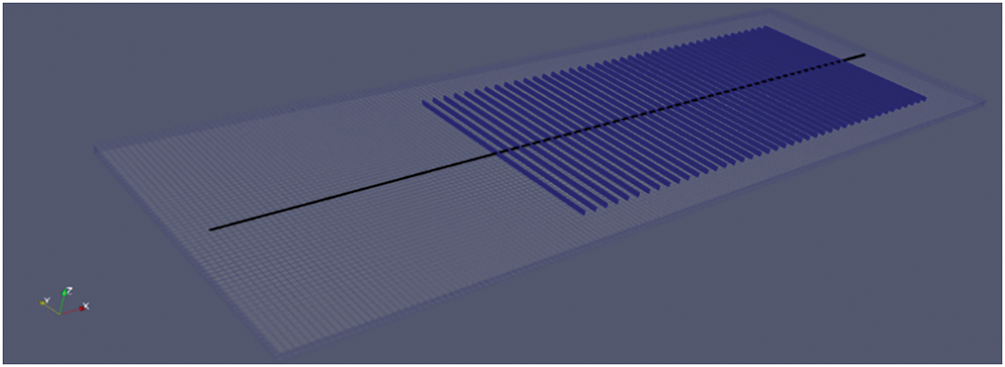
Figure 19: Mechanism model of a shale gas well
Based on the model constrained by actual production data, the bottom-hole flow pressure and daily water production were fitted with the fixed gas production mode. EDFM-AI artificial intelligence assisted fitting technology was used to carry out 300 iterations, and the optimal solution was fitted. The fitting errors of bottom-hole flow pressure and daily water production are less than 5% and 30%, respectively. The estimated EUR is 1.77 × 10⁸ m3, which is highly consistent with the RTA prediction result of 1.76 × 10⁸ m3, indicating that the model has a high simulation accuracy and can be applied in following study (Figs. 20 and 21).
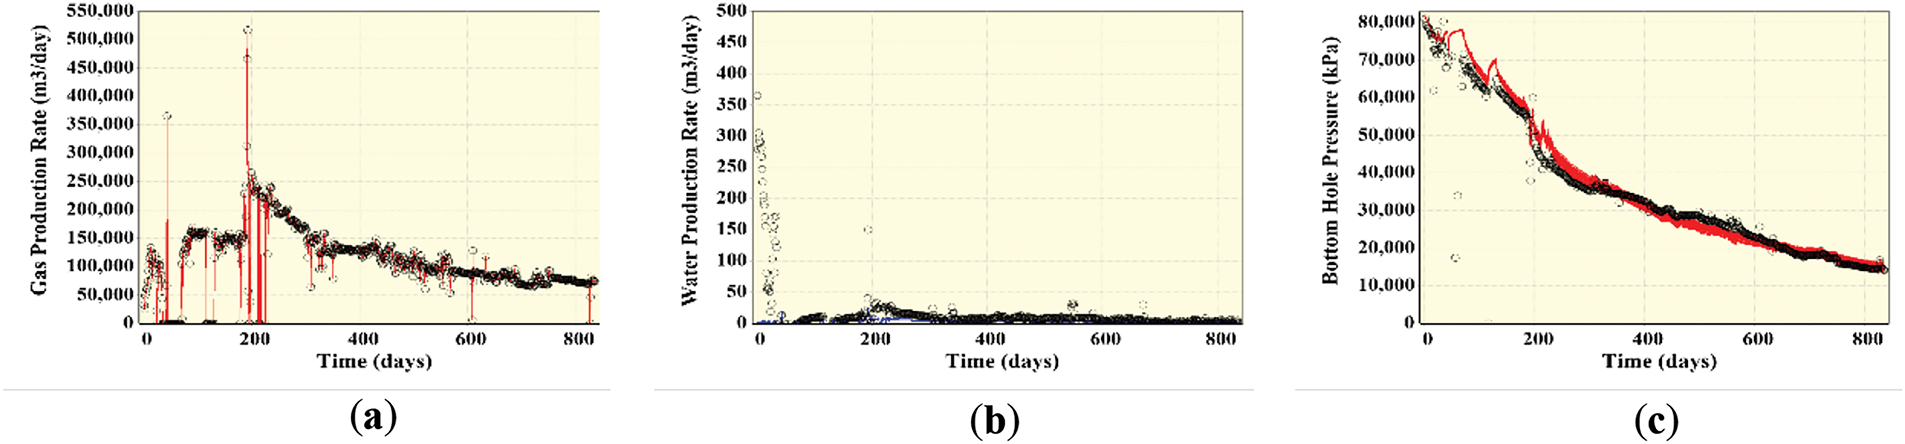
Figure 20: History fitting of a shale gas well. (a) Daily gas simulation fitting; (b) Daily water production fitting; (c) Bottom-hole flow pressure fitting
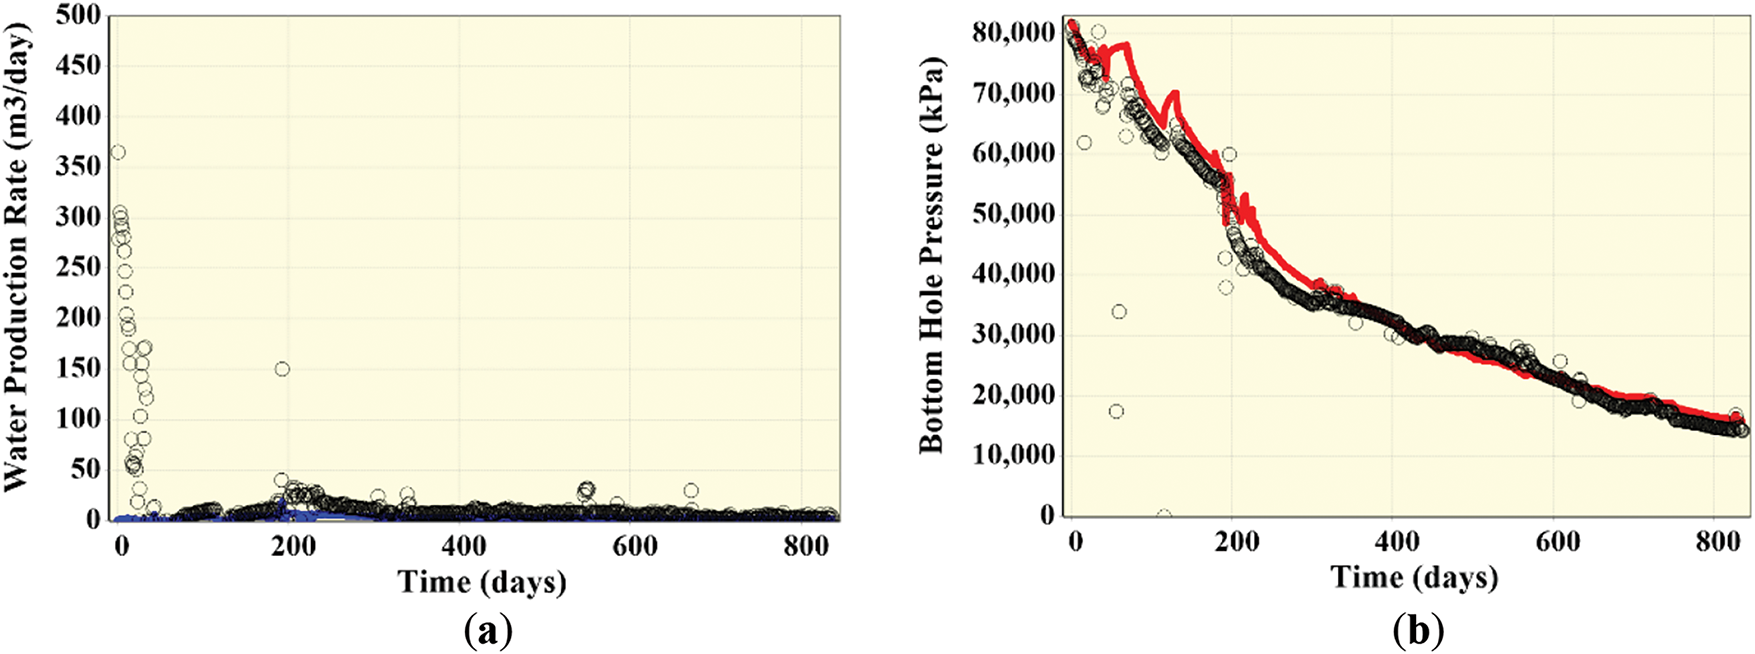
Figure 21: Optimal history fitting of a shale gas well. (a) Optimal fitting of daily oil water production; (b) Optimal fitting of bottom-hole flow pressure
By constraints of history fitting, key reservoir and fracture parameters such as conductivity, water saturation, equivalent height, equivalent half-length, stress-sensitive curve of artificial fracture, and matrix permeability were obtained by inversion, and they were used as input parameters for subsequent research on pressure drop path to ensure simulation reliability (Fig. 22).
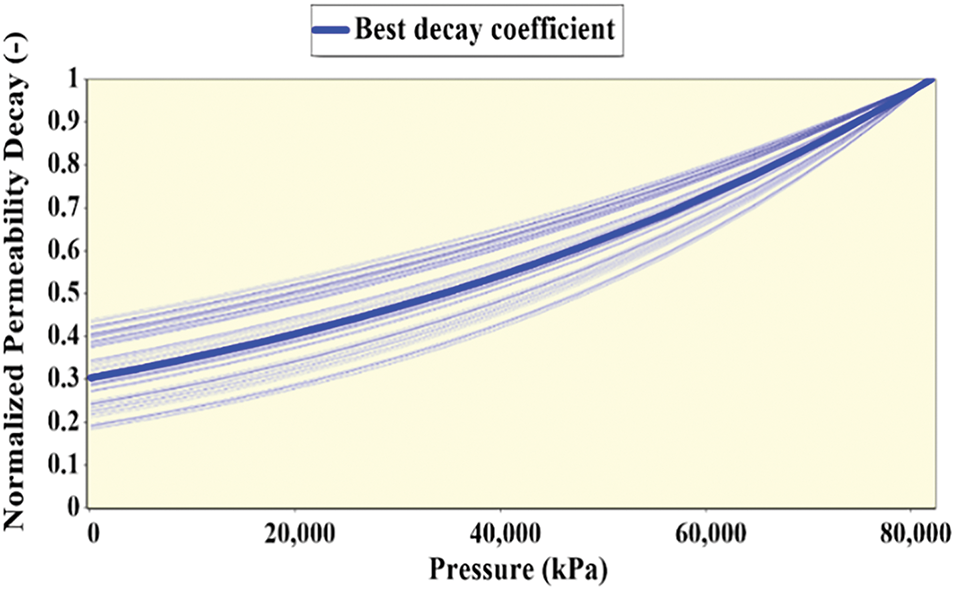
Figure 22: Inversion of uncertain parameters of a shale gas well
After establishing the model, noise reduction of the actual bottom hole flow pressure was carried out by the equivalence approach, and abnormal values caused by data acquisition or surface operation were excluded. The original uneven curve shape was processed by artificial characterization, and a stepped curve with unfixed interval and unfixed decline amplitude was formed (Fig. 23). Based on the treated stepped curve, 9 bottom hole flow pressure change paths corresponding to daily pressure drops were formed by fixing the change interval and adjusting the drop amplitude. According to actual historical pressure drop, they were divided into 4 open flow paths (faster than the actual pressure drop), 4 controlled pressure paths (slower than the actual pressure drop) and 1 extreme controlled pressure path.
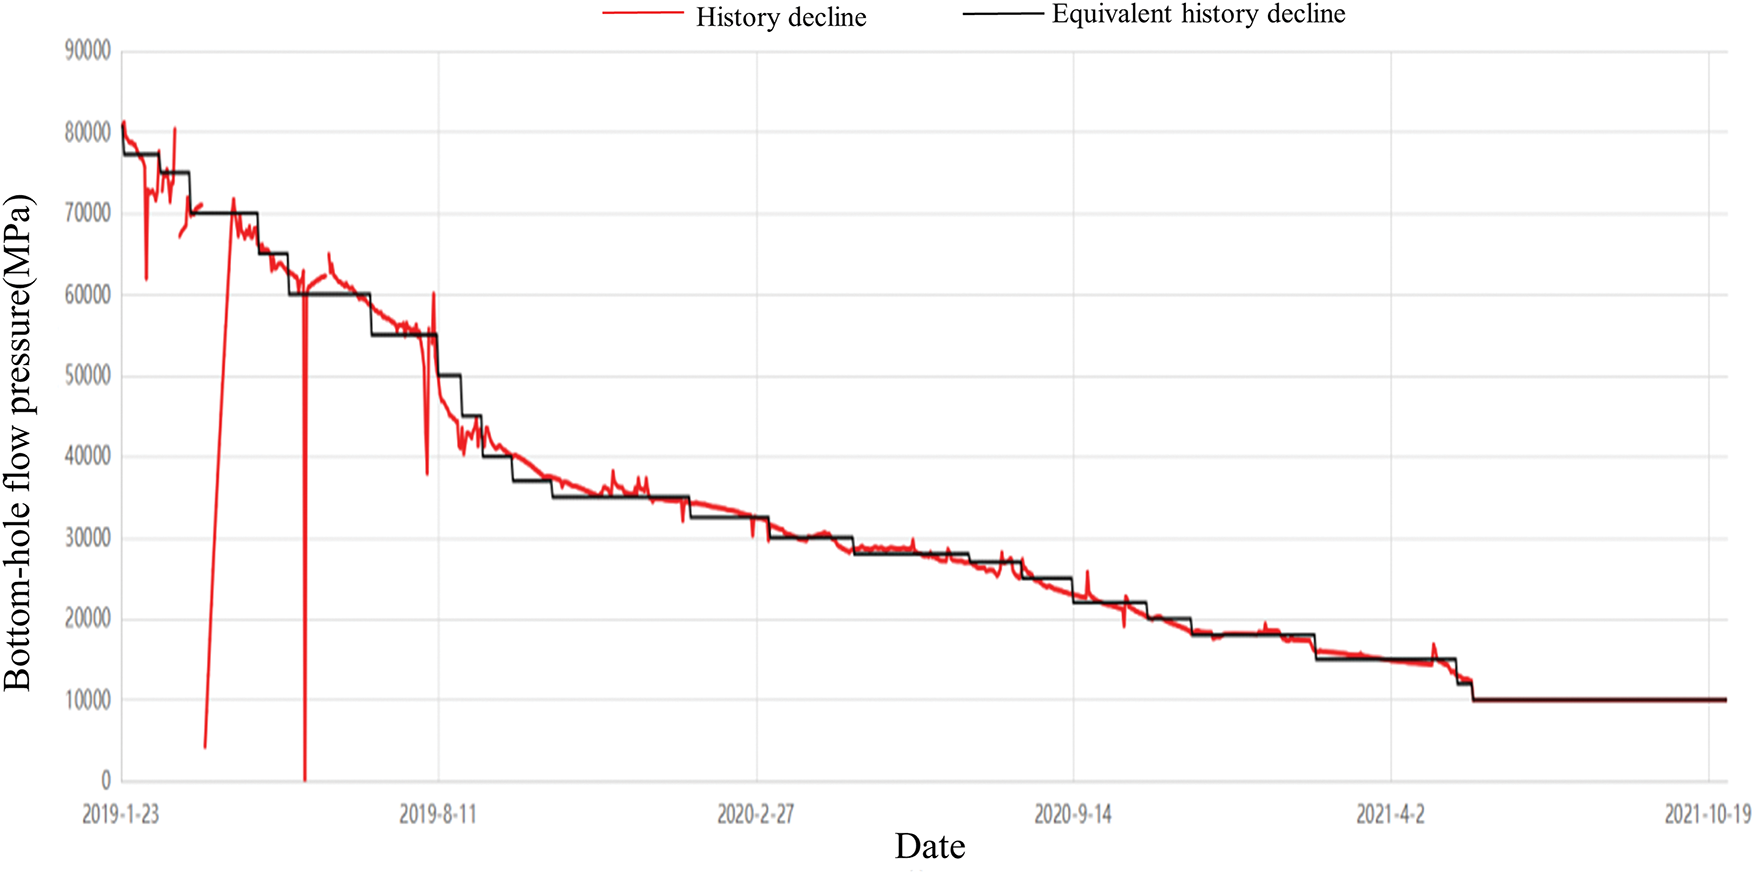
Figure 23: Equivalent filtration chart of bottom-hole flow pressure in a shale gas well
The key difference between controlled pressure and open flow production is different stress closure degree. In the open flow system, the pressure declines rapidly, the fracture closure degree is large, the fracture closure speed is fast, and the reservoir permeability decreases more. A larger open flow degree causes a greater stress closure degree and more permeability loss. On the contrary, a larger controlled pressure degree causes a smaller stress closure degree and less permeability loss. To distinguish the relationship between permeability and stress corresponding to pressure drop paths, 9 sets of stress sensitivity curves with different permeability loss were designed based on the stress sensitivity curves obtained from inversion, and they are matched with each pressure drop path, respectively (Fig. 24).
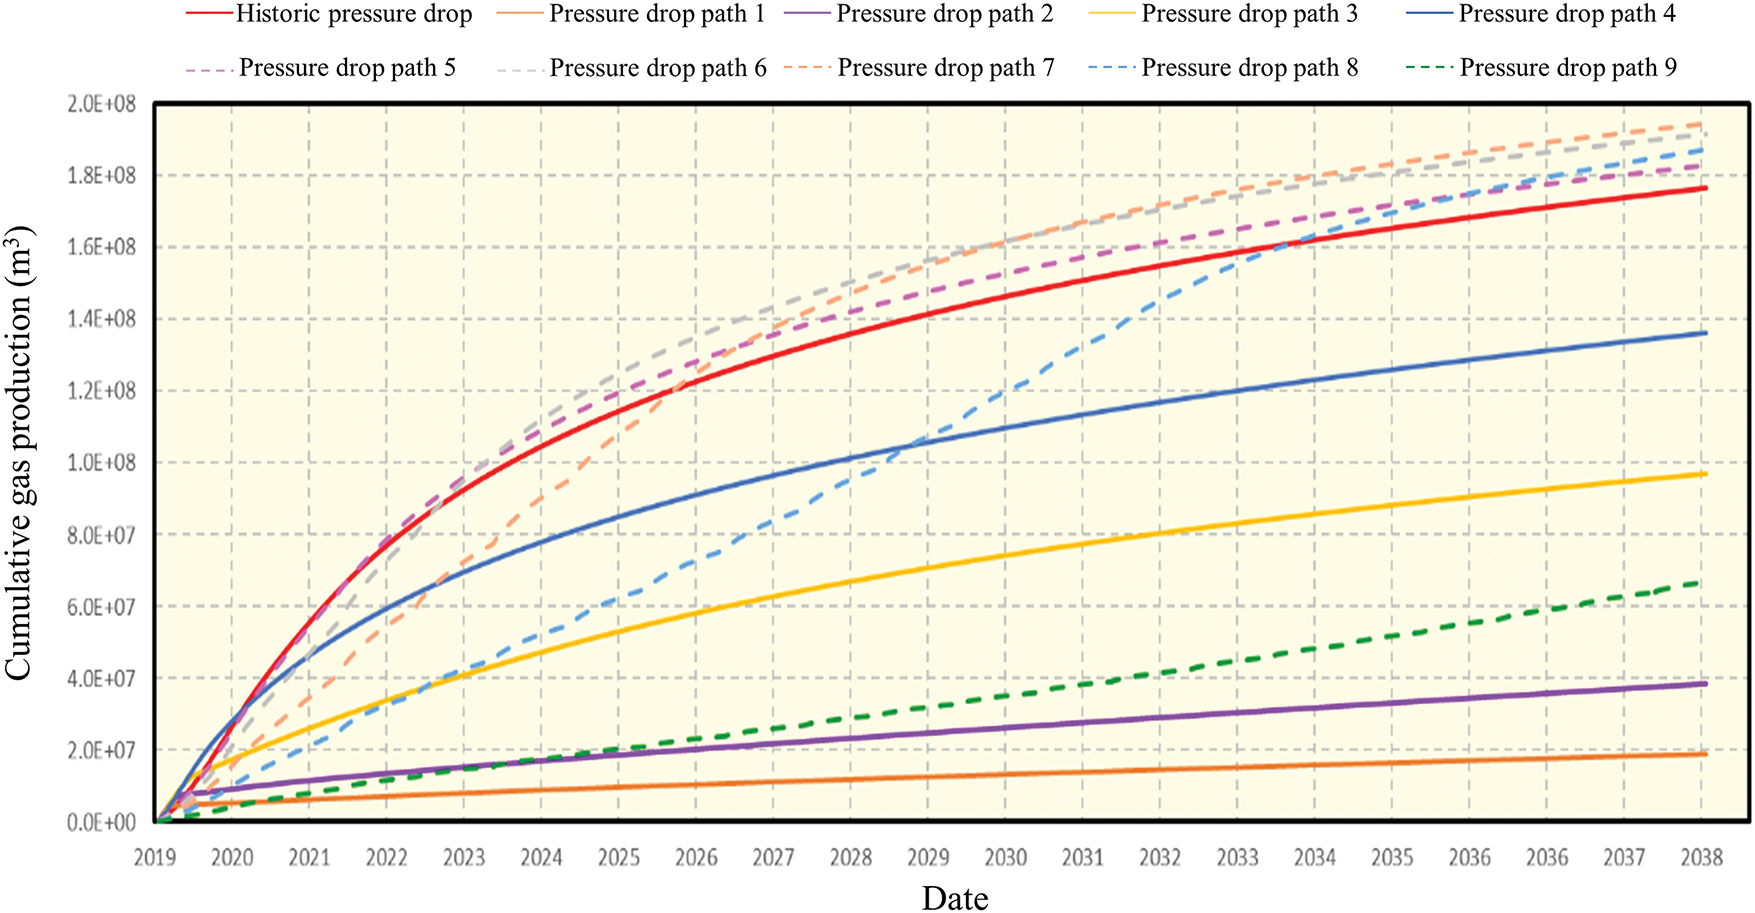
Figure 24: Variation of cumulative gas production corresponding to different pressure drop paths
Pressure drop paths and corresponding stress sensitivity curves were input into a mechanism model constrained by history fitting, cumulative gas production in different paths and its impact on EUR during 20 years of production were simulated (Fig. 25). At the early production stage, a higher cumulative gas production can be obtained by open flow production, and a larger open flow degree causes a higher cumulative gas production. With the progress of production, open flow production causes rapid fracture closure, shrinkage of gas production channels, and the reduced permeability. As a result, the gas production rate in the open flow system is far lower than that in the controlled pressure system, and the cumulative gas production in the controlled pressure path gradually exceeds that in the controlled pressure system. Taking path 8 as an example, the cumulative gas production is lower at the early production stage and higher than that in path 3 after 4 years of production. After 10 years of production, the cumulative gas production exceeds that in path 4. After 15 years of production, the cumulative gas production exceeds that in the historical pressure drop path. After 17 years of production, the cumulative gas production exceeds that in path 5. Taking the historical pressure drop as an example, the cumulative gas production is higher at the early production stage and is exceeded than by those in paths 5, 6, 7, and 8 successively as production goes. Finally, the predicted EURs are 1.83–1.95 × 10⁸ m3 in paths 5, 6, 7 and 8, and they are 3%–10% higher than 1.77 × 10⁸ m3 from the historical pressure drop path. In paths 1, 2, 3 and 4, open flow production causes fracture closure at the early production stage, resulting in massive shale gas detention in reservoir. For path 9 with controlled pressure production, there is a small pressure drop, a lot of energy is maintained in the reservoir, and a longer production time is needed to produce the gas. The results show that EURs can be increased further by using paths 5, 6, 7 and 8, i.e., maintaining the daily pressure drop of 0.01–0.08 MPa/d.
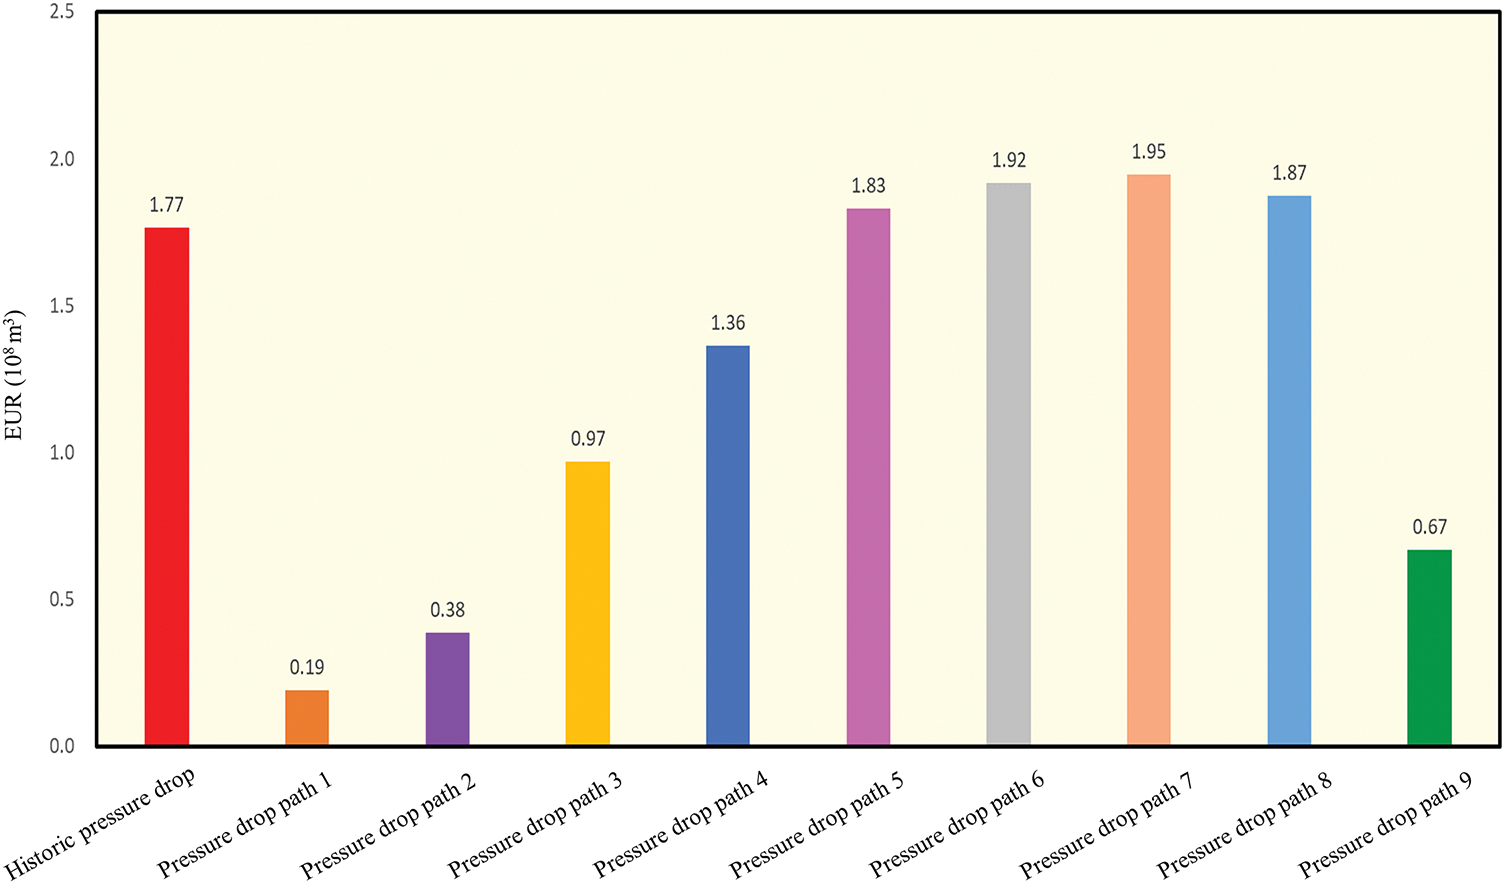
Figure 25: EURs for different pressure drop paths
4.2 Method of Quantitative Evaluation of Artificial Fracture Conductivity
Based on the percolation theory of gas reservoirs,
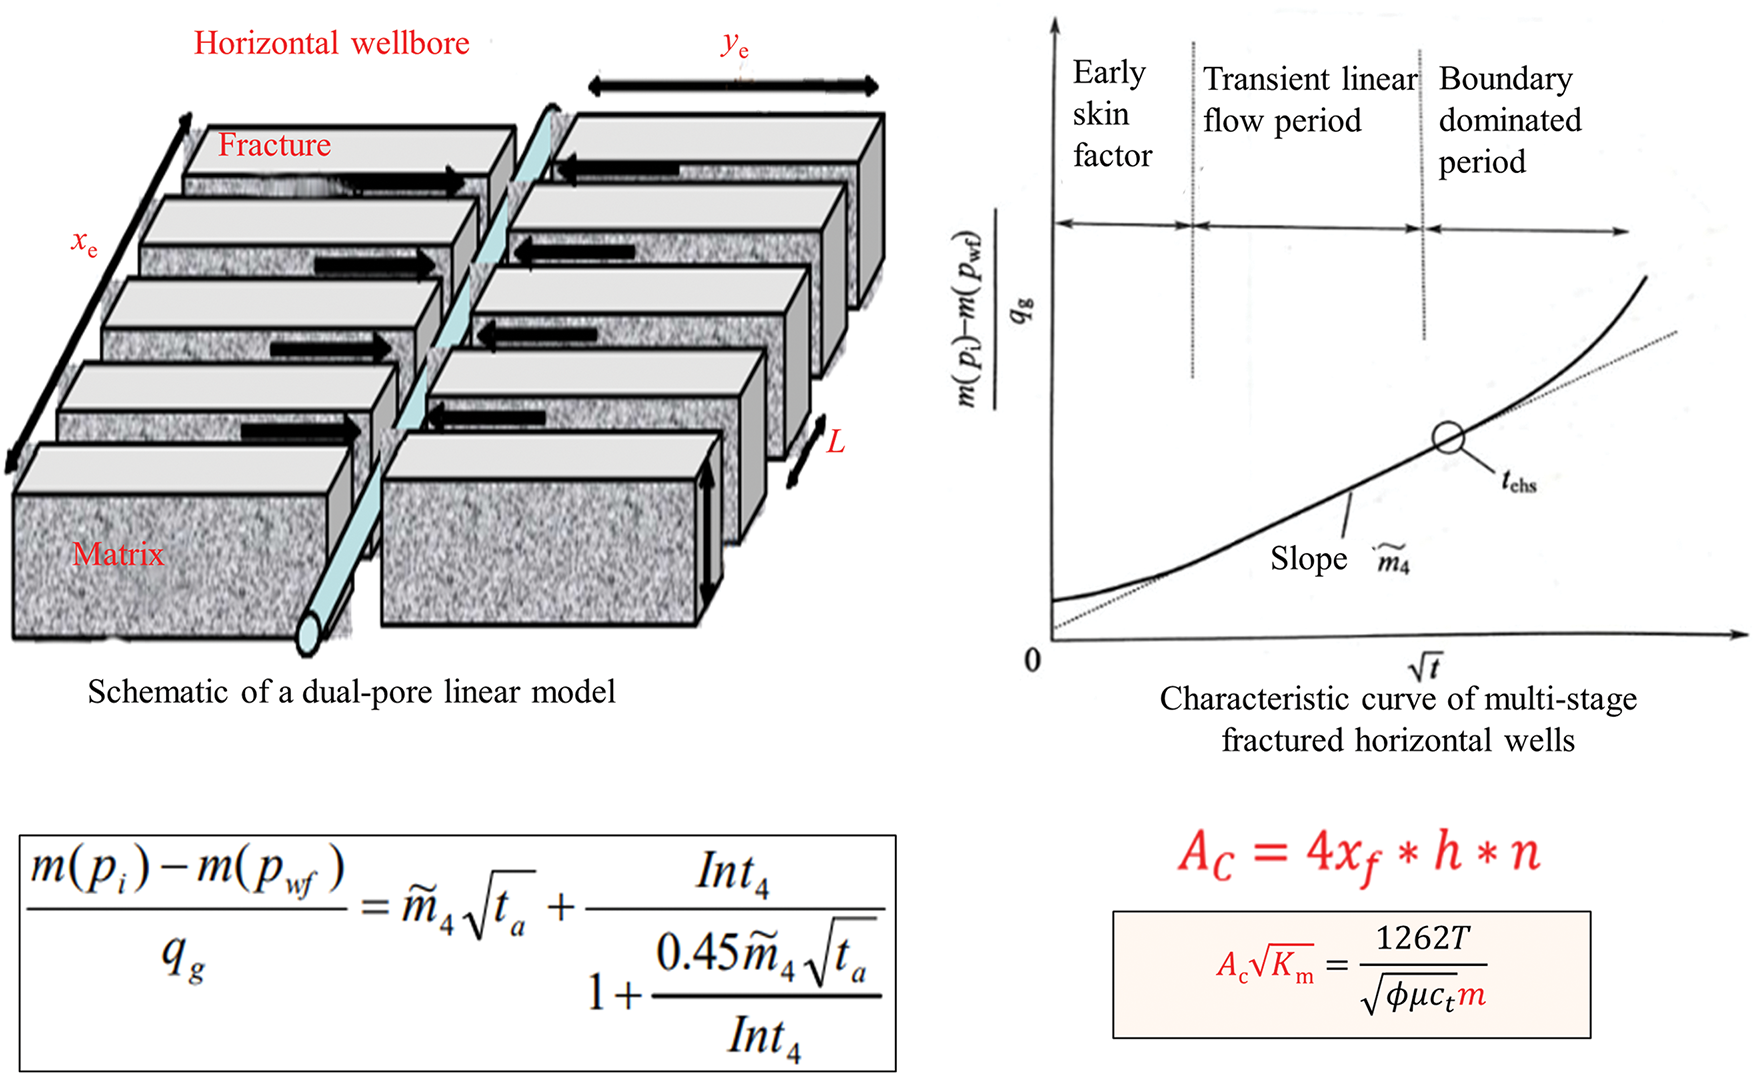
Figure 26: Model and method principle
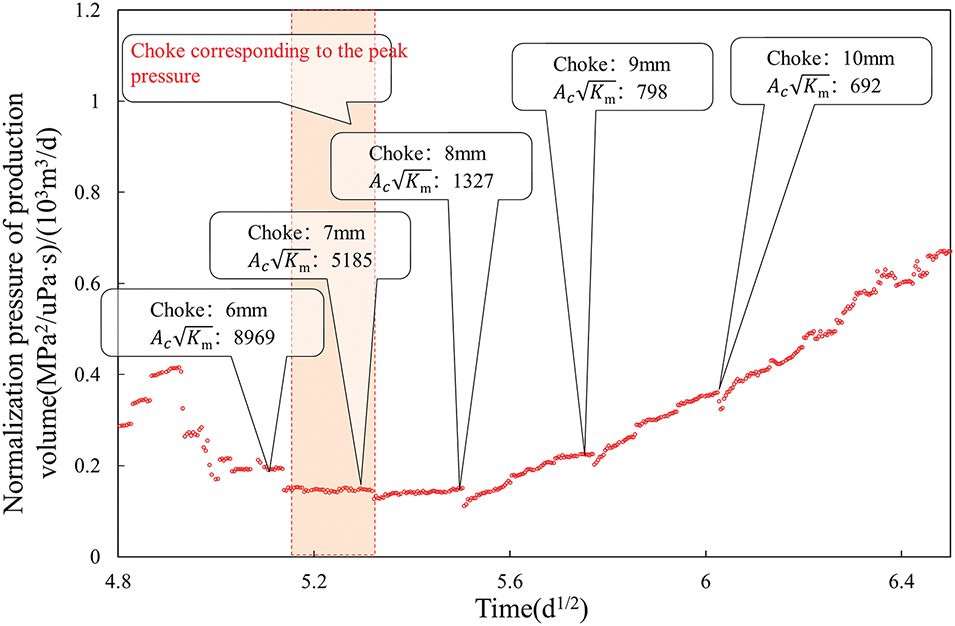
Figure 27: Variation of
As given in Table 3, the conductivity of artificial fractures in the network fracture zone decreases by 15%–28%, with an average of 22.3%, which is significantly lower than that in the single direction fracture zone. With the goal of the lowest decrease of the conductivity of artificial fractures, the appropriate choke diameter of gas wells in LZ Block is set as 5–9 mm, and the appropriate choke diameter of gas wells in the network fracture zone is larger than that in the single direction fracture zone (Fig. 28).
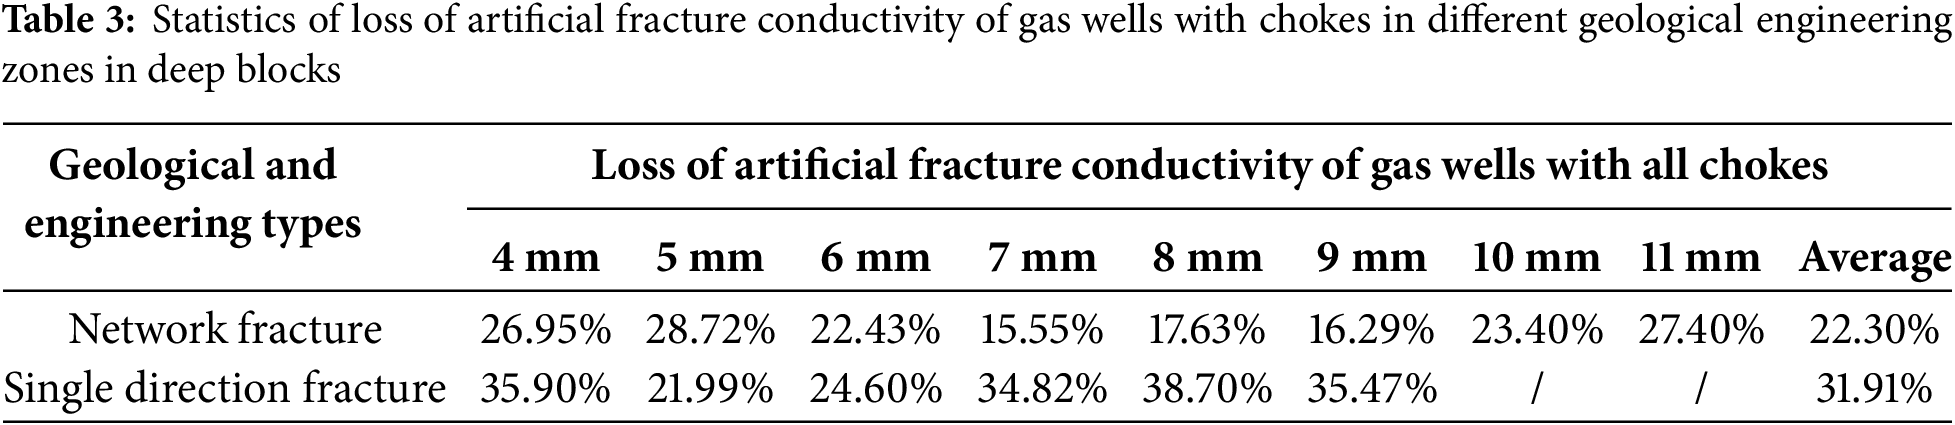
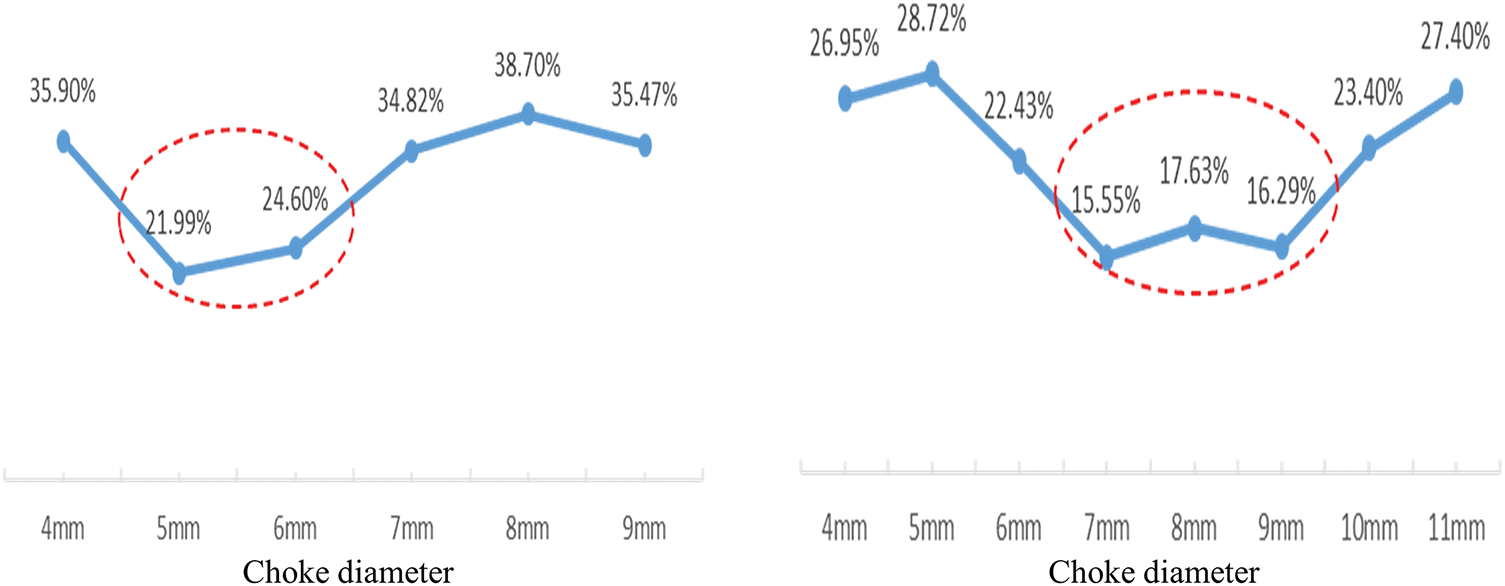
Figure 28: Loss of artificial fracture conductivity of shale gas wells with chokes under different geological engineering conditions
Based on the results of numerical simulation, mechanism analysis and real-time optimization, the shut-in time, choke adjustment time, maximum choke size and average daily pressure drop range of gas wells in the network fracture zone and the single direction fracture zone were specified, and a differentiated “shut-in and flowback” model was established in Table 4 to support the maximum production potential of gas wells.
(1) The shut-in pressure drop interpretation model was established, and the chart for the design of shut-in schemes for different geological and engineering modes in LZ deep shale was established. The shut-in time is required to be 4–8 d for the single fracture zone and >8 d for the network fracture zone.
(2) The flowback characteristics of shale gas wells with two geological and engineering conditions were defined, typical charts were established, and the index system for evaluating gas well flowback effects was established. They can be used to evaluate the flowback effect of gas wells at the initial production stage.
(3) Based on the results of numerical simulation and mechanism analysis, the shut-in time, choke adjustment time, maximum choke size and average daily pressure drop range of gas wells in the network fracture zone and the single direction fracture zone were specified, and a differentiated “shut-in and flowback” model was established to support further improvement of flowback effects of deep shale gas wells.
Acknowledgement: We express our sincere gratitude to Xingchen Wang, Shuyao Sheng and Qiuyang Cheng, who provided substantial help in carrying out this work.
Funding Statement: Project propped by PetroChina Research Applied Science and Technology Project, “Shale Gas Scale Increase Production and Exploration and Development Technology-Research and Application of Key Technology of Deep Shale Gas Scale Production” (No. 2023ZZ21YJ01).
Author Contributions: Paper conception: Weiyang Xie, Cheng Chang; data collection: Ziqin Lai, Sha Liu, Han Xiao; analysis and interpretation of results: Sha Liu, Ziqin Lai; draft manuscript preparation: Weiyang Xie, Cheng Chang. All authors reviewed the results and approved the final version of the manuscript.
Availability of Data and Materials: The data that support the findings of this study are within this paper. The data before normalization are available from the corresponding author upon reasonable request.
Ethics Approval: Not applicable.
Conflicts of Interest: The authors declare no conflicts of interest to report regarding the present study.
References
1. Nie HK, Dang W, Zhang K, Su HK, Ding JH, Li DH, et al. Two decades of shale gas research & development in China: review and prospects. Nat Gas Ind. 2024;44(3):20–52. (In Chinese). doi:10.3787/j.issn.1000-0976.2024.03.003. [Google Scholar] [CrossRef]
2. Zou CN, Zhao Q, Wang HY, Xiong W, Dong DZ, Yu RZ. The main characteristics of marine shale gas and the theory & technology of exploration and development in China. Nat Gas Ind. 2022;42(8):1–13. (In Chinese). doi:10.3787/j.issn.1000-0976.2022.08.001. [Google Scholar] [CrossRef]
3. Guo XS, Hu ZQ, Li SJ, Zheng LJ, Zhu DY, Liu JL, et al. Progress and prospect of natural gas exploration and research in deep and ultra-deep strata. Pet Sci Bull. 2023;4:461–74. (In Chinese). doi:10.3969/j.issn.2096-1693.2023.04.035. [Google Scholar] [CrossRef]
4. Zhao JZ, Yong R, Hu DF, She CY, Fu YQ, Wu JF, et al. Deep and ultra-deep shale gas fracturing in China: problems, challenges and directions. Acta Pet Sin. 2024;45(1):295–311. (In Chinese). doi:10.7623/syxb202401017. [Google Scholar] [CrossRef]
5. Bian RK, Sun CX, Nie HK, Liu ZJ, Du W, Li P, et al. Types, characteristics, and exploration targets of deep shale gas reservoirs in the Wufeng-Longmaxi formations, southeastern Sichuan Basin. Oil Gas Geol. 2023;44(6):1515–29. (In Chinese). doi:10.11743/ogg20230614. [Google Scholar] [CrossRef]
6. Zhao SX, Xia ZQ, Zheng MJ, Zhang DL, He YH, Liu YY, et al. Evaluation of the remaining reserves of shale gas and countermeasures to increase the utilization of reserves: case study of the Wufeng-Longmaxi formations in Changning zone, southern Sichuan Basin. J Nat Gas Geosci. 2023;8(6):403–12. doi:10.1016/j.jnggs.2023.11.002. [Google Scholar] [CrossRef]
7. Nobakht M, Clarkson CR, Kaviani D. New type curves for analyzing horizontal well with multiple fractures in shale gas reservoirs. J Nat Gas Sci Eng. 2013;10(5):99–112. doi:10.1016/j.jngse.2012.09.002. [Google Scholar] [CrossRef]
8. Jongkittinarukorn K, Last NC, Kabir CS. Decline-curve analysis with decline rate for improving reserves estimation in gas reservoirs. Gas Sci Eng. 2023;116(5):205044. doi:10.1016/j.jgsce.2023.205044. [Google Scholar] [CrossRef]
9. Shaibu R, Guo B. The dilemma of soaking a hydraulically fractured horizontal shale well prior to flowback—a decade literature review. J Nat Gas Sci Eng. 2021;94(4):104084. doi:10.1016/j.jngse.2021.104084. [Google Scholar] [CrossRef]
10. Eric SC, James CM. Devonian shale gas production: mechanisms and simple models. J Pet Technol. 1991;43(4):476–82. doi:10.2118/19311-PA. [Google Scholar] [CrossRef]
11. Medeiros F, Kurtoglu B, Ozkan E. Analysis of production data from hydraulically fractured horizontal wells in shale reservoirs. SPE Reserv Eval Eng. 2010;13(3):559–68. doi:10.2118/110848-PA. [Google Scholar] [CrossRef]
12. Jia P, Cheng LS, Clarkson CR, Qanbari F, Huang SJ, Cao RY. A laplace-domain hybrid model for representing flow behavior of multifractured horizontal wells communicating through secondary fractures in unconventional reservoirs. SPE J. 2017;22(6):1856–76. doi:10.2118/186109-PA. [Google Scholar] [CrossRef]
13. Liu J, He X, Huang H, Yang J, Dai J, Shi X, et al. Predicting gas flow rate in fractured shale reservoirs using discrete fracture model and GA-BP neural network method. Eng Anal Boundary Elem. 2024;159:315–30. doi:10.1016/j.enganabound.2023.12.011. [Google Scholar] [CrossRef]
14. Yehia T, Mostafa S, Gasser M, Abdelhafiz MM, Meehan N, Mahmoud O. Investigating curve smoothing techniques for enhanced shale gas production data analysis. J Nat Gas Geosci. 2024;9(6):431–58. doi:10.1016/j.jnggs.2024.10.004. [Google Scholar] [CrossRef]
15. Reynolds MM, Ku RY, Vertz JB, Stashko ZD. First field application in Canada of carbon dioxide separation for hydraulic fracture flow back operations. Paper presented at: The SPE Unconventional Resources Conference; 2013 Nov 5–7; Calgary, AB, Canada. doi:10.2118/167197-MS. [Google Scholar] [CrossRef]
16. Yaich E, Williams S, Bowser A, Goddard P, de Souza OCD, Foster RA. A case study: the impact of soaking on well performance in the marcellus. In: Proceedings of the 3rd Unconventional Resources Technology Conference; 2015 Jul 20–22; San Antonio, TX, USA. doi:10.15530/urtec-2015-2154766. [Google Scholar] [CrossRef]
17. Makhanov K, Habibi A, Dehghanpour H, Kuru E. Liquid uptake of gas shales: a workflow to estimate water loss during shut-in periods after fracturing operations. J Unconv Oil Gas Resour. 2014;7(2):22–32. doi:10.1016/j.juogr.2014.04.001. [Google Scholar] [CrossRef]
18. Wijaya N, Sheng JJ. Comparative study of well soaking timing (pre vs. post flowback) for water blockage removal from matrix-fracture interface. Petroleum. 2020;6(3):286–92. doi:10.1016/j.petlm.2019.11.001. [Google Scholar] [CrossRef]
19. You LJ, Xie BB, Yang J, Kang YL, Han HF, Wang L, et al. Mechanism of fracture damage induced by fracturing fluid flowback in shale gas reservoirs. Nat Gas Ind B. 2019;6(4):366–73. doi:10.1016/j.ngib.2018.12.005. [Google Scholar] [CrossRef]
20. Yang H, Li JL, Shi XZ, Zhu JH, Deng C, Wang D. Characteristics and significance of flow-back processes after fracturing in shale-gas reservoirs. J China Univ Pet Nat Sci Ed. 2019;43(4):98–105. (In Chinese). doi:10.3969/j.issn.1673-5005.2019.04.012. [Google Scholar] [CrossRef]
21. Clarkson CR, Qanbari F. A semi-analytical method for forecasting wells completed in low permeability, undersaturated CBM reservoirs. J Nat Gas Sci Eng. 2016;30(6):19–27. doi:10.1016/j.jngse.2016.01.040. [Google Scholar] [CrossRef]
22. Wu JF, Guo JC, Zhao JZ. Study on gas/water two-phase percolation mechanism for fractured formations. Nat Gas Ind. 2004;24(11):85–7. doi:10.3321/j.issn:1000-0976.2004.11.026. [Google Scholar] [CrossRef]
23. Liu SD, Li XP, Zhang J, Zhang ZG. Analysis of productivity of horizontal well pattern with herringbone-like laterals while producing water. Nat Gas Geosci. 2015;26(3):550–5. doi:10.11764/j.issn.1672-1926.2015.03.0550. [Google Scholar] [CrossRef]
24. Zhao JZ, Zhou LL, Ma JJ, Li YM. Numerical simulation of fracturing wells consindering desorption and diffusion effect for shale gas with gas-water two phases. Nat Gas Geosci. 2015;26(9):1640–5. (In Chinese). doi:10.11764/j.issn.1672-1926.2015.09.1640. [Google Scholar] [CrossRef]
25. Gudala M, Govindarajan SK. Numerical investigations on two-phase fluid flow in a fractured porous medium fully coupled with geomechanics. J Pet Sci Eng. 2021;199(1):108328. doi:10.1016/j.petrol.2020.108328. [Google Scholar] [CrossRef]
26. Williams-Kovacs JD, Clarkson CR. A modified approach for modeling two-phase flowback from multi-fractured horizontal shale gas wells. J Nat Gas Sci Eng. 2016;30(7):127–47. doi:10.1016/j.jngse.2016.02.003. [Google Scholar] [CrossRef]
27. Benson ALL, Clarkson CR. A semi-analytical flowback data history-matching approach that rigorously accounts for fracture dynamics. Geoenergy Sci Eng. 2023;231(Pt A):212289. doi:10.1016/j.geoen.2023.212289. [Google Scholar] [CrossRef]
28. Piessens R. Numerical inversion of the Laplace transform. IEEE Trans Autom Control. 1969;14(3):299–301. doi:10.1109/TAC.1969.1099180. [Google Scholar] [CrossRef]
29. Dou F, Wang JG. A numerical investigation for the impacts of shale matrix heterogeneity on hydraulic fracturing with a two-dimensional particle assemblage simulation model. J Nat Gas Sci Eng. 2022;104:104678. doi:10.1016/j.jngse.2022.104678. [Google Scholar] [CrossRef]
30. Prieto M, Aristizabal JA, Pradilla D, Gómez JM. Simultaneous numerical simulation of the hydraulic fractures geometry in multi-stage fracturing for horizontal shale gas wells. J Nat Gas Sci Eng. 2022;102(4):104567. doi:10.1016/j.jngse.2022.104567. [Google Scholar] [CrossRef]
Cite This Article
 Copyright © 2025 The Author(s). Published by Tech Science Press.
This work is licensed under a Creative Commons Attribution 4.0 International License , which permits unrestricted use, distribution, and reproduction in any medium, provided the original work is properly cited.
 Downloads
 Citation Tools