
 Submit a Paper
 Propose a Special lssue
 Open Access
ARTICLE

Performance Analysis of Natural Gas Polyethylene Pipes Based on the Arrhenius Equation
1 School of Mechanical Engineering, Xinjiang University, Urumqi, 830046, China
2 Pressure Pipe Department, China Special Equipment Inspection and Research Institute, Beijing, 100013, China
* Corresponding Author: Yang Wang. Email:
Fluid Dynamics & Materials Processing 2025, 21(6), 1473-1487. https://doi.org/10.32604/fdmp.2025.062623
Received 23 December 2024; Accepted 24 February 2025; Issue published 30 June 2025
 View Full Text
 Download PDF
Abstract
With the widespread use of polyethylene (PE) materials in gas pipelines, the problem related to the aging of these pipes has attracted increasing attention. Especially under complex environmental conditions involving temperature, humidity, and pressure changes, PE pipes are prone to oxidative degradation, which adversely affects their performance and service life. This study investigates the aging behavior of PE pipes used for gas transport under the combined effects of temperature (ranging from 80°C to 110°C) and pressure (0, 0.1, 0.2, and 0.3 MPa). By assessing the characteristics and thermal stability of the aged pipes, relevant efforts are provided to explore the performance variations during the aging process and develop methods for evaluating thermal stability. The results indicate that an increase in aging factors, specifically temperature and pressure, significantly reduces the Melt Mass Flow Rate (MFR) of polyethylene pipes, suggesting a decline in the material’s flowability during the aging process. Oxidative Induction Time (OIT) tests show that with increasing temperature and pressure, the oxidative induction time of the aged polyethylene pipes progressively shortens, indicating a significant reduction in the material’s oxidative stability. The application of the Arrhenius equation further demonstrates that the aging reaction rate of polyethylene pipes in high-temperature environments is closely related to both temperature and activation energy, thereby laying the foundation of a new approach for the development of an initial model that can reflect the microscopic behavior of polyethylene pipes in aging environments.Keywords
Natural gas is gradually gaining prominence and is widely used in the storage and use of fuel in everyday life [1–3]. Long-distance pipeline transport has become one of the primary methods for the delivery of natural gas [4–6]. With the advancement of polymer technology, polyethylene pipes, due to their superior performance, have gradually replaced metallic pipes and have become a key material for gas transport. However, polyethylene pipes exposed to the environment inevitably undergo aging during use. The aging process is influenced by various factors, such as temperature, humidity, pressure, corrosive media, and microorganisms, all of which contribute to the deterioration of the material’s performance [7–9]. During the aging process, polyethylene pipes are particularly susceptible to oxidative degradation. On a microscopic level, oxidative degradation leads to the oxidation of the molecular chains within polyethylene, resulting in the fracture and reduction of the molecular chains in the average molecular mass. On a macroscopic level, the most significant changes observed are in the shape and color of the pipes, indicating that their mechanical properties have been notably affected. Flowability and oxidative stability are critical properties that determine whether polyethylene pipes can function properly under complex environmental conditions.
The Arrhenius equation describes the relationship between the rate constant (K), temperature (T), and activation energy (Ea), thus revealing the oxidative behavior and thermal stability of materials at elevated temperatures [10–12]. The more significant the aging factors affecting the material, the more susceptible the polymer is to oxidative reactions. Additionally, a lower activation energy leads to a faster reaction rate and reduced thermal stability [13]. Consequently, the Arrhenius equation is widely used in studying material stability and aging processes.
2 Current Status of Research at Home and Abroad
In recent years, researchers both domestically and internationally have explored various methods to slow down the oxidative degradation of polyethylene. Polymers with good thermal stability can effectively prevent or reduce material degradation, thereby preserving their flowability. In contrast, materials prone to degradation under high-temperature conditions, its flowability will be compromised, and it may even lead to the loss of the material’s functionality. Babaghayou et al. [14] investigated the thermal degradation process of natural rubber/polystyrene interpenetrating polymer networks (IPN) by determining kinetic parameters such as activation energy (Ea) and activation entropy using the Arrhenius equation. The study indicated that the IPN materials, aged for 72 h at 100°C, exhibited enhanced mechanical strength due to crosslinking during the post-curing process. The thermal stability of polymers is closely related to their degradation rate, and determining the apparent activation energy (Ea) is a critical step in assessing thermal stability. Blanco et al. [15] studied the thermo-oxidative degradation behavior of four common polymers, through isothermal heating experiments. The researchers determined the apparent activation energy (Ea) of polymer degradation from thermogravimetric analysis data and developed a mathematical model based on mass loss using regression curve methods, thereby validating the applicability of the isothermal thermogravimetric regression method in assessing the Ea values for degradation of different polymers. Ding et al. [16] investigated the degradation kinetics of various polymers to gain deeper insights into their durability.
However, the above methods primarily focus on the aging effects of temperature on materials, without fully accounting for, multifaceted factors involved in practical engineering applications. This study, based on the Arrhenius equation, investigates the flow properties and thermal stability of aging gas polyethylene pipes under the combined effects of temperature and pressure. The research provides valuable scientific evidence for predicting the service life and optimizing the performance of the pipes, offering a theoretical foundation for the evaluating the aging life of polyethylene pipes and their performance in the practical gas pipeline engineering applications.
The maximum aging time in this study was set to 144 h, with the primary aim of investigating the oxidation performance variation of gas polyethylene pipes during the initial aging process, under the influence of multiple factors. Subsequent studies will extend the aging duration, and apply accelerated aging experiments for a comprehensive lifecycle study.
This study selected polyethylene pipes with a diameter of 40 mm and PE80 grade, setting different aging pressure conditions (0, 0.1, 0.2, 0.3 MPa), and examining the pipes under various aging temperatures (353, 363, 373, 383 K) and aging times (8, 24, 96, 144 h).
In this experiment, four pressure levels of 0, 0.1, 0.2, and 0.3 MPa are selected mainly to simulate different working conditions and assess the performance of polyethylene pipes under different pressures. 0 MPa represents the condition without external pressure, which simulates the natural aging of the pipes under no working pressure. While 0.1, 0.2, and 0.3 MPa represent the aging conditions of the pipes under different pressure levels in actual operation. Such testing can provide complete data on the durability and stability of pipes under various pressure environments. Temperature is a key factor affecting the aging rate of polyethylene pipe materials. An increase in temperature accelerates the oxidation process of polyethylene, making the aging phenomenon of the material more apparent. The temperature range from 353 to 383 K roughly covers the temperature range that might be encountered in common working environments. By selecting different aging times of 8, 24, 96, and 144 h, the aging characteristics of the material can be studied at different time intervals.
The sample groupings are detailed in Table 1, with Fig. 1 illustrating the sample grouping diagram and Fig. 2 depicting the schematic of the accelerated aging chamber for polyethylene pipes.
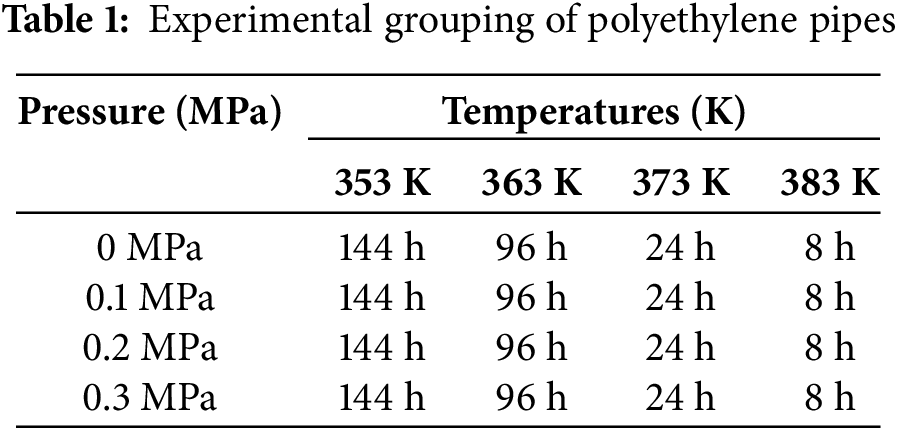
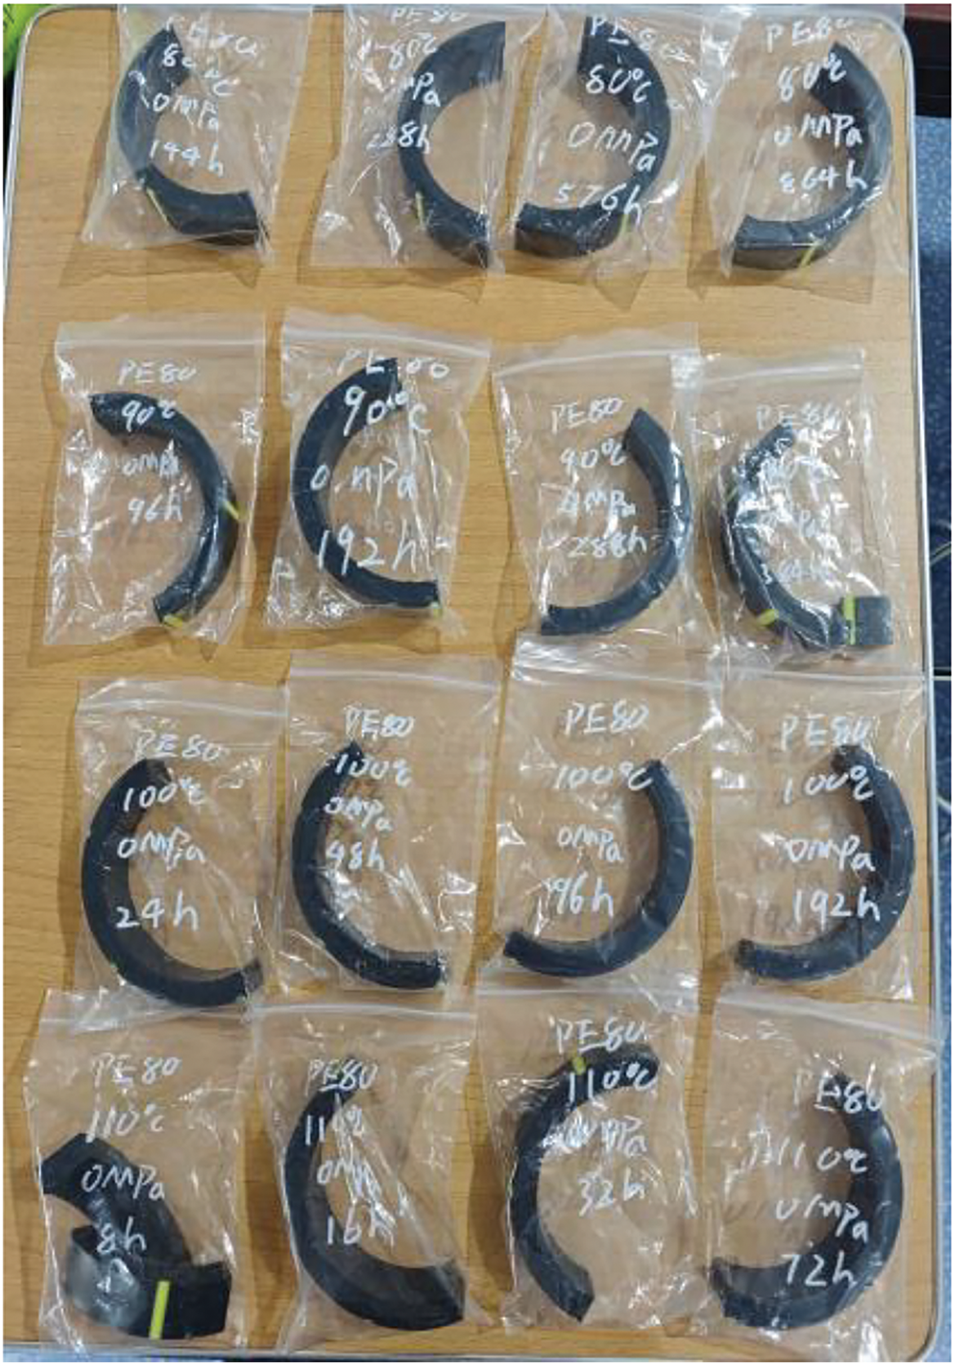
Figure 1: Shape of polyethylene pipe samples
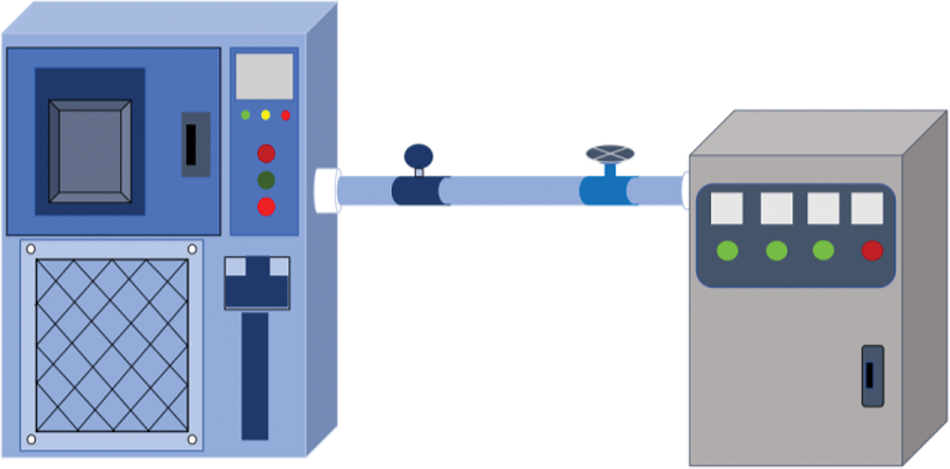
Figure 2: Schematic diagram of the accelerated aging chamber (From left to right: High-temperature pressurized aging chamber, pressure gauge, valve, pressurization chamber)
3.2 Melt Mass Flow Rate (MFR) Test
After the aging experiments on the pipe materials, the MFR and the OIT of the aged materials were tested for each group. The melt mass flow rate is typically given in g/10 min, representing the mass of melt extruded within 10 min. This study was conducted based on the experiments of Abbas-Abadi et al. [17], where the testing temperature was set to 190°C (above the glass transition temperature of polyethylene pipe materials), with a 5 kg load applied. The polyethylene pipe samples were cut into pellets (Fig. 3), and after preheating the equipment, the pellets were loaded into the test barrel and subjected to the specified load, allowing the molten material to extrude through a standard nozzle (Fig. 4). The mass of the extruded melt is measured within the specified time. The extrudate is periodically cut at 40-s intervals to determine the extrusion rate. After cooling, the remaining extrudates are weighed individually (to the nearest 1 mg), and their average mass is computed. The melt mass flow rate testing process is illustrated in Figs. 3 and 4. The MFR is calculated using Eq. (1), with units of g/10 min:
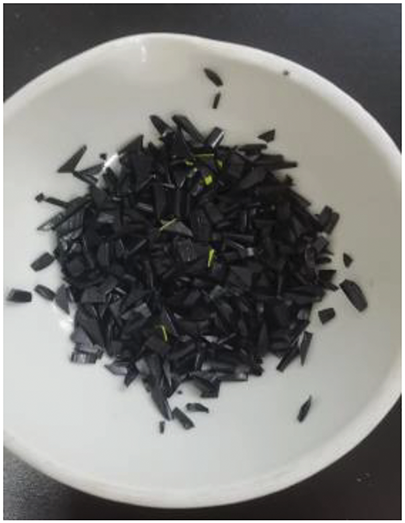
Figure 3: Polyethylene pipe molten mass specimen particles
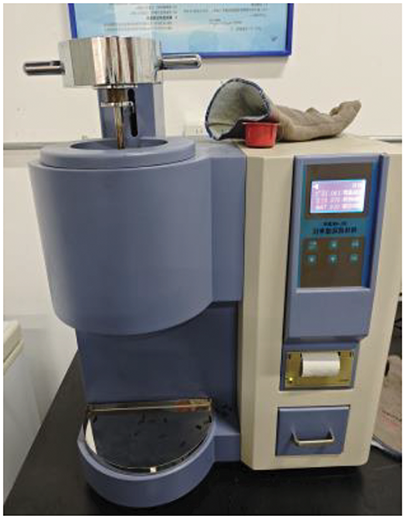
Figure 4: Melt mass flow rate meter
In the equation, T is the aging temperature in K; mom indicates rated load in kg; m is the average quality of the cut extracts in g; t is the cutting epoch in seconds (s); 600 is the conversion factor from g/s to g/10 min, with the reference time being 10 min (10 min = 600 s).
3.3 Differential Scanning Calorimetry (DSC)
Based on the experimental procedure in reference [18], and according to the existing conditions in the laboratory, the maximum temperature of the DSC was set to at least 500°C before the experiment, maintaining a temperature stability of ±0.3°C. Fig. 5 shows the differential scanning calorimeter (DSC). The polyethylene pipe material was processed into granules of 1 mm × 1 mm × 0.5 mm, and 15 ± 2 mg of the sample were weighed, with three samples were prepared. The oxygen and nitrogen supply system was initiated, and the gas flow rates are adjusted to 50 ± 5 cm3/min, before switching to a nitrogen flow. The aluminum pan containing 15 ± 2 mg of specimen is placed on the DSC specimen stand, and the temperature was raised at a rate of 20°C/min until it reaches 200 ± 0.1°C. The thermal curve is recorded during the isothermal phase, which lasts for 5 min. Afterward, oxygen is quickly introduced, and the test is terminated when the maximum oxidation exothermic value is recorded on the thermal curve.
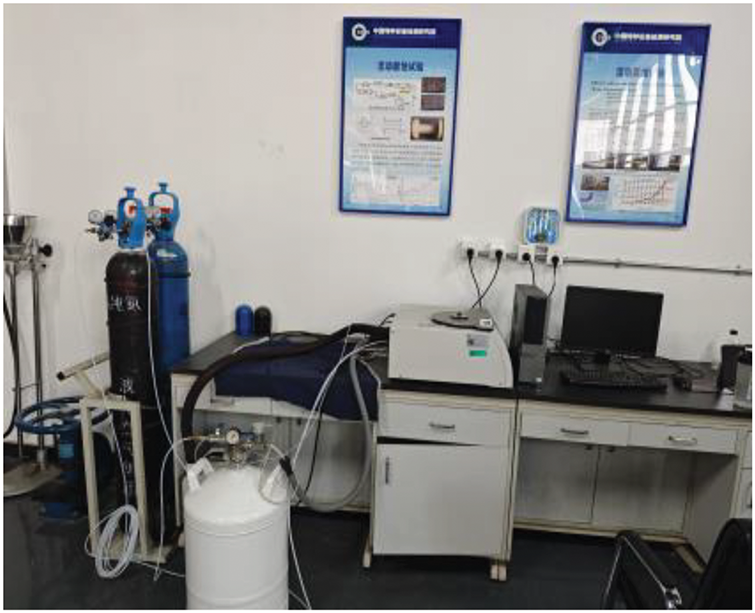
Figure 5: Differential scanning calorimeter
The MFR test is of significant importance in material performance testing, as it provides critical information about the material’s melting behavior, which is valuable for industry experts in evaluating the processing performance and quality of raw materials [19–21]. This study utilizes the MFR test to assess the flowability of polyethylene pipes, particularly in the molten state, with the aim of more effectively characterizing the performance changes of polyethylene pipes after accelerated aging.
Fig. 6 shows the variation in melt viscosity of the pipes at different temperatures (353, 363, 373, and 383 K). As the temperature gose up, the melt viscosity of the pipe gradually decreases. Under the same pressure, the reduction in melt viscosity becomes more pronounced with increasing temperature. Under different pressure conditions, the melt viscosity of the pipes also gradually decreases as the temperature rises. Fig. 7 presents a more intuitive representation of the relationship between temperature (353, 363, 373, 383 K) and pressure (0, 0.1, 0.2, 0.3 MPa) on the melt viscosity of the pipes through a three-dimensional coordinate plot. Regardless of whether the aging factor is temperature or pressure, the melt tackiness reduces with increasing pipe aging. The results indicate that both temperature and pressure, as aging factors, significantly affect the pipe’s performance, leading to a decrease in the flowability of the pipes during aging.
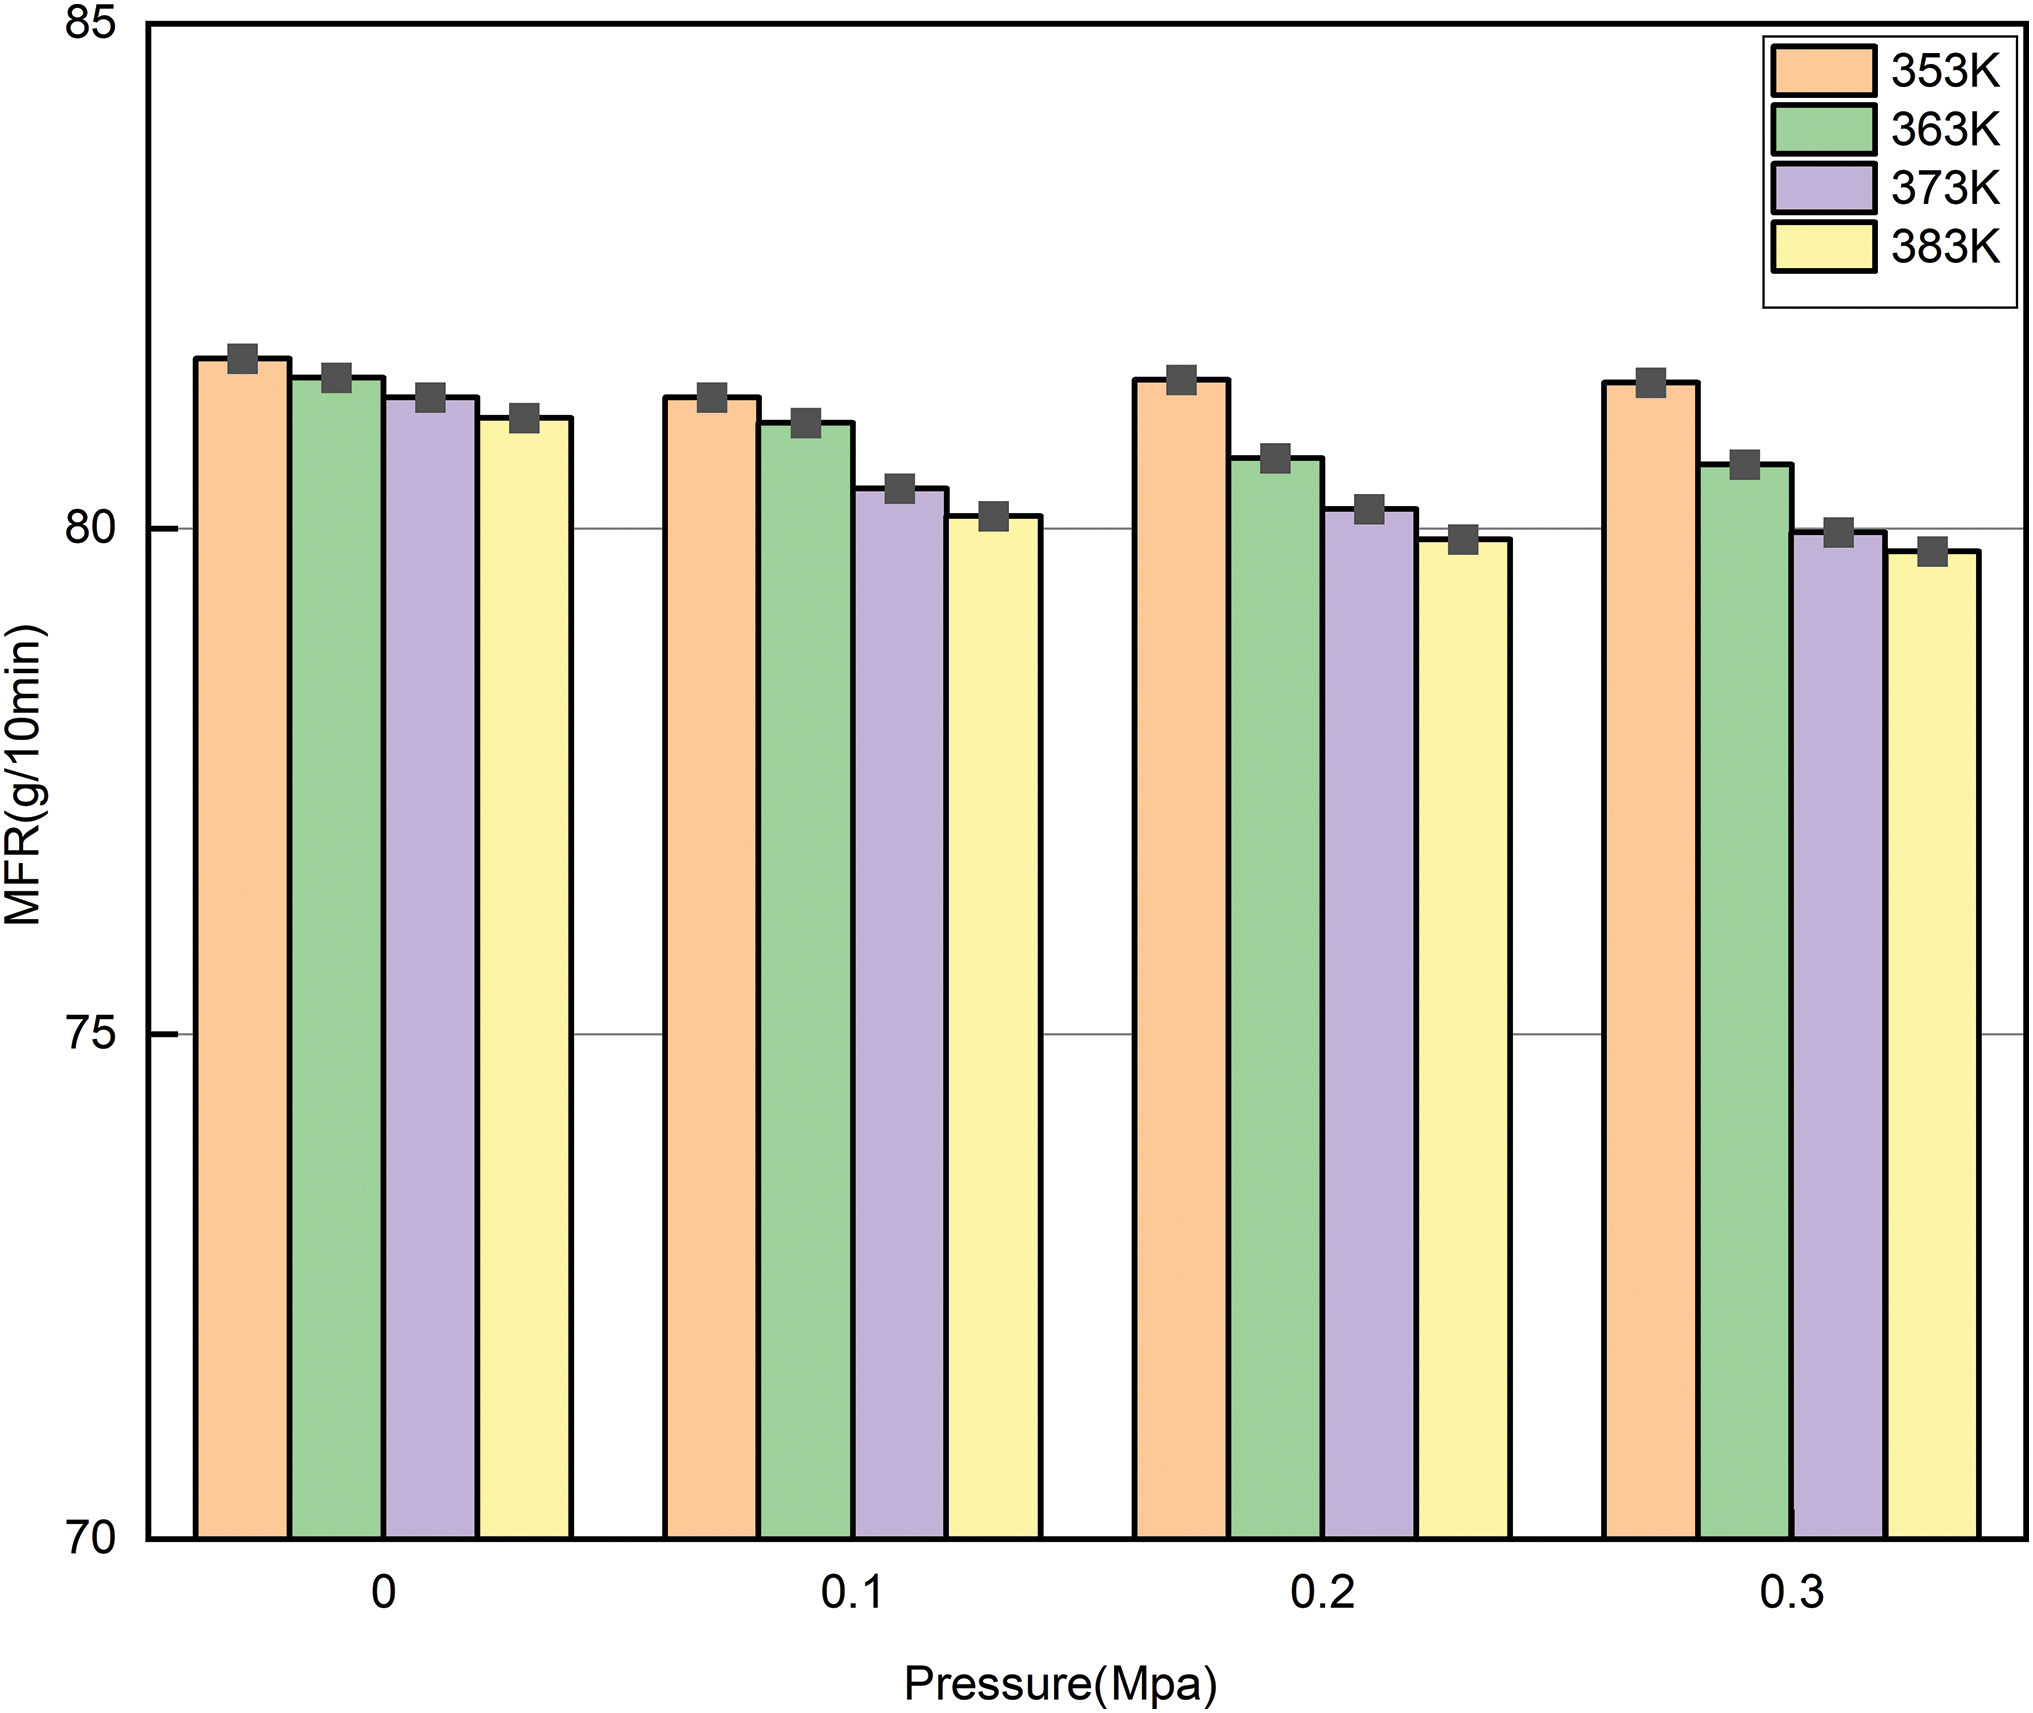
Figure 6: Trend of melt viscosity variation with pressure
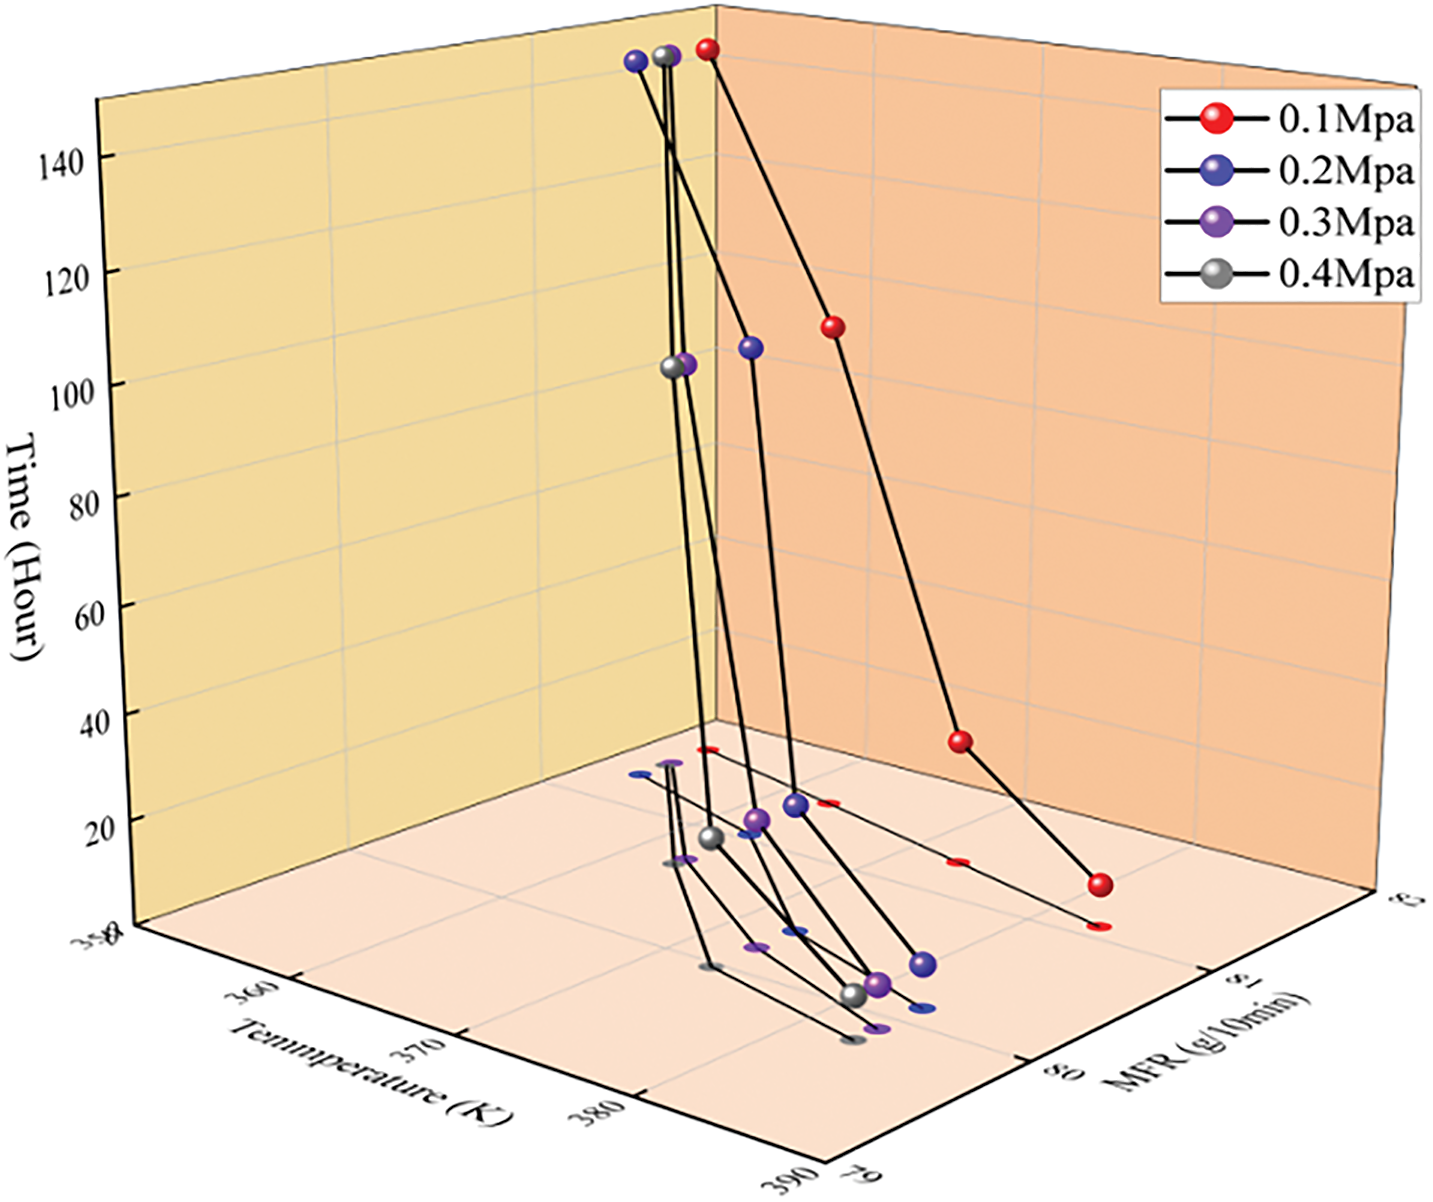
Figure 7: Trend of melt viscosity variation with different pressures and temperatures
Thermal stability testing is a critical method for assessing the antioxidant material properties in an oxygen environment, and it is particularly important in polymer material research [22]. The oxidation induction time of polymers is measured using a (DSC), which can quantify the modifications to the material’s intrinsic oxidants. A reduction in antioxidants leads to an increased susceptibility to oxidation reactions, thereby lowering the thermal stability [23–25]. The longer the oxidation induction time, the stronger the oxidation stability of the material, allowing it to better resist oxidation reactions.
The oxidation induction time (OIT) refers to the time period during which a material remains stable before oxidation reactions occur [26]. The results in Fig. 7 indicate that, at the same pressure, the OIT of polyethylene pipes decreases with increasing temperature, indicating a decrease in the material’s oxidation stability. Oxidation reactions in polymer materials are sensitive to temperature changes, and an increase in temperature accelerates molecular motion, thereby enhancing the oxidation reaction rate [27]. As the temperature rises, the molecular chain structure and intermolecular interactions of polyethylene can be disrupted, leading to changes in the antioxidants within the pipe. The depletion of antioxidants accelerates the oxidation activity, and the increase in temperature further promotes the initiation of the oxidation reaction, thereby shortening the OIT.
Figs. 8 and 9 show the relationship between the OIT of the material and changes in temperature and pressure. Both increasing temperature and pressure result in a gradual reduction in the OIT. In Fig. 8, the curves at 0.3 and 0.4 MPa are steeper, indicating that as pressure and temperature increase, the decrease in OIT becomes more significant. This phenomenon suggests that temperature and pressure influence the content of antioxidants within the material. The more significant the influencing factors, the faster the consumption of antioxidants, making the material more prone to oxidation. The oxidation reaction intensifies at higher temperatures, reducing the material’s thermal stability and accelerating its aging process.
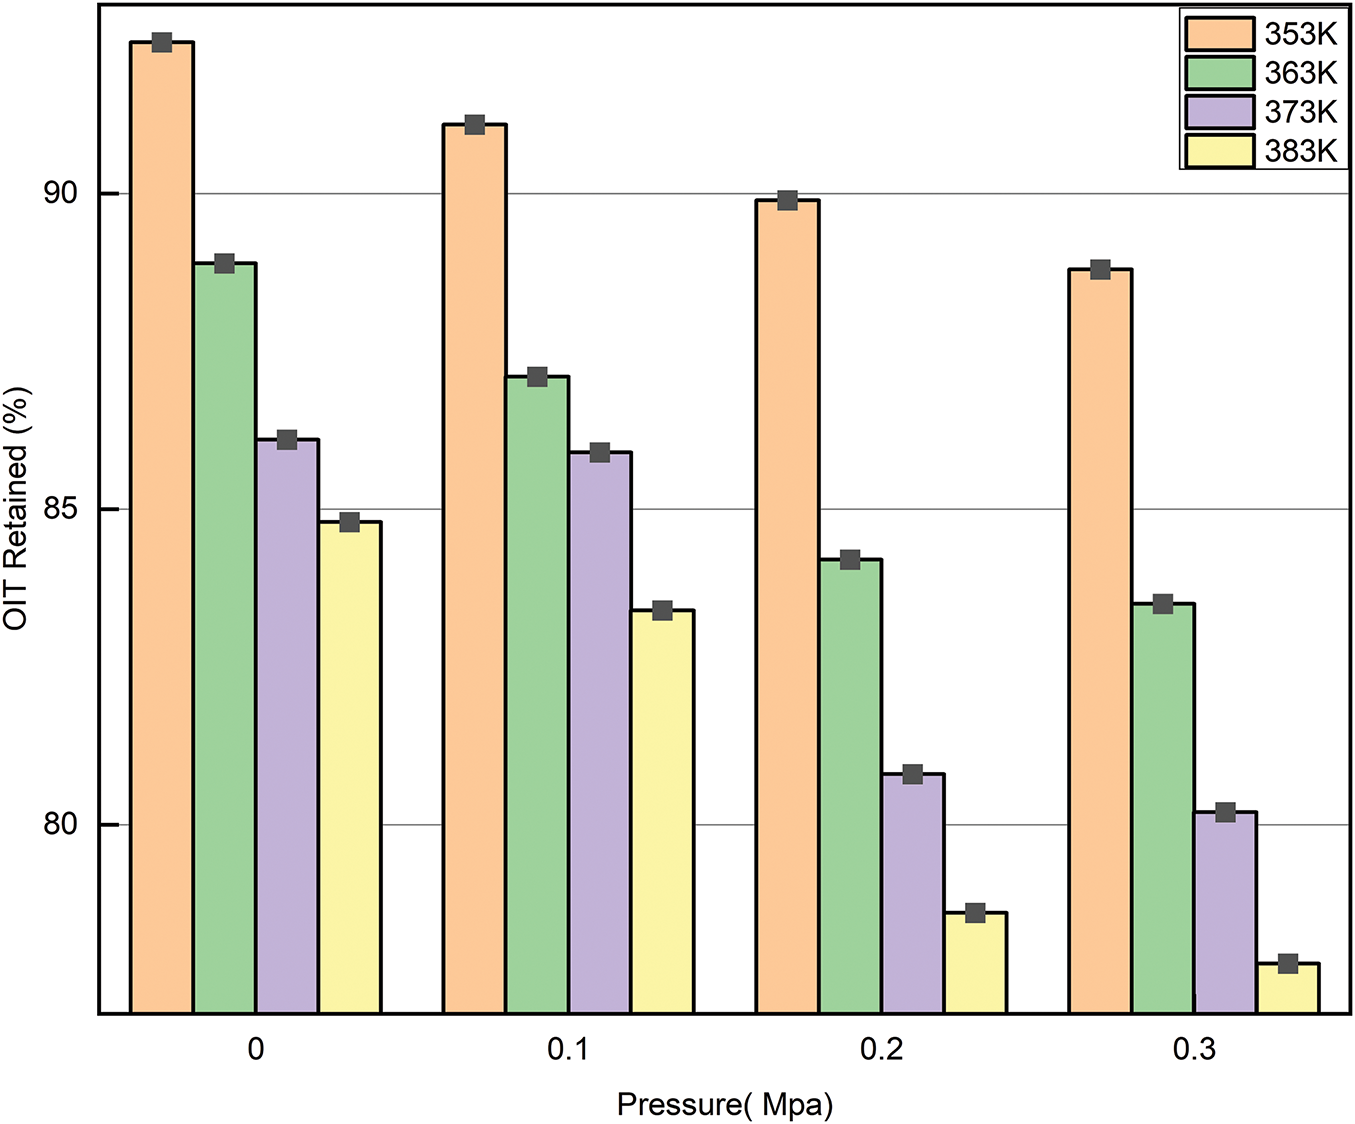
Figure 8: Oxidation induction percentage of each sample under different temperature conditions
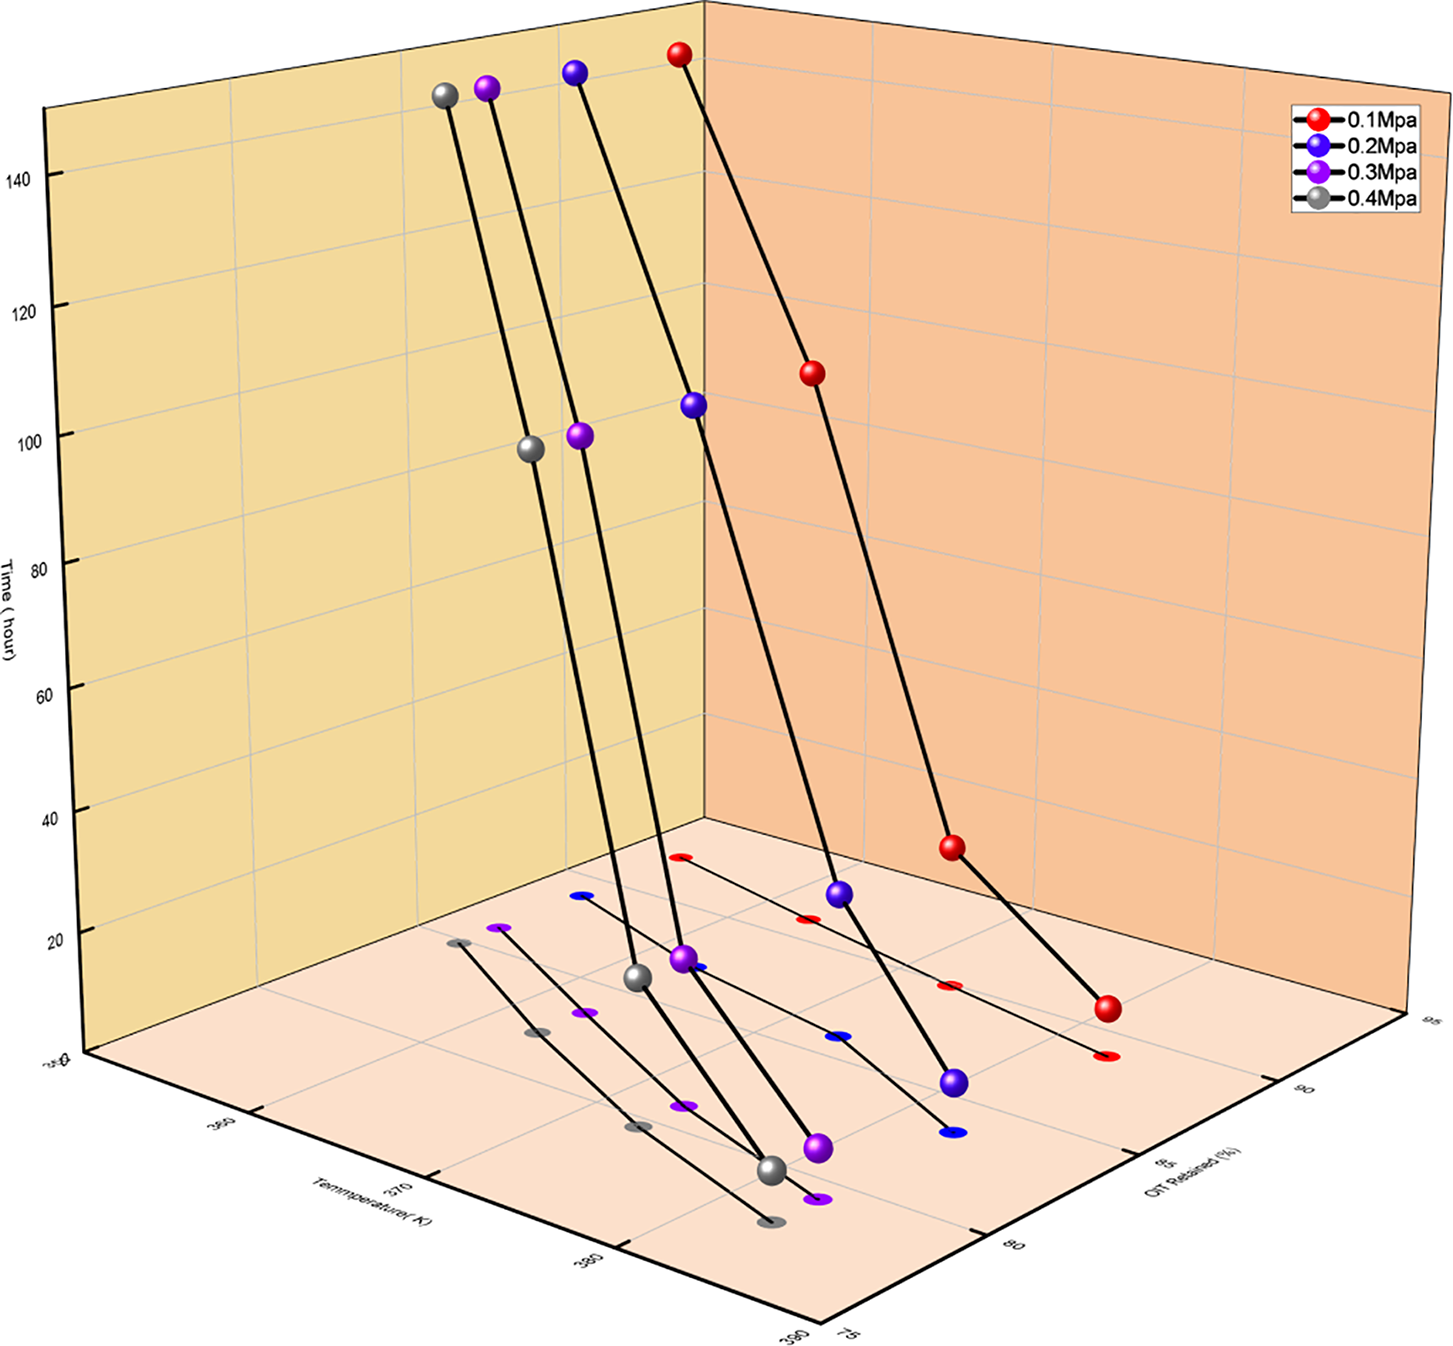
Figure 9: Oxidation induction time at different temperatures under four pressure conditions
Under high-temperature conditions, the velocity of molecules in a system increases with rising temperature. This phenomenon is observed across gases, liquids, and solids. In this context, the velocity of molecules is positively correlated with their kinetic energy, and under thermodynamic conditions, the proportion of high-energy molecules increases. When the molecular energy is equal to or exceeds to the activation energy (Ea), the molecules possess sufficient energy to overcome the energy barrier of the reaction. The Arrhenius equation can also be used to determine force stimulation of molecules [28], as indicated by Eq. (2):
K represents the reaction rate, A is the pre-exponential factor in the Arrhenius equation, R is the gas constant, Ea is the stimulation fuel of the reaction, and T is the absolute temperature in K.
4.4 Thermal Stability Analysis
Under high-temperature and oxygen environments, the time over which the sample undergoes autocatalytic oxidation is referred to as OIT, serving serves as a key indicator for evaluating the material’s resistance to thermal degradation. DSC is used to measure the accelerated aging of polyethylene in high-temperature oxygen environments, based on the heat released during the fracture of polyethylene chains. Antioxidants slow down the oxidation reaction of the polymer during this process, thereby reducing associated losses. At a specific temperature, the protective effect of antioxidants exhibits a defined induction period [29], and it suppresses polymer degradation during the consumption of the antioxidants. Consequently, the stability of polyethylene depends on the remaining amount of radicals present in the polymer [30]. Once the antioxidant has been fully consumed, the oxidation reaction rapidly intensifies, resulting in a notable rise in the degradation rate of polyethylene.
The inverse relationship between temperature and oxidation induction time reveals the impact of temperature on the oxidation pace of reaction. Oxidation induction time is described as the time from the reaction onset to the point where oxidation becomes significant. In most oxidation reactions, the induction period is closely related to the activation of reactants or catalysts and the early stages of the reaction [31]. As shown in Fig. 10, the inverse relationship between temperature and oxidation induction time indicates that increasing the temperature accelerates the reaction rate, thereby shortening the induction period. This is because higher temperatures facilitate the accumulation of energy in the reactants, allowing the reaction to transition into the main reaction phase in a shorter period of time. Furthermore, temperature also influences the reaction mechanism, the surface properties of the reactants, and the activity of the catalyst, further accelerating the shortening of the induction period. In practical applications, being aware of the connection between temperature and oxidation induction time is crucial for effectively controlling the oxidation reaction rate, optimizing industrial processes, and extending the service life of materials.
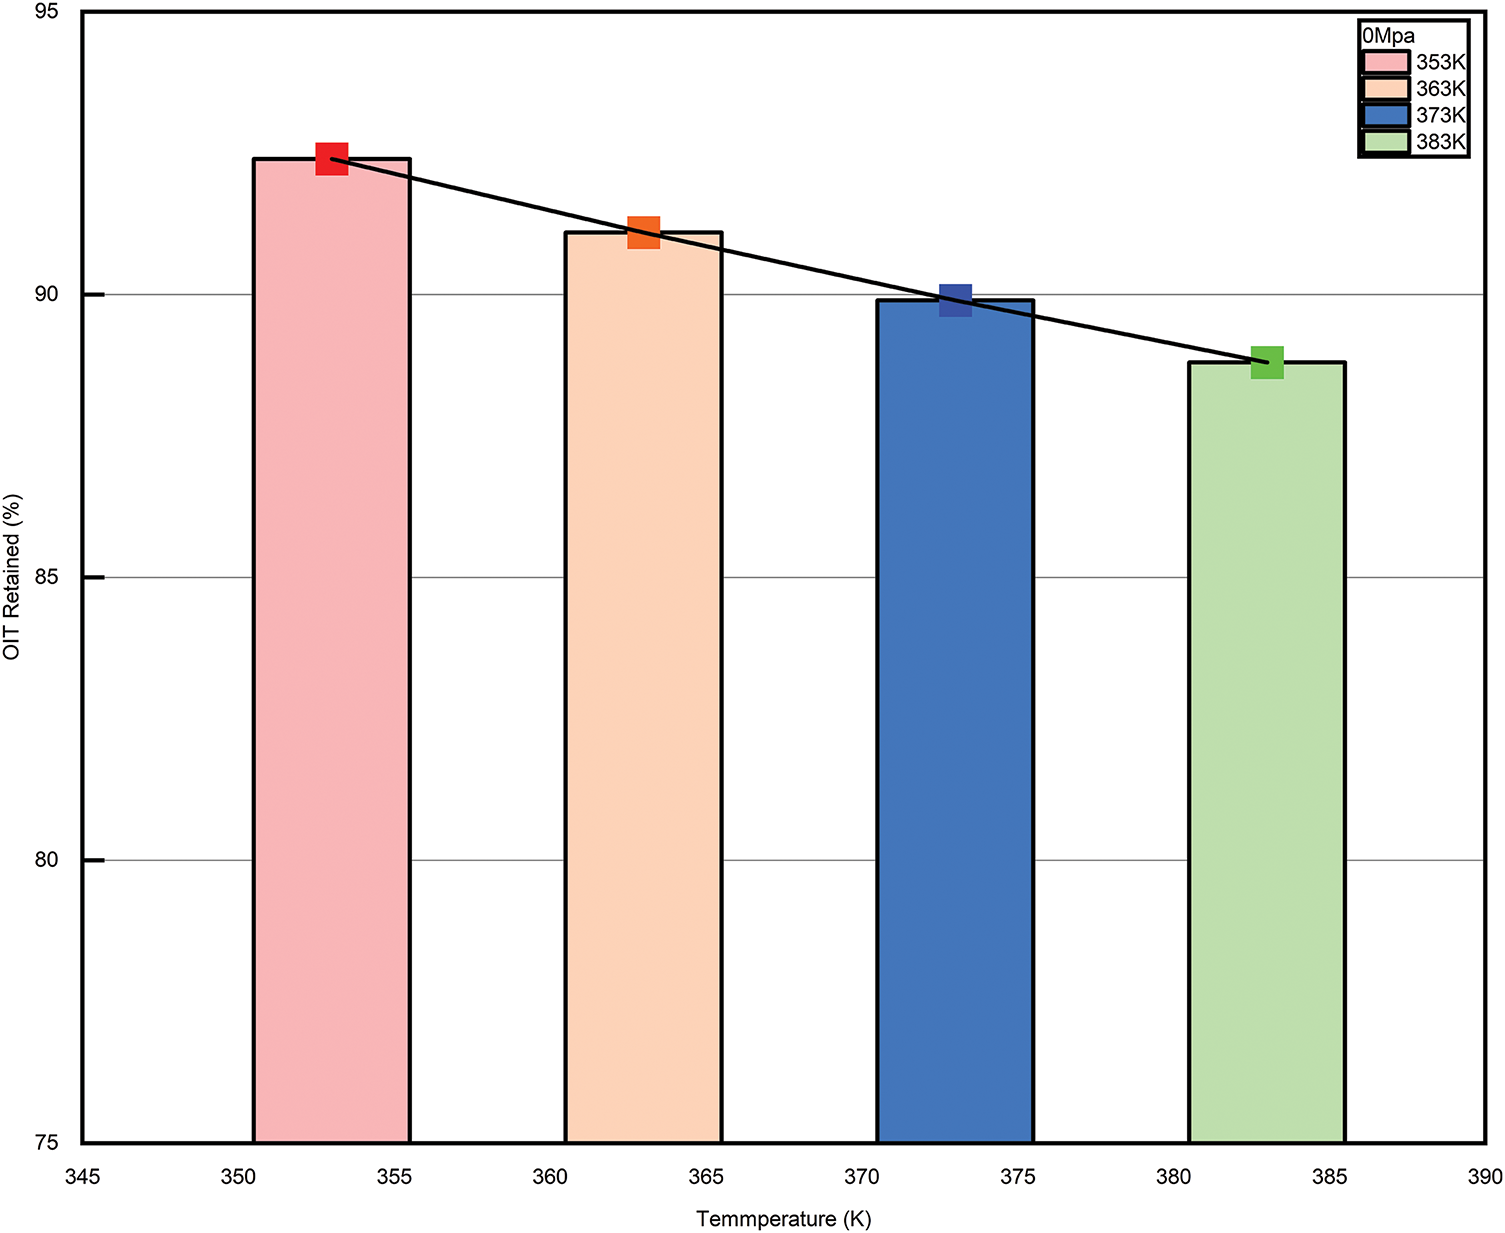
Figure 10: Relationship between temperature and percentage of oxidation induction at each pressure
The key to thermal stability analysis lies in assessing the degradation rate of materials at different temperatures. According to the Arrhenius equation, the reaction rate constant is affected by temperature is represented by an exponential term, where Ea denotes the activation energy, which reflects the energy obstacle that needs to be broken in order to the degradation reaction to occur at a specific temperature. Ea quantifies the energy barrier that the material must overcome for degradation to occur at a given temperature [32]. A higher activation energy implies that the material will have a lower degradation rate at elevated temperatures, thereby exhibiting enhanced thermal stability. By manipulating the Arrhenius equation, a direct correlation between the degradation rate constant and temperature can be derived. Taking the natural logarithm of both sides yields the following expression Eq. (3):
Let
By transformation, the following linear Eq. (4) is obtained:
Based on different pressures (0, 0.1, 0.2, 0.3 MPa), the relationship between the oxidation induction period and temperature, as shown in Fig. 11a–d.
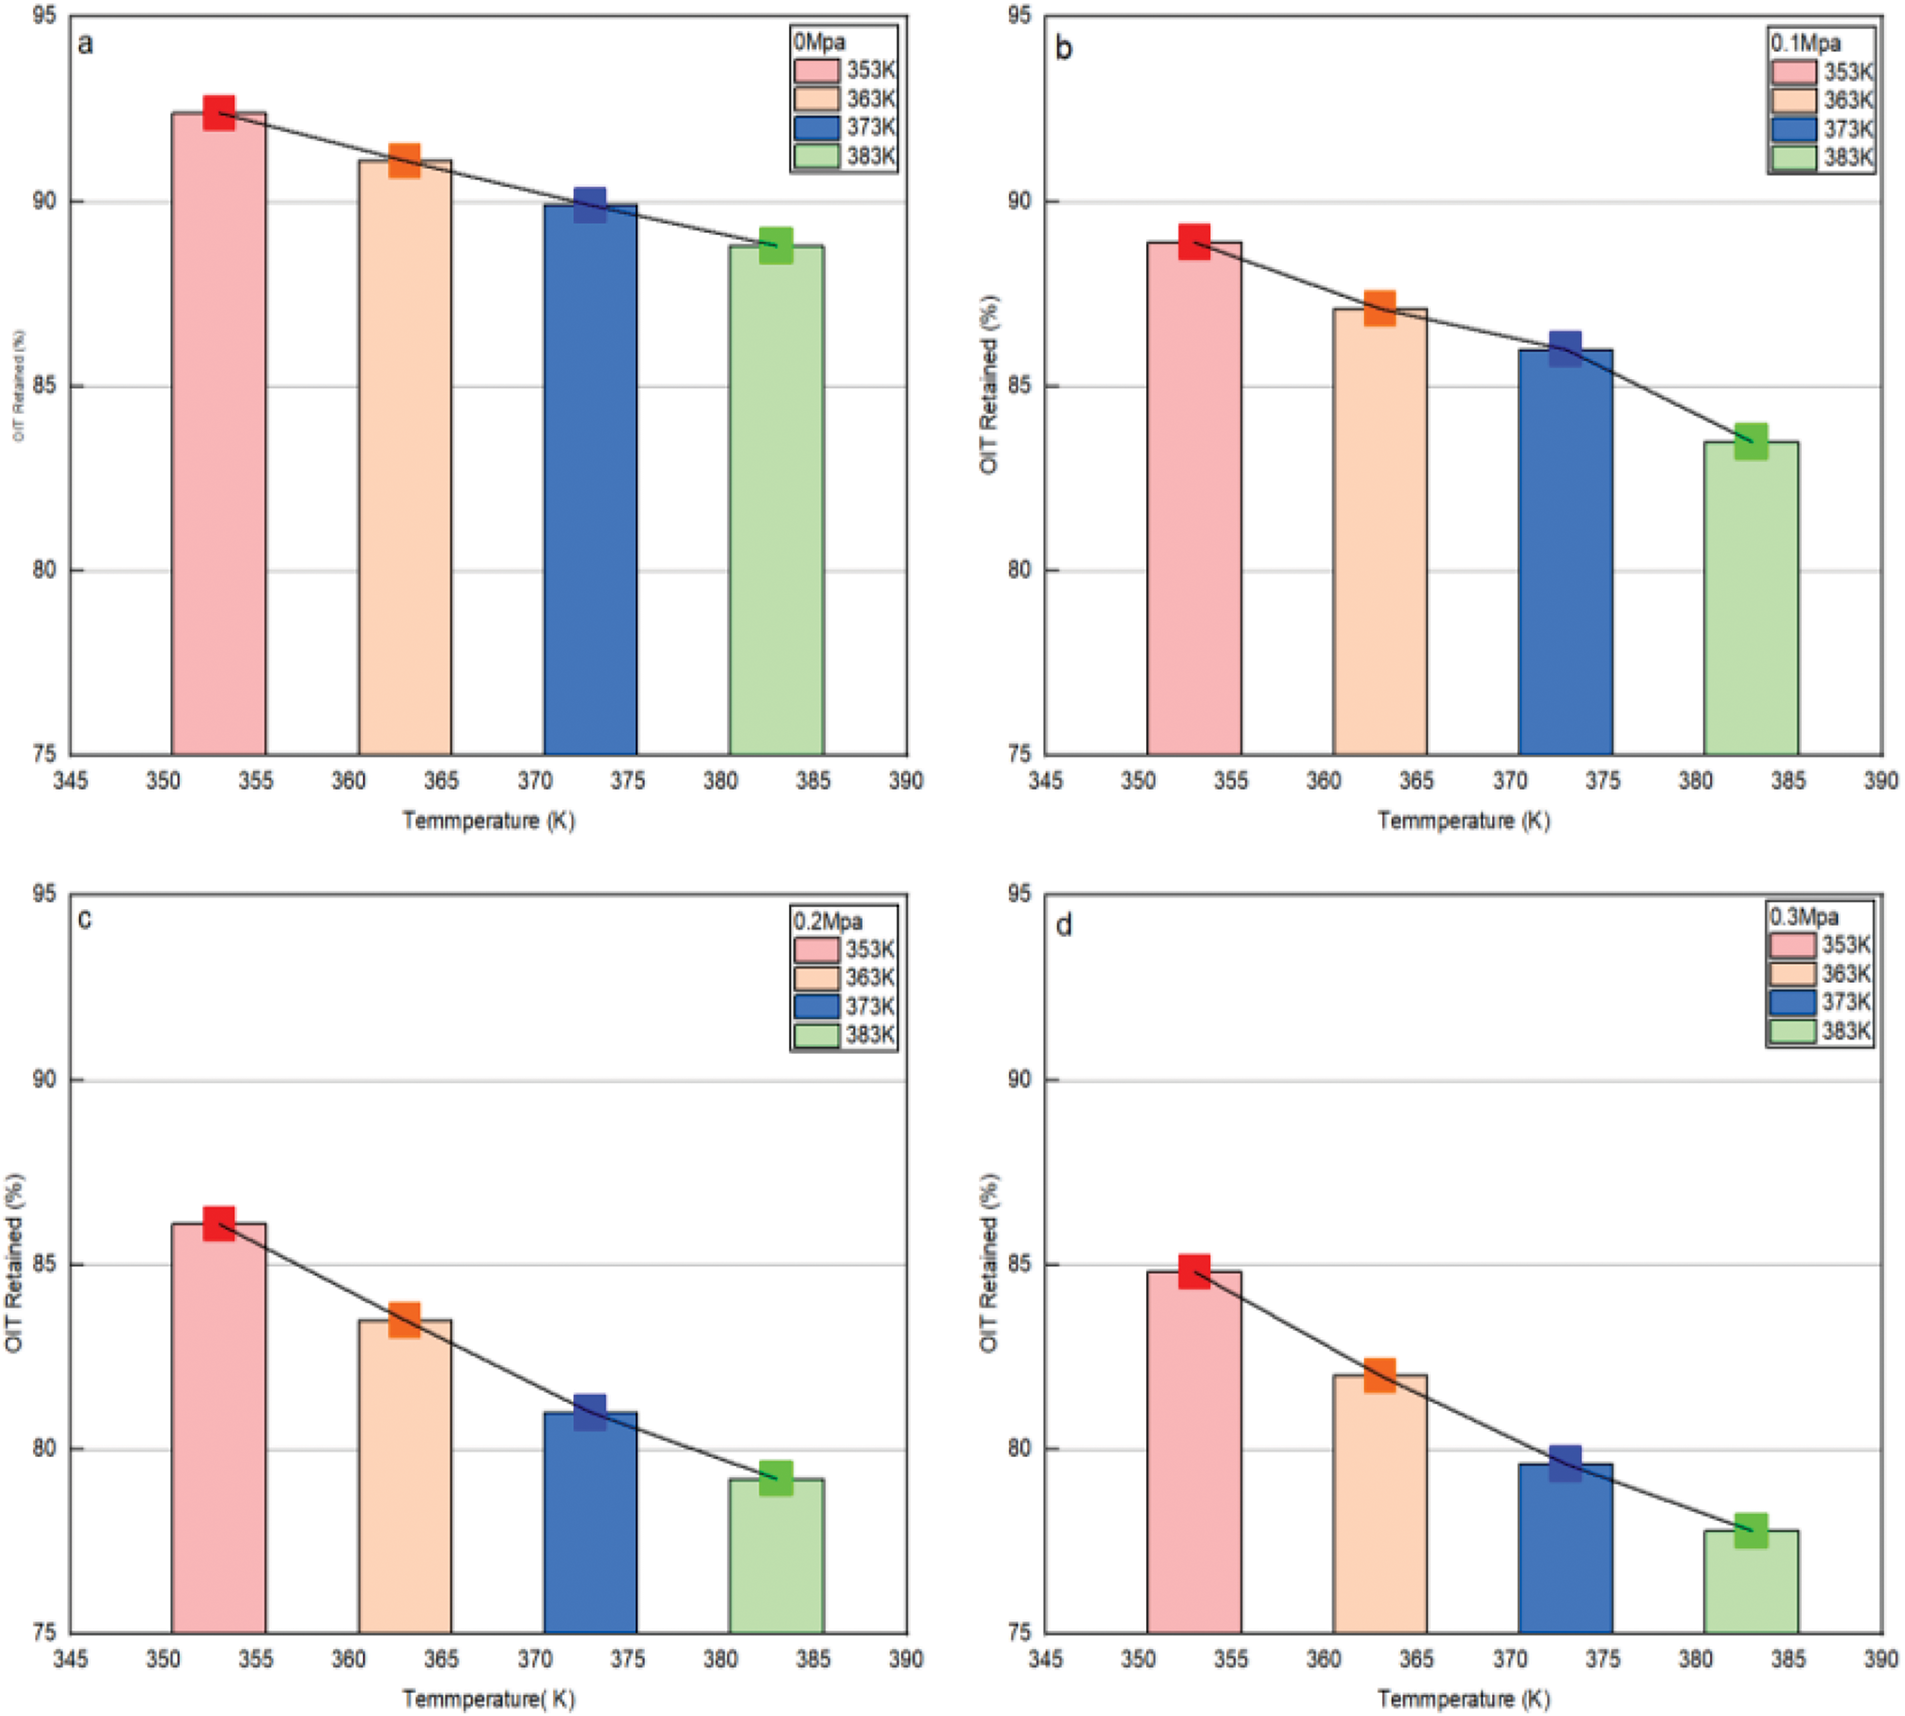
Figure 11: The relationship between oxidation induction and time. a. Relationship between each temperature and oxidative induction period at 0 MPa; b. Relationship between each temperatures and oxidative induction period at 0.1 MPa. c. Relationship between each temperatures and oxidative induction period at 0.2 MPa. d. Relationship between each temperatures and oxidative induction period at 0.3 MPa
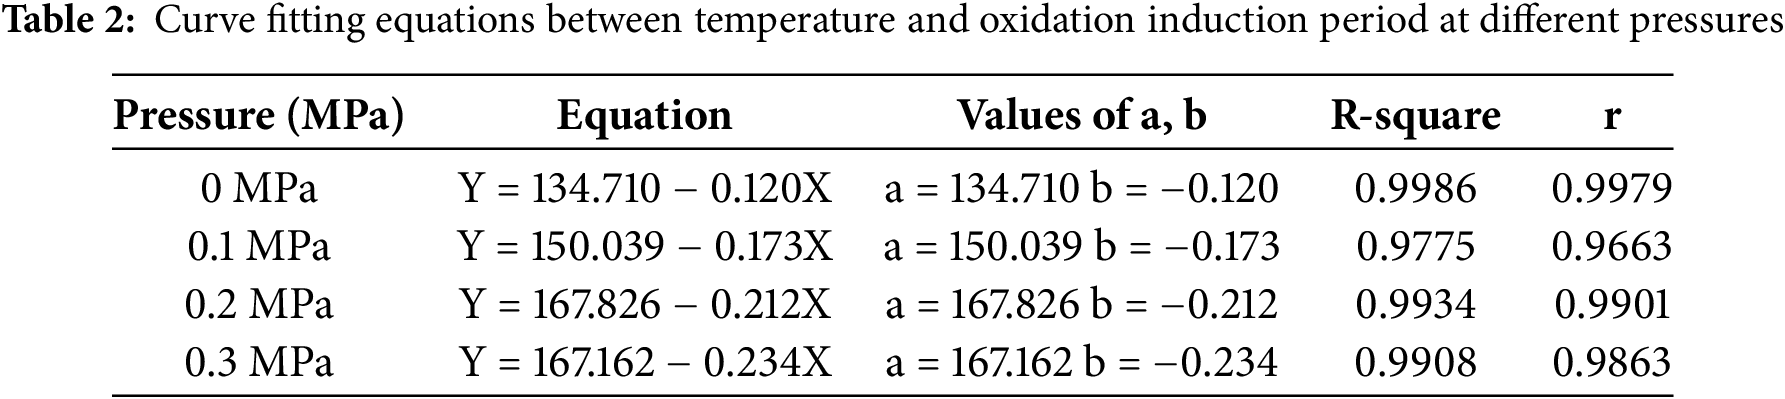
Perform a linear fitting of the obtained curve according to Eq. (2), and obtain the intercept and slope shown in Table 2.
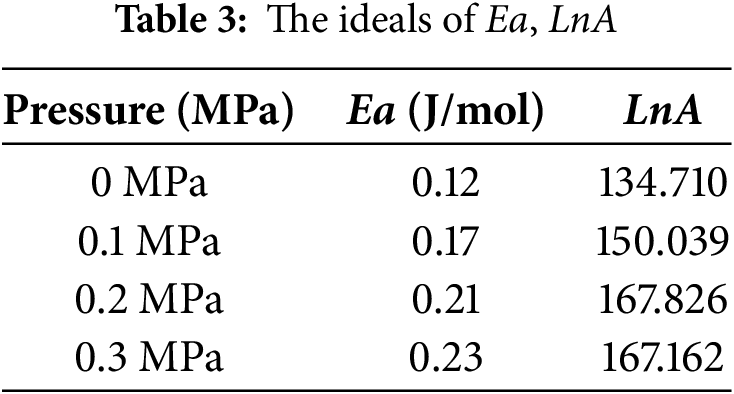
The values of activation energy Ea and LnA at each pressure can be obtained from Eq. (3) and Table 1, as shown in Table 3.
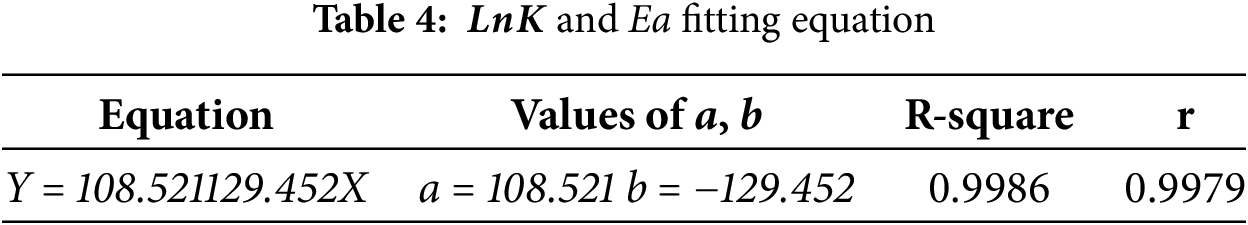
The values of the activation energy at each pressure in Table 3 are known and calculated by substituting the temperatures (353, 363, 373, 383 K) into Eq. (3), Fig. 12 and Table 4 illustrate the relationship with the activation energy Ea.
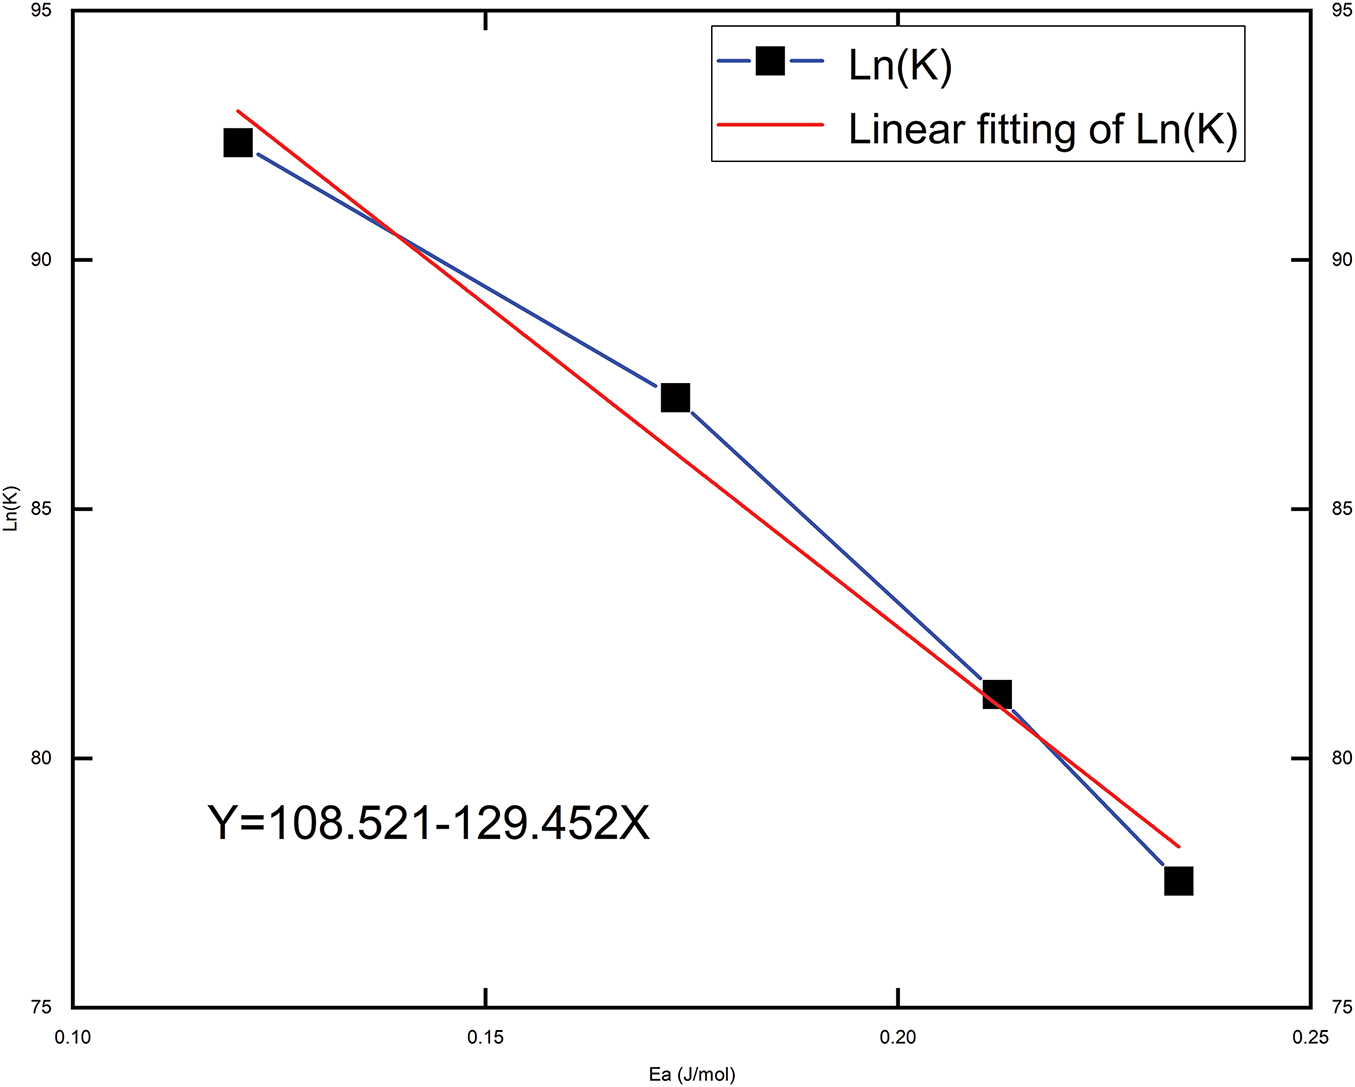
Figure 12: Relationship between
The source of energy that must be removed in order for reactants to change into products is known as the activation energy (Ea). A greater activation energy indicates that the reactant molecules require more energy to undergo the reaction, resulting in a lower reaction rate. As shown in Fig. 12, the negative correlation between Ea and the Arrhenius equation suggests that a larger activation energy leads to a smaller reaction rate, thereby slowing the reaction. This relationship underscores the critical influence of activation energy (Ea) on the reaction rate. This relationship highlights the critical role of activation energy (Ea) in assessing the material’s reaction rate. At a constant temperature, an increase in activation energy (Ea) indicates a reduction in the material’s reaction rate constant (K), thereby slowing the reaction rate.
However, the reaction rate of the material does not continuously decrease with increasing temperature. This trend holds within certain temperature ranges; however, as the temperature continues to rise, the thermal energy of the reactant molecules increases, causing a greater number of molecules to exceed the activation energy, thereby accelerating the reaction rate [33]. Therefore, the Arrhenius equation indicates that the relationship between temperature and reaction rate is nonlinear. Whenever the temperature increases beyond a certain threshold, the reaction rate constant typically increases significantly. At constant or lower temperatures, a larger activation energy results in a slower reaction rate, meaning that reactions with higher activation energies exhibit significantly lower rates at lower temperatures. By applying the Arrhenius equation, scientists can estimate the reaction rates of different reactions at various temperatures, thus optimizing the reaction conditions in industrial processes. According to the outcomes of the study, the activation energy of polyethylene pipes in this research shows an inverse relationship with the reaction rate. The temperatures used in the experiments are designed to accelerate the polyethylene pipes’ deterioration, while temperatures under actual service conditions are much lower than those used in the experiments. Consequently, the connection between response rate and activation energy for buried gas polyethylene pipes also follows a decreasing trend.
By applying the Arrhenius equation, this study analyzes the effects of temperature and pressure on the aging reaction rate of polyethylene pipelines. It derives the relationship between aging rate and activation energy. The results indicate that an increase in temperature accelerates the aging reaction, while a higher activation energy slows down the reaction rate. By fitting the aging experimental data under different pressure conditions, the study establishes a connection between reaction rate and energy stimulation, providing a scientific basis for predicting the service life of these pipelines. Furthermore, the oxidation performance of aged polyethylene pipelines suggests that molecular dynamics simulations can reveal molecular-level changes, offering valuable insights into the aging mechanisms. This approach is crucial for understanding the aging process of polyethylene pipelines. The combination of mathematical models and molecular dynamics provides a novel way to simulate the microscopic behavior of pipelines under aging conditions. This method enhances the comprehensive understanding of the pipeline aging process and offers theoretical support for optimizing existing assessment methods. Although the findings are significant, certain limitations exist. Since buried pipelines typically experience lower temperatures and pressures during long-term use, the experimental conditions (high temperature and high pressure) may not accurately reflect the actual operating conditions of buried pipelines. Future studies should explore the influence of other factors, such as temperature, pressure, and corrosive media, to better reflect the aging process of buried polyethylene pipelines in real-world environments. Integrating computer vision technology for real-time monitoring and surface analysis, combined with physical testing methods, can improve the accuracy and efficiency of aging assessments.
Acknowledgement: We sincerely thank the anonymous reviewers for their constructive comments, which led to serious improvements in the manuscript.
Funding Statement: This work was supported by the Sponsored by Natural Science Foundation of Xinjiang Uygur Autonomous Region (no. 2022D01C389), the Xinjiang University Doctoral Start-up Foundation (no. 620321029), and the Science and Technology Planning Project of State Administration for Market Regulation (no. 2022MK201).
Author Contributions: The authors confirm contribution to the paper as follows: Conceptualization, Writing—original draft, Writing—review, Supervision, Validation and Editing: Li Niu; Funding acquisition and Supervision: Yang Wang; Investigation: Yaoying Yue, Nan Lin; Resources: Wenbin Fu, Elzat Tuhanjiang. All authors reviewed the results and approved the final version of the manuscript.
Availability of Data and Materials: The data obtained in this study are available from the corresponding author upon reasonable request.
Ethics Approval: Not applicable.
Conflicts of Interest: The authors declare no conflicts of interest to report regarding the present study.
References
1. Ozturk M, Dincer I. A comprehensive review on power-to-gas with hydrogen options for cleaner applications. Int J Hydrogen Energy. 2021;46(62):31511–22. doi:10.1016/j.ijhydene.2021.07.066. [Google Scholar] [CrossRef]
2. Dincer I, Acar C. A review on clean energy solutions for better sustainability. Int J Energy Res. 2015;39(5):585–606. doi:10.1002/er.3329. [Google Scholar] [CrossRef]
3. Economides MJ, Wood DA. The state of natural gas. J Nat Gas Sci Eng. 2009;1(1–2):1–13. doi:10.1016/j.jngse.2009.03.005. [Google Scholar] [CrossRef]
4. Guo YB, Meng XL, Wang DG, Meng T, Li SH, He RY. Comprehensive risk evaluation of long-distance oil and gas transportation pipelines using a fuzzy Petri net model. J Nat Gas Sci Eng. 2016;33(4):18–29. doi:10.1016/j.jngse.2016.04.052. [Google Scholar] [CrossRef]
5. Liu WY, Hu JQ, Li XF, Sun Z, Sun FR, Chu HY. Assessment of hydrate blockage risk in long-distance natural gas transmission pipelines. J Nat Gas Sci Eng. 2018;60(9):256–70. doi:10.1016/j.jngse.2018.10.022. [Google Scholar] [CrossRef]
6. Zhang F, Yang R, Lu D. Investigation of polymer aging mechanisms using molecular simulations: a review. Polymers. 2023;15(8):1928. doi:10.3390/polym15081928. [Google Scholar] [PubMed] [CrossRef]
7. Mitroka SM, Smiley TD, Tanko JM, Dietrich AM. Reaction mechanism for oxidation and degradation of high density polyethylene in chlorinated water. Polym Degrad Stab. 2013;98(7):1369–77. doi:10.1016/j.polymdegradstab.2013.03.020. [Google Scholar] [CrossRef]
8. Lancioni N, Parlapiano M, Sgroi M, Giorgi L, Fusi V, Darvini G, et al. Polyethylene pipes exposed to chlorine dioxide in drinking water supply system: a critical review of degradation mechanisms and accelerated aging methods. Water Res. 2023;238(2–3):120030. doi:10.1016/j.watres.2023.120030. [Google Scholar] [PubMed] [CrossRef]
9. Devilliers C, Fayolle B, Laiarinandrasana L, Oberti S, Gaudichet-Maurin E. Kinetics of chlorine-induced polyethylene degradation in water pipes. Polym Degrad Stab. 2011;96(7):1361–8. doi:10.1016/j.polymdegradstab.2011.03.013. [Google Scholar] [CrossRef]
10. Wang Y, Feng GW, Lin N, Lan HQ, Li Q, Yao DC, et al. A review of degradation and life prediction of polyethylene. Appl Sci. 2023;13(5):3045. doi:10.3390/app13053045. [Google Scholar] [CrossRef]
11. Li JV, Johnston SW, Yan YF, Levi DH. Measuring temperature-dependent activation energy in thermally activated processes: a 2D Arrhenius plot method. Rev Sci Instrum. 2010;81(3):226. doi:10.1063/1.3361130. [Google Scholar] [PubMed] [CrossRef]
12. Kishor R, Padmanabhan S, Sarma KR, Patel V, Sharma S, Parikh PA. Correlation of Arrhenius parameters for UHMWPE synthesis with ethylene solubility characteristics in different polymerization media. J Appl Polym Sci. 2011;122(4):2646–52. doi:10.1002/app.34137. [Google Scholar] [CrossRef]
13. Gardette M, Perthue A, Gardette JL, Janecska T, Földes E, Pukánszky B, et al. Photo-and thermal-oxidation of polyethylene: comparison of mechanisms and influence of unsaturation content. Polym Degrad Stab. 2013;98(11):2383–90. doi:10.1016/j.polymdegradstab.2013.07.017. [Google Scholar] [CrossRef]
14. Babaghayou MI, Mourad AHI, Ochoa A, Beltran F, Cherupurakal N. Study on the thermal stability of stabilized and unstabilized low-density polyethylene films. Polym Bull. 2021;78(9):5225–41. doi:10.1007/s00289-020-03363-5. [Google Scholar] [CrossRef]
15. Blanco I, Abate L, Antonelli ML. The regression of isothermal thermogravimetric data to evaluate degradation Ea values of polymers: a comparison with literature methods and an evaluation of lifetime prediction reliability. Polym Degrad Stab. 2011;96(11):1947–54. doi:10.1016/j.polymdegradstab.2011.08.005. [Google Scholar] [CrossRef]
16. Ding S, Khare A, Ling MTK, Sandford C, Woo L. Polymer durability estimates based on apparent activation energies for thermal oxidative degradation. Thermochim Acta. 2001;367(2):107–12. doi:10.1016/S0040-6031(00)00677-8. [Google Scholar] [CrossRef]
17. Abbas-Abadi MS, Haghighi MN, Yeganeh H, Bozorgi B. The effect of melt flow index, melt flow rate, and particle size on the thermal degradation of commercial high density polyethylene powder. J Therm Anal Calorim. 2013;114(3):1333–9. doi:10.1007/s10973-013-3133-0. [Google Scholar] [CrossRef]
18. Menczel JD, Judovits L, Prime RB. Differential scanning calorimetry (DSC). Therm Anal Polym. 2009;7-239. doi:10.1002/9780470423837. [Google Scholar] [CrossRef]
19. Xu K, Wen Y, Xu X. Melt flow ratio: a way to identify the type of polyethylene. Adv Ind Eng Polym Res. 2023;6(1):79–82. doi:10.1016/j.aiepr.2022.08.001. [Google Scholar] [CrossRef]
20. Bredács M, Geier J, Barretta C, Horvath R, Geiser M, Ander K, et al. Towards circular plastics: density and MFR prediction of PE with IR spectroscopic techniques. Polym Test. 2023;124:108094. doi:10.1016/j.polymertesting.2023.108094. [Google Scholar] [CrossRef]
21. Abeykoon C, Pérez P, Kelly AL. The effect of materials’ rheology on process energy consumption and melt thermal quality in polymer extrusion. Polym Eng Sci. 2020;60(6):1244–65. doi:10.1002/pen.25377. [Google Scholar] [CrossRef]
22. Šimon P, Kolman Ľ. DSC study of oxidation induction periods. J Therm Anal Calorim. 2001;64(2):813–20. doi:10.1023/A:1011569117198. [Google Scholar] [CrossRef]
23. Hernández Fernández J, Cano H, Guerra Y, Puello Polo E, Ríos-Rojas JF, Vivas-Reyes R, et al. Identification and quantification of microplastics in effluents of wastewater treatment plant by differential scanning calorimetry (DSC). Sustainability. 2022;14(9):4920. doi:10.3390/su14094920. [Google Scholar] [CrossRef]
24. Schmid M, Affolter S. Interlaboratory tests on polymers by differential scanning calorimetry (DSCdetermination and comparison of oxidation induction time (OIT) and oxidation induction temperature (OIT
25. Pospıšil J, Horák Z, Pilař J, Billingham NC, Zweifel H, Nešpůrek S. Influence of testing conditions on the performance and durability of polymer stabilisers in thermal oxidation. Polym Degrad Stab. 2003;82(2):145–62. doi:10.1016/S0141-3910(03)00210-6. [Google Scholar] [CrossRef]
26. Schmid M, Ritter A, Affolter S. Determination of oxidation induction time and temperature by DSC: results of round robin tests. J Therm Anal Calorim. 2006;83(2):367–71. doi:10.1007/s10973-005-7142-5. [Google Scholar] [CrossRef]
27. Chen J, Ding NW, Li ZF, Wang W. Organic polymer materials in the space environment. Prog Aeronaut Sci. 2016;83(4):37–56. doi:10.1016/j.paerosci.2016.02.002. [Google Scholar] [CrossRef]
28. Liu X, Li X, Liu J, Wang Z, Kong B, Gong X, et al. Study of high density polyethylene (HDPE) pyrolysis with reactive molecular dynamics. Polym Degrad Stab. 2014;104:62–70. doi:10.1016/j.polymdegradstab.2014.03.022. [Google Scholar] [CrossRef]
29. Ushakova TM, Starchak EE, Gostev SS, Grinev VG, Krasheninnikov VG, Gorenberg AY, et al. All-polyethylene compositions based on ultrahigh molecular weight polyethylene: synthesis and properties. J Appl Polym Sci. 2020;137(38):49121. doi:10.1002/app.49121. [Google Scholar] [CrossRef]
30. Kirschweng B, Tátraaljai D, Földes E, Pukánszky B. Natural antioxidants as stabilizers for polymers. Polym Degrad Stab. 2017;145(3):25–40. doi:10.1016/j.polymdegradstab.2017.07.012. [Google Scholar] [CrossRef]
31. Yang R, Liu Y, Yu J, Wang KH. Thermal oxidation products and kinetics of polyethylene composites. Polym Degrad Stab. 2006;91(8):1651–7. doi:10.1016/j.polymdegradstab.2005.12.013. [Google Scholar] [CrossRef]
32. Kiass N, Khelif R, Boulanouar L, Chaoui K. Experimental approach to mechanical property variability through a high-density polyethylene gas pipe wall. J Appl Polym Sci. 2005;97(1):272–81. doi:10.1002/app.21713. [Google Scholar] [CrossRef]
33. Celina MC. Review of polymer oxidation and its relationship with materials performance and lifetime prediction. Polym Degrad Stab. 2013;98(12):2419–29. doi:10.1016/j.polymdegradstab.2013.06.024. [Google Scholar] [CrossRef]
Cite This Article
 Copyright © 2025 The Author(s). Published by Tech Science Press.
This work is licensed under a Creative Commons Attribution 4.0 International License , which permits unrestricted use, distribution, and reproduction in any medium, provided the original work is properly cited.
 Downloads
 Citation Tools