
 Submit a Paper
 Propose a Special lssue
 Open Access
ARTICLE

Adaptive Optimization of Drainage Processes in High-Water-Cut Tight Gas Reservoirs
1 Oil & Gas Technology Institute, PetroChina Changqing Oil Field Company, Xi’an, China
2 National Engineering Laboratory for Exploration and Development of Low-Permeability Oil & Gas Fields, PetroChina Changqing Oil Field Company, Xi’an, China
* Corresponding Author: Jiaming Cai. Email:
(This article belongs to the Special Issue: Fluid and Thermal Dynamics in the Development of Unconventional Resources IV)
Fluid Dynamics & Materials Processing 2026, 22(3), 8 https://doi.org/10.32604/fdmp.2026.078769
Received 07 January 2026; Accepted 09 March 2026; Issue published 31 March 2026
 View Full Text
 Download PDF
Abstract
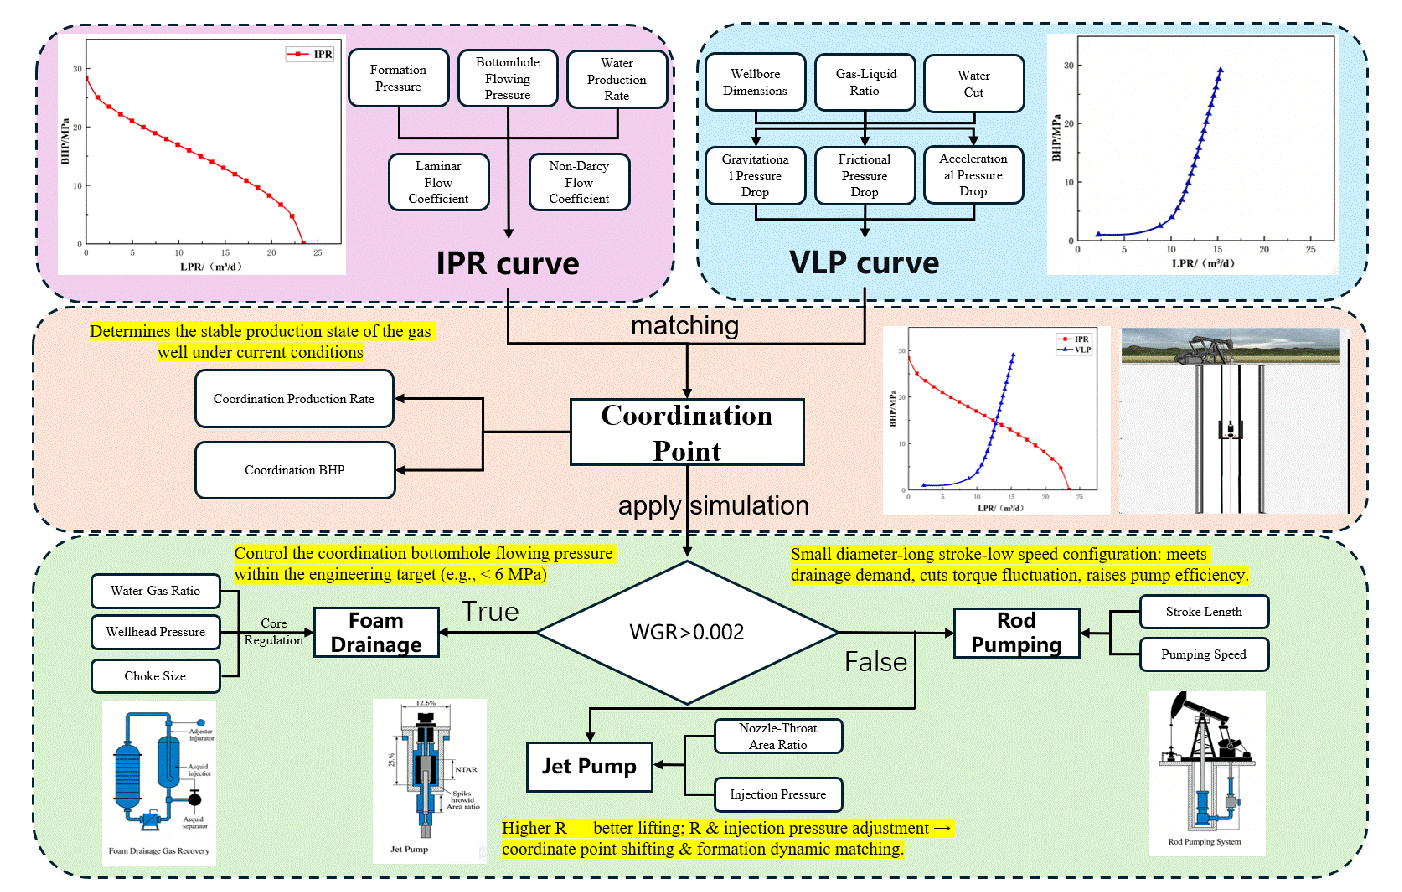
To address the persistent challenge of dynamic mismatch between wellbore lifting capacity and reservoir fluid supply, and to establish a robust optimization framework for drainage operations in high-water-cut tight sandstone gas reservoirs, this study systematically investigates the graded optimization and dynamic adaptation of drainage gas recovery technologies. Production data from a representative tight gas field were first employed to forecast reservoir performance. The predictive reliability was rigorously validated through high-precision history matching, thereby providing a quantitatively consistent foundation for subsequent wellbore optimization. Building on this characterization, a coupled simulation framework was developed that integrates wellbore multiphase flow modeling with nodal analysis based on the Inflow Performance Relationship, IPR, and the Vertical Lift Performance, VLP. This coordinated approach enables comprehensive evaluation of process adaptability and dynamic optimization of foam-assisted drainage, mechanical pumping, and jet pumping systems under evolving water–gas ratio, WGR conditions. The results reveal that a progressively increasing water–gas ratio is the dominant factor driving the transition from chemically assisted drainage methods to mechanically enhanced lifting technologies. A distinct quantitative threshold is identified at WGR ≈ 0.002, beyond which mechanical intervention becomes more effective and economically justified. For mechanical pumping and jet pumping systems, a parameter inversion optimization strategy constrained by the target bottomhole flowing pressure, Pwf, is proposed to ensure stable production while maintaining reservoir drawdown control. In particular, the nozzle-to-throat area ratio of the jet pump is identified as the key governing parameter influencing entrainment capacity and lifting efficiency. Moreover, a configuration characterized by small pump diameter, long stroke length, and low operating speed is demonstrated to satisfy drainage requirements while mitigating torque fluctuations, enhancing volumetric efficiency, and improving pump fillage stability.Graphic Abstract
Keywords
High-water-cut tight sandstone gas reservoirs hold a significant position in unconventional natural gas resources [1]. However, their development has long been plagued by engineering challenges such as low drainage efficiency and difficulty in maintaining stable production [2,3]. These reservoirs are generally characterized by low porosity, low permeability, and high water saturation, leading to complex gas-water two-phase seepage behavior [2,4,5,6]. This complexity often results in a severe mismatch between the wellbore lifting system and the reservoir’s fluid supply dynamics [7,8]. Particularly when gas well production enters the medium-to-high water-cut stage, the continuously rising water-gas ratio (WGR) leads to a significant increase in wellbore flow resistance [4,9,10]. Persisting with a single or fixed drainage process under these conditions can easily result in insufficient liquid unloading capacity, intensified liquid loading in the wellbore, and consequently, production decline or even well shutdown [5,9,11,12].
Currently, extensive research has been conducted on drainage optimization for high-water-cut tight gas reservoirs. Chen et al. systematically introduced traditional technologies, including tubing optimization, foam drainage, gas lift, and mechanical drainage, by analyzing the mechanisms of wellbore fluid accumulation and corresponding diagnostic methods [13]. Bai et al. investigated the liquid-carrying performance and field application effects of new foam agents under complex conditions through dynamic foam testing and the development of specialized surfactants resistant to high salinity, oil, and methanol [14]. Al-Mudhafar and Wood evaluated the enhanced oil recovery (EOR) effects, water control advantages, and the feasibility of carbon sequestration via CO2 injection for the GDWS-AGD process in strong water-drive reservoirs through reservoir simulation and multi-scheme comparative analysis [11]. Furthermore, Hosseini-Nasab et al. explored foam generation mechanisms, structural characteristics, and the decay process centered on “plateau border drainage”, verifying the rationality of the foam drainage equation through combined laboratory experiments and theoretical analysis [15].
However, these studies primarily focus on the mechanistic analysis of single lifting processes or selection based on static parameters, lacking a systematic quantitative evaluation and collaborative optimization method for multiple processes—such as foam drainage, mechanical pumping, and jet pumps—under dynamic Water-Gas Ratio (WGR) conditions throughout the entire production lifecycle.
In related developments, Yang et al. researched quantitative optimization methods for shale gas well deliquification by refining the Gray model and W.Z.B. empirical model, establishing optimization charts based on technical limit analysis to effectively guide production and improve gas field recovery [3]. Surendra et al. developed automated diagnosis and optimization methods for gas lift systems by constructing a workflow that integrates data-driven and engineering models, applying it to gas lift well groups in offshore oil fields [16]. Hashmi et al. studied optimized design methods for plunger lift in high-water-cut gas wells by establishing a new model that incorporates wellbore flow physics [17]. Mazzanti and Dixon demonstrated the effectiveness of a novel artificial lift method for deviated wells by placing the pump above the inclined section and utilizing a packer-type separator system combined with a velocity string [18]. Additionally, Parshall analyzed the limitations of existing lift methods in unconventional horizontal wells by evaluating the current global status of artificial lift technology and the challenges of liquid management in horizontal wellbores [19].
Despite these advancements, existing methods often rely on empirical knowledge or localized simulations and fail to establish a closed-loop analytical workflow that integrates reservoir fluid delivery with wellbore lifting dynamics. This results in an insufficient basis for process optimization and leads to parameter adjustments that lag behind dynamic production changes, ultimately hindering sustained and efficient gas well production [20].
In recent years, the integration of transient multiphase flow modeling with machine learning has emerged as a significant trend for achieving real-time optimization of deliquification processes. For instance, relevant studies have demonstrated the use of machine learning to identify wellbore flow regimes based on high-resolution monitoring data [21], or the application of reinforcement learning to optimize plunger lift systems within coupled simulation environments [22]. While these intelligent methods offer distinct advantages in predictive accuracy and automated decision-making, many pure data-driven or hybrid models still face challenges regarding physical interpretability and rely heavily on high-quality, complete datasets that are often difficult to obtain in the development of complex tight gas fields [23].
Therefore, while acknowledging these emerging intelligent trends, this study aims to overcome the limitations of current dynamic optimization methods and the insufficient integration of reservoir inflow performance. By focusing on a representative high-water-cut tight sandstone gas field, this research specifically addresses the challenges of dynamic adaptation within the wellbore lifting system. The research aims to establish a drainage process optimization methodology centered on IPR/VLP nodal analysis [24]. Leveraging reliable numerical reservoir simulation results established in prior research as input, the study systematically evaluates the adaptability of various drainage processes under variable operating conditions and conducts parameter sensitivity analysis by constructing a wellbore multiphase flow model. Consequently, this work formulates a strategy for the dynamic selection of appropriate processes and the adjustment of key parameters across different production stages [22]. The proposed methodology not only provides a practical framework for the intelligent drainage of high-water-cut tight gas wells but also offers theoretical insights for development adjustments and process optimization in analogous gas reservoirs [25].
2 Wellbore Drainage Optimization via IPR/VLP Analysis
To achieve efficient lifting and stable production in high-water-cut tight sandstone gas reservoirs, this chapter systematically elaborates on the research framework and technical methodology centered on dynamic wellbore optimization. Leveraging high-precision production performance data derived from reservoir numerical simulation, this chapter focuses on the simulation and construction of the wellbore lifting system. Following the logical sequence of “data input—data calibration—model construction—nodal analysis”, it aims to establish a multi-stage drainage optimization strategy based on variable operating condition simulations.
2.1 Development of the Inflow Performance Relationship (IPR) Model
This study utilizes a black oil model framework to conduct reservoir simulations of gas-water two-phase flow. An Embedded Discrete Fracture Model (EDFM) is employed to characterize the fracture network, enabling accurate capture of fluid exchange between fractures and the matrix. Key simulation outputs, such as reservoir pressure and flow rates, are subsequently transferred to the wellbore module to serve as foundational inputs for the analysis of wellbore flow dynamics and production characteristics.
The Inflow Performance Relationship (IPR) model serves as a critical link between the reservoir and the wellbore, characterizing the actual fluid deliverability of tight gas reservoirs under conditions of formation pressure depletion and gas-water two-phase flow. To accurately construct IPR curves for the gas wells in the study area, this research adopts a two-step methodology: “preliminary estimation using empirical models, followed by refinement through numerical simulation.” Initially, based on fundamental gas well properties, completion data, and the current gas-water ratio, the Fetkovich empirical model is employed for preliminary IPR curve prediction [26]. This model provides a rapid estimation of theoretical gas production rate through a simplified binomial deliverability equation and is a widely applied empirical model in gas well productivity analysis. Its core expression is given by:
It should be noted that while the Fetkovich model provides a computationally efficient foundation for preliminary IPR estimation, its simplified binomial form has inherent limitations in fully capturing the dynamic stress sensitivity and threshold pressure gradients (TPG) typically observed in tight gas reservoirs. In such complex systems, gas-water two-phase flow and non-linear seepage effects can significantly alter the inflow relationship. Therefore, this study treats the Fetkovich-based results as an initial basis, which is subsequently calibrated through high-precision reservoir numerical simulation. By integrating the Embedded Discrete Fracture Model (EDFM) and history matching, the impact of fracture networks and complex reservoir physics is explicitly accounted for, ensuring that the refined IPR curves are reliable for subsequent nodal analysis.
To address the limitations of empirical models in accurately representing gas-water two-phase flow, non-Darcy effects, and fracture influences in tight reservoirs, the refined numerical simulation model established earlier is employed to calibrate the IPR curves, as illustrated in Fig. 1. This model can meticulously capture fluid flow dynamics within both the reservoir matrix and fractures, generating matched data pairs of bottomhole flowing pressure (Pwf) and gas production rate. The simulation results are then imported into wellbore simulation software, where the Multirate Fetkovich fitting function is utilized to correct the initial IPR curve. This process involves the inversion and optimization of the laminar flow coefficient and the non-Darcy flow coefficient in the Fetkovich equation based on the numerical simulation results, thereby yielding an IPR curve that accurately reflects the formation deliverability of the gas wells in the study area. This calibrated curve will serve as the inflow boundary condition for subsequent simulations, supporting nodal analysis and variable-condition optimization for different drainage gas recovery processes.
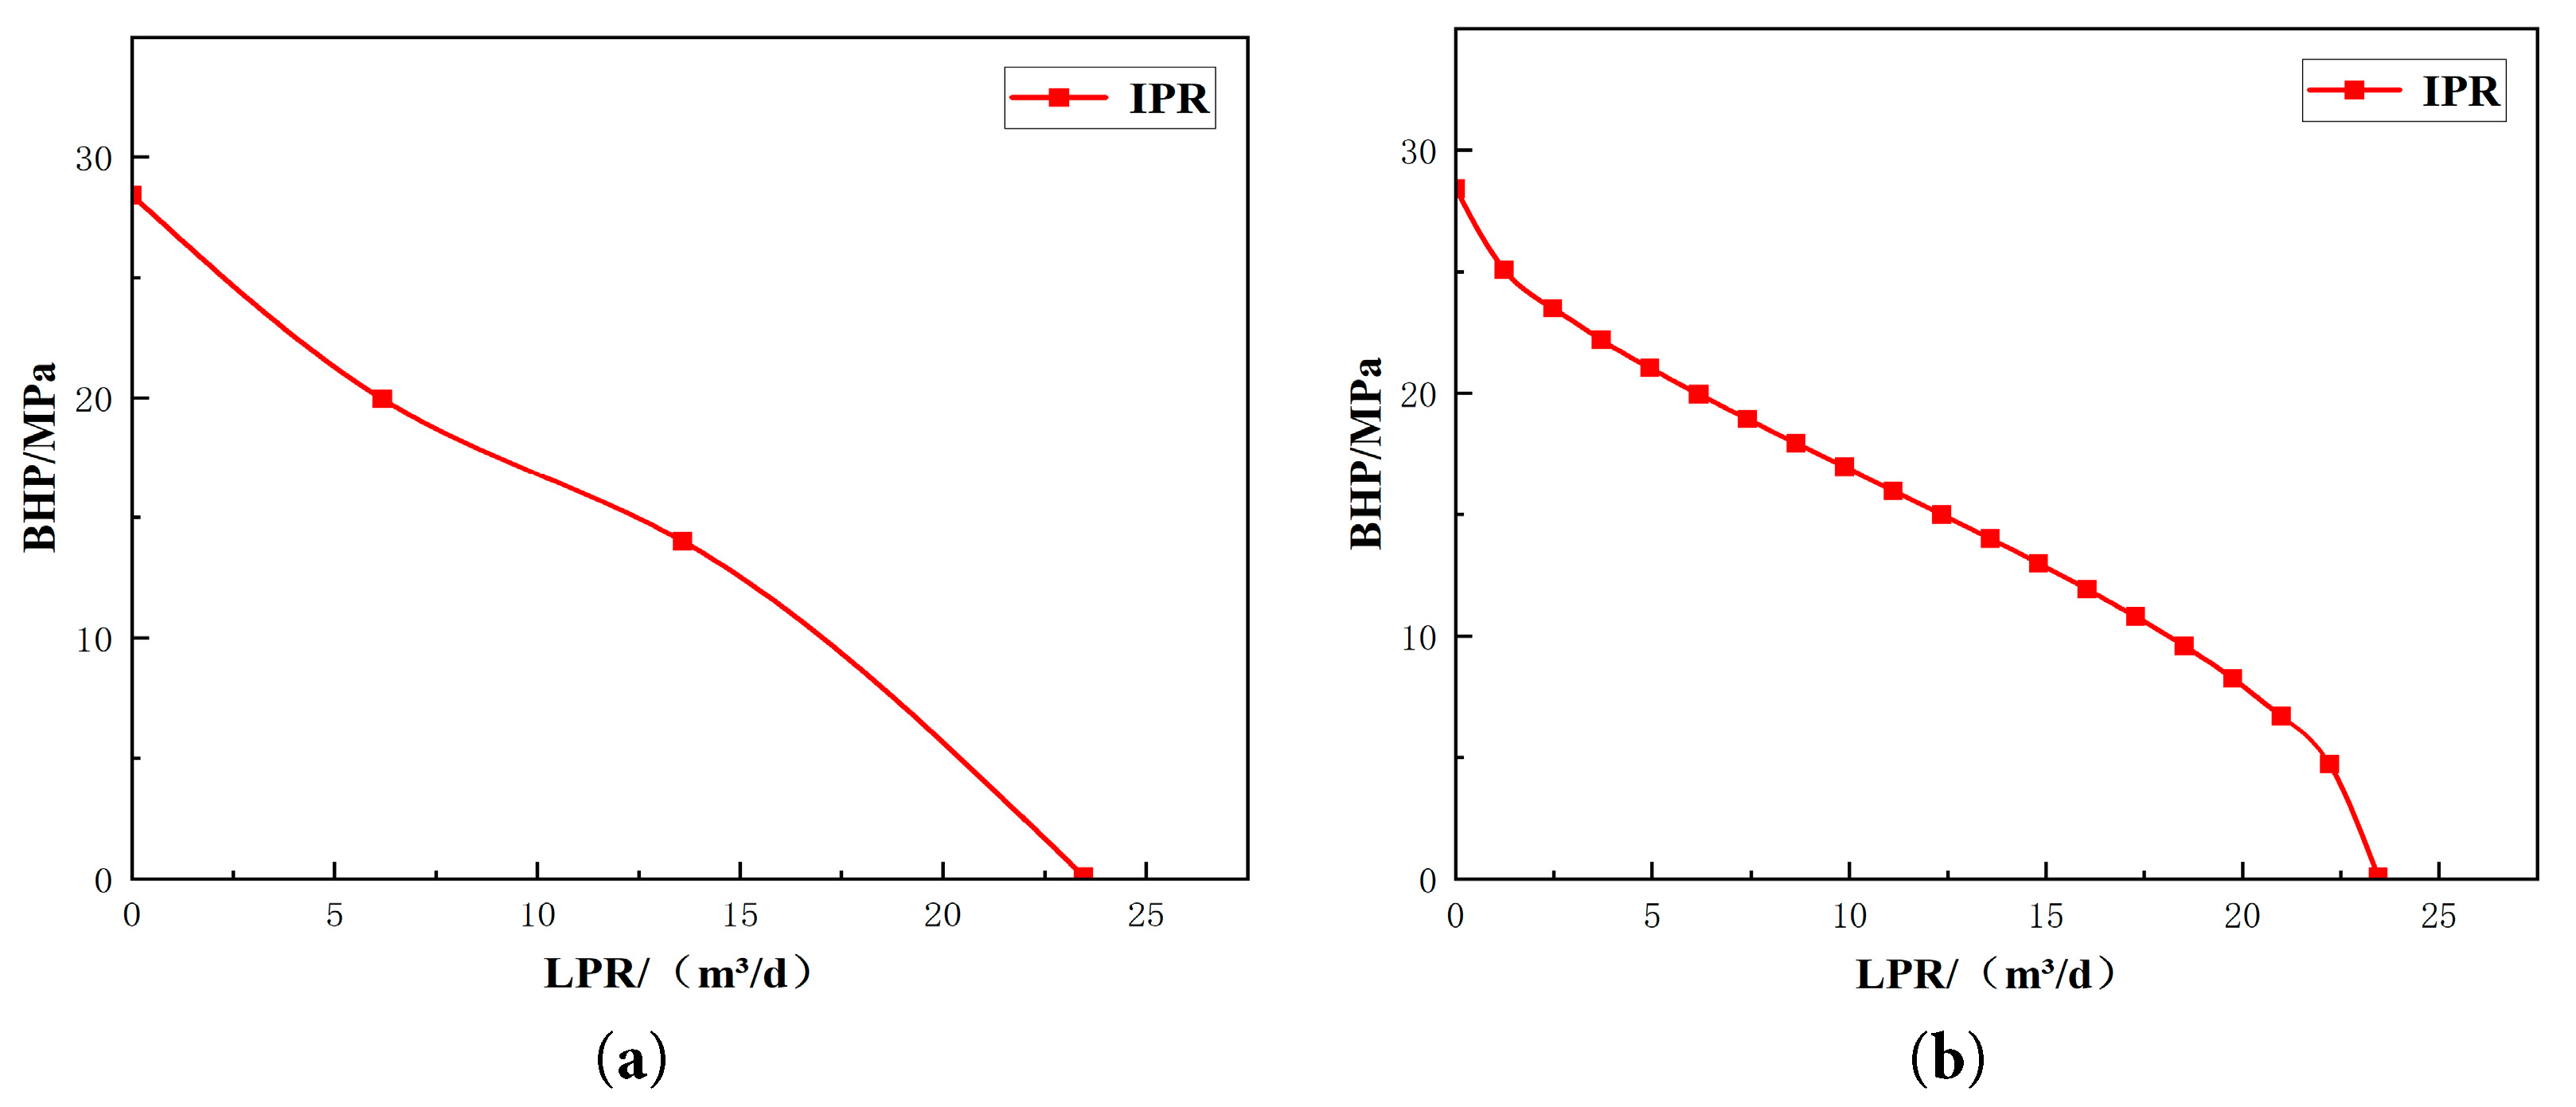
Figure 1: Calibrated IPR curve. (a): Pre-calibration IPR curve; (b): Post-calibration IPR curve.
2.2 Development of the Vertical Lift Performance (VLP) Model
The Outflow Performance Relationship (VLP) model serves as the outflow boundary condition in reservoir simulation, specifically designed to accurately characterize the total pressure drop of gas-liquid two-phase flow within the wellbore from the bottomhole flowing pressure (Pwf) to the wellhead pressure. It is a core basis for evaluating wellbore lifting capacity and optimizing drainage and production processes. Given the production characteristics of high-water-cut tight gas wells in this study area—such as high gas-liquid ratio and complex flow patterns—the Hagedorn-Brown empirical correlation, extensively validated in field applications, is selected as the fundamental theoretical framework for VLP modeling [27]. To ensure its applicability to the specific annular flow regimes and low liquid loading characteristics of the target field, the correlation was verified against measured pressure data from 3–5 representative wells, yielding an average error of less than 5%. This model mechanistically calculates the total pressure drop by decomposing it into three components: gravitational, frictional, and accelerational pressure losses, thereby effectively simulating the impact of variations in pipe diameter, production rate, gas-liquid ratio (GLR), and water cut on wellbore pressure distribution [26].
The derivation of the model is based on the momentum conservation equation for gas-liquid two-phase flow in the wellbore. Considering a differential pipe segment with an inclination angle of
Dividing both sides of the above equation by A*dh and rearranging terms yields the expression for the total pressure gradient:
Let
This term represents the pressure drop required to overcome the gravitational force of the fluid. The calculation of the mixture density
In the frictional pressure drop term, the wall shear stress
The accelerational pressure drop term arises from changes in fluid kinetic energy, primarily caused by the increase in flow velocity due to gas expansion along the upward trajectory of the wellbore:
In numerical computations, this term is often handled through iterative solution methods or by incorporating a kinetic energy correction factor Ek.
Integrating the above three components yields the classical Hagedorn-Brown vertical flow pressure drop calculation model:
By performing numerical integration of this differential equation along the wellbore from the bottomhole to the wellhead, a complete bottomhole flowing pressure (Pwf)-production rate relationship curve, i.e., the VLP curve, can be obtained.
This model serves as the underlying computational framework, supporting the simulation of various drainage and production processes, including mechanical pumping, jet pumping, and foam drainage. By inputting relevant process parameters into wellbore simulation software, customized modeling of wellbore lifting performance can be achieved. Ultimately, through adjusting operational parameters and process conditions, the research system generates VLP curves representing different lifting efficiencies and conducts nodal analysis in coordination with the calibrated IPR curves. This determines the optimal operating point under varying dynamic conditions, providing a basis for the selection of drainage and production strategies.
2.3 Process Adaptability Evaluation Based on VLP/IPR Nodal Analysis
The Inflow Performance Relationship (IPR) model and the Outflow Performance Relationship (VLP) model respectively represent the supply capacity and lifting capacity of a gas well production system. IPR/VLP Nodal Analysis serves as the core step in achieving dynamic adaptation and collaborative optimization for gas reservoir drainage and production processes [25]. Its purpose is to identify a stable operating point—specifically, the coordination point, as illustrated in Fig. 2—where the flow rate from the reservoir inflow equals the flow rate from the wellbore outflow at a specific production node (the bottomhole).
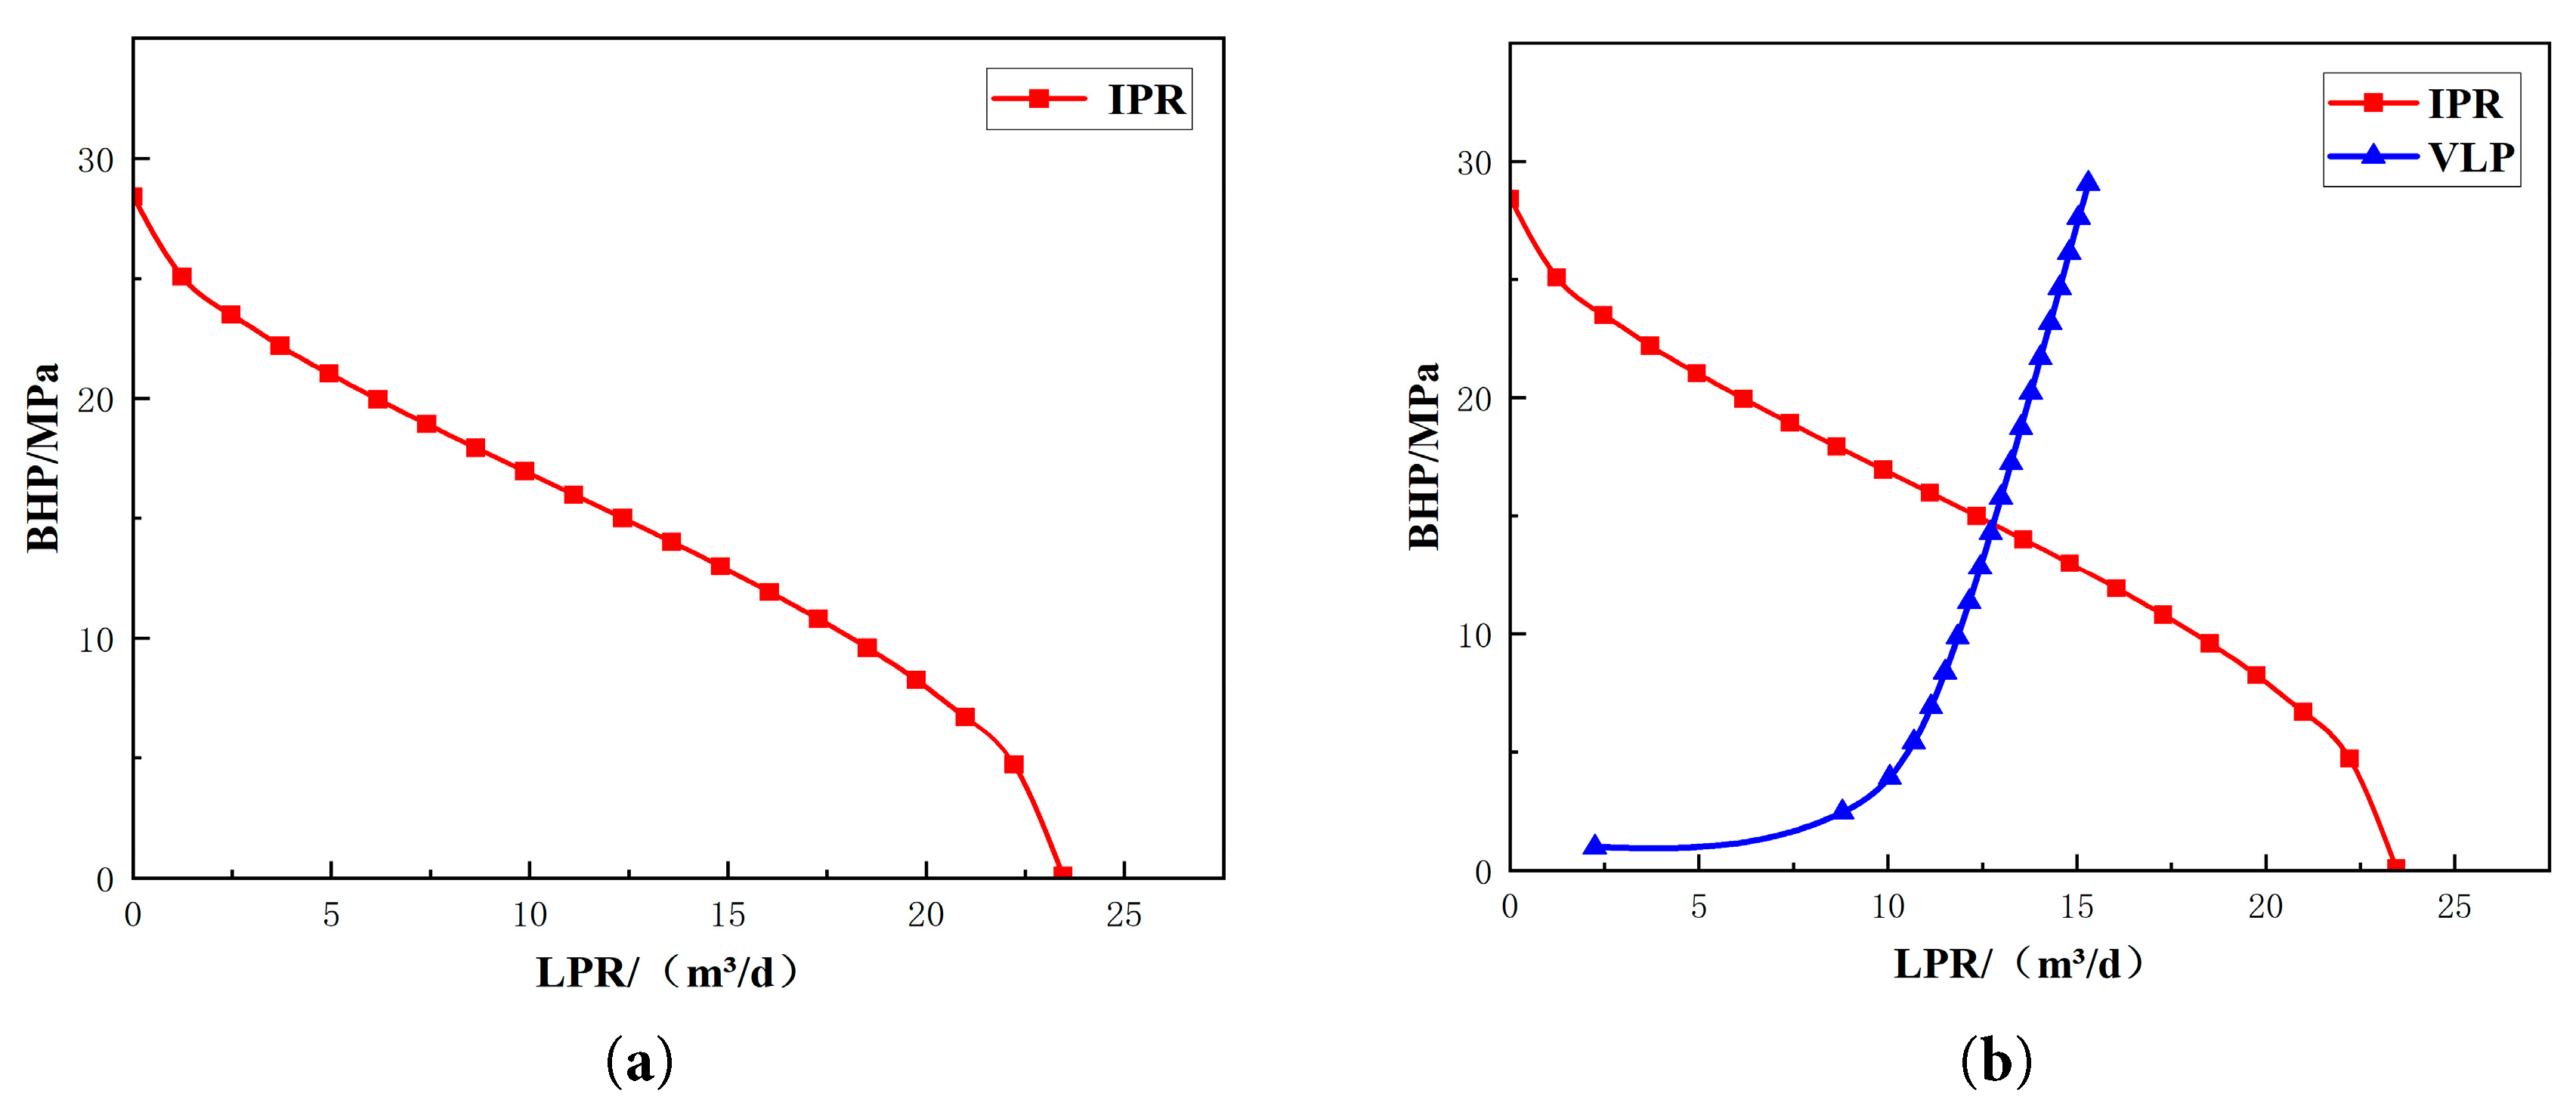
Figure 2: Schematic diagram of the coordination point. (a): IPR curve; (b): VLP/IPR curve.
In this study, using wellbore simulation software and taking the bottomhole as the analysis node, the highly accurate calibrated IPR curve (representing reservoir supply) from Section 2.1 is solved simultaneously with the VLP curve (representing wellbore demand) established in Section 2.2 based on the Hagedorn-Brown model and integrated with specific drainage and production process parameters. The intersection point of these two curves represents the stable production point of the gas well under the given operating conditions. The bottomhole flowing pressure (Pwf) at this intersection is defined as the coordination bottomhole flowing pressure, and the corresponding gas production rate is the coordination production rate [30].
To provide a clear visualization of the integrated research methodology, a comprehensive mind map is presented in Fig. 3. This flowchart systematically delineates the entire technical workflow, spanning from foundational data calibration and model construction to dynamic nodal coordination analysis and the final graded selection of drainage processes under varying operating conditions.
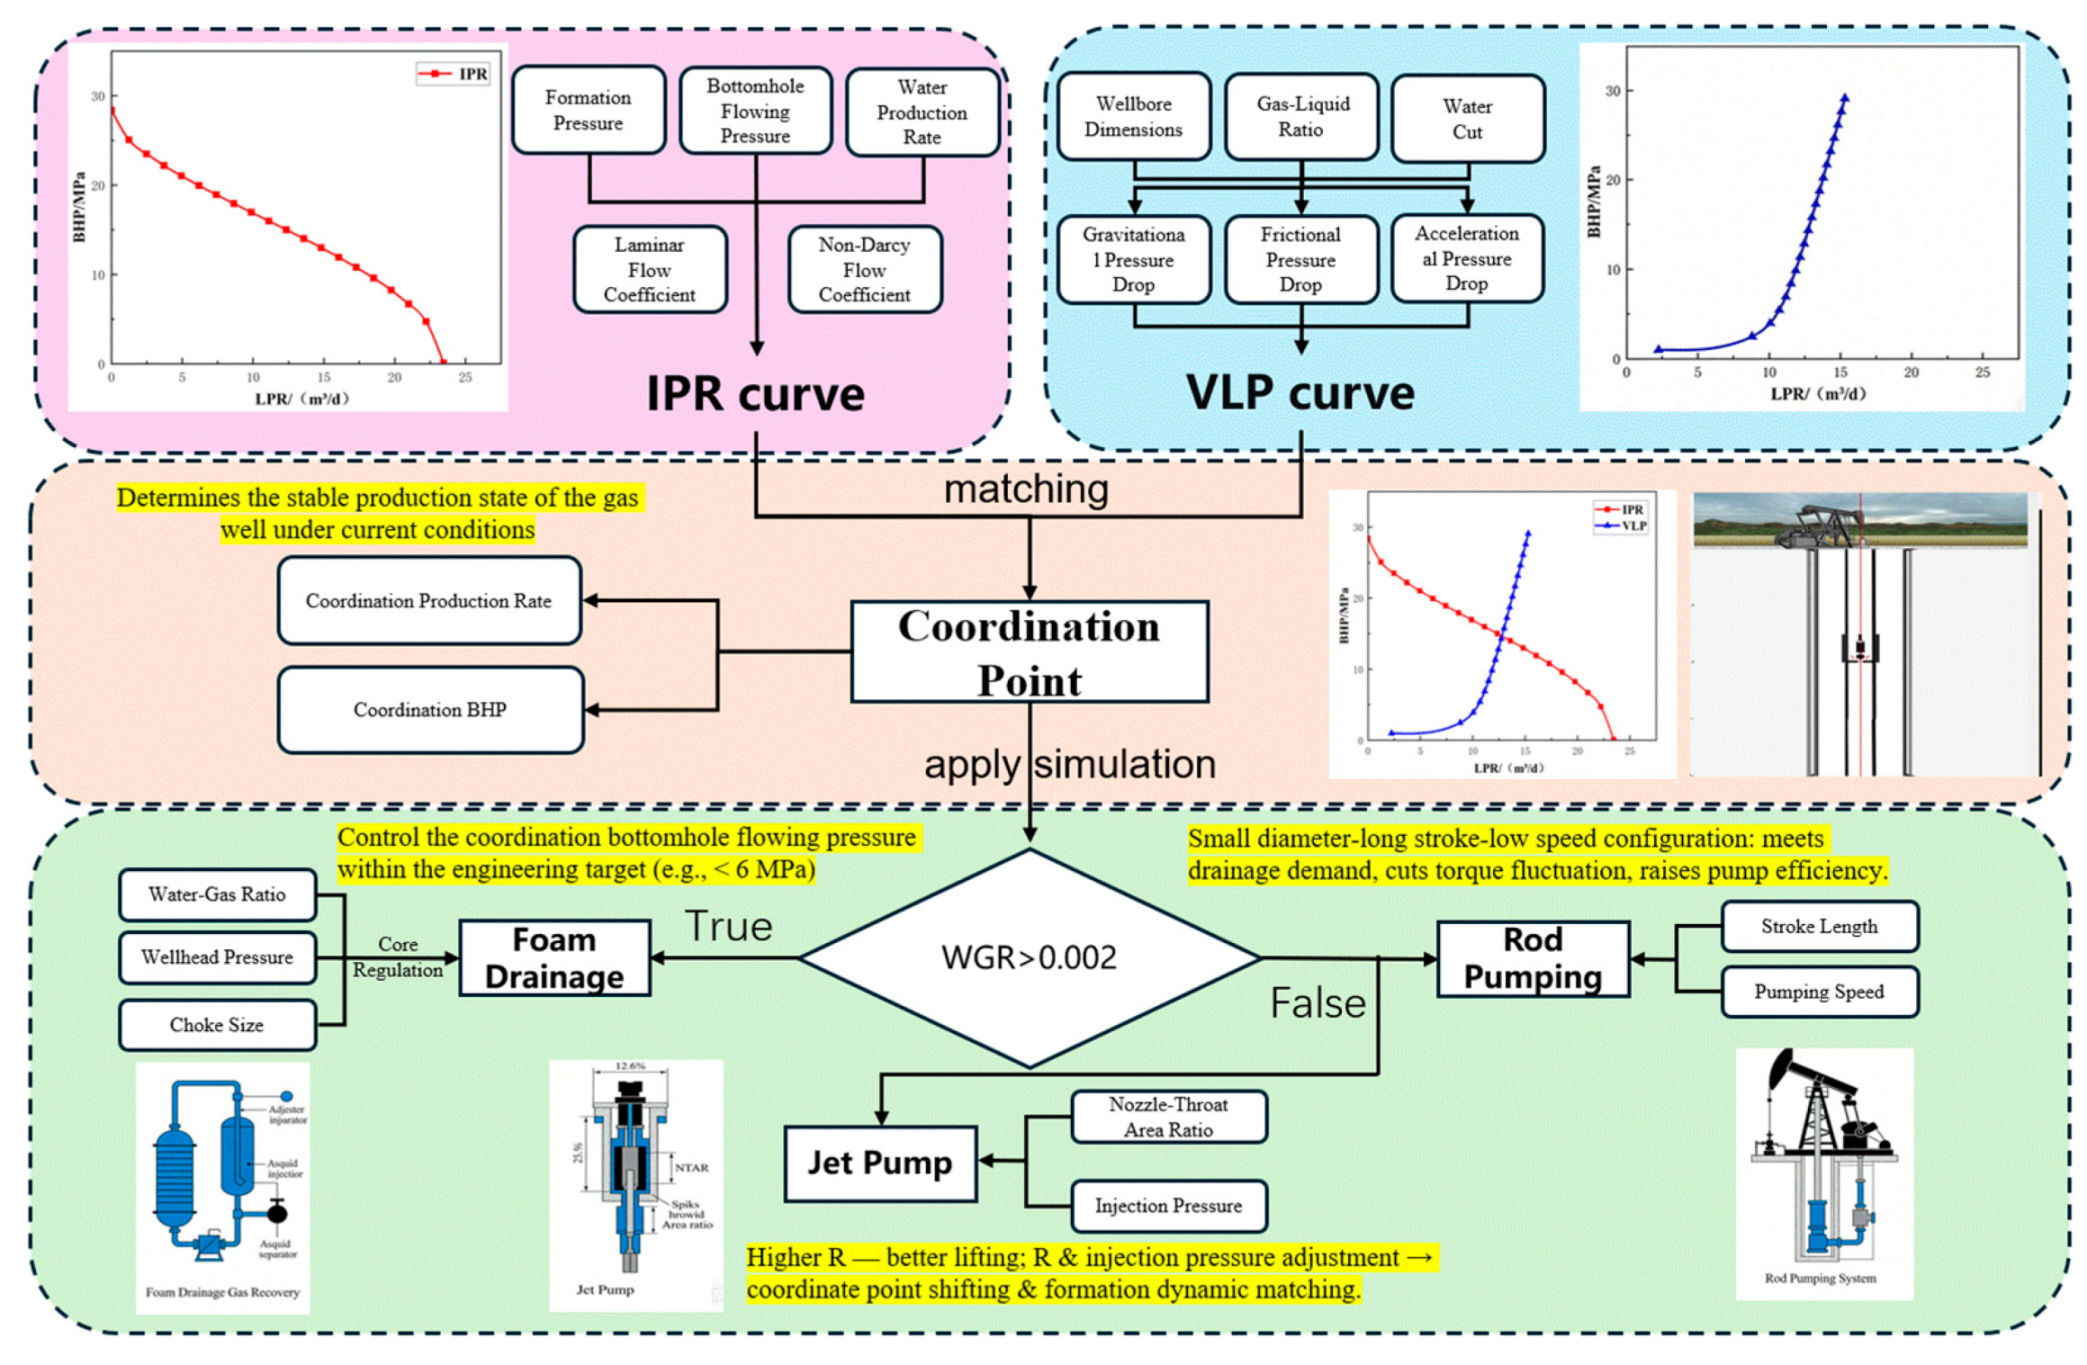
Figure 3: The mind map.
3 Optimization under Dynamic Conditions: A Case Study
Building upon the theoretical framework and methodology established in Section 2, this chapter presents a comprehensive case study of a representative high-water-cut tight gas well to demonstrate the application of the IPR/VLP nodal analysis in process optimization. The analysis begins with high-precision history matching and production capacity prediction to ensure the reliability of the data foundation. Subsequently, the study systematically evaluates the dynamic adaptation of various drainage gas recovery (DGR) processes—including foam drainage, rod pumping, and jet pumping—under fluctuating water-gas ratio (WGR) conditions. By integrating reservoir deliverability with wellbore lifting dynamics, this chapter establishes a quantitative basis for the graded optimization of drainage strategies and precise parameter adjustments throughout the gas well’s production lifecycle.
3.1 History Matching and Production Capacity Prediction
To evaluate the drainage optimization strategy, a representative high-water-cut tight gas well was selected based on actual geological and production data. This well is situated in a tight sandstone reservoir characterized by a continental braided river delta depositional environment. The reservoir architecture exhibits strong heterogeneity, which complicates gas-water two-phase seepage behavior and fluid delivery from the matrix to the wellbore. As summarized in Table 1, the formation is located at a mid-depth of 3563.9 m, with the primary gas-bearing interval featuring porosities of 5.1%–12.7% and a matrix permeability of 0.11–0.41 mD. Notably, the low gas saturation (minimum 17.6%) indicates high initial water saturation, leading to severe gas-water two-phase flow interference. The horizontal section of the well spans 1185 m and is completed with 10 fracture stages at a 60 m spacing, creating a complex fracture-matrix exchange network.
The evolution of the water-gas ratio (WGR) in this study is fundamentally governed by this complex geological architecture. Reservoir heterogeneity and the development of micro-fractures create preferential flow paths for formation water, potentially leading to early water breakthrough and a rapid rise in WGR [31]. Furthermore, the complexity of water distribution and potential aquifer connectivity within the braided river delta facies intensifies the gas-water two-phase interference, which is the primary driver for the wellbore liquid loading challenges discussed in subsequent sections [32].
Utilizing these detailed geological parameters and core analysis results, a high-precision history match of the single-well production performance was conducted. This process ensures a reliable data foundation for the subsequent wellbore multiphase flow simulation and nodal coordination analysis.
Table 1: Table of Parameters for the Single-Well History Matching Model.
| Numerical Simulation Parameter | Value | Numerical Simulation Parameter | Value |
|---|---|---|---|
| Model dimensions (m) | 1700 × 800 × 63.5 | Number of grids | 100 × 50 × 15 |
| Permeability (mD) | 0.11–0.41 | Number of fracture stages | 10 |
| Porosity (%) | 5.1–12.7 | Stage spacing (m) | 60 |
| Mid-depth of reservoir (m) | 3563.9 | Fracture half-length (m) | 120 |
| Gas saturation (%) | 17.6–52.8 | Fracture width (m) | 0.02 |
| Horizontal section length (m) | 1185 |
Using the established detailed numerical simulation model, a high-precision history match was conducted for this representative gas well. As shown in Fig. 4, the simulation results demonstrate excellent fitting accuracy, with the simulated daily gas production curve closely matching the actual production data. It should be noted that while surface water production data is missing for the first four years (0–1500 days), the model’s reliability during this period was ensured through two primary constraints: first, the initial fluid distribution and water phase mobility were strictly initialized based on core analysis and regional water-saturation logging data; second, the high-precision alignment achieved with the subsequent water breakthrough and rising water-gas ratio (WGR) trends (1500–3600 days) provides a robust “backward constraint” for the early-stage parameters. In multiphase flow simulation, accurately capturing the timing and slope of later-stage water production necessitates a realistic representation of the preceding gas-water seepage dynamics. Consequently, this outcome effectively verifies the accuracy and reliability of the model in characterizing the production performance throughout the well’s entire lifecycle.
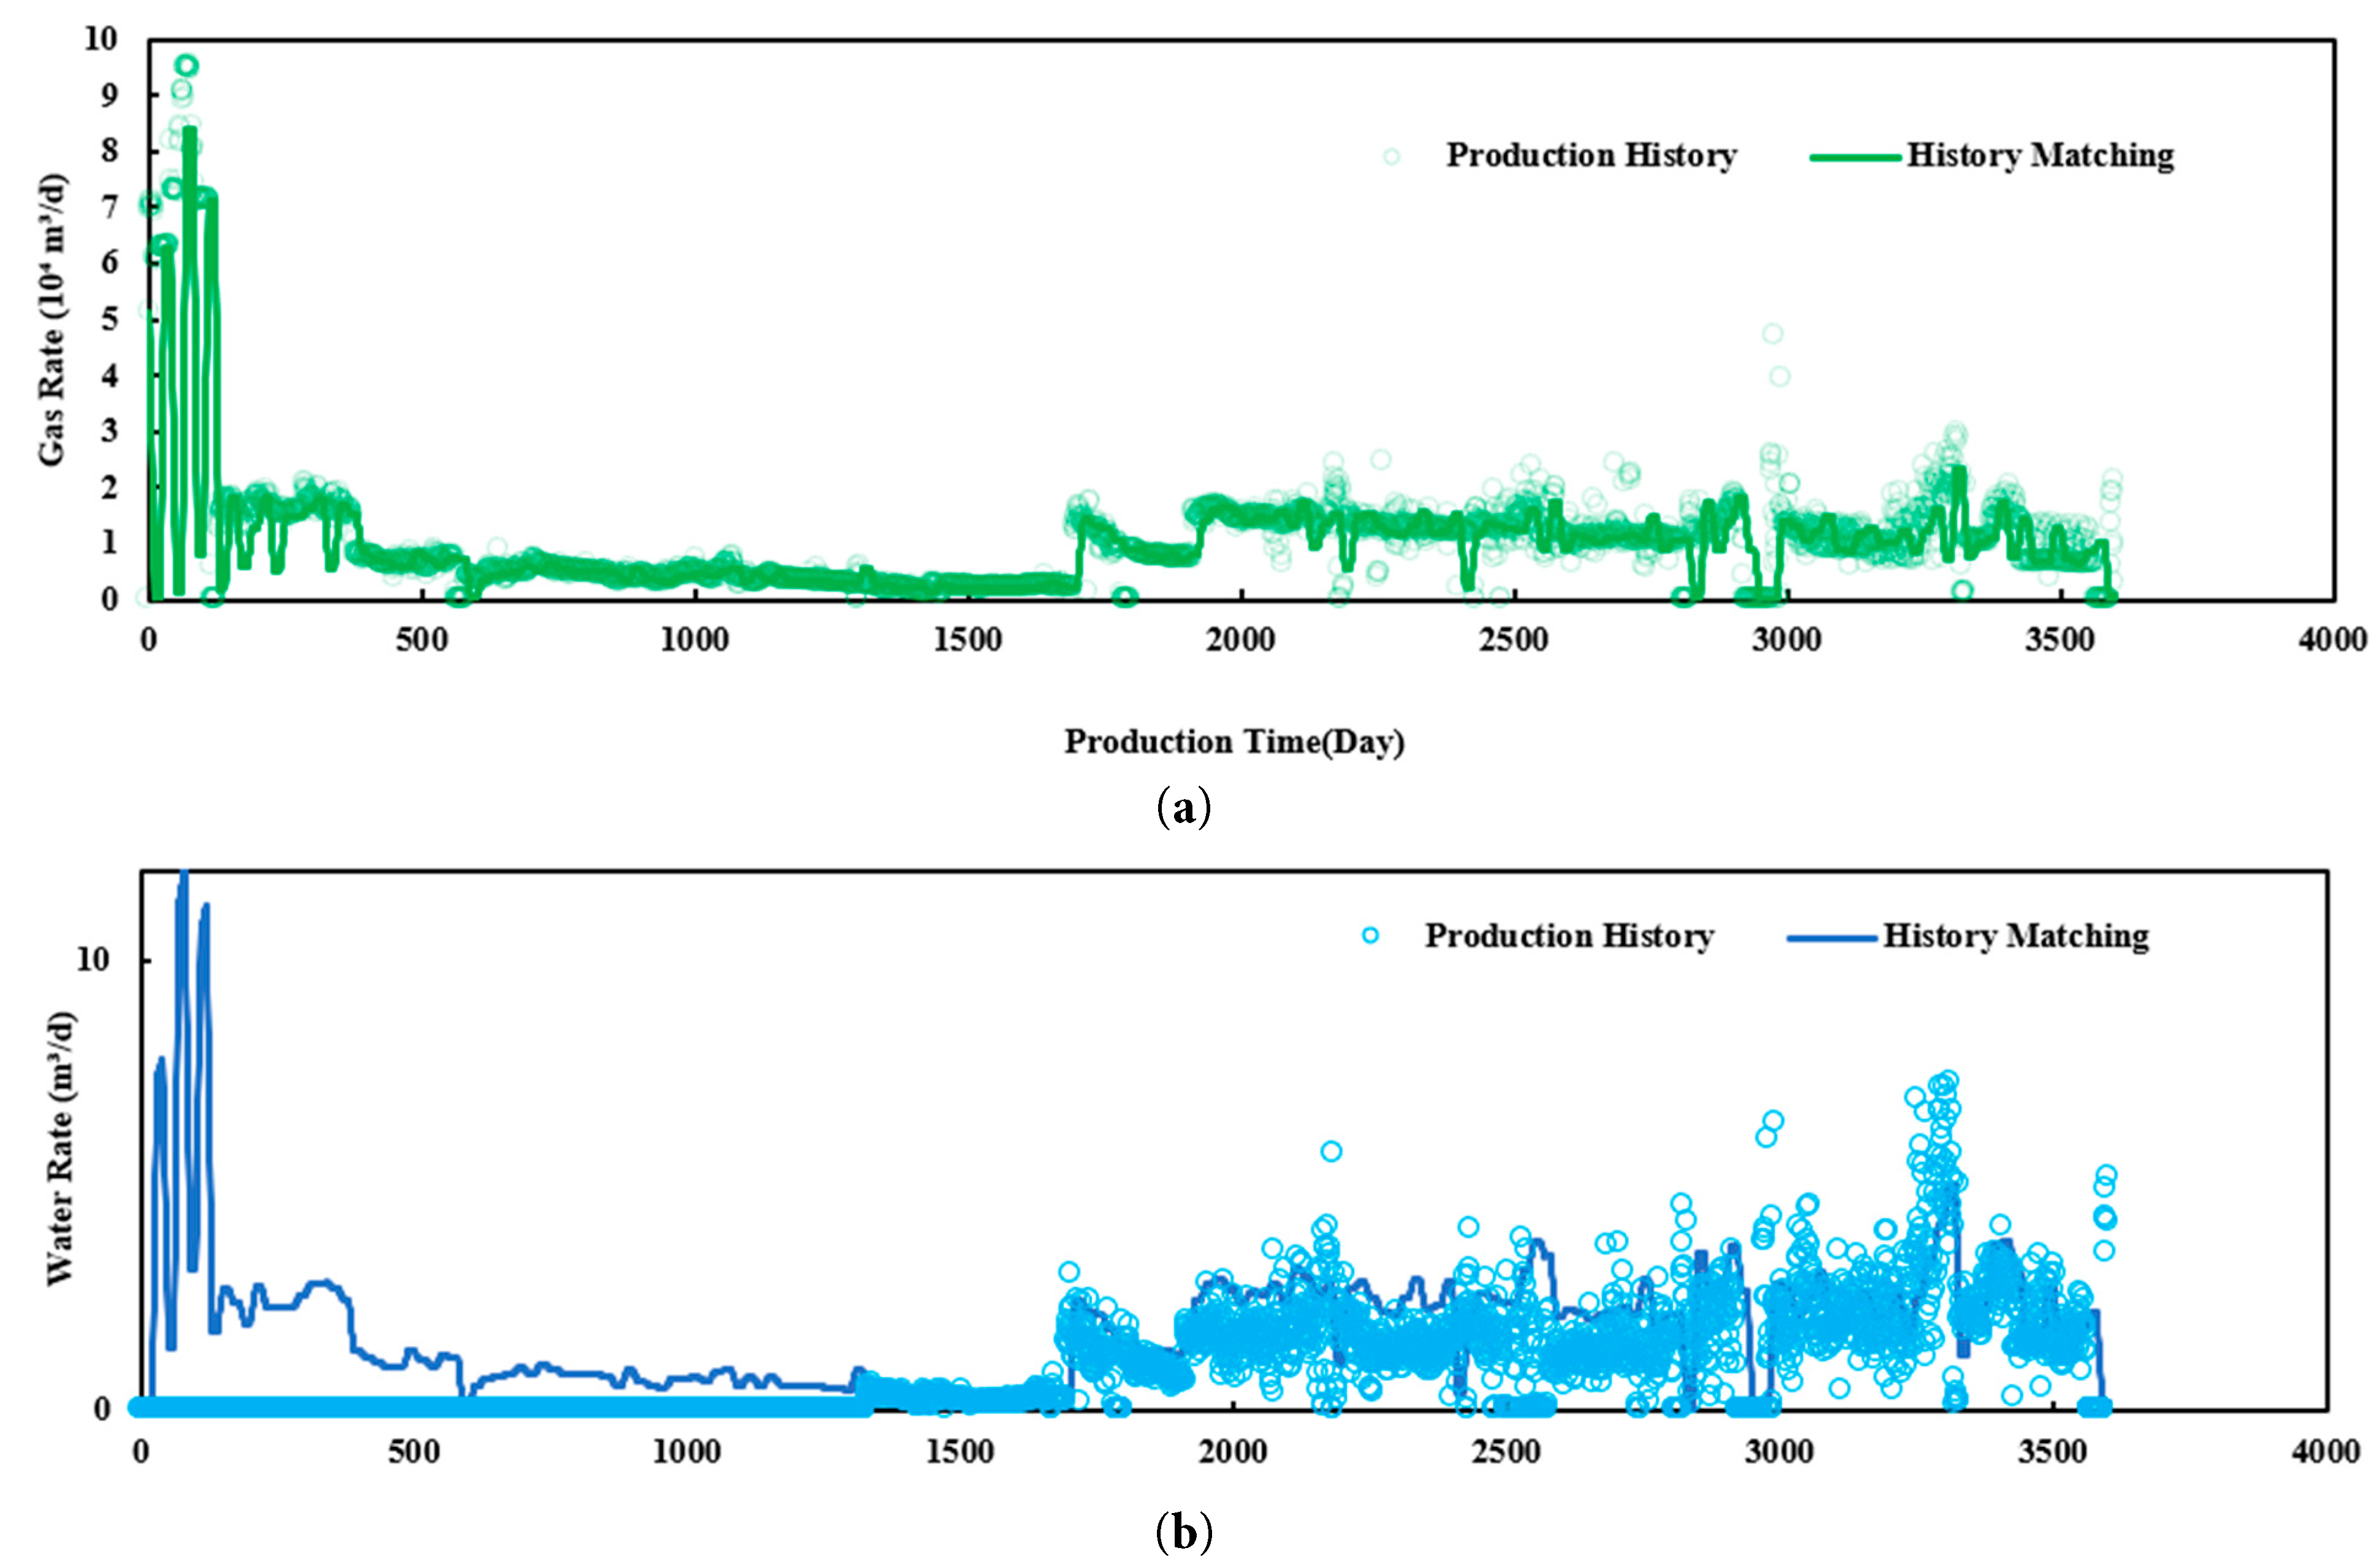
Figure 4: High-precision history matching: (a) Comparison of actual and simulated daily gas production rates; (b) Comparison of actual and simulated daily water production rates.
Utilizing a customized MATLAB-based simulation model, the variations in gas and water production over a five-year cycle were evaluated under varying bottomhole flowing pressures, as illustrated in Fig. 5. The results demonstrate that as the bottomhole flowing pressure (Pwf) decreases, both the gas production rate and the water production rate rise accordingly. This phenomenon underscores the significant sensitivity of gas-water two-phase production dynamics to bottomhole flowing pressure (Pwf) variations, necessitating a balanced approach to pressure management.
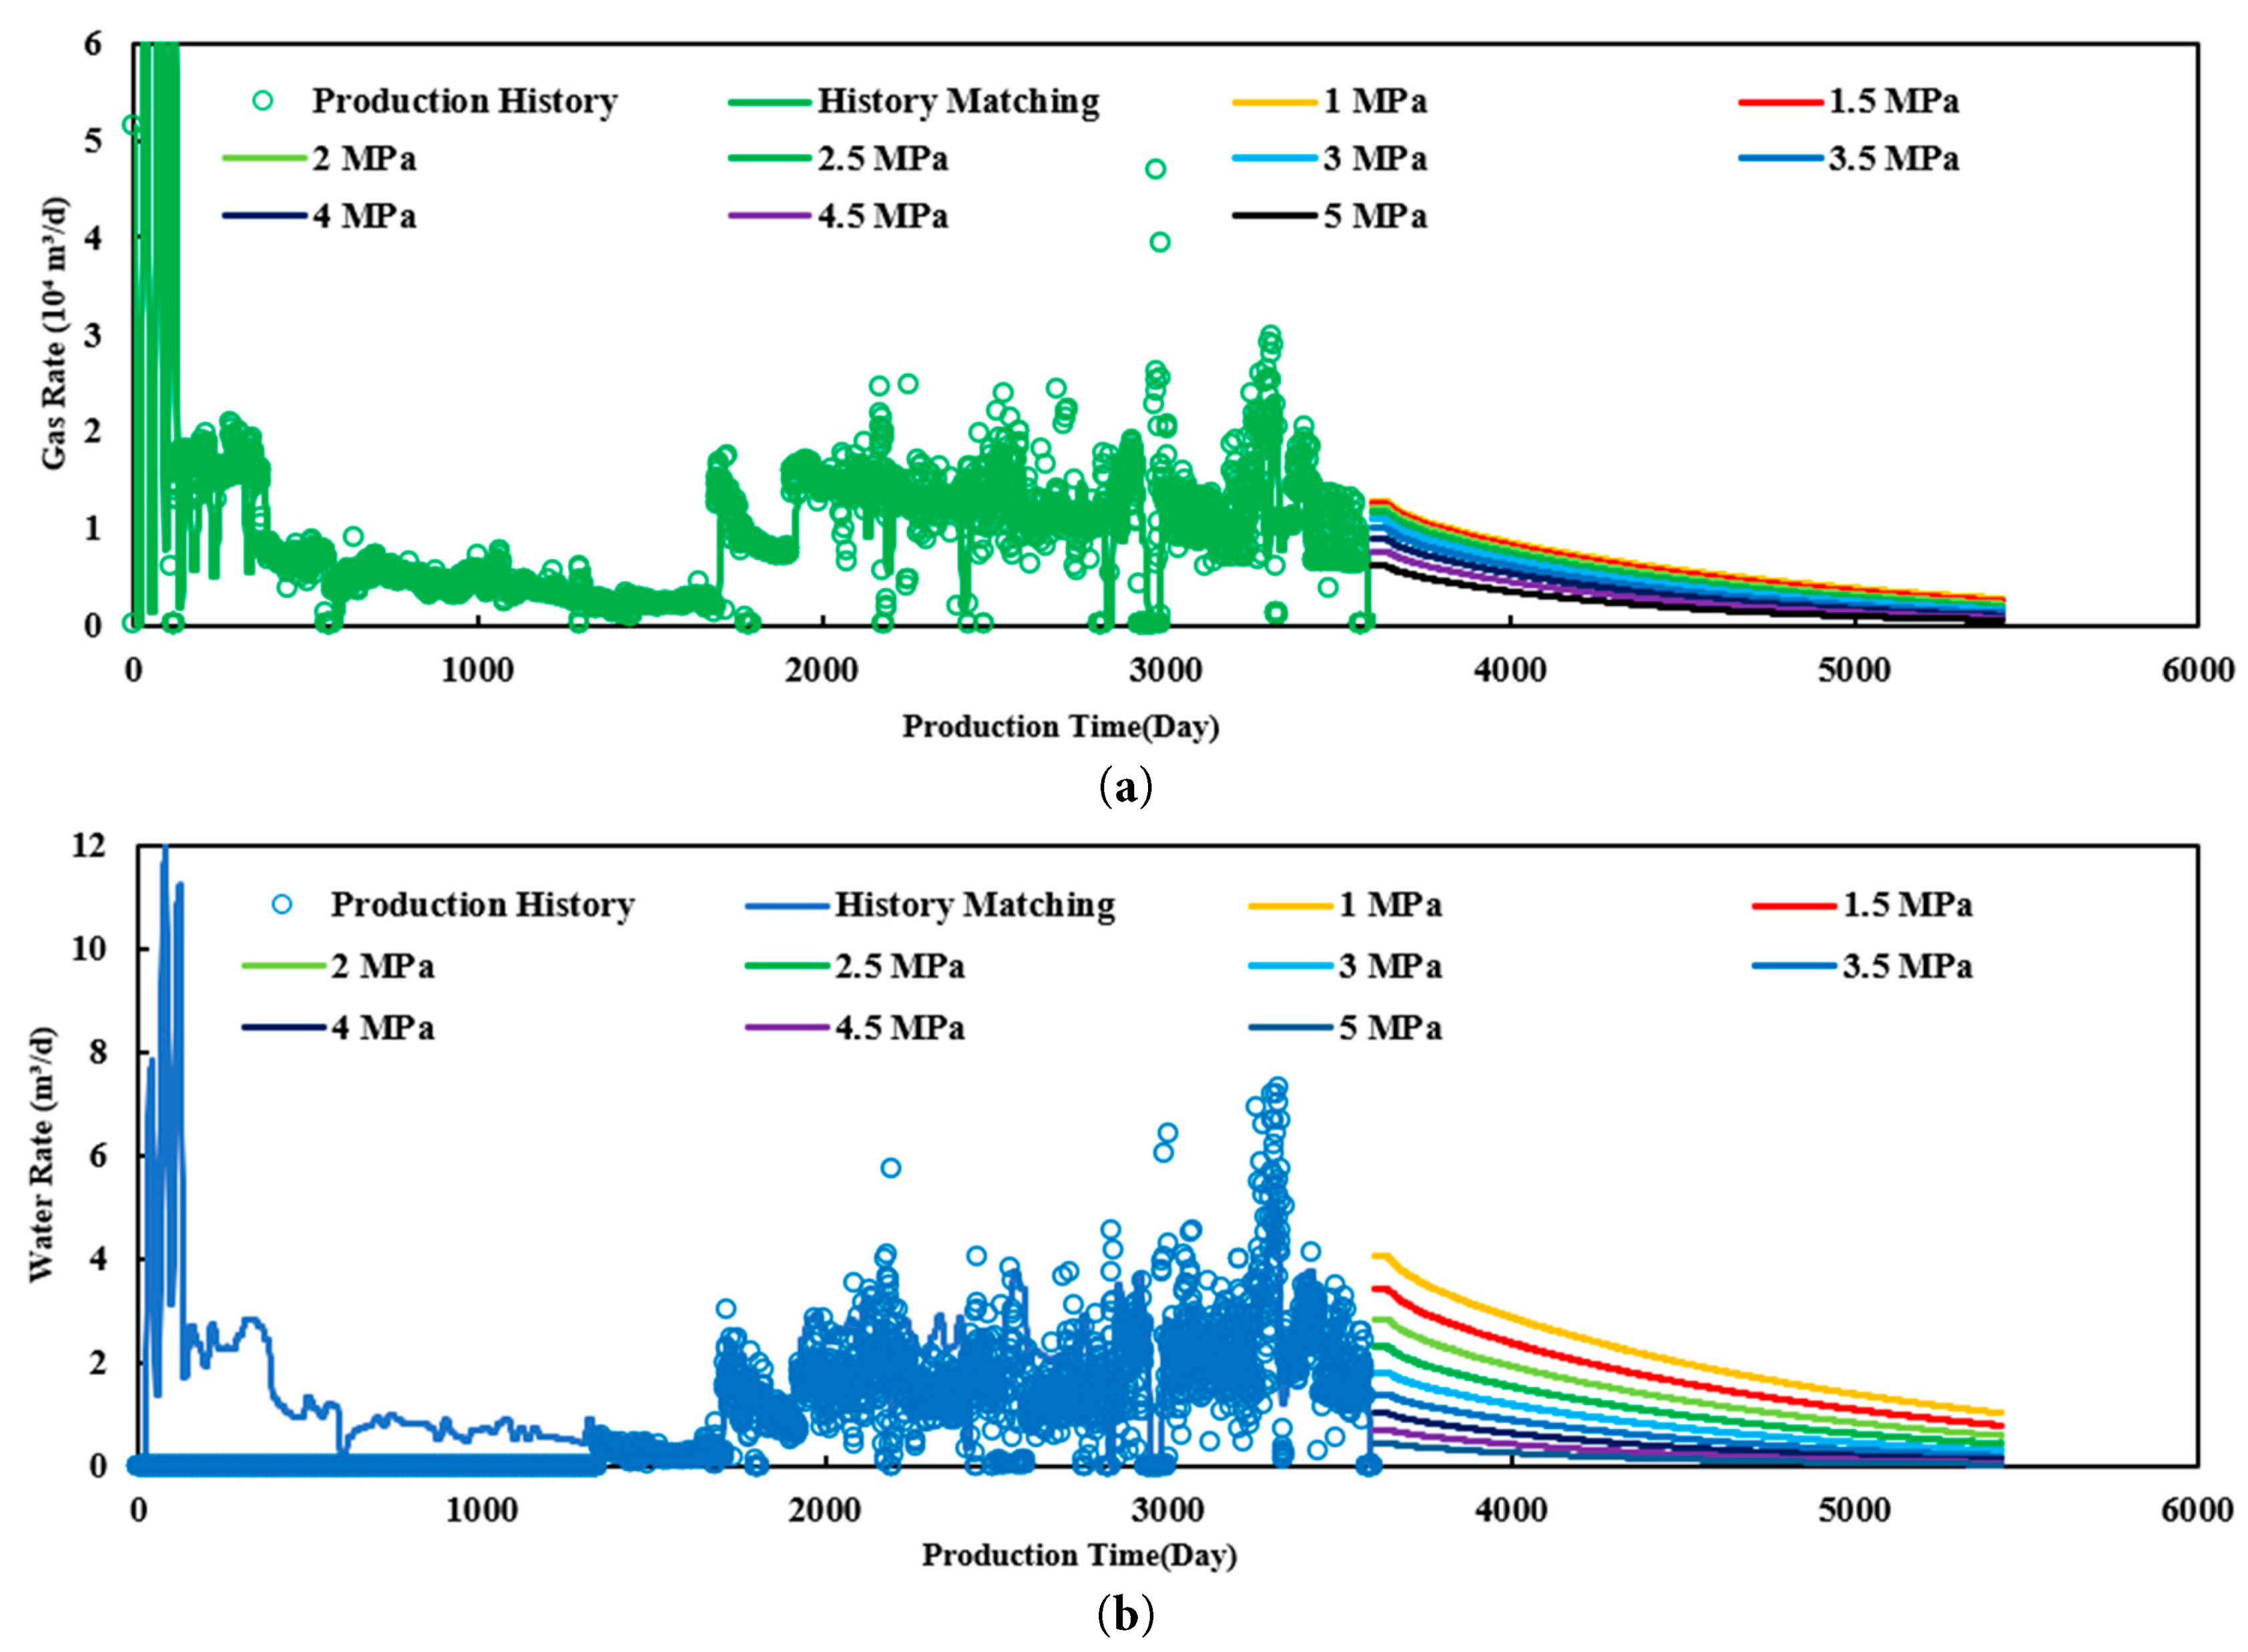
Figure 5: Prediction of gas and water production rates over a five-year cycle under varying bottomhole flowing pressures (Pwf): (a) Predicted daily gas production rates; (b) Predicted daily water production rates.
Supported by the aforementioned reservoir-scale production capacity predictions, the accuracy of dynamic production trend forecasting has been effectively ensured. The obtained results provide critical input data for the wellbore multiphase flow model, thereby supporting the construction of Inflow Performance Relationship (IPR) curves and the optimization design of bottomhole flowing pressure (Pwf). This enables quantitative and coordinated analysis from the reservoir to the wellbore.
3.2 Optimization Strategy for Graded Drainage under Variable Conditions
Utilizing the IPR established in Section 2.1, a coupled model was constructed to simulate the impact of dynamic water-gas ratio (WGR) variations on the foam drainage production system over the well’s lifecycle. The study established multiple operational conditions covering a WGR range from 0.00054 to 0.006 and performed nodal coordination analysis, as illustrated in Fig. 6. It can be observed that as the liquid production rate increases, the bottomhole flowing pressure (Pwf) on the foam drainage VLP curve continuously decreases. Notably, under low WGR conditions, two intersection points occur between the VLP and IPR curves. The second intersection is selected as the drainage-production equilibrium point. This is because the first intersection corresponds to a low gas production rate and high liquid holdup, which easily triggers wellbore liquid loading or even production shutdown; conversely, only the second intersection represents a stable and sustainable production state.
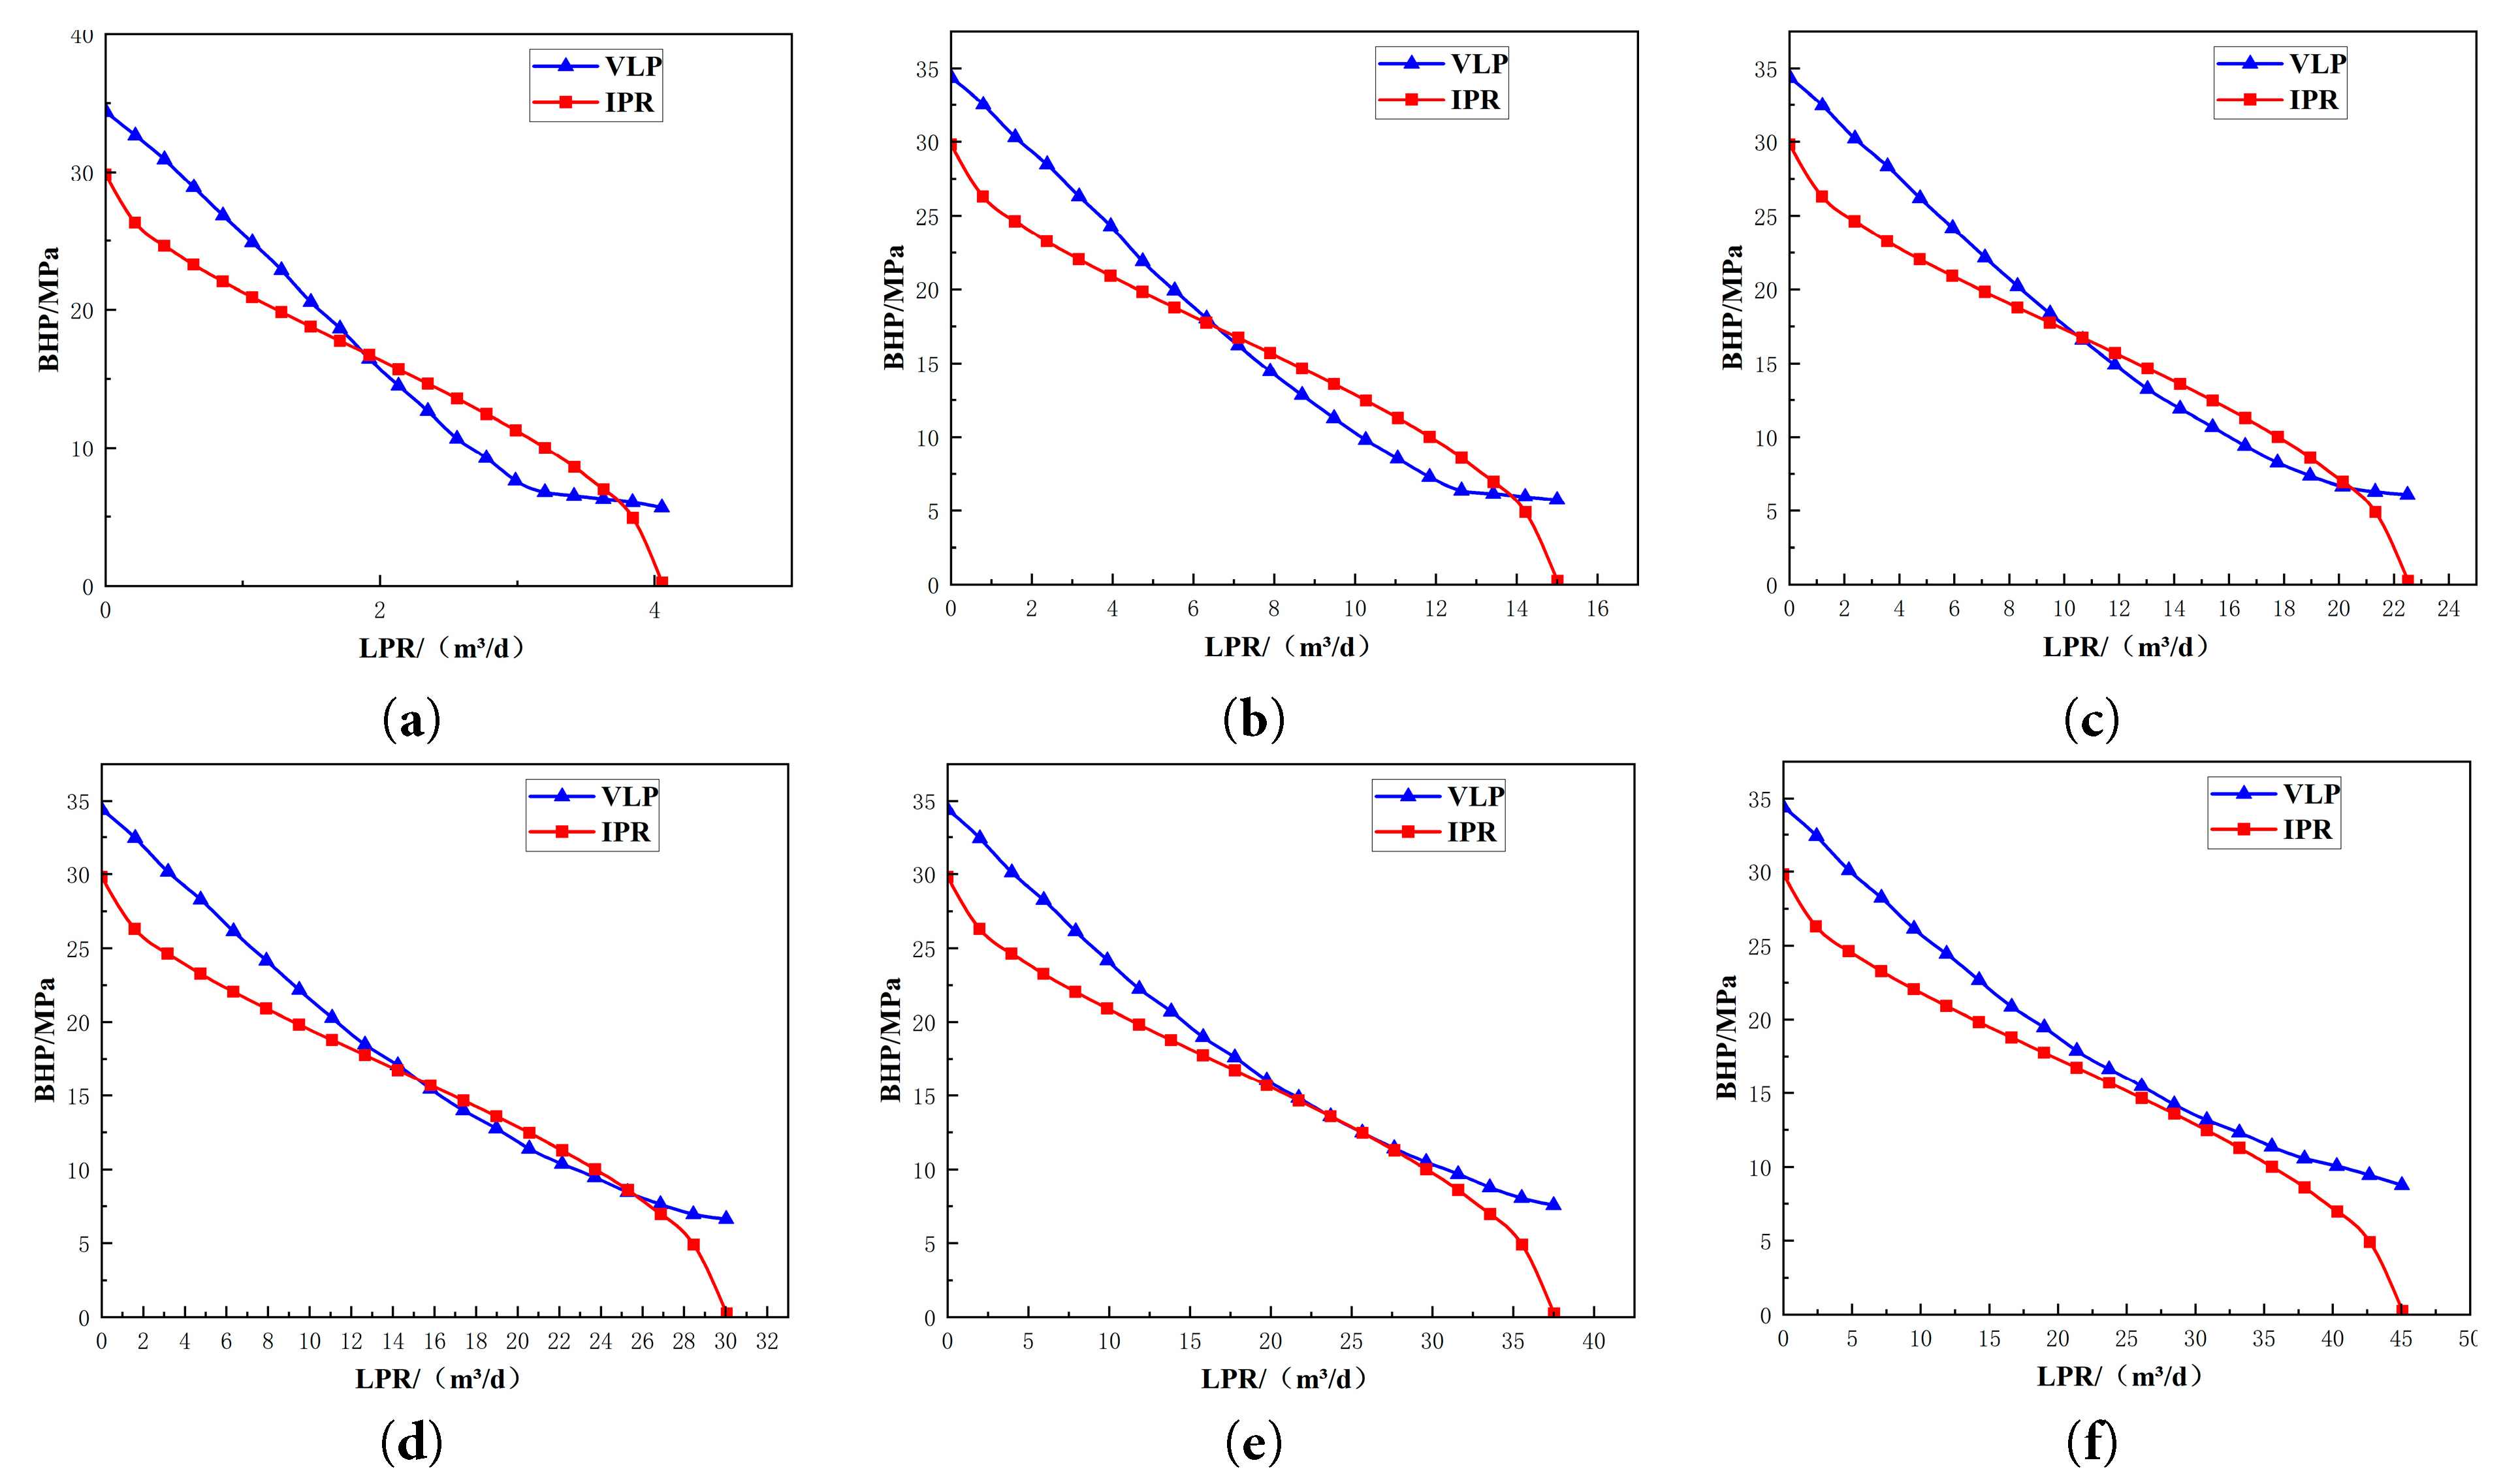
Figure 6: Foam-assisted lift VLP/IPR curves under different water-gas ratios. (a): Water-gas ratio is 0.00054; (b): Water-gas ratio is 0.0020; (c): Water-gas ratio is 0.0030; (d): Water-gas ratio is 0.0040; (e): Water-gas ratio is 0.0050; (f): Water-gas ratio is 0.0060.
To further compare the drainage-production equilibrium points under various water-gas ratios (WGR), the intersection points of the VLP and IPR curves were extracted and analyzed, with the results presented in Fig. 7. Simulation results indicate that as the WGR increases, the density of the mixed fluid in the wellbore rises and slippage losses intensify, leading to a significant increase in the bottomhole flowing pressure (Pwf) required for lifting, as illustrated in Fig. 7a. The VLP curve, representing wellbore energy consumption, shifts upward overall, driving the nodal coordination point toward a region characterized by “higher flowing pressure (Pwf) and lower gas production rate”.
Consequently, the foam drainage process demonstrates superior adaptability under low WGR conditions. When WGR < 0.002, chemical-assisted drainage predominates during this stage, and the inherent energy of the gas well remains relatively sufficient. Simulation results show that the foam drainage process effectively mitigates wellbore slippage losses, enabling the coordinated bottomhole flowing pressure (Pwf) to be maintained within the engineering target limit of 6 MPa (Fig. 7a). Therefore, foam drainage should be prioritized during this stage. By optimizing the foaming agent concentration and injection schedule, the inherent energy of the gas flow can be leveraged to achieve efficient liquid unloading [14,33].
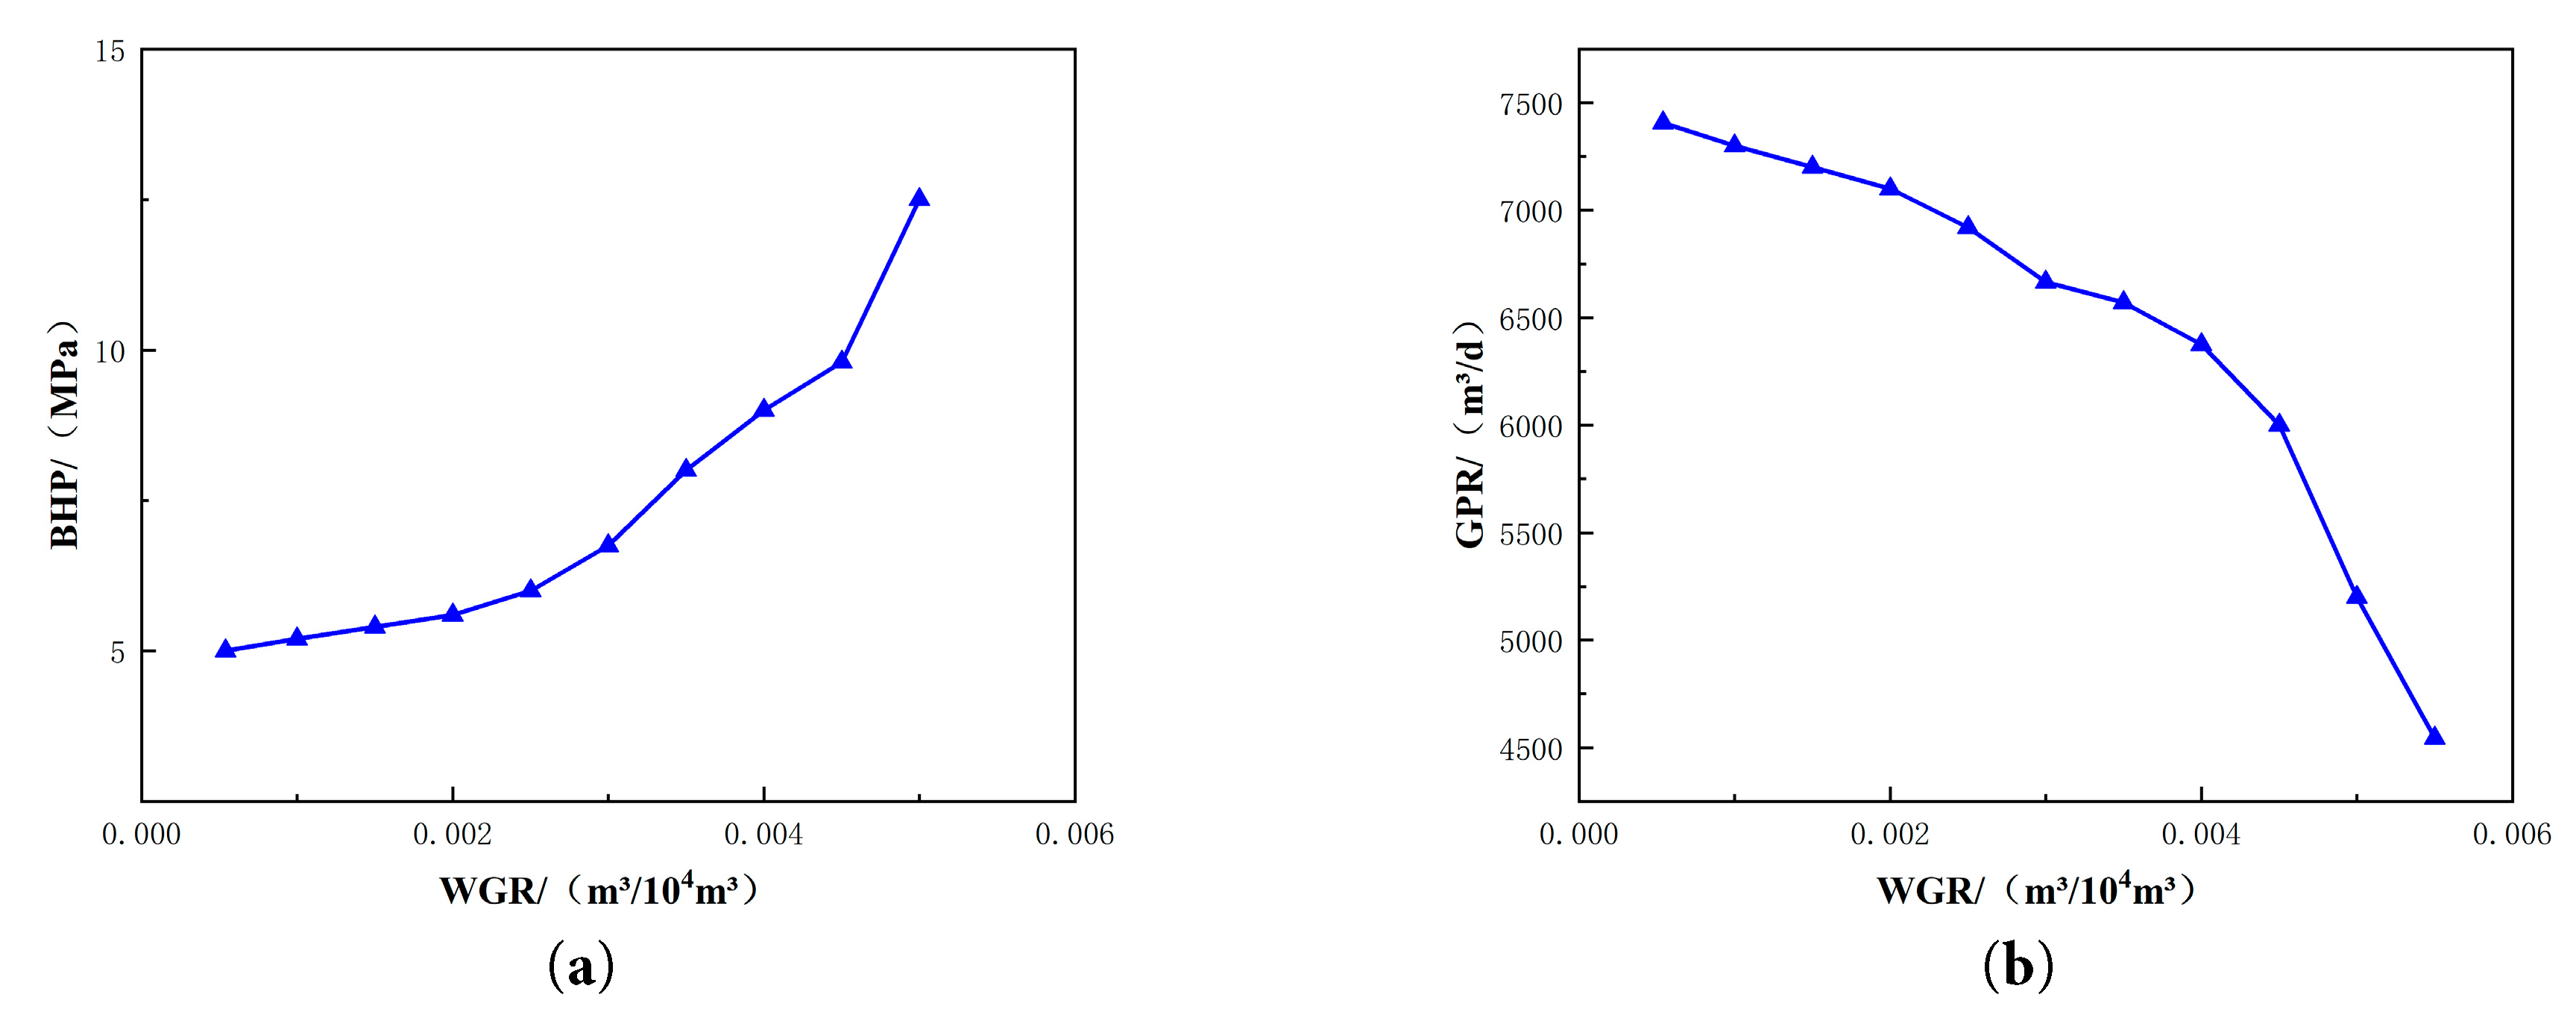
Figure 7: Variation of coordination pressure and production rate for foam-assisted lift under different water-gas ratios. (a): Coordination pressure under different water-gas ratios; (b): Coordinated gas production rate under different water-gas ratios.
On the other hand, to investigate the influence of other parameters on the lifting performance of foam drainage, sensitivity analyses were conducted under varying pressures and choke sizes, as illustrated in Fig. 8. It can be observed that as the wellhead pressure decreases, the foam drainage VLP curve shifts downward, resulting in a continuous increase in the coordinated liquid production rate, as shown in Fig. 8a. The wellhead pressure directly influences the location of the gas well’s coordination point; if production declines, the wellhead pressure can be appropriately lowered to enhance both liquid and gas production. Furthermore, as the choke size decreases, the VLP curve for foam drainage shifts downward and the coordinated liquid production rate continuously increases, as illustrated in Fig. 8b. Within a reasonable range, increasing the choke size can reduce flow resistance and backpressure while increasing flow velocity, which is conducive to liquid removal.
However, when the WGR exceeds 0.002, the coordinated bottomhole flowing pressure (Pwf) under foam-assisted lift conditions begins to exceed 6 MPa, as shown in Fig. 7a. This indicates that under high WGR conditions (>0.002), chemical-assisted drainage alone can no longer maintain the bottomhole flowing pressure (Pwf) within the desired range, exposing the gas well to a significant risk of liquid loading and potential shutdown. Therefore, at this stage, mechanical-enhanced drainage should be considered, involving external energy lifting processes such as mechanical pumping (rod pumping) or hydraulic jet pumps [30].
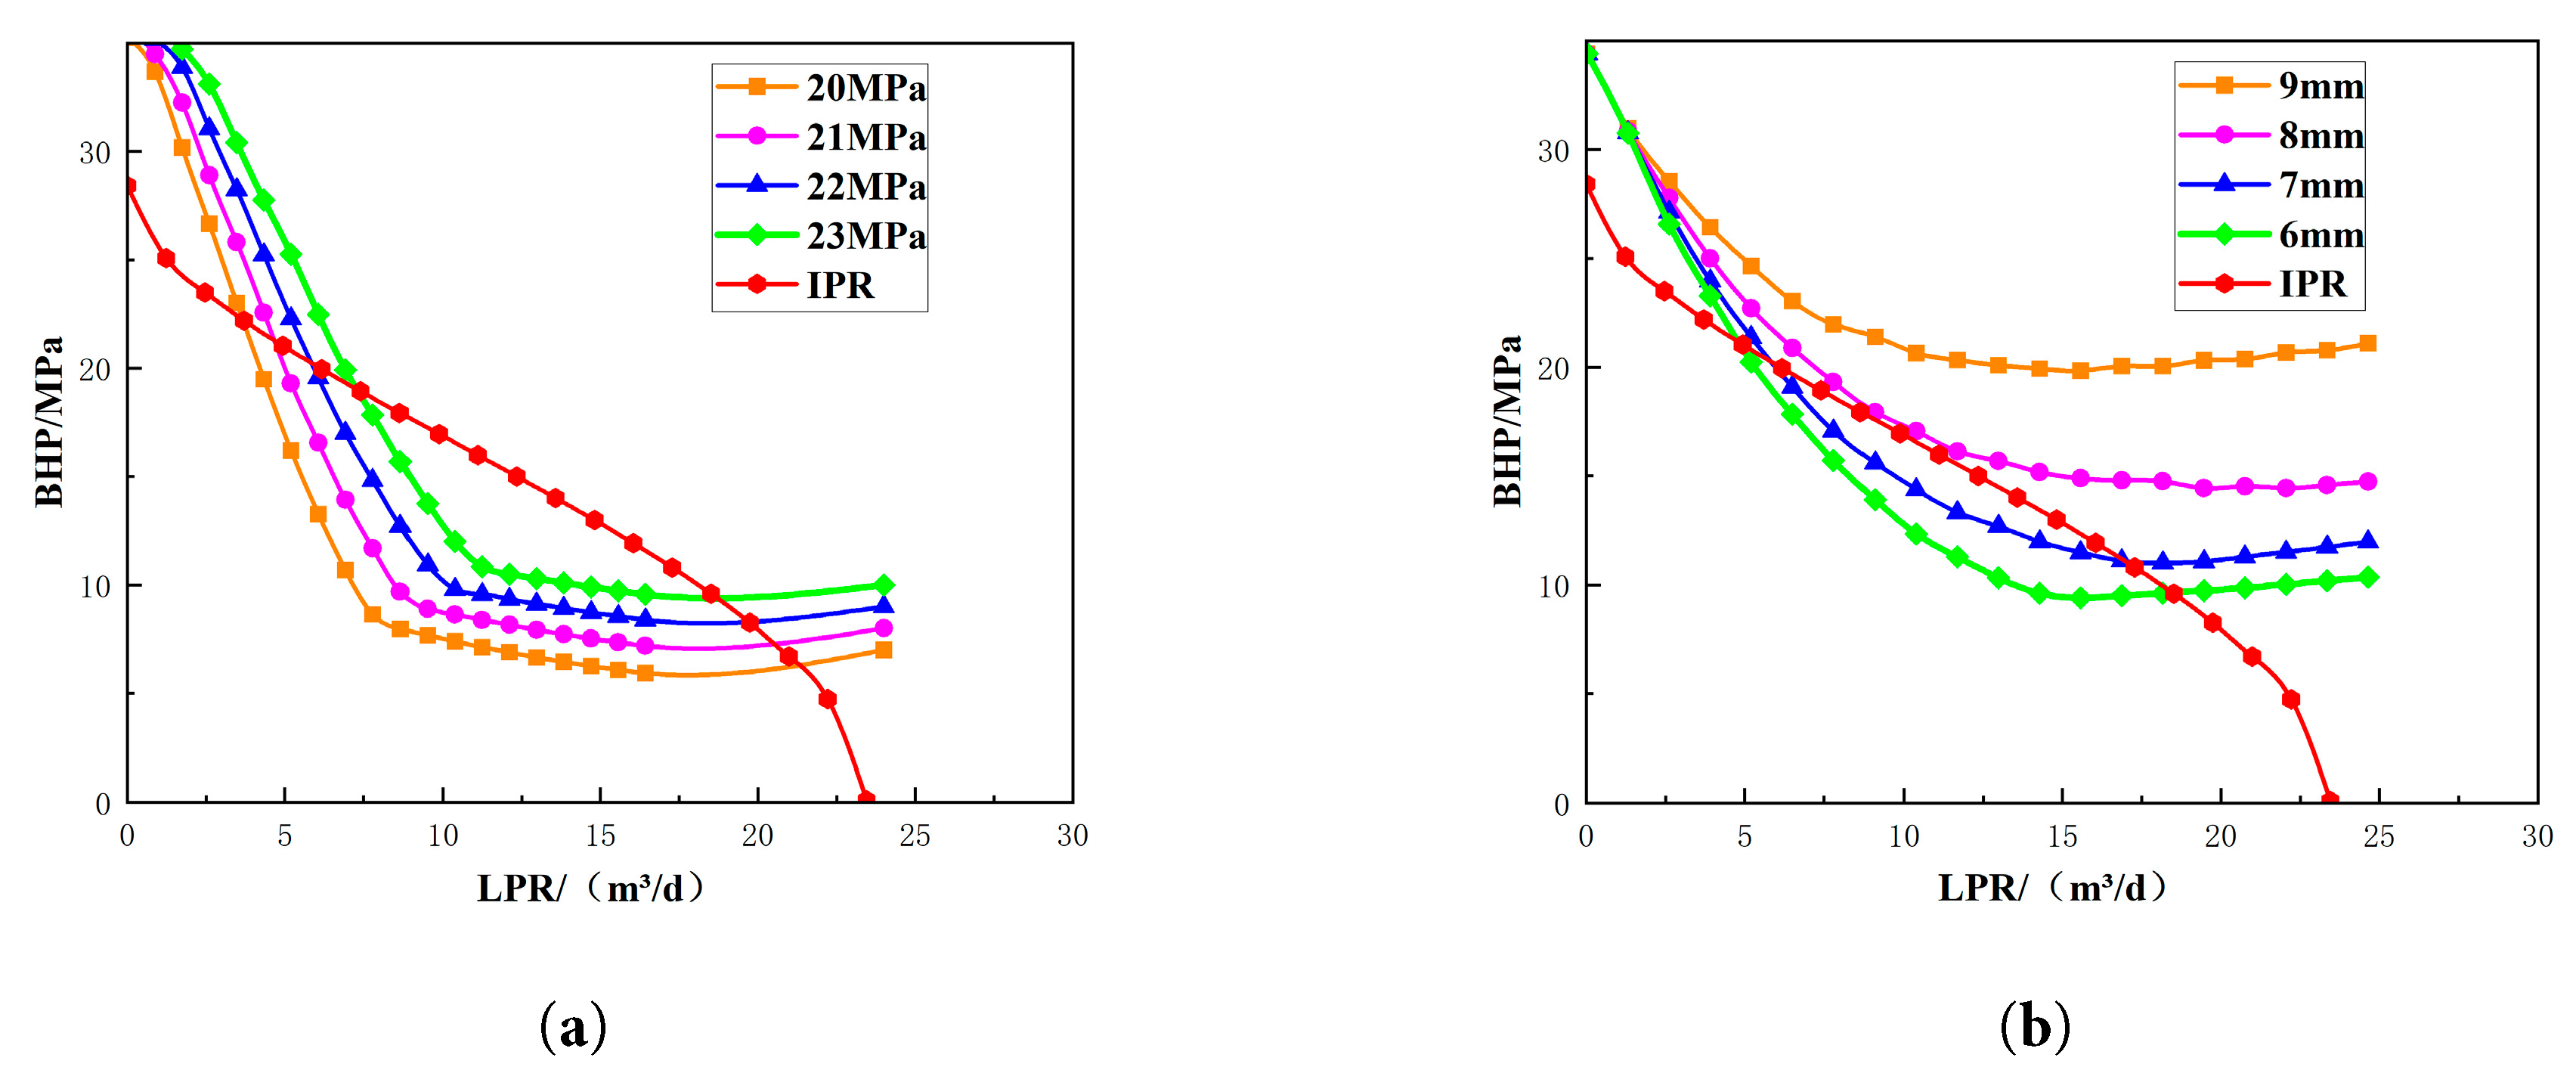
Figure 8: Sensitivity analysis of foam-assisted lift process parameters. (a): Sensitivity analysis of wellhead pressure; (b): Sensitivity analysis of choke size.
It is important to note that the identified critical threshold (WGR ≈ 0.002) is calibrated based on the representative structural and operating parameters of the target tight gas reservoir (e.g., average tubing depth and wellhead pressure). Sensitivity analysis based on the VLP model indicates that this threshold is physically dependent on wellbore lifting conditions. Specifically, for wells with greater depths or higher wellhead backpressures, the increased gravitational and frictional pressure losses would suppress the gas phase’s lifting capacity, potentially shifting the transition point to a lower WGR (necessitating an earlier switch to mechanical lift). Conversely, for shallower wells, the threshold may extend to a slightly higher WGR. Therefore, while the quantitative value of 0.002 serves as a crucial operational benchmark for this specific field, the proposed “coupled IPR/VLP optimization workflow” maintains general applicability, allowing engineers to determine precise switching thresholds for gas wells with varying configurations.
To this end, this study investigated the impact of stroke length and pumping speed on the VLP curves of rod pumping, as illustrated in Fig. 9. It can be observed that as the stroke length and pumping speed increase, the rod pumping VLP curves shift rightward, with the corresponding coordinated water production rates continuously increasing (Fig. 9a,b). Furthermore, for any specific combination of stroke length and pumping speed, there exists a uniquely corresponding VLP curve and coordinated liquid production rate (Fig. 9c). Therefore, for rod pumping systems, increasing the pumping speed or stroke length during this stage can effectively reduce the bottomhole flowing pressure (Pwf), thereby unleashing reservoir productivity and enhancing the Estimated Ultimate Recovery (EUR) of the gas well (Fig. 9).
Furthermore, this study conducted a simulation analysis on jet pumps. It can be observed that as the nozzle-to-throat area ratio R decreases, the jet pump VLP curve shifts downward, and the coordinated liquid production rate continuously increases, as shown in Fig. 10a. On the other hand, the lifting head of the pump decreases with a reduction in R, as illustrated in Fig. 10b. Research indicates that although increasing the area ratio limits the liquid production rate by reducing the suction flow area, it significantly enhances the pump’s pressure boost capability, providing essential lifting head support for gas wells at high risk of liquid loading—a key measure to prevent “dead wells”. In the optimization of jet pump drainage systems, the area ratio R acts as the core lever to balance “drainage efficiency” and “lifting intensity”. Moreover, the three sets of curves appear highly similar; sensitivity analysis reveals that the coordinated production rate is highly sensitive to the area ratio R but remains insensitive to variations in absolute nozzle area when R is constant (Fig. 10a). This suggests that in practical engineering selection, priority should be assigned to adjusting the area ratio to accommodate dynamic reservoir WGR variations, while absolute nozzle size adjustments should primarily focus on matching the displacement and pressure ratings of surface power pumps rather than acting as a primary tool for production regulation.
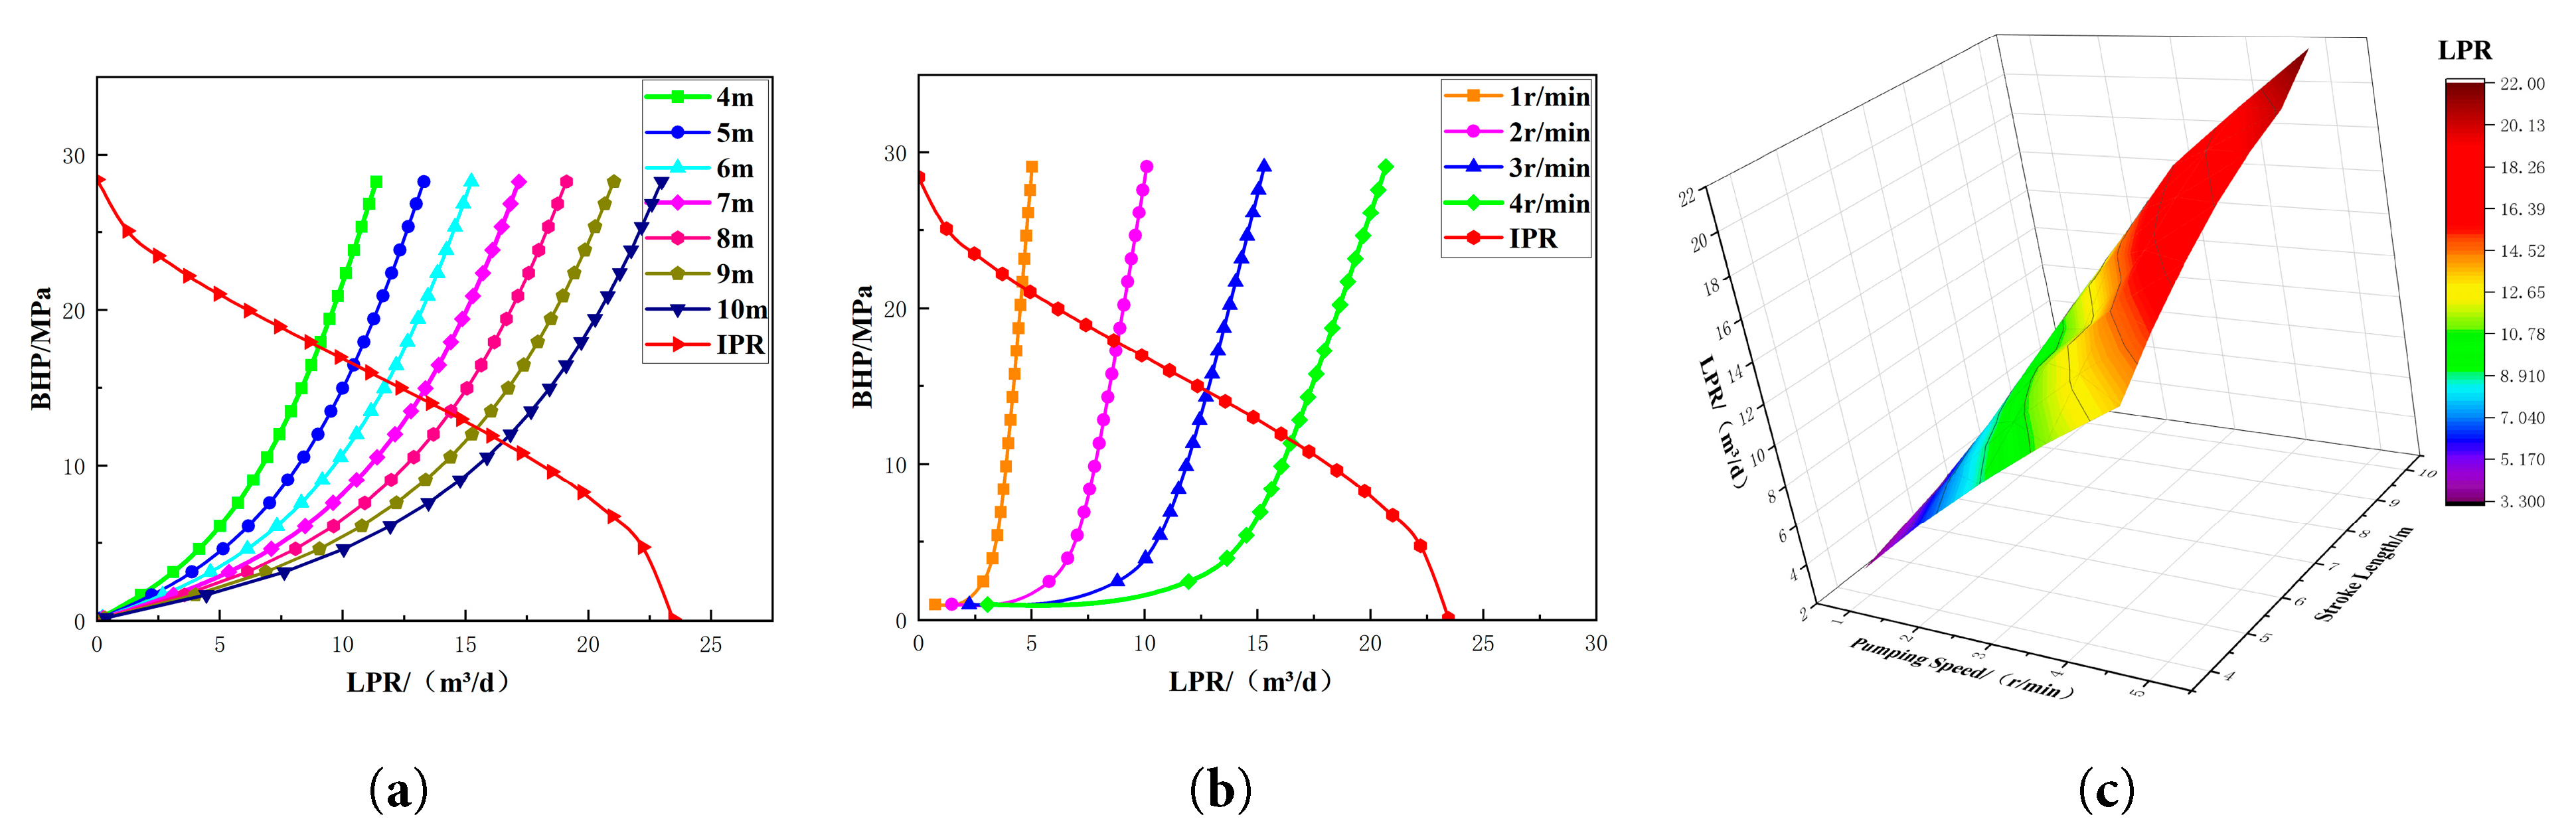
Figure 9: Sensitivity analysis of stroke length and speed. (a): Sensitivity analysis of pump stroke length; (b): Sensitivity analysis of pump speed (strokes per minute); (c): Impact of stroke length and speed on coordinated water production rate.
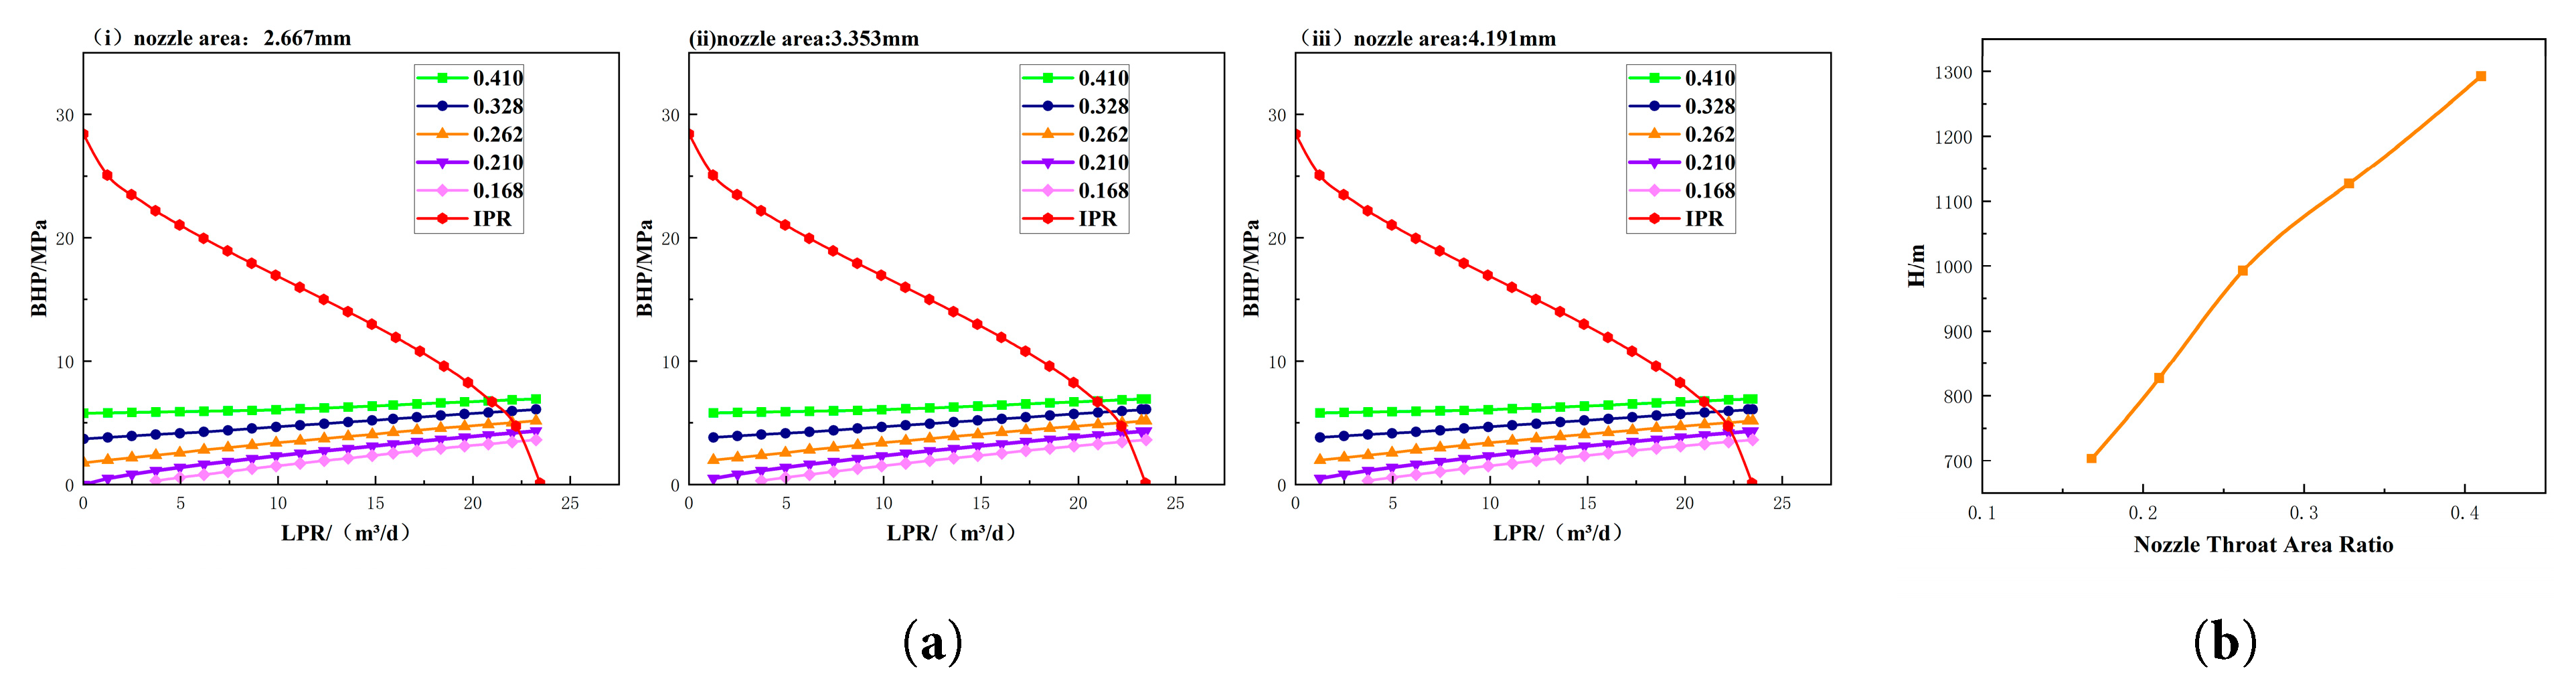
Figure 10: Sensitivity analysis of nozzle-to-throat area ratio. (a): Impact of different nozzle areas on coordinated production rate; (b): Nozzle-to-throat area ratio and pump head.
3.3 Optimization Schemes for Different Drainage Gas Production Processes
Based on the graded drainage research methodology established in Section 2.2, simulations were conducted for the representative gas well under various drainage operational regimes. During the low water-cut stage with a water-gas ratio (WGR) of 0.00054, foam drainage was employed, with the operational parameters detailed in Table 2 [34]. It can be observed that the drainage-production equilibrium point for foam drainage corresponds to a liquid production rate of 3.75 m3/d and an optimal bottomhole flowing pressure (Pwf) of 5 MPa, which satisfies the preferred pressure requirements, as shown in Fig. 11a. Furthermore, the actual flow velocity of the foam system remains stable between 50 km/h and 80 km/h, while the critical liquid-carrying velocity is within 30 km/h, as illustrated in Fig. 11b. Since the actual velocity significantly exceeds the critical threshold, the requirements for liquid unloading are fully met.
Table 2: Table of Foam-Assisted Lift Parameter Design.
| Surfactant Concentration (Fraction) | Surface Tension (dyne/cm) | Foam Density (lb/ft3) |
|---|---|---|
| 0.0002 | 66 | 68 |
| 0.0005 | 59 | 53 |
| 0.001 | 52 | 45 |
| 0.0015 | 46 | 40 |
| 0.0025 | 42.5 | 33 |
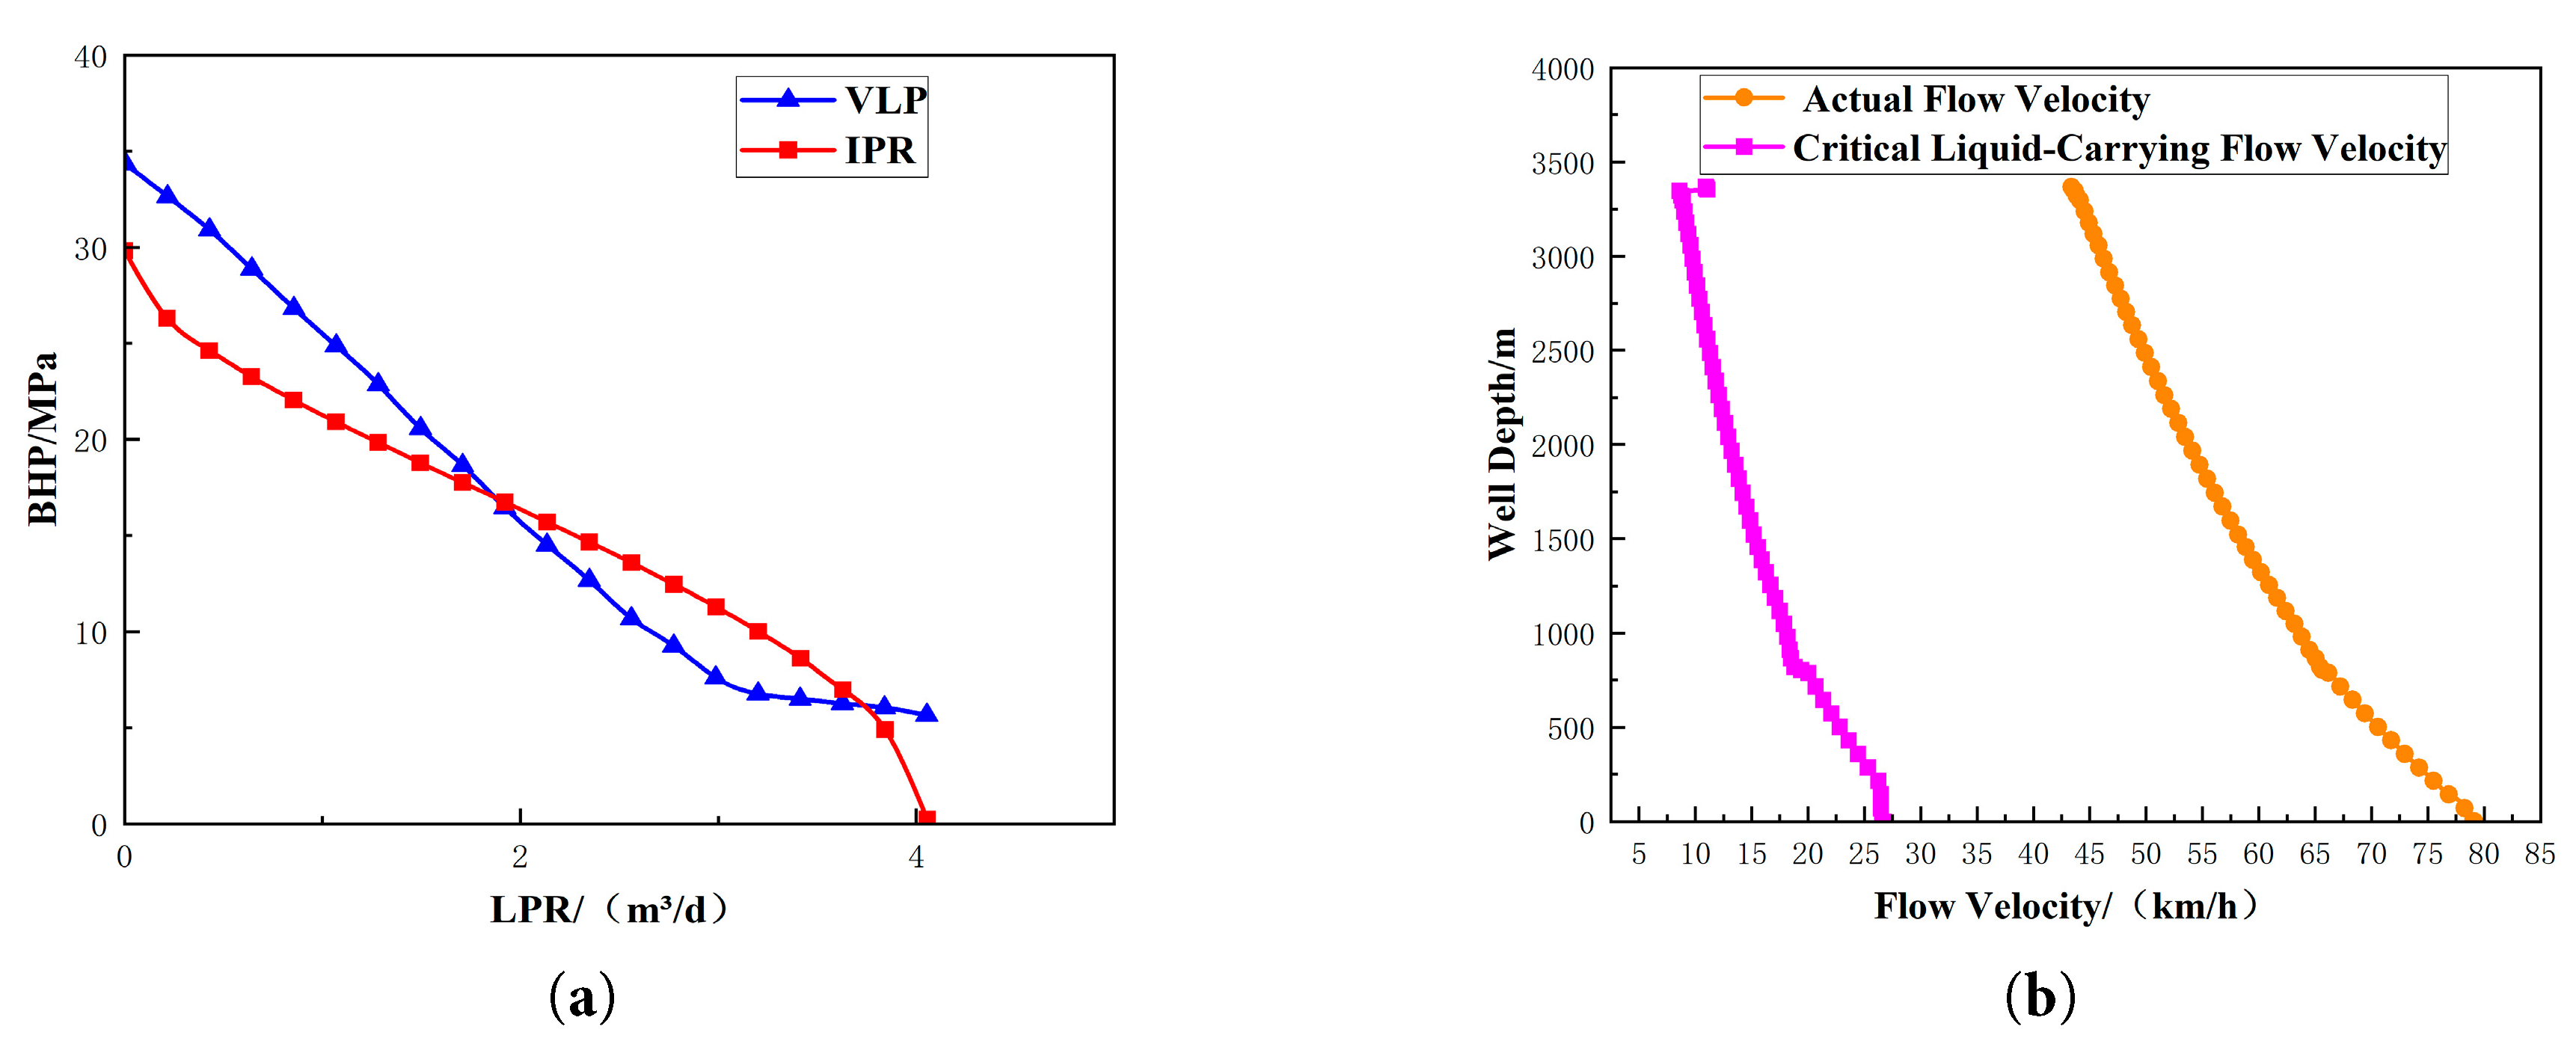
Figure 11: Model for foam-assisted lift under low water-gas ratio. (a): Curves for foam-assisted lift under low water-gas ratio (0.00054); (b): Critical liquid-carrying model for foam-assisted lift under low water-gas ratio (0.00054).
During the middle to late stages of gas well drainage and production, it is often necessary to maintain the bottomhole flowing pressure (Pwf) at a relatively low, specific value to ensure continuous fluid inflow from the reservoir into the wellbore. Taking the representative gas well selected earlier as an example, this case study sets a target bottomhole flowing pressure (Pwf) of 5.4 MPa. An optimal operating strategy for mechanical pumping and jet pumping is then determined through inversion using a coupled model.
First, regarding rod pumping measures, the VLP curves were analyzed and compared under a pump setting depth of 3000 m with varying pump diameters (1.5 inch and 1.75 inch) and different combinations of stroke length and pumping speed. As illustrated in Fig. 12, the rod pumping VLP curves shift rightward as the stroke length and pumping speed increase, resulting in a progressive increase in the coordinated liquid production rate and a corresponding decline in the equilibrium bottomhole flowing pressure (Pwf). Simulation results indicate that to precisely achieve a target bottomhole flowing pressure (Pwf) of 5.4 MPa at a water production rate of 22 m3/d, two optimal matching configurations were identified: Case 1 (1.5-inch diameter × 10 m stroke × 5 strokes/min) and Case 2 (1.75-inch diameter × 8 m stroke × 5 strokes/min). Both configurations successfully reach the target bottomhole flowing pressure (Pwf), as shown in Fig. 12e,j.
Based on the two configurations optimized under different pump diameters mentioned above, dynamometer card and torque tests were conducted. It is observed that the polished rod displacement of Case 1 is significantly greater than that of Case 2, while the polished rod loads remain essentially identical. Case 3 exhibits a better degree of pump fillage; furthermore, it demonstrates smaller torque fluctuations and superior stability compared to Case 4, as illustrated in Fig. 13.
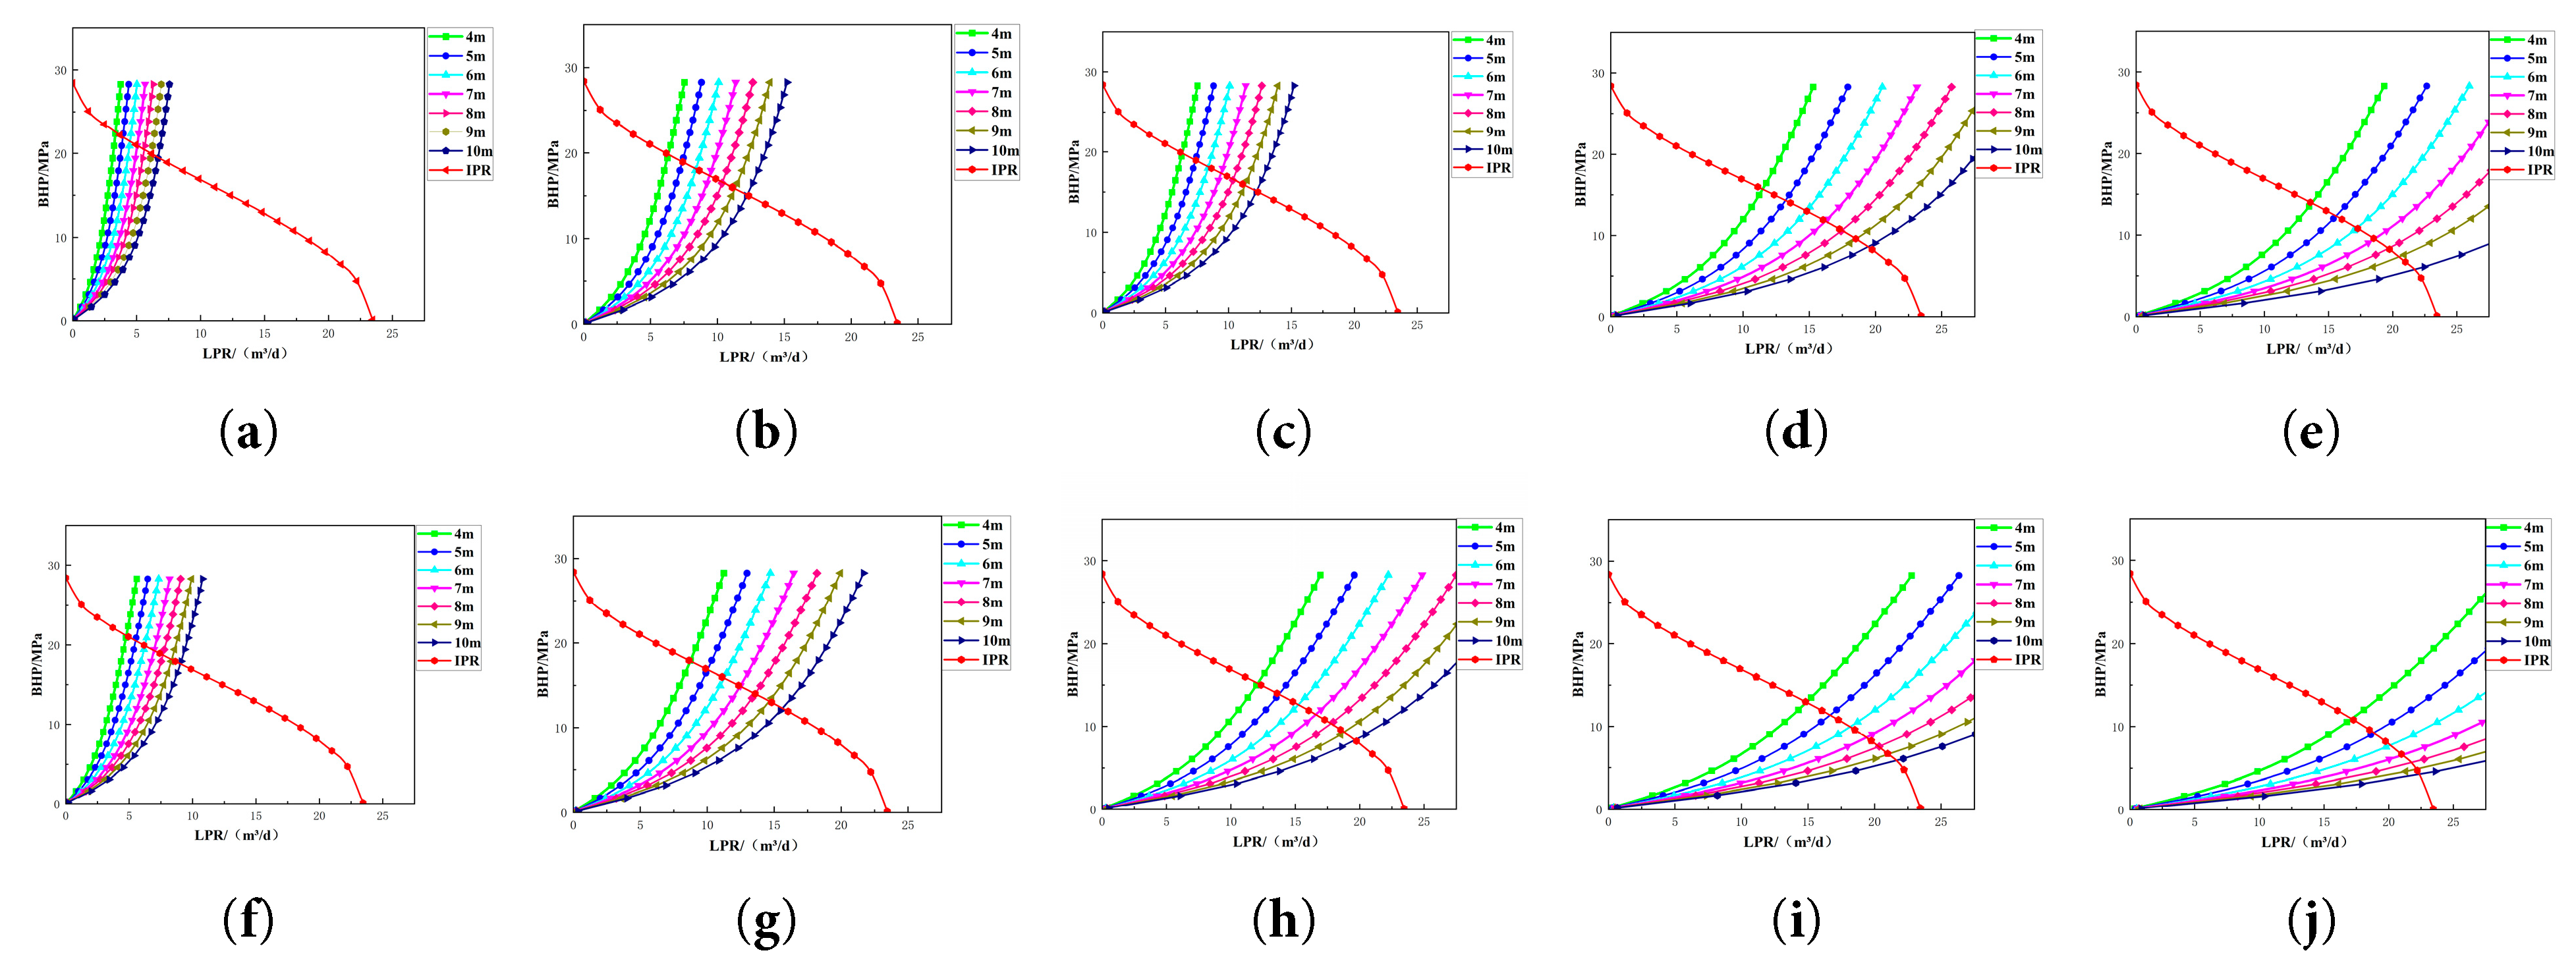
Figure 12: VLP/IPR curves for variable stroke lengths and speeds under different pump diameters. (a): VLP/IPR curve (1 SPM, Ø38 mm); (b): VLP/IPR curve (2 SPM, Ø38 mm); (c): VLP/IPR curve (3 SPM, Ø38 mm); (d): VLP/IPR curve (4 SPM, Ø38 mm); (e): VLP/IPR curve (5 SPM, Ø38 mm); (f): VLP/IPR curve (1 SPM, Ø44 mm); (g): VLP/IPR curve (2 SPM, Ø44 mm); (h): VLP/IPR curve (3 SPM, Ø44 mm); (i): VLP/IPR curve (4 SPM, Ø44 mm); (j): VLP/IPR curve (5 SPM, Ø44 mm).
Consequently, based on the principles of maximizing pump fillage and minimizing torque fluctuation, the configuration featuring a 1.5-inch pump diameter, 10 m stroke, and 5 strokes/min is prioritized, as shown in Fig. 13.
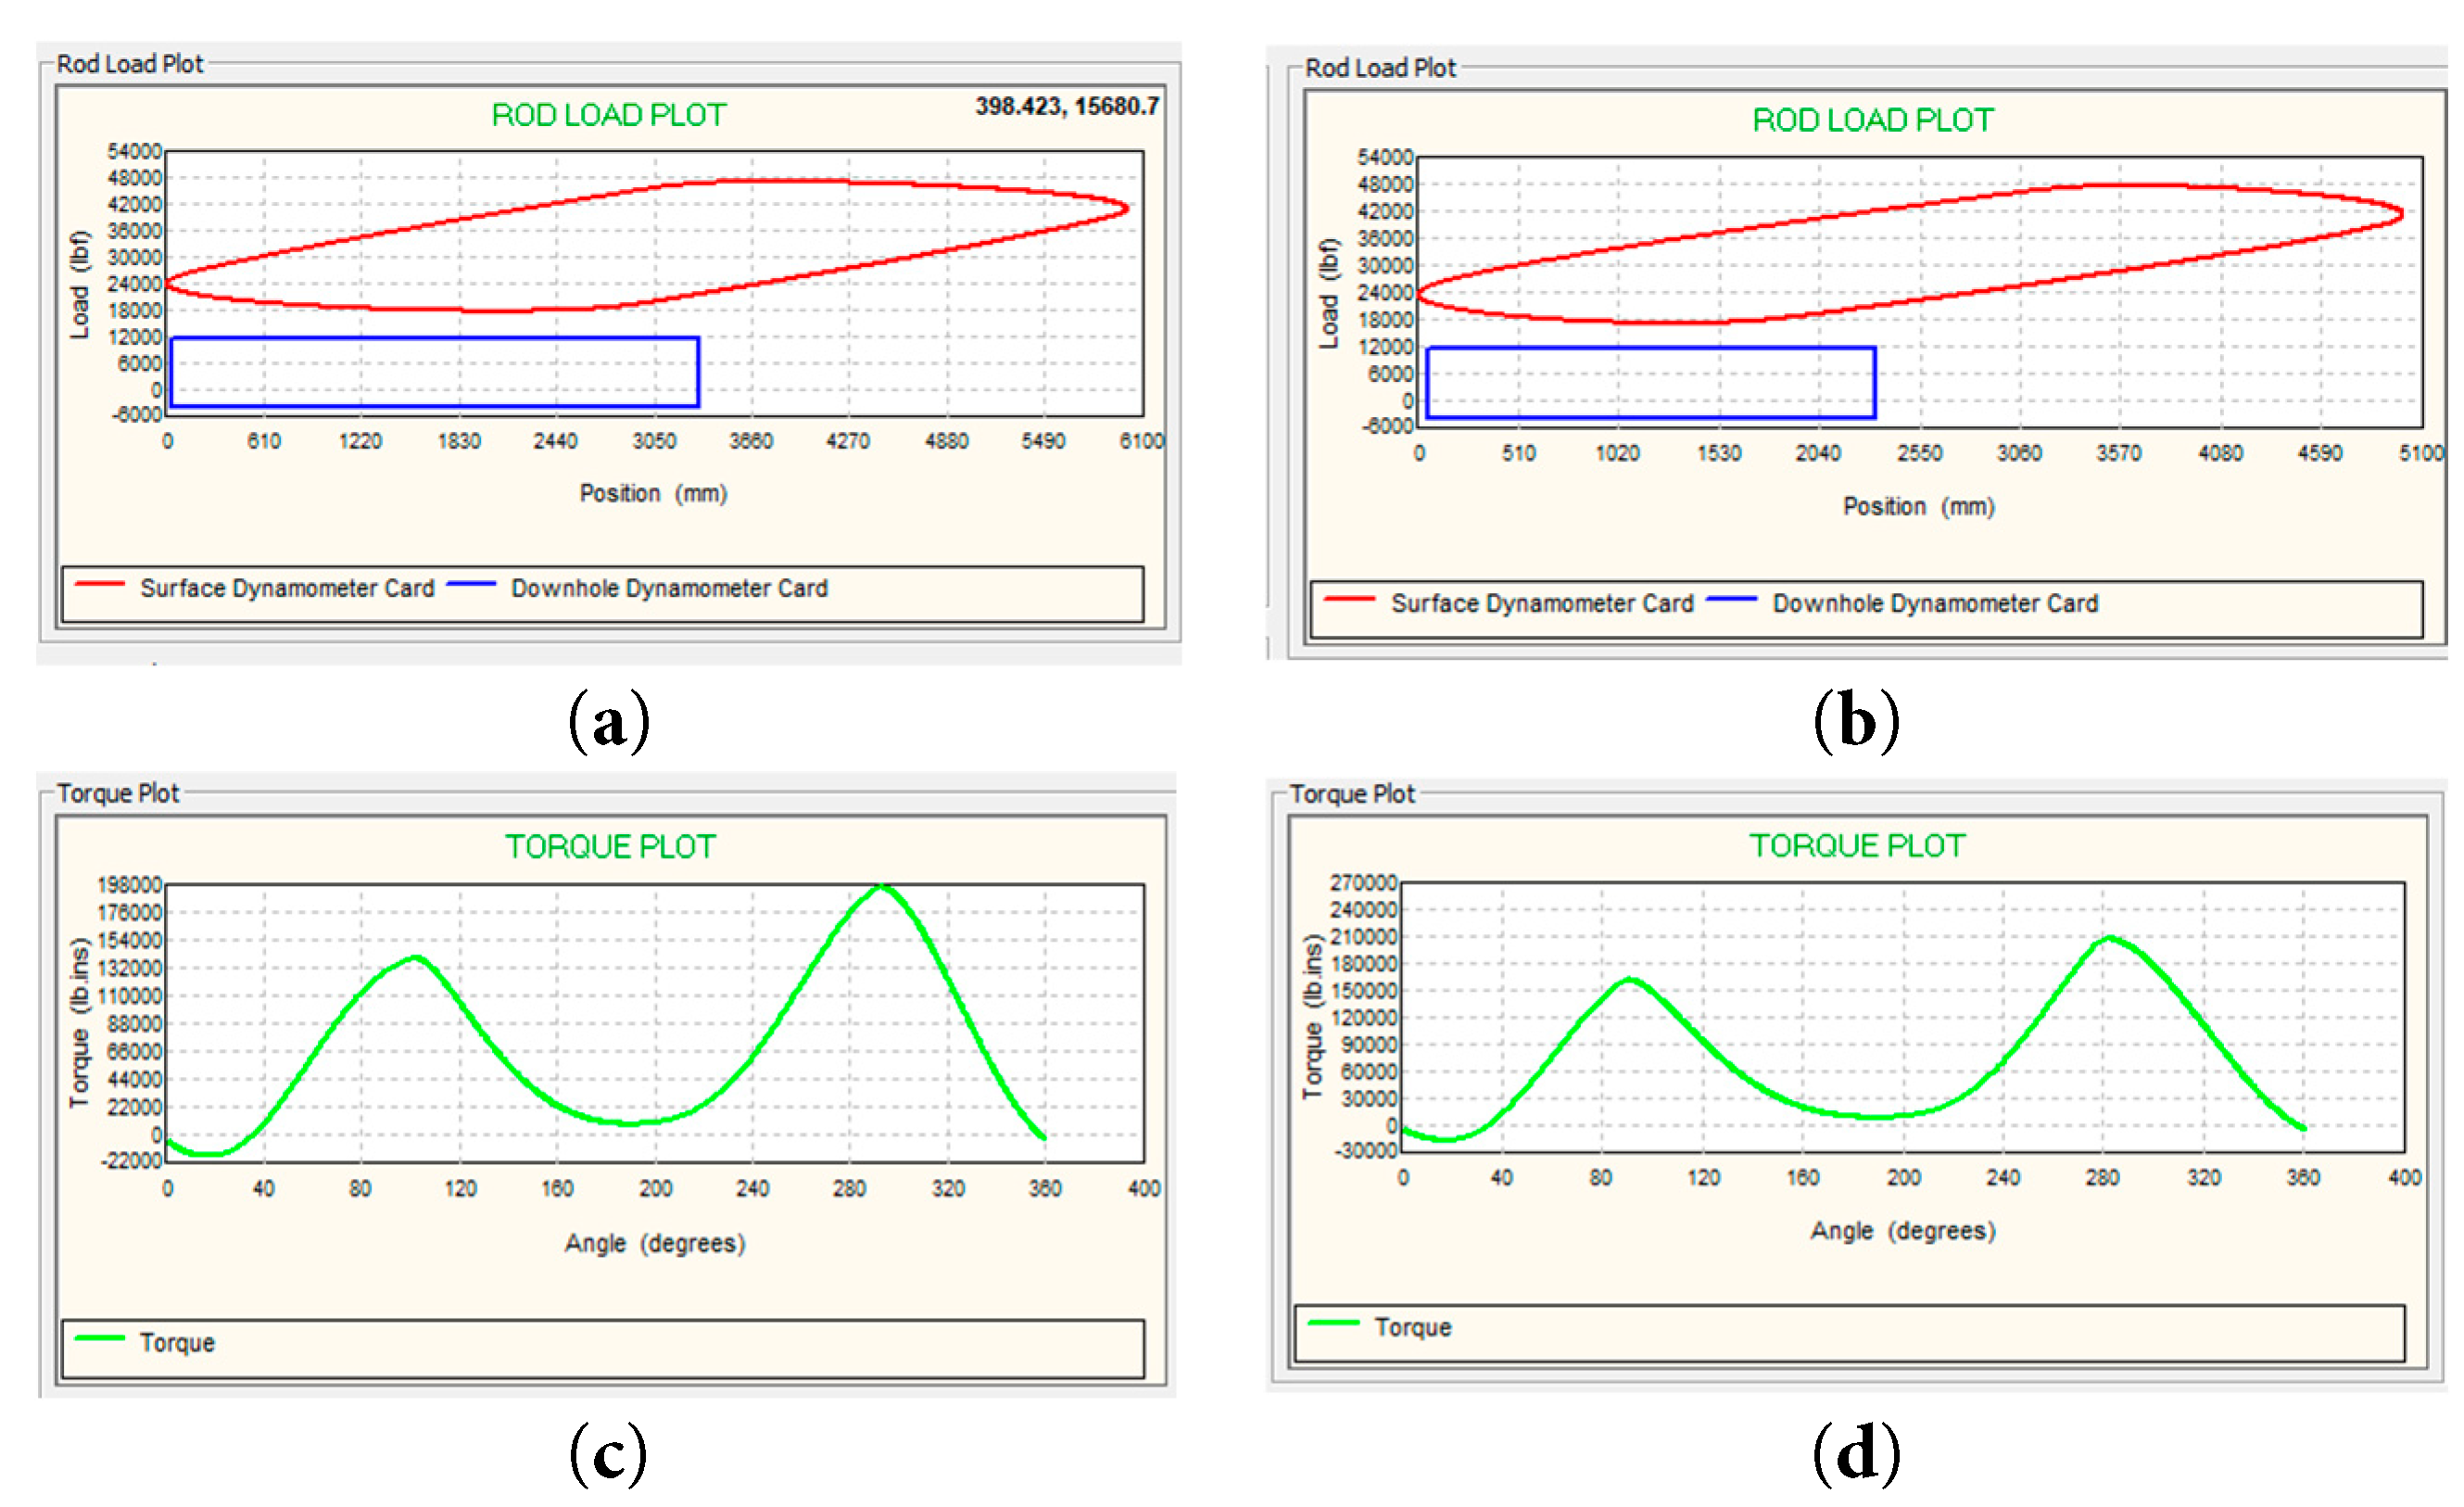
Figure 13: Comparison chart of pump torque. (a): case1: Dynamometer card (10 m, 5 SPM, Ø38 mm); (b): Case2: Dynamometer card (8 m, 5 SPM, Ø44 mm); (c): Case3: Torque diagram (10 m, 5 SPM, Ø38 mm); (d): Case4: Torque diagram (8 m, 5 SPM, Ø44 mm).
For jet pump simulation, a comparative study was conducted on this representative gas well with a pump setting depth of 3000 m and an injection pressure of 30 MPa. VLP curves were analyzed for nozzle areas of 2.667 mm2, 3.353 mm2, and 4.191 mm2 under different nozzle-throat area ratios. Simulation results indicate that to achieve the target bottomhole flowing pressure (Pwf) of 5.4 MPa and a water production rate of 22 m3/d, an optimal configuration with a nozzle-throat area ratio of 0.328 is identified. The nozzle area itself has minimal impact on the coordination pressure, as shown in Fig. 10a. Furthermore, as the injection pressure increases, the coordinated liquid production rate continuously increases, as illustrated in Fig. 14. This indicates that the magnitude of the injection pressure directly influences the spatial location of the gas well’s coordination point. If the gas well production declines, the injection pressure can be appropriately increased to relocate the coordination point, thereby ensuring stable production and enhancing the liquid unloading capacity to prevent wellbore liquid loading.
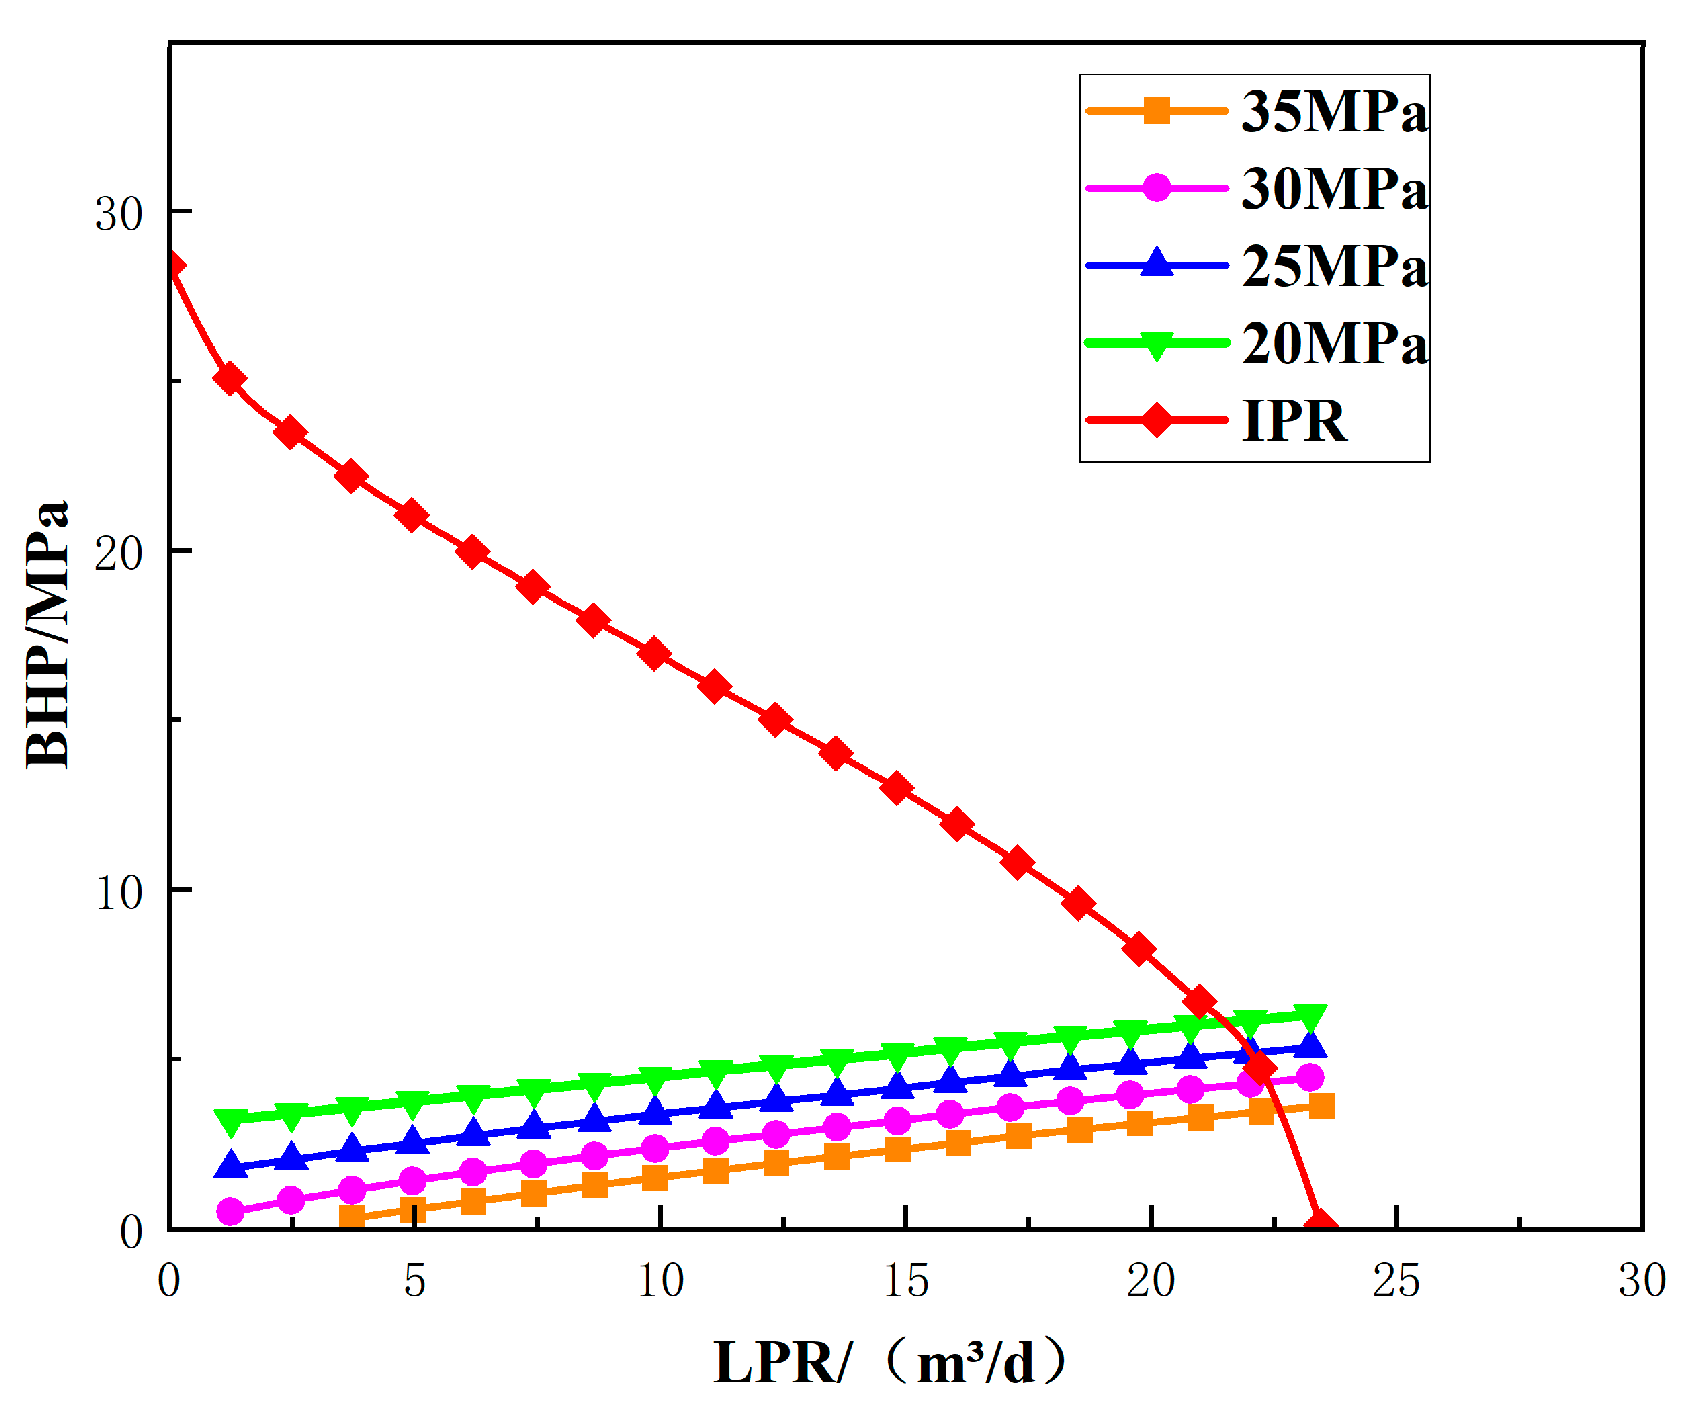
Figure 14: Sensitivity analysis of jet pump parameters.
To address the challenges of dynamic adaptation in drainage gas recovery (DGR) processes and to enhance wellbore lifting efficiency and reservoir development outcomes in high-water-cut tight sandstone gas reservoirs, this study investigates the graded optimization and dynamic adaptation of DGR techniques, taking a representative high-water-cut tight sandstone gas reservoir as a case study. First, Inflow Performance Relationship (IPR) curves reflecting reservoir deliverability and Vertical Lift Performance (VLP) curves characterizing wellbore lifting capacity were established. Subsequently, through nodal coordination analysis, systematic adaptability evaluations and parameter optimizations were conducted for foam drainage, rod pumping, and jet pumping under various water-gas ratios (WGR). Finally, a dynamic adjustment strategy for drainage operational regimes tailored for typical wells in high-water-cut tight gas reservoirs was proposed. The key conclusions are as follows:
- (1)The dynamic increase in the water-gas ratio (WGR) is the key factor driving the transition of drainage gas recovery processes from “chemical-assisted drainage” to “mechanical lift” in high-water-cut gas wells, characterized by a distinct quantitative threshold. Research demonstrates that under low WGR conditions, chemical-assisted methods can effectively utilize the inherent energy of the gas to achieve liquid unloading. Once the WGR exceeds a critical threshold, wellbore flow resistance increases significantly, necessitating a transition to mechanical methods. This quantitative switching threshold not only ensures hydraulic stability but also provides an economic basis for field operations; by delaying the premature deployment of high-energy-consumption mechanical lifting equipment, the operational expenditure over the gas well’s lifecycle can be significantly reduced.
- (2)The nozzle-to-throat area ratio R possesses a substantially higher regulation weight for lifting intensity than absolute size, serving as a core mechanism for mitigating high liquid-loading risks. Discussions on hydraulic jet pump applications identify the area ratio R as the “primary lever” for system performance optimization. While an increase in R may slightly limit the liquid production rate by reducing the suction flow area, it significantly bolsters the pump’s pressure ratio (head)—a critical factor in preventing “liquid-loaded dead wells” in deep or low-pressure reservoirs. Moreover, since coordinated production is highly sensitive to R but insensitive to the absolute nozzle area, this highlights that regulation under variable operating conditions should prioritize a synergistic approach of “adjusting the area ratio (structural parameter) + increasing the injection pressure (power parameter)” to effectively shift the coordination point.
- (3)Upon entering the mechanical lift phase, the optimization of drainage operational regimes should not merely focus on a single liquid production rate; instead, a strategy of “parameter inversion constrained by target flowing pressure” should be adopted. Research confirms that for the target bottomhole flowing pressure (Pwf) requirement of 5.4 MPa in the selected representative gas well, comparative analysis via a coupled model reveals that a configuration of “small bore size, long stroke length, and low pumping speed” is optimal. From an operational perspective, this configuration not only mitigates torque fluctuations and enhances pump fillage but also reduces alternating loads on the rod string. This reduction effectively extends the service life of the equipment and minimizes maintenance frequency, thereby ensuring a balance between lifting efficiency and operational stability. This approach ensures the effective release of reservoir energy while simultaneously extending the equipment’s operation cycle.
Acknowledgement:
Funding Statement: This work was supported by the Major Science and Technology Project of PetroChina Company Limited “Research on Key Technologies for Enhancing Recovery in Tight Sandstone Gas Reservoirs”, specifically under its third sub-project: “Research on Integrated Fracturing, Drainage, and Production Technology to Enhance Single-Well Production in Water-Bearing Gas Reservoirs” (Grant number: 2023ZZ25YJ03).
Author Contributions: The authors confirm contribution to the paper as follows: Conceptualization, Jiaming Cai and Xiongxiong Wang; methodology, Jiaming Cai; software, Jiaming Cai; validation, Jiaming Cai, Xianwen Wang and Zhengyan Zhao; formal analysis, Jiaming Cai; investigation, Xiongxiong Wang; resources, Youliang Jia; data curation, Zhengyan Zhao; writing—original draft preparation, Jiaming Cai; writing—review and editing, Xianwen Wang; visualization, Jiaming Cai; supervision, Youliang Jia; project administration, Xiongxiong Wang; funding acquisition, Youliang Jia. All authors reviewed and approved the final version of the manuscript.
Availability of Data and Materials: The data that support the findings of this study are available from the Corresponding Author, Jiaming Cai, upon reasonable request.
Ethics Approval: Not applicable.
Conflicts of Interest: The authors declare that they have no known competing financial interests or personal relationships that could have appeared to influence the work reported in this paper.
References
1. Zhang T , Zhang L , Wang Y , Qiao X , Feng D , Zhao W , et al. An integrated well-pattern optimization strategy to unlock continental tight gas reservoir in China. Energy. 2020; 209: 118449. doi:10.1016/j.energy.2020.118449. [Google Scholar] [CrossRef]
2. Luo K , Gao H , Wang X , Ma Z , Wang C , Li T , et al. Mechanism of water blocking damage in tight sandstone gas reservoirs: novel insights from differential spectrum analysis of 2D NMR data. Measurement. 2026; 258: 119360. doi:10.1016/j.measurement.2025.119360. [Google Scholar] [CrossRef]
3. Yang J , Xiang J , Li B , Zhang T , Wang Q , Zeng L . A new optimized method in wellbore to improve gas recovery in shale reservoirs. Front Energy Res. 2023; 11: 1336359. doi:10.3389/fenrg.2023.1336359. [Google Scholar] [CrossRef]
4. Fang L , Deng Q , Yang D . Integration of multi-domain das data analysis and machine learning for wellbore flow regimes identification in shale gas reservoirs. Energy. 2025; 332: 137123. doi:10.1016/j.energy.2025.137123. [Google Scholar] [CrossRef]
5. Hu B , Fu J , Yan W , Chen K , Ding J . Normalization of relative-permeability curves of cores in high-water-content tight sandstone gas reservoir. Energies. 2025; 18( 9): 2335. doi:10.3390/en18092335. [Google Scholar] [CrossRef]
6. Li Y , Fu J , Yan W , Chen K , Ding J , Wu J . Experimental study on the dynamic threshold pressure gradient of high water-bearing tight sandstone gas reservoir. Front Earth Sci. 2024; 12: 1487433. doi:10.3389/feart.2024.1487433. [Google Scholar] [CrossRef]
7. Meng D , He D , Guo Z , Wang G , Ji G , Tang H , et al. Dynamic analysis of high-water-cut tight sandstone gas reservoirs and study of water production splitting of gas wells: a case study on the western Sulige gas field, Ordos Basin, NW China. Processes. 2023; 11( 7): 2093. doi:10.3390/pr11072093. [Google Scholar] [CrossRef]
8. Hayati-Jafarbeigi S , Mosharaf-Dehkordi M , Ziaei-Rad M , Dejam M . A three-dimensional coupled well-reservoir flow model for determination of horizontal well characteristics. J Hydrol. 2020; 585: 124805. doi:10.1016/j.jhydrol.2020.124805. [Google Scholar] [CrossRef]
9. Peng L , Pagou AL , Tian L , Chai X , Han G , Yin D , et al. A fully coupled compositional wellbore/reservoir model for predicting liquid loading in vertical and inclined gas wells. Geoenergy Sci Eng. 2024; 239: 212874. doi:10.1016/j.geoen.2024.212874. [Google Scholar] [CrossRef]
10. Gao S , Zhang J , Liu H , Ye L , Zhu W , Xiong W . Water-gas ratio characteristics and development concepts for water-producing gas reservoirs. Heliyon. 2023; 9( 8): e19201. doi:10.1016/j.heliyon.2023.e19201. [Google Scholar] [CrossRef]
11. Al-Mudhafar WJ , Wood DA . Development and simulation of the gas-downhole water sink-assisted gravity drainage (GDWS-AGD) process to reduce carbon footprint and improve clean oil production by injecting CO2 and petroleum-associated gas. J Clean Prod. 2024; 464: 142792. doi:10.1016/j.jclepro.2024.142792. [Google Scholar] [CrossRef]
12. Zhang X , Tang L , Fan W , Zheng X , Zhang S , Shi W . Development and performance evaluation of a nanoparticle-enhanced foam drainage system for shale gas wells. Langmuir. 2025; 41( 8): 5112– 23. doi:10.1021/acs.langmuir.4c04254. [Google Scholar] [CrossRef]
13. Chen M , Sun J , Gao E , Tian H . A summary of wellbore fluid accumulation and drainage gas production technology in gas wells. IOP Conf Ser Earth Environ Sci. 2021; 621( 1): 012113. doi:10.1088/1755-1315/621/1/012113. [Google Scholar] [CrossRef]
14. Bai X , Feng R , Zhang Z , Xu J , Wang J , Bai Y , et al. Study on gas production mechanism of foam drainage and optimization of technological parameters. Chem Technol Fuels Oils. 2025; 60( 6): 1594– 603. doi:10.1007/s10553-025-01822-1. [Google Scholar] [CrossRef]
15. Hosseini-Nasab SM , Rezaee M , Zitha PLJ . Foam drainage modeling of vertical foam column and validation with experimental results. Pet Res. 2024; 9( 4): 586– 98. doi:10.1016/j.ptlrs.2024.05.001. [Google Scholar] [CrossRef]
16. Surendra M , Deng L , Kansao R , Davani E , Darabi H , Castineira D . Automated gas lift system optimization through combined data analytics and wellbore modeling approach: a case study in an offshore middle east oilfield. In: Proceedings of the SPE Annual Technical Conference and Exhibition; 2020 Oct 26–29; Online. doi:10.2118/201298-ms. [Google Scholar] [CrossRef]
17. Hashmi GM , Hasan AR , Kabir CS . Design of plunger lift for gas wells. In: Proceedings of the SPE North America Artificial Lift Conference and Exhibition; 2016 Oct 25–27; The Woodlands, TX, USA. p. 181220. doi:10.2118/181220-ms. [Google Scholar] [CrossRef]
18. Mazzanti D , Dixon D . Artificial lift system for horizontal wells and other wells with problematic lift conditions. In: Proceedings of the SPE North America Artificial Lift Conference and Exhibition; 2016 Oct 25–27; The Woodlands, TX, USA. p. 181230. doi:10.2118/181230-ms. [Google Scholar] [CrossRef]
19. Parshall J . Challenges, opportunities abound for artificial lift. J Petrol Technol. 2013; 65( 3): 70– 5. doi:10.2118/0313-0070-jpt. [Google Scholar] [CrossRef]
20. Cheng Y , Luo X , Chen P , Guo C , Wang F , Tan C . Production allocation optimization of gas reservoirs with edge and bottom aquifer based on a parallel-structured genetic algorithm. ACS Omega. 2024; 9( 25): 27329– 37. doi:10.1021/acsomega.4c01877. [Google Scholar] [CrossRef]
21. Izadi H , Holding T , Ewanchuk C , Hannas D , Smith R , Rampurawala M , et al. Real-time and cloud-based well monitoring, part 2: inflow profiling using distributed acoustic sensing (DAS). In: Proceedings of the SPE Thermal Well Integrity and Production Symposium; 2025 Dec 1–4; Banff, AB, Canada. p. 230273. doi:10.2118/230273-ms. [Google Scholar] [CrossRef]
22. Xing ZS , Han GQ , Jia YL , Tian W , Gong HF , Jiang WB , et al. Optimization of plunger lift working systems using reinforcement learning for coupled wellbore/reservoir. Pet Sci. 2025; 22( 5): 2154– 68. doi:10.1016/j.petsci.2025.03.009. [Google Scholar] [CrossRef]
23. Ma X , Hou M , Zhan J , Liu Z . Interpretable predictive modeling of tight gas well productivity with SHAP and LIME techniques. Energies. 2023; 16( 9): 3653. doi:10.3390/en16093653. [Google Scholar] [CrossRef]
24. Tavagh Mohammadi B , Jahanbani Ghahfarokhi A , Grimstad AA . A review of modeling approaches for CO2 injection into depleted gas reservoirs: coupling transient wellbore and reservoir dynamics. Int J Greenh Gas Control. 2025; 145: 104406. doi:10.1016/j.ijggc.2025.104406. [Google Scholar] [CrossRef]
25. Weijermars R . Fast production and water-breakthrough analysis methods demonstrated using Volve Field data. Pet Res. 2024; 9( 3): 327– 46. doi:10.1016/j.ptlrs.2024.03.001. [Google Scholar] [CrossRef]
26. Zeng L , Cai D , Zhao Y , Ye C , Luo C . Analysis of wellbore flow in shale gas horizontal wells. Fluid Dyn Mater Process. 2023; 19( 11): 2813– 25. doi:10.32604/fdmp.2023.026190. [Google Scholar] [CrossRef]
27. Zhang B , Jiang R , Sun B , Lu N , Hou J , Bai Y , et al. Establishment of the productivity prediction method of Class III gas hydrate developed by depressurization and horizontal well based on production performance and inflow relationship. Fuel. 2022; 308: 122006. doi:10.1016/j.fuel.2021.122006. [Google Scholar] [CrossRef]
28. Pratama HB , Koike K , Pratama AB , Kusumasari BA , Ashat A , Sutopo , et al. Numerical simulation–based optimization of an integrated framework for the efficient development and sustainable utilization of geothermal resources: application to the Bedugul geothermal field. Geothermics. 2025; 127: 103208. doi:10.1016/j.geothermics.2024.103208. [Google Scholar] [CrossRef]
29. Guo B . Chapter 4—wellbore performance. In: Well productivity handbook. 2nd ed. Cambridge, MA, USA: Gulf Professional Publishing; 2019. p. 93– 122. doi:10.1016/B978-0-12-818264-2.00004-X. [Google Scholar] [CrossRef]
30. Neog D . Sensitivity analysis for enhancing crude oil recovery with continuous flow gas lift: a study in reference to the porous media of the upper Assam basin, India. Heliyon. 2023; 9( 7): e17466. doi:10.1016/j.heliyon.2023.e17466. [Google Scholar] [CrossRef]
31. Farouk S , Sen S , Ghosh S , Mandal PP . In-situ stress state of the Shushan Basin, western desert, Egypt: implications for developing tight Cretaceous and Paleozoic Reservoirs. Arab J Sci Eng. 2025: 1– 22. doi:10.1007/s13369-025-10766-x. [Google Scholar] [CrossRef]
32. Farouk S , Sarhan MA , Sen S , Ahmad F , Al-Kahtany K , Reda MM . Evaluation of the Lower Cretaceous Alam El Bueib Sandstone reservoirs in Shushan Basin, Egypt–Implications for tight hydrocarbon reservoir potential. J Afr Earth Sci. 2024; 218: 105386. doi:10.1016/j.jafrearsci.2024.105386. [Google Scholar] [CrossRef]
33. Amani P , Firouzi M . Uninterrupted lift of gas, water, and fines in unconventional gas wells using foam-assisted artificial lift. Gas Sci Eng. 2023; 114: 204977. doi:10.1016/j.jgsce.2023.204977. [Google Scholar] [CrossRef]
34. Liu S , Wang G , Liu P , Ye D , Song J , Liu X , et al. Optimal concentration of the bubble drainage agent in foam drainage gas recovery applications. Fluid Dyn Mater Process. 2023; 19( 12): 3045– 58. doi:10.32604/fdmp.2023.029810. [Google Scholar] [CrossRef]
Cite This Article
 Copyright © 2026 The Author(s). Published by Tech Science Press.
This work is licensed under a Creative Commons Attribution 4.0 International License , which permits unrestricted use, distribution, and reproduction in any medium, provided the original work is properly cited.
 Downloads
 Citation Tools