
 Submit a Paper
 Propose a Special lssue
 Open Access
ARTICLE

Numerical and Experimental Investigation of Filament-End Dynamics in Negative-Pressure Pneumatic Transport
School of Mechanical Engineering and Automation, Zhejiang Sci-Tech University, 928 No. 2 Street, Qiantang District, Hangzhou, China
* Corresponding Author: Yisheng Liu. Email:
(This article belongs to the Special Issue: Model-Based Approaches in Fluid Mechanics: From Theory to industrial Applications)
Fluid Dynamics & Materials Processing 2026, 22(3), 12 https://doi.org/10.32604/fdmp.2026.077267
Received 05 December 2025; Accepted 12 March 2026; Issue published 31 March 2026
 View Full Text
 Download PDF
Abstract
This study addresses the optimization of automated yarn handling in textile manufacturing by examining the related suction process through a combined numerical and experimental approach. In particular, a three-dimensional model of the suction nozzle was coupled with an equivalent linear-elastic beam representation of the yarn, and a Fluent–IDW–Abaqus weakly coupled fluid–structure interaction (FSI) framework was employed to capture the yarn’s release and dynamic response under negative-pressure suction. High-speed imaging experiments validated the simulations, demonstrating excellent agreement in displacements and velocities. According to the results, increasing the initial suction pressure from −0.04 MPa to −0.06 MPa reduces adsorption time by approximately 62% and markedly dampens yarn-end vibrations, enhancing suction performance. Pressures beyond −0.06 MPa, however, induce overshoot and nozzle collisions, increasing the risk of entanglement and mechanical damage. The outcomes of a statistical analysis are also presented to further quantify the interplay among energy consumption, suction efficiency, and operational success under varying pressures, thereby providing a rigorous foundation for the optimal selection of pressure parameters in automated yarn-handling systems.Keywords
Yarn packages are essential to supply yarn to modern weaving machines, such as circular knitting machines and warping looms [1,2]. It is still challenging to find the yarn end in a yarn package efficiently because operators still locate the yarn end mostly by hand. This results in high labor costs and low productivity. Some negative-pressure suction flow devices have been developed to automatically find the yarn end; however, their performance is highly sensitive to empirically set parameters. The process is therefore unstable and energy consuming.
In textile engineering, controlling the motion of yarns and fibers—flexible filamentary materials driven by air jets of different kinds—has been one of the most challenging problems in the development of textile machinery. It is therefore essential to establish mathematical models of air–fiber interactions and to analyze the impact of processing parameters on yarn/fiber motion during textile operations. Air jets in textile equipment exhibit diverse and complex forms, mainly including: co-directional relay flight (air-jet weft insertion) [3,4,5], three-dimensional rotational winding (vortex spinning devices) [6,7,8,9], counter-directional multi-jet reciprocating flight (tuck-in devices) [10,11,12], and negative-pressure suction flight (yarn-end catching devices). While the first three types have been extensively studied, the mechanical behavior of yarn-end detachment and suction induced by negative-pressure jets in confined spaces remains rarely explored. This, however, constitutes the missing theoretical foundation for the design of rapid and efficient automated yarn-end capturing systems.
Currently, fluid–structure interaction (FSI) algorithms are widely applied to study yarn motion under airflow–yarn coupling. Geoffre et al. [13] employed finite element simulations on the basis of Stokes and Stokes–Darcy flows, stabilized by the ASGS method in Z-set, to establish an empirical relation linking effective and internal yarn permeability, extendable to realistic 3D structures. This study draws on their fluid–porous medium modeling approach to improve the description of flow in the yarn adsorption zone of negative-pressure jets. Tian [14] and others [15,16,17,18] enhanced the immersed boundary–lattice Boltzmann method (IB–LBM) for fiber–fluid coupling, improving accuracy in capturing the interaction between flexible filaments and viscous flow. Inspired by these works, a weakly coupled Fluent–Abaqus FSI framework is adopted here to balance accuracy and computational cost. Notably, for highly flexible and elastic yarns, deformation can be significant, making FSI simulations computationally expensive and prone to mesh distortion or solver divergence [19]. To overcome this, a weakly coupled numerical strategy is proposed, enabling gas–solid information transfer via inverse distance weighting (IDW) interpolation, which ensures stability and greatly reduces computational cost, effectively bridging the methodological gap in simulating the negative-pressure adsorption field of highly flexible yarns.
In yarn modeling, Yamamoto at Toyota R&D Center [20] replaced flexible fibers with rigid spheres to approximate low-Reynolds-number flow, which limited applicability. On this basis, in this paper, fiber deformability is further introduced to represent the complicated dynamic behavior of yarns in negative-pressure jet flow. Guo et al. [21,22] then developed a rigid-sphere–rod model, where external and gravitational forces were applied to the spheres and the rods were only connectors from which the dynamic equations were derived. Although the overall motion of yarn can be described by this model, the internal stress distribution is not considered. To model this behavior more accurately, this work further introduces beam-element discretization, where the internal stress distribution can be described by the deformation of each element. Li [23] employed two-node beam elements to describe braided yarn paths via a single geometric parameter, but the model struggled with nonlinear curved geometries. Here, the beam-element concept is extended by introducing a viscoelastic material model, enhancing the realism of yarn deformation and recovery. Zheng [24] reconstructed unit cells via μCT scanning and developed full-scale finite element yarn models in LS-PrePost for spherical indentation simulations. Li and Wang [25] proposed a 3D orthogonal braided composite model, constructing a half-yarn plate with symmetric boundaries, while Deng et al. [26] introduced a parametric yarn-level modeling approach using Rhino & Grasshopper to account for cross-sectional shape, hairiness, and packing. Kargar and Payvandy [27] further treated yarns as strings in a discrete elastic rod framework, providing the theoretical basis for constructing a deformable yarn model based on elastic beams in this research.
In recent years, research on negative-pressure (vacuum) suction nozzles and industrial yarn-suction devices has grown substantially. Xu et al. [28] employed an immersed boundary–lattice Boltzmann method to numerically simulate the yarn-end capturing process, revealing that nozzle geometry and inflow conditions have a pronounced influence on capture stability, thereby providing a direct computational reference for such fluid–structure interaction problems. Kong et al. [29] conducted a systematic study on the design and experimental evaluation of negative-pressure suction grippers, offering valuable experimental data for equipment parameter selection and energy-consumption assessment. Prezelj [30] proposed a high-efficiency vacuum system design and investigated optimization strategies for air consumption in industrial collection processes.
Given that extensive studies have been carried out on the aerodynamically driven transport of yarns, most existing works appear to examine yarn entrainment and conveying under positive-pressure air jets and are typically conducted in relatively open flow fields. However, the process considered in the present study may correspond to a fundamentally different physical problem, namely the capture and entrainment of a free yarn end by a negative-pressure suction flow inside a confined nozzle. In this process, the flow field might be strongly constrained by the nozzle geometry, while the yarn initially remains in a slack state, giving rise to pronounced unsteady fluid–structure interaction. Meanwhile, aerodynamic forces and wall confinement effects are coupled within a very short time scale. Thus, the capture mechanisms may differ markedly from steady jet-driven yarn transport processes. Notwithstanding the significant body of existing research, a quantitative modeling approach specifically targeting the transient capture of a free yarn end under confined negative-pressure suction conditions and validated by experiments could still be lacking, thereby to some extent limiting the rational design and optimization of suction nozzles and related process parameters. Therefore, this study adopts a Fluent–IDW–Abaqus weakly coupled simulation framework combined with high-speed imaging experiments to systematically analyze the effects of different initial negative pressures on yarn-end dynamic behavior, aiming to establish a direct link between the engineering applicability of the numerical method and process-parameter optimization, and to provide quantitative guidance for the design of automated yarn-capturing systems.
2 Numerical Simulation of Yarn and Flow Field
The adsorption of yarn ends from cylindrical packages via vacuum nozzles constitutes a canonical FSI problem. In this study, a Java program was developed to extract fluid data at yarn beam element nodes using the inverse distance weighting (IDW) interpolation algorithm in Tecplot. The data were converted into aerodynamic forces via a Buckingham theorem-based formulation, and the explicit dynamics algorithm in Abaqus was employed to iteratively compute yarn displacement and deformation in real time.
2.1 Flow Field in a Vacuum Nozzle
Fig. 1 illustrates the optimized three-dimensional geometric model of the negative-pressure yarn-end detection and adsorption system, which integrates four functionally coordinated components: a yarn package spindle assembly for stable mounting, a vacuum cantilever for securing the suction nozzle, a three-axis positioner for precise nozzle adjustment, and a negative-pressure suction nozzle serving as the terminal actuator. The system operates through a precisely controlled sequence, wherein the vacuum pump generates a regulated negative-pressure jet flow that is directed through the suction nozzle to interact with the yarn package surface. At the same time, a rotary drive mechanism drives the nozzle to rotate around the yarn package. By synchronizing the rotation of the nozzle with the pressure, the system finds the yarn end stably and reliably.
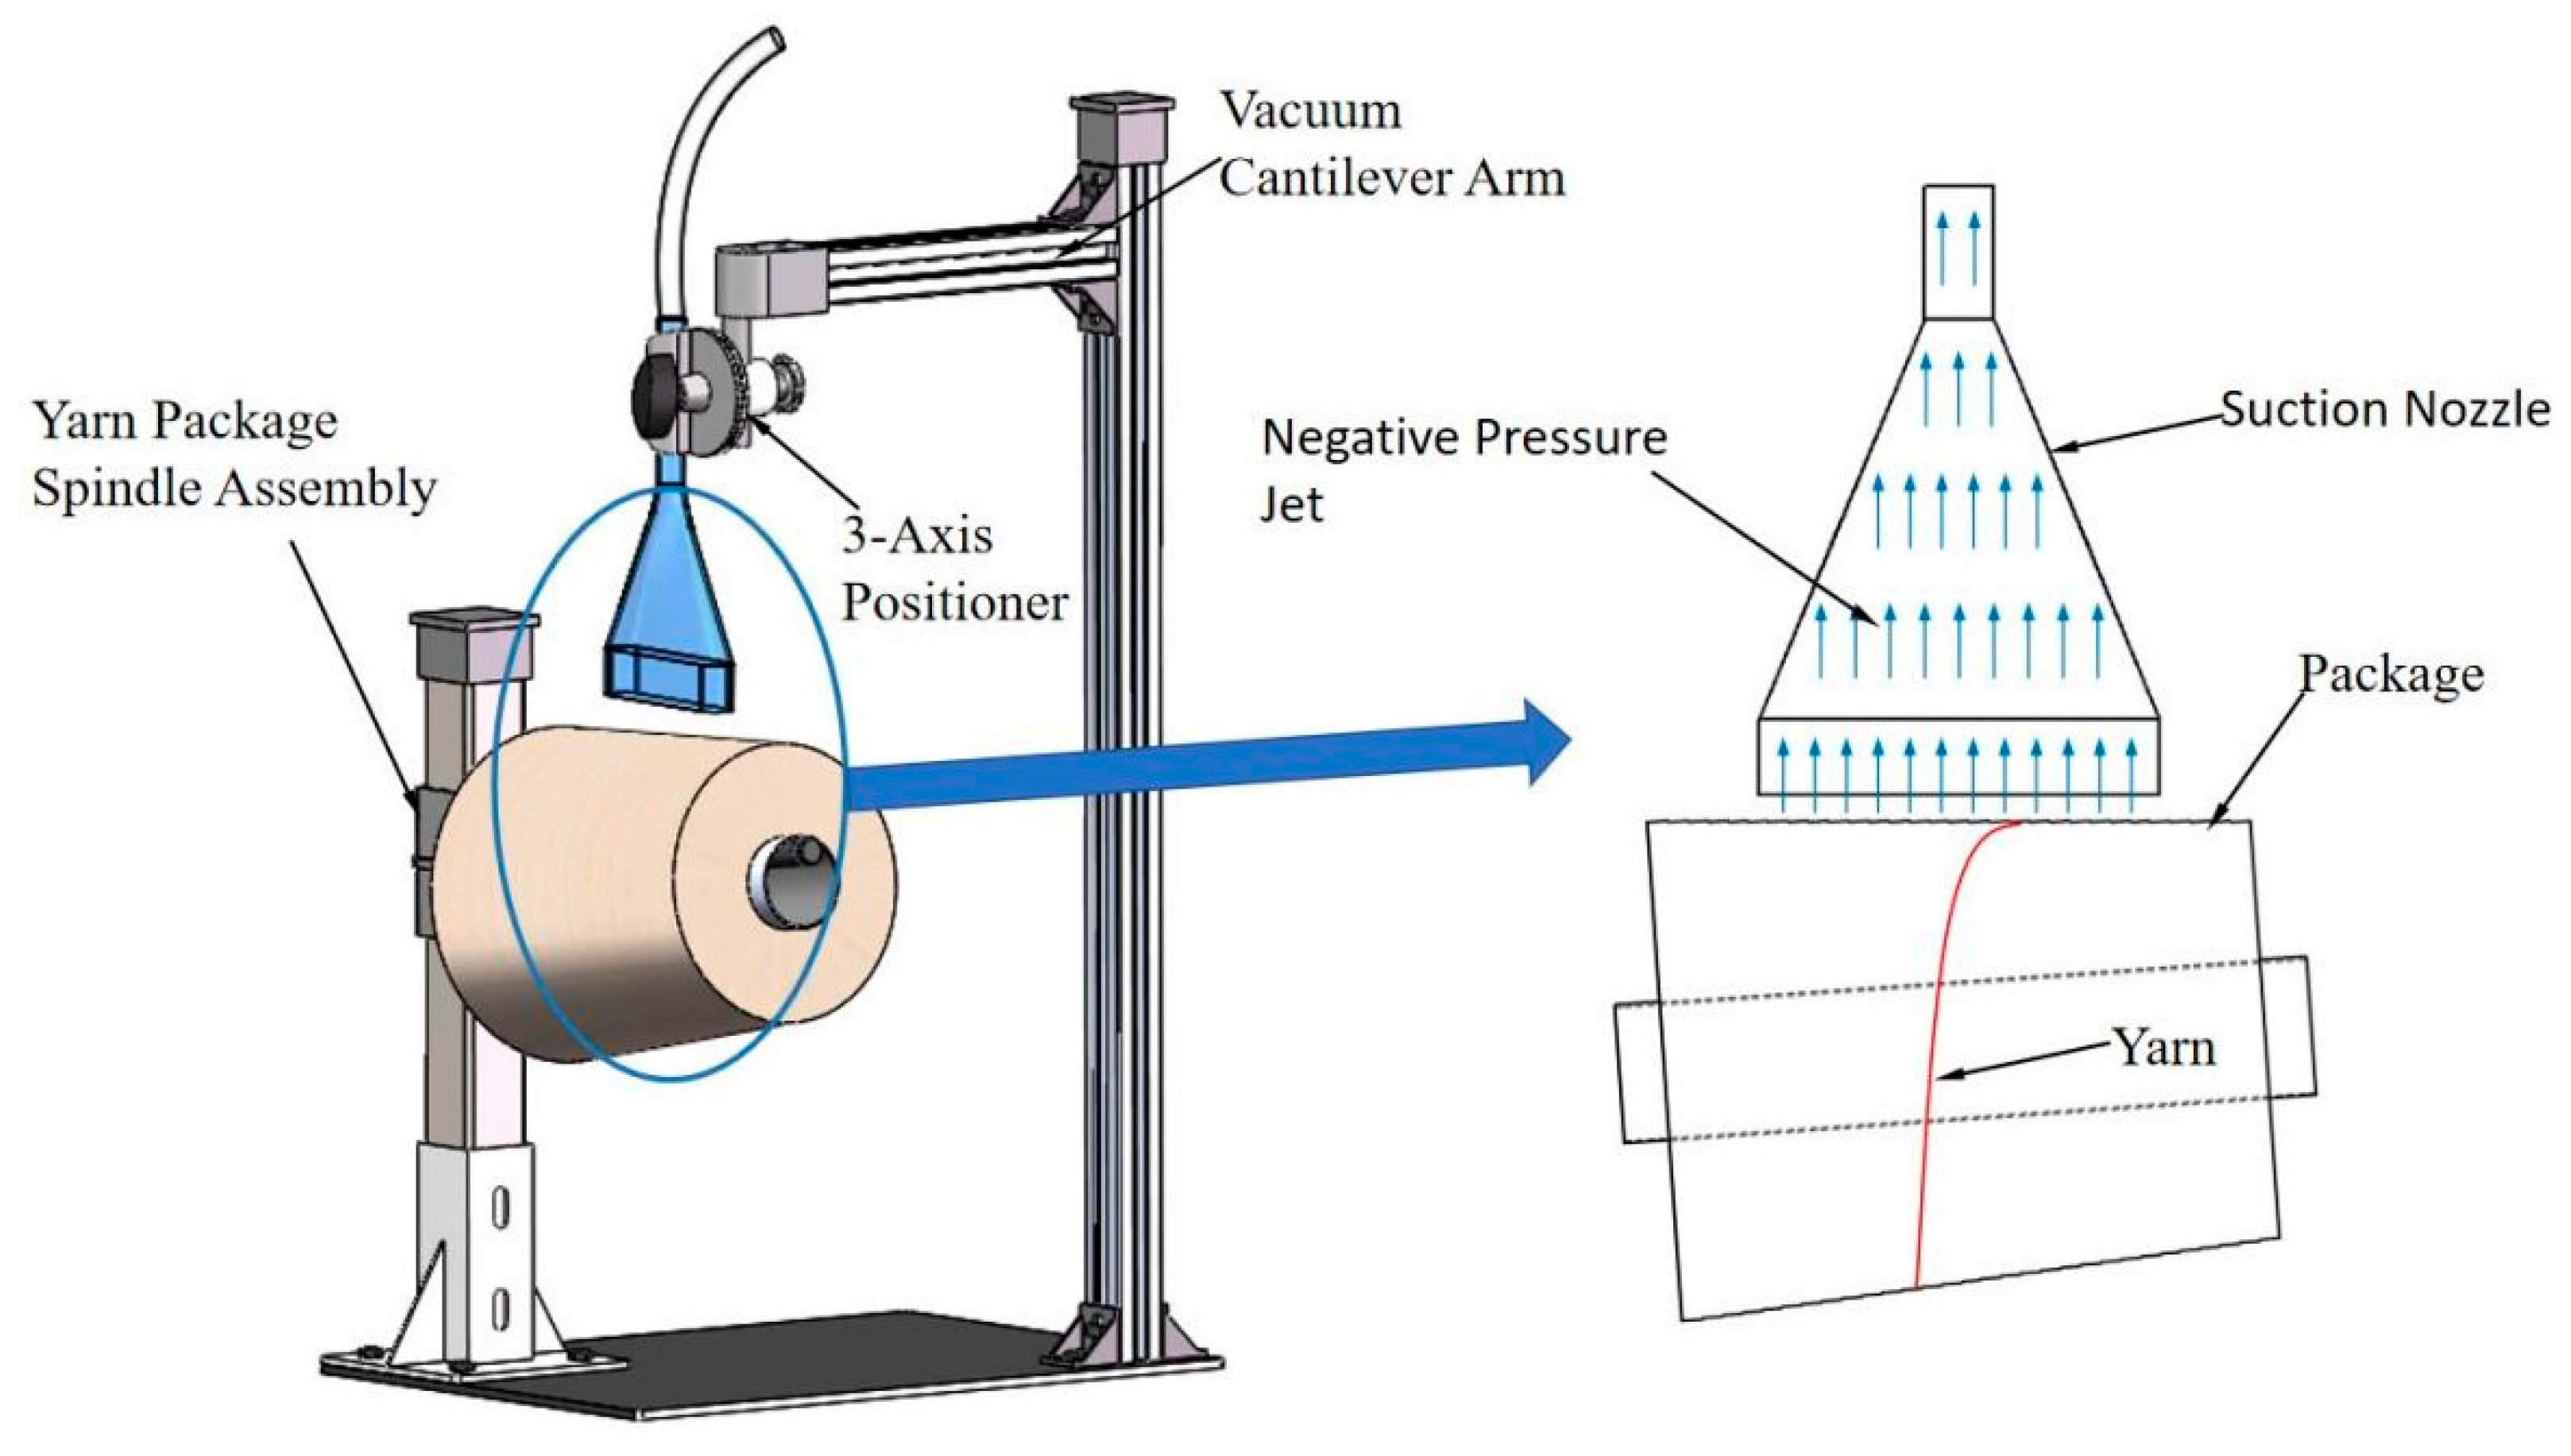
Figure 1: Negative-pressure yarn-end adsorption system and working principle.
Based on the experimental setup, a geometric model of the suction nozzle was established. The experimental yarn-end motion was then reproduced by the model with higher accuracy. The requirements of the previous process design and the common configuration of textile suction nozzles reported in the literature were integrated to determine the key structural parameters of the nozzle. The total length of the nozzle was l = 140 mm. As illustrated in Fig. 1, the nozzle consisted of three parts: the throat, the divergent conical section, and the outlet segment. The length of the throat was ln = 12 mm, and its outer diameter was d = 12 mm, where the negative-pressure pipeline was connected. The length of the conical section was about ls = 90 mm, and the divergence angle was
To define the boundary conditions of the negative-pressure jet model more accurately, a computational fluid domain with dimensions of 100 mm, 30 mm, and 40 mm in the X, Y, and Z directions, respectively, was constructed based on the simplified suction-nozzle geometry. The air inlet at the end of the nozzle was specified as the inlet boundary, while the bottom opening of the nozzle together with the outer surfaces of the computational domain were set as outlet boundaries. All remaining surfaces of the nozzle were treated as wall boundaries. An unstructured tetrahedral mesh was employed to discretize the flow field.
2.2 CFD Solution Mode and Control Equation
The airflow within the negative-pressure suction nozzle and over the yarn package must satisfy the fundamental governing equations of fluid mechanics, namely the continuity, momentum, energy, and state equations [31]. The nozzle inlet diameter at the top is 12 mm, where the negative-pressure jet velocity can reach up to 240 m/s. Under the present operating conditions, the airflow inside the nozzle is regarded as a three-dimensional, viscous, compressible (density-varying) turbulent flow. Considering both accuracy and computational cost, the present study adopts the RANS approach [32].
According to the law of conservation of mass, the expression of the vector form of the fluid continuous equation is:
In this equation,
The momentum equation per unit mass for a fluid can be derived from conservation laws and expressed in vector form as:
To incorporate the turbulence-enhanced momentum diffusion in the RANS framework, an effective viscosity is introduced as
The energy equation is derived by applying the first law of thermodynamics to a fluid control volume:
In the formula, the term
As illustrated in Fig. 2, the nozzle has a narrow inlet followed by a conical diverging section, where the airflow accelerates sharply near the entrance and then decelerates downstream. To capture this high-strain-rate turbulent flow, the RNG k-ε model [33] is employed. In the RANS framework, turbulence closure is obtained by solving the transport equations for
In the RNG formulation, an additional correction term
Since the above governing equations involve thermodynamic variables, an equation of state is required to close the system. In this study, air is treated as an ideal gas, and the density is related to pressure and temperature by
To evaluate the influence of grid resolution on the numerical predictions, a mesh sensitivity analysis was further conducted. Three meshes were generated for the same computational domain, namely Mesh A (coarse), Mesh B (medium), and Mesh C (fine), comprising approximately 1.00 × 10⁶, 2.76 × 10⁶, and 4.07 × 10⁶ cells, respectively. Under identical boundary conditions and turbulence-model settings, simulations were performed for two representative operating conditions. The plane-averaged velocity and plane-averaged total pressure were then evaluated on three characteristic cross-sections located at Y = 20, 60, and 120 mm. The quantitative results are summarized in Table 1.
Table 1: Mesh sensitivity analysis.
| Plane data | Mesh A | Mesh B | Mesh C | Max Error (%) |
|---|---|---|---|---|
| Mean velocity at Y = 20 mm (m/s) | 228.4 | 232.1 | 233.2 | 2.06% |
| Mean total pressure at Y = 20 mm (Pa) | 38,200 | 39,500 | 40,120 | 4.79% |
| Mean velocity at Y = 60 mm (m/s) | 122.6 | 124.7 | 126.1 | 2.77% |
| Mean total pressure at Y = 60 mm (Pa) | 10,200 | 10,520 | 10,710 | 4.76% |
| Mean velocity at Y = 120 mm (m/s) | 34.5 | 35.6 | 36.0 | 4.17% |
| Mean total pressure at Y = 120 mm (Pa) | 2680 | 2750 | 2810 | 4.63% |
The differences among the three meshes are limited: the maximum relative deviation is 4.17% for the mean velocity and 4.79% for the mean total pressure, both below 5%. Accordingly, the airflow predictions can be regarded as nearly mesh-independent for the present purpose, and the medium mesh was adopted for subsequent simulations to balance accuracy and computational cost.
Given that cotton yarn is the most widely used material in the textile industry due to its excellent spinnability, flexibility, and aerodynamic properties. A 55 tex pure cotton yarn was selected as the research subject in this study. A 50 m sample was prepared, and its mass was measured using an analytical balance. The equivalent diameter of the yarn cross section was determined through scanning electron microscopy (SEM), from which the yarn density was calculated. The stress–strain curve of the yarn was obtained using an Instron 3345 universal testing machine, and the Young’s modulus was derived by linear fitting. The corresponding physical parameters are summarized in Table 2. Based on the data listed in Table 2, a solid model of the yarn was subsequently constructed.
Table 2: Material parameters of yarn solid model.
| Yarn Type | Density (kg/m3) | Diameter (mm) | Young’s Modulus (MPa) | Poisson’s Ratio |
|---|---|---|---|---|
| cotton yarn | 485 | 0.38 | 80 | 0.3 |
In the present simulations, the yarn length was set to L = 10 mm. Based on the yarn density and diameter, the corresponding weight is estimated to be G ≈ 0.0054 mN. By contrast, the subsequent results show that the aerodynamic force acting on the yarn during the capturing stage is typically on the order of 3–9 mN (with a maximum of about 9.149 mN), yielding Fa/G~102–103. Moreover, the main action direction of the negative-pressure jet is approximately perpendicular to gravity, which further weakens the influence of gravity on the suction-driven axial motion and the early-stage capturing dynamics. These order-of-magnitude considerations support neglecting gravity for the present capturing process in which aerodynamic effects are dominant. In addition, yarn twist and surface roughness (hairiness) mainly affect secondary details through their influence on local drag characteristics and yarn–wall contact friction. For the present problem, where the transient capture of the free yarn end is governed primarily by suction intensity and flow-field structure, these effects can be regarded as of second order. Considering the difficulty of highly realistic modeling and the associated computational cost, gravity as well as yarn twist and surface roughness were neglected in the CFD simulations to reduce the overall complexity.
It should be noted that the above simplifications appear appropriate for the high-speed, aerodynamically dominated capture stage examined in this work. However, the findings could indicate that under low-velocity conditions or during prolonged near-wall motion, gravity might affect the sagging configuration and contact posture of the yarn. Moreover, neglecting twist means that its influence on the effective bending stiffness and lateral aerodynamic response is not represented. Ignoring surface roughness (hairiness) may lead to an underestimation of frictional resistance and adhesion tendency at the yarn–wall interface. Nevertheless, the present model is intended to describe the overall transient capture behavior of a free yarn end under negative-pressure suction rather than to resolve detailed microscopic contact processes. Thus, within the scope and objectives of this study, these assumptions are considered acceptable.
Because the yarn is thin and long, it possesses high flexibility while retaining a certain degree of stiffness. This implies that three-dimensional modeling of the yarn must simultaneously account for its displacement and deformation, as well as the axial forces, bending moments, and torques exerted on it within the jet flow field [34]. It has been found that yarn models constructed using conventional truss or bar elements are highly prone to numerical instabilities during simulation, which often result in non-physical distortions, entanglements, or self-intersections of the yarn structure, making it difficult to accurately capture the real mechanical behavior of yarns. To overcome this issue, the present study employs a three-dimensional yarn model based on beam elements, which effectively eliminates the aforementioned twisting problem and exhibits good numerical stability. Ultimately, the yarn solid model was developed using a digital chain discretization approach, which involves continuous elastic spatial beam elements, as illustrated in Fig. 2.
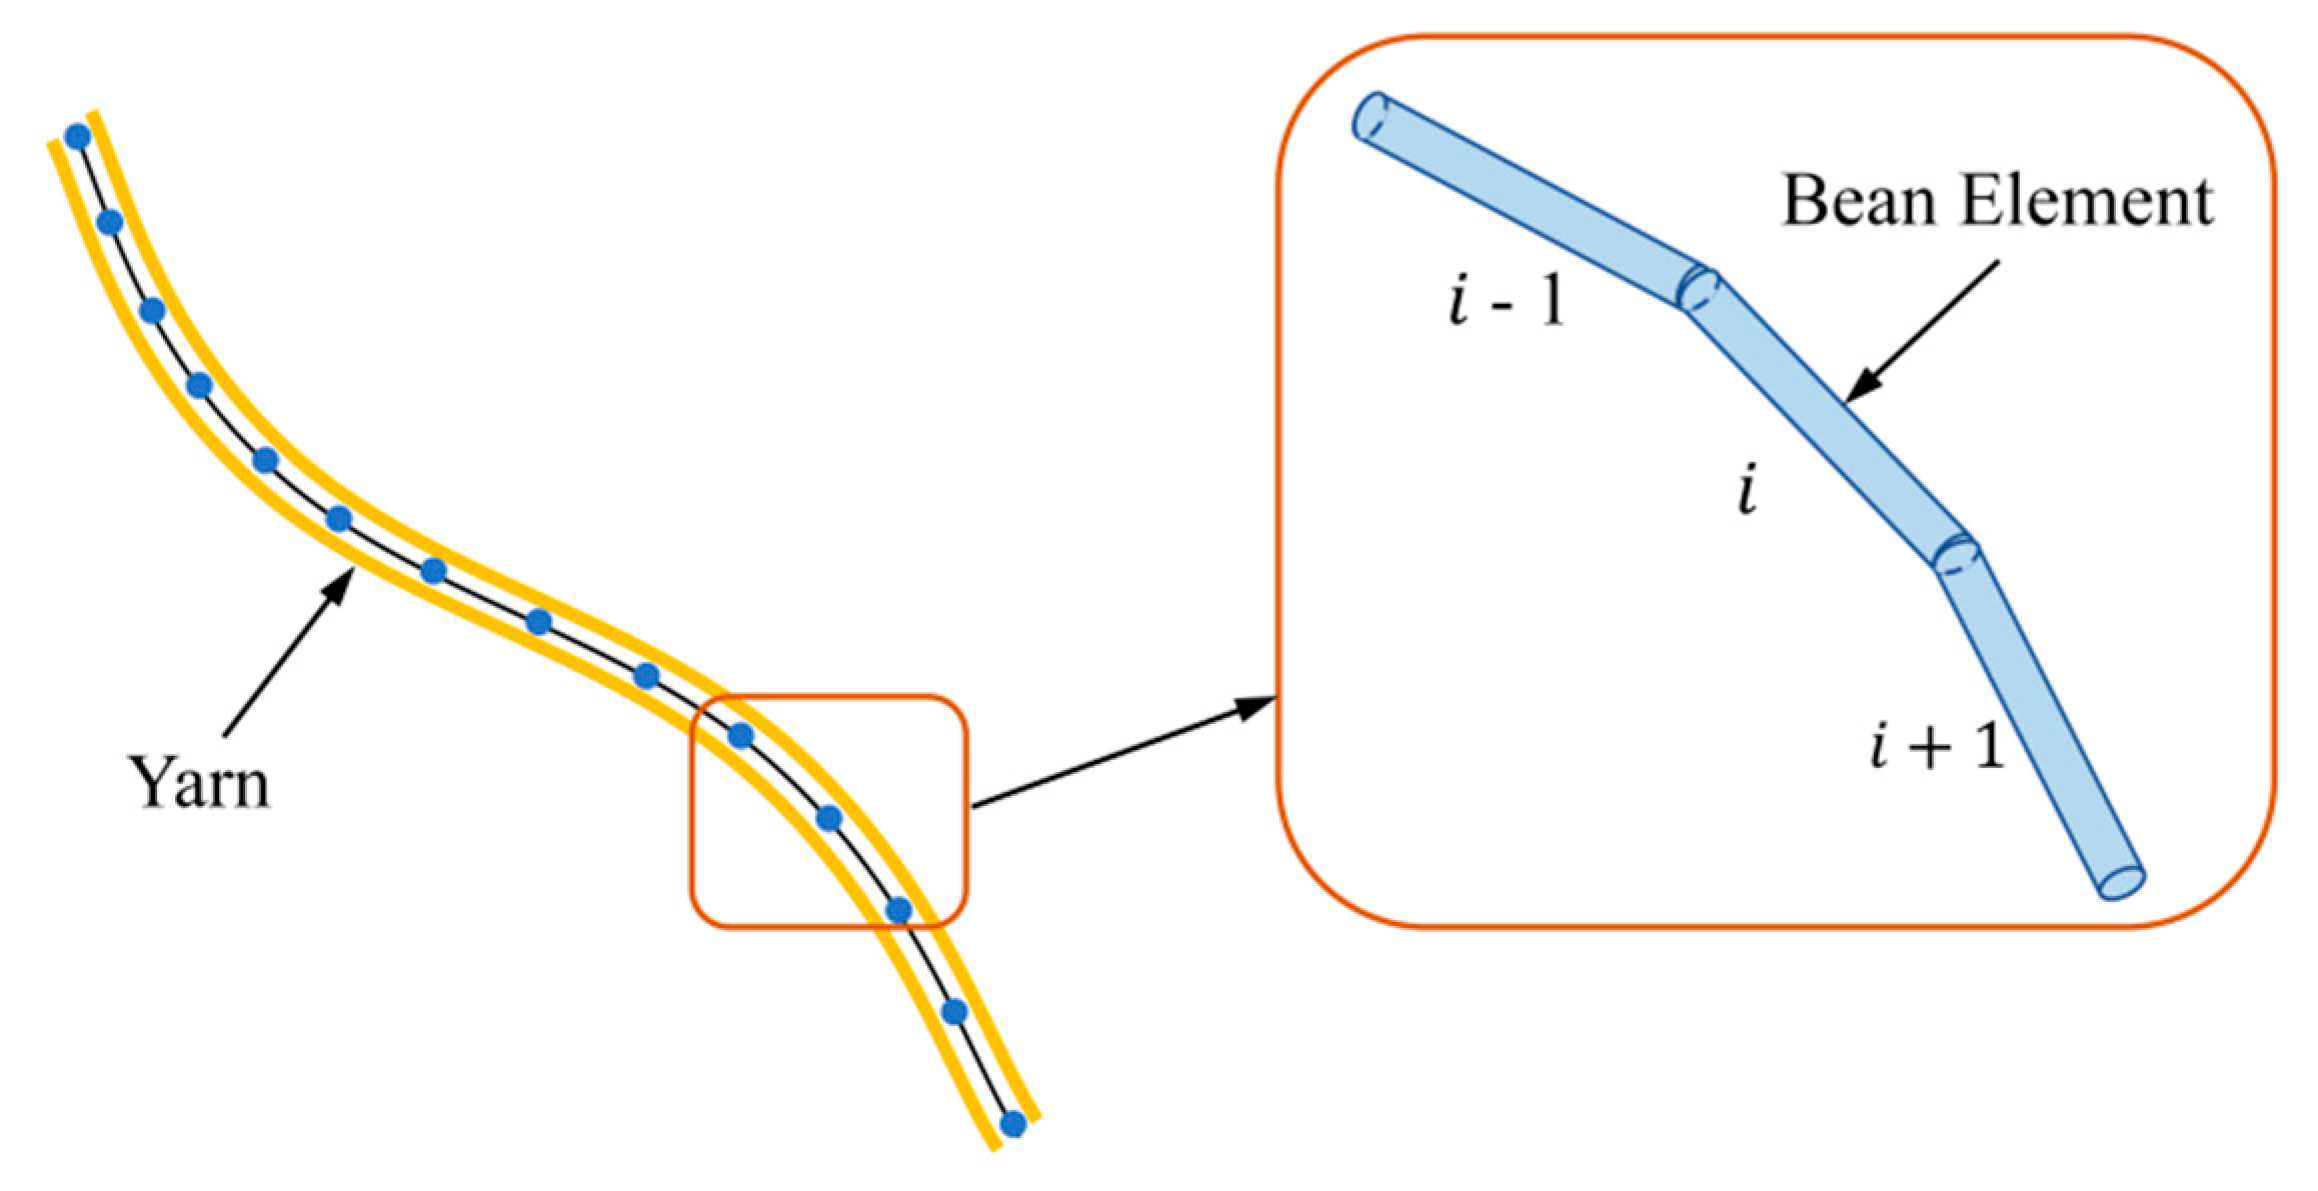
Figure 2: D yarn model based on beam elements.
In the present Abaqus implementation, the yarn is represented by an equivalent linear-elastic constitutive model for the beam elements. Moreover, the material parameters may be identified from the linear portion of the measured tensile stress-strain response, giving E = 80 MPa, ν = 0.307, and ρ = 485 kg/m3 (Table 2). A time-dependent viscoelastic description (e.g., Prony-series relaxation/creep or rate-dependent effects) is not included. Given that yarn-end capture occurs on a millisecond time scale and is primarily governed by aerodynamic loading, viscoelasticity is expected to have a limited first-order influence on the overall transient trajectory and adsorption time; therefore, the equivalent elastic approximation is adopted to enhance reproducibility while keeping the computational cost tractable.
In addition, a discretization sensitivity check was performed for the beam-element yarn model by varying the number of beam elements. The predicted yarn trajectory and capture-related metrics showed no noticeable change, indicating that the adopted discretization (500 beam elements) is sufficiently fine for the present simulations.
2.4 Fluid-Structure Interaction Algorithm
In this study, the suction level was varied from −0.04 to −0.07 MPa. The yarn used in the experiments was a 55 tex cotton yarn, which was represented by beam elements (Table 2). Within this range, the yarn diameter is much smaller than the characteristic size of the negative-pressure suction nozzle, and the volume fraction in the flow domain is negligible. Therefore, the feedback of yarn deformation on the main flow structure inside the nozzle is expected to be limited. Moreover, the dominant features of the internal jet are governed by the nozzle geometry and the prescribed negative-pressure boundary condition. Based on these scale considerations and the dominant physical mechanisms, a weakly coupled FSI strategy [35] was adopted to solve the airflow loading and the yarn response, achieving efficient and flexible computation while maintaining adequate accuracy. In the present work, this weakly coupled strategy is implemented as a one-way coupling approach: a steady RANS airflow field is solved first and then used to drive the yarn motion, while the influence of yarn deformation on the airflow field is neglected. However, when the suction level is increased substantially, when a more compliant yarn may lead to pronounced lateral oscillations, or when persistent wall contact causes noticeable modification of the local flow, the fluid–structure feedback may become stronger. In such cases, a fully coupled (two-way) FSI treatment may be required to further improve predictive accuracy.
The negative-pressure jet inside the suction nozzle was computed in ANSYS Fluent using the pressure-based steady solver. Because a steady flow formulation is adopted, the SIMPLE algorithm (rather than PISO) was used for pressure–velocity coupling. Spatial discretization employed least-squares cell-based gradient evaluation; the pressure term was discretized using the second-order scheme, and the momentum as well as the RNG k and ε transport equations were discretized using the second-order upwind scheme (second-order accuracy). Convergence was assessed by monitoring scaled residuals and integral quantities (e.g., mass flow rate and pressure level) until stable values were reached. These numerical settings are consistent with Fluent-based CFD practice reported in FDMP studies employing the pressure-based steady solver with SIMPLE coupling and second-order discretization schemes [36,37].
The negative-pressure jet inside the suction nozzle is solved using the Fluent fluid solver, while the yarn end is modeled as a digital chain under the elastic beam framework, which requires the Abaqus solver to compute the spatial motion and configuration of the yarn. To enable data exchange between the two solvers, a Java program is developed to invoke the inverse distance weighting (IDW) interpolation algorithm embedded in Tecplot, thereby extracting the fluid data at the beam-element nodes of the yarn. Subsequently, the extracted fluid data are transformed into the corresponding aerodynamic forces at the yarn nodes using the aerodynamic force formula derived from the Buckingham π theorem. Finally, the yarn’s displacement and deformation are acquired in Abaqus by employing an explicit dynamic algorithm and updating the results during the calculation.
For the numerical implementation, the three-dimensional yarn model was discretized into a digital chain composed of elastic beam elements. However, this discretization also leads to a spatial mismatch between the yarn and the negative-pressure suction flow field’s fluid mesh, because the nodal positions of the yarn and fluid mesh seldom coincide. Nevertheless, a certain degree of spatial correlation still exists between the beam-element nodes of the yarn and the surrounding fluid elements. To address this, the inverse distance weighting (IDW) interpolation algorithm is employed, taking the beam-element node as the interpolation center. Within a prescribed search range, the fluid parameters at each yarn node are estimated from the known fluid element data based on the principle of distance-weighted averaging, the interpolation procedure is illustrated in Fig. 3.
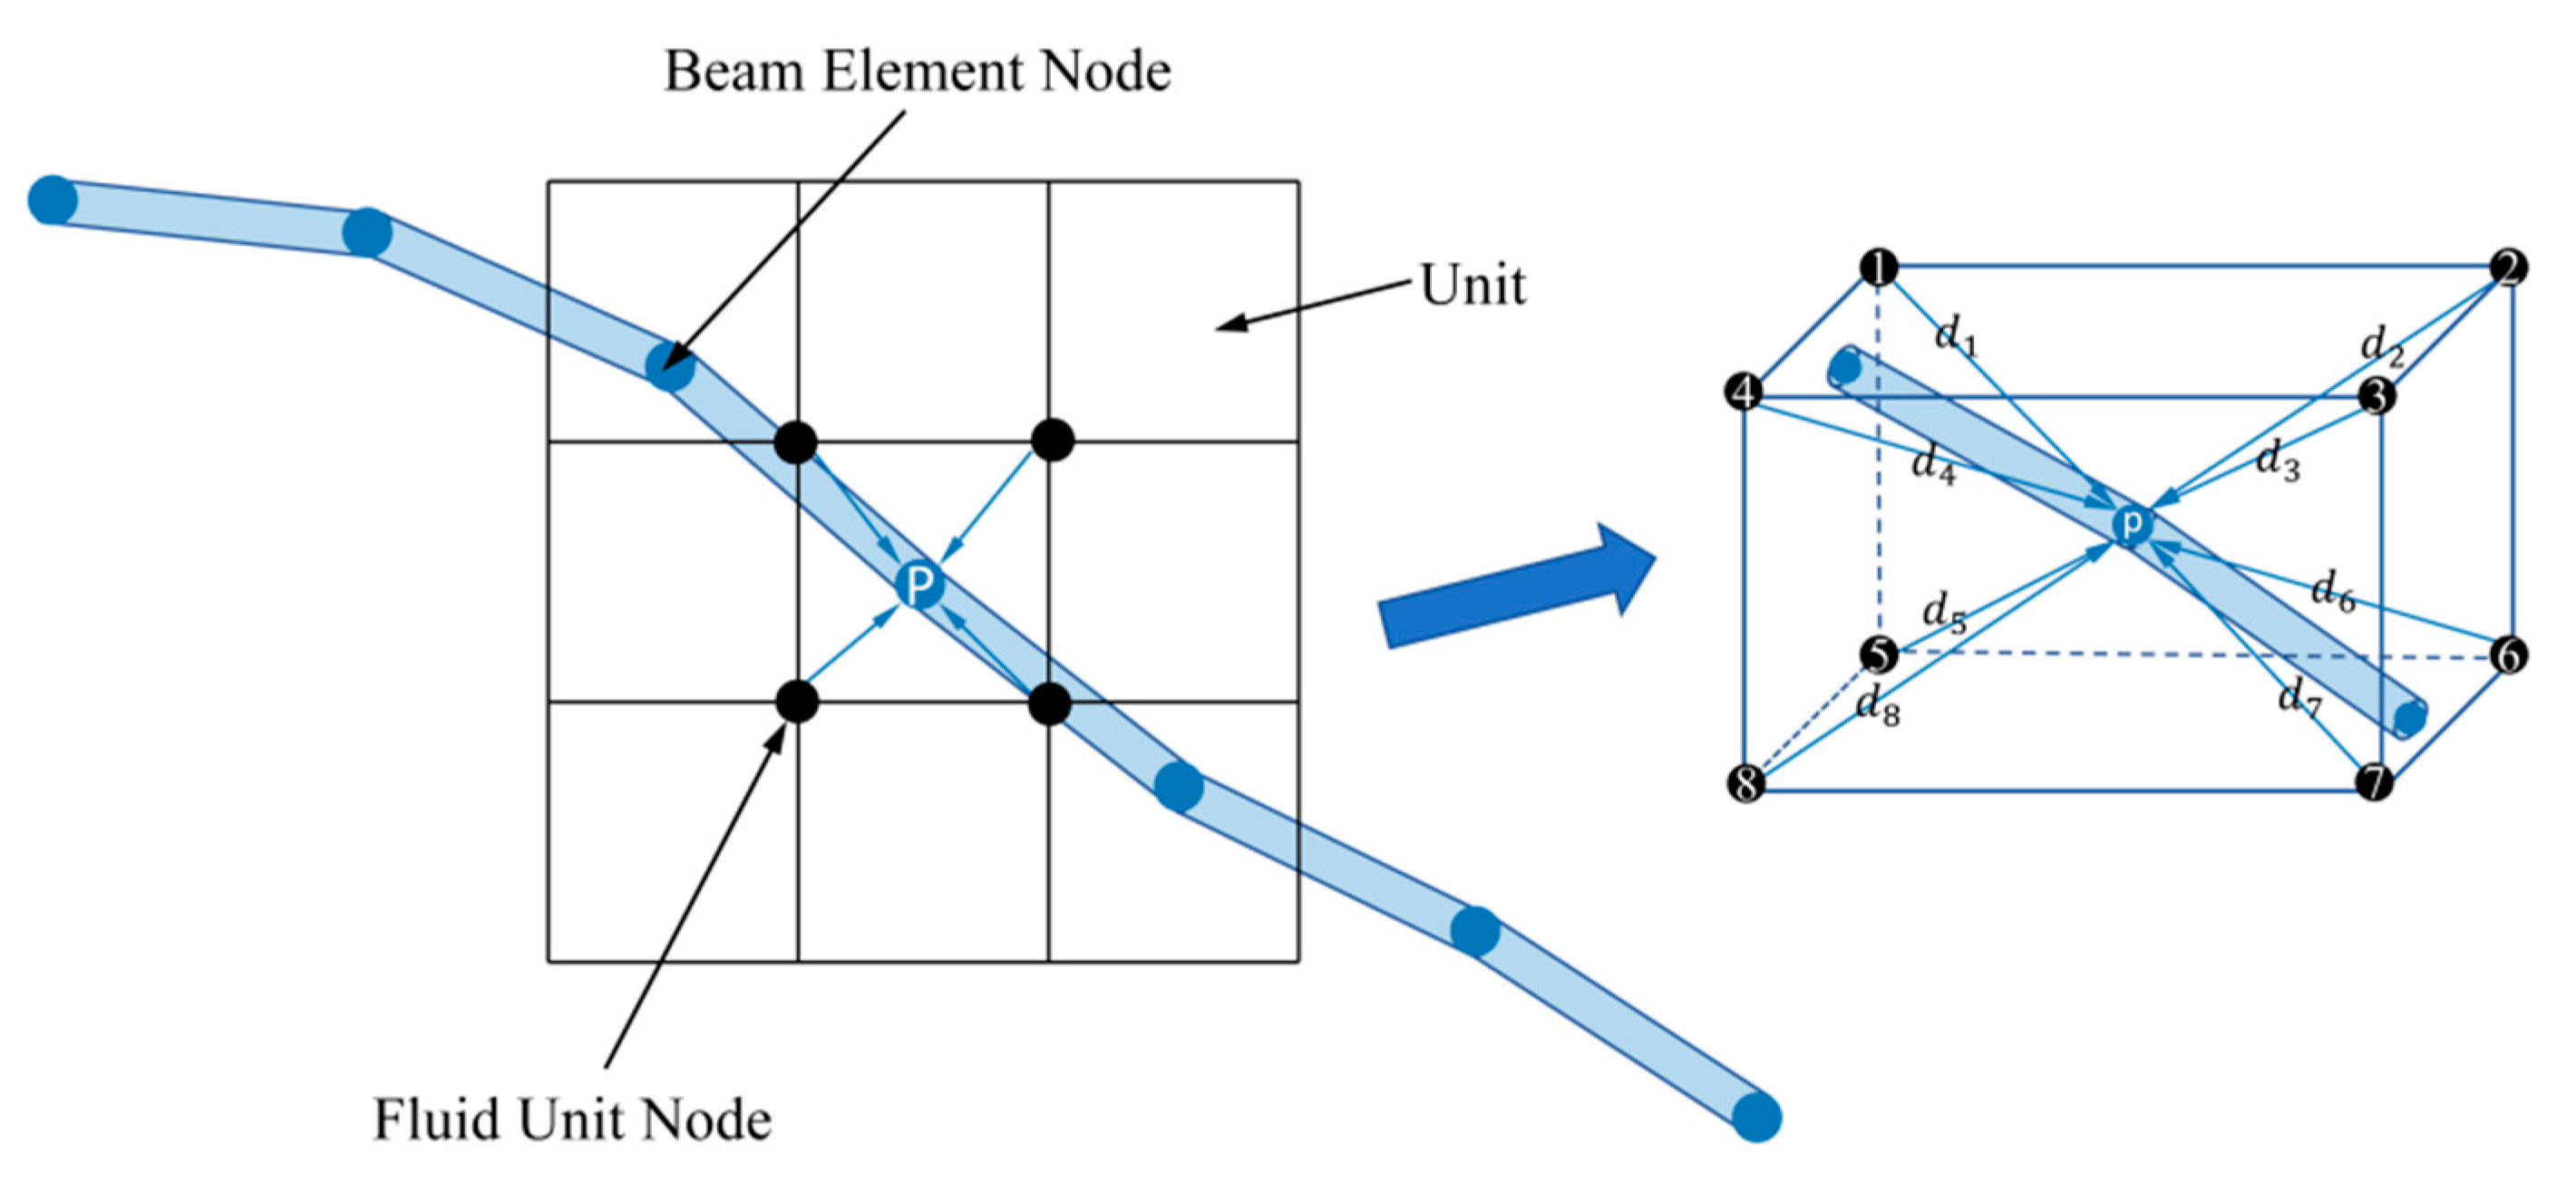
Figure 3: IDW interpolation for yarn nodes.
By applying the following formula, a quantitative connection between the surrounding airflow field and the yarn nodes is established, thereby obtaining the airflow data at any given node in the yarn entity model.
In the formula group, where
The yarn’s motion can be described by Newton’s second law; its internal and external forces are depicted in Fig. 4. The internal forces arise from the interaction between neighboring beam elements within the same yarn, which generate axial tension, bending, and torsional moments on the cross-sections of the element. The external force mainly results from the traction of the negative-pressure jet, which is called the aerodynamic force here.
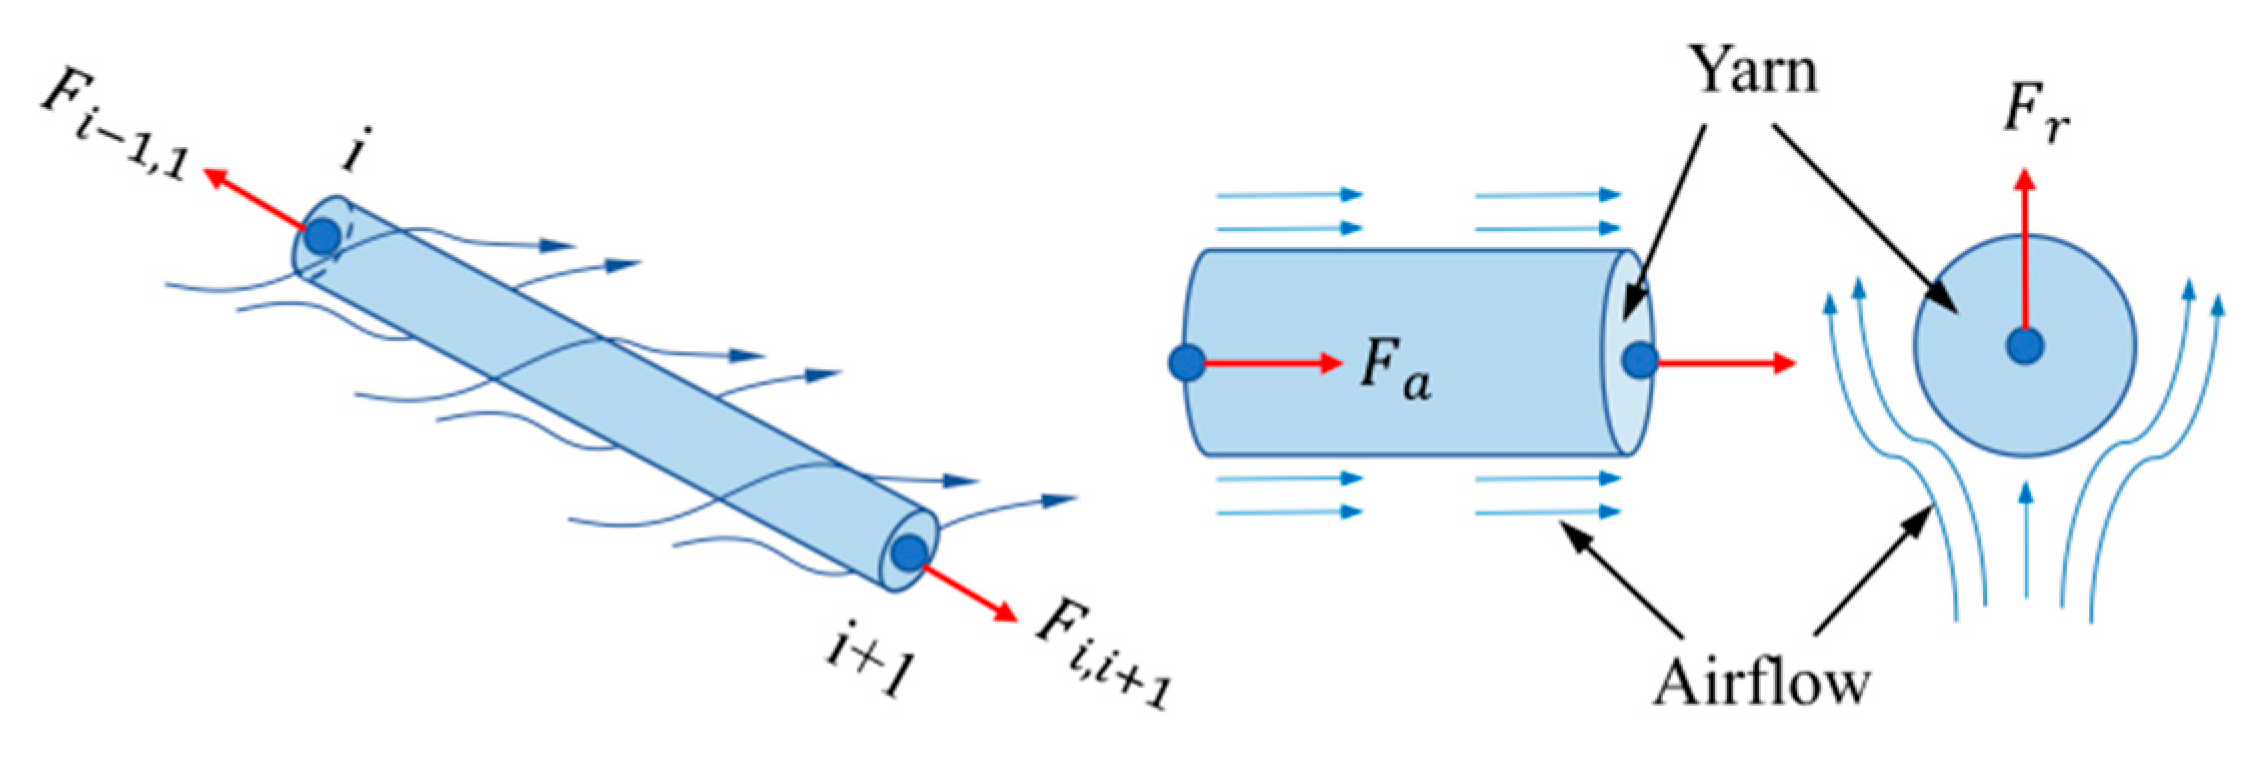
Figure 4: Force decomposition of yarn under airflow field.
When the negative-pressure jet flows across the yarn surface, the generated aerodynamic force
By comparing this expression with the general formulation of drag force in fluid mechanics, it can be inferred that the value obtained through the Buckingham π theorem is related to the drag coefficient (Cd). Specifically, the derived value corresponds to one-half of the drag coefficient. Consequently, the expression for the aerodynamic force (F) can be formulated.
Owing to the discretization of the yarn model, the aerodynamic force must be applied to the nodes of each beam element. For this purpose, the total aerodynamic force is decomposed into two components along the yarn’s axial and radial directions:
Through extensive experimental curve fitting, empirical correlations for the axial and radial drag cotton yarn aerodynamic coefficients have been obtained, which can be expressed as:
Finally, the nodal displacements of the beam elements of the yarn were acquired by an explicit dynamic simulation. In this scheme, the state variables, such as displacement and velocity, at the end of each time increment are computed from those of the previous step, following the standard explicit integration procedure. In view of the millisecond-scale duration of the yarn-end capture process, a time increment of Δt = 5 × 10⁻⁶ s was adopted for updating the aerodynamic loading in the coupled simulation. No temporal discretization is involved in the CFD solver because a steady airflow solution is computed; the temporal discretization is required only for the yarn dynamics, which are integrated in Abaqus/Explicit using the standard explicit (central-difference) time integration scheme. The time increment was selected to be sufficiently smaller than the millisecond-scale capture time, providing a large number of increments to resolve the transient response while maintaining numerical stability, consistent with explicit time-domain dynamics practice reported in FDMP [38]. With this choice, the transient process can be resolved with a sufficiently large number of time steps, and spurious numerical oscillations in the predicted response are effectively suppressed. Accordingly, the dynamic equilibrium equation of the yarn model is written as:
The governing equations of motion are explicitly integrated to evaluate the overall movement of the yarn.
3 Numerical Simulation Results and Analysis
Under the action of the negative-pressure jet, the yarn end detached from the package surface undergoes three successive stages of motion: suction onset, yarn detachment and stable separation. As illustrated in Fig. 5: the first stage occurs when the negative-pressure jet at the vacuum nozzle begins to form, causing a slight displacement of the yarn end relative to the package surface. During this stage, the yarn end gradually detaches from the package surface but has not yet completely separated; In the second stage, the negative-pressure jet at the nozzle outlet becomes stable, leading the yarn end to fully separate from the package surface and progressively enter the nozzle interior; Finally, in the third stage, the yarn end is entirely drawn into the nozzle, where it remains relatively stable under the action of the negative-pressure suction flow, thereby preventing recontact with the package surface and completing the entire suction process.
In the present study, the adsorption time is defined as the time interval from the onset of the negative-pressure jet to the moment when the yarn end is completely drawn into the nozzle and remains stably inside the flow channel without recontacting the package surface.
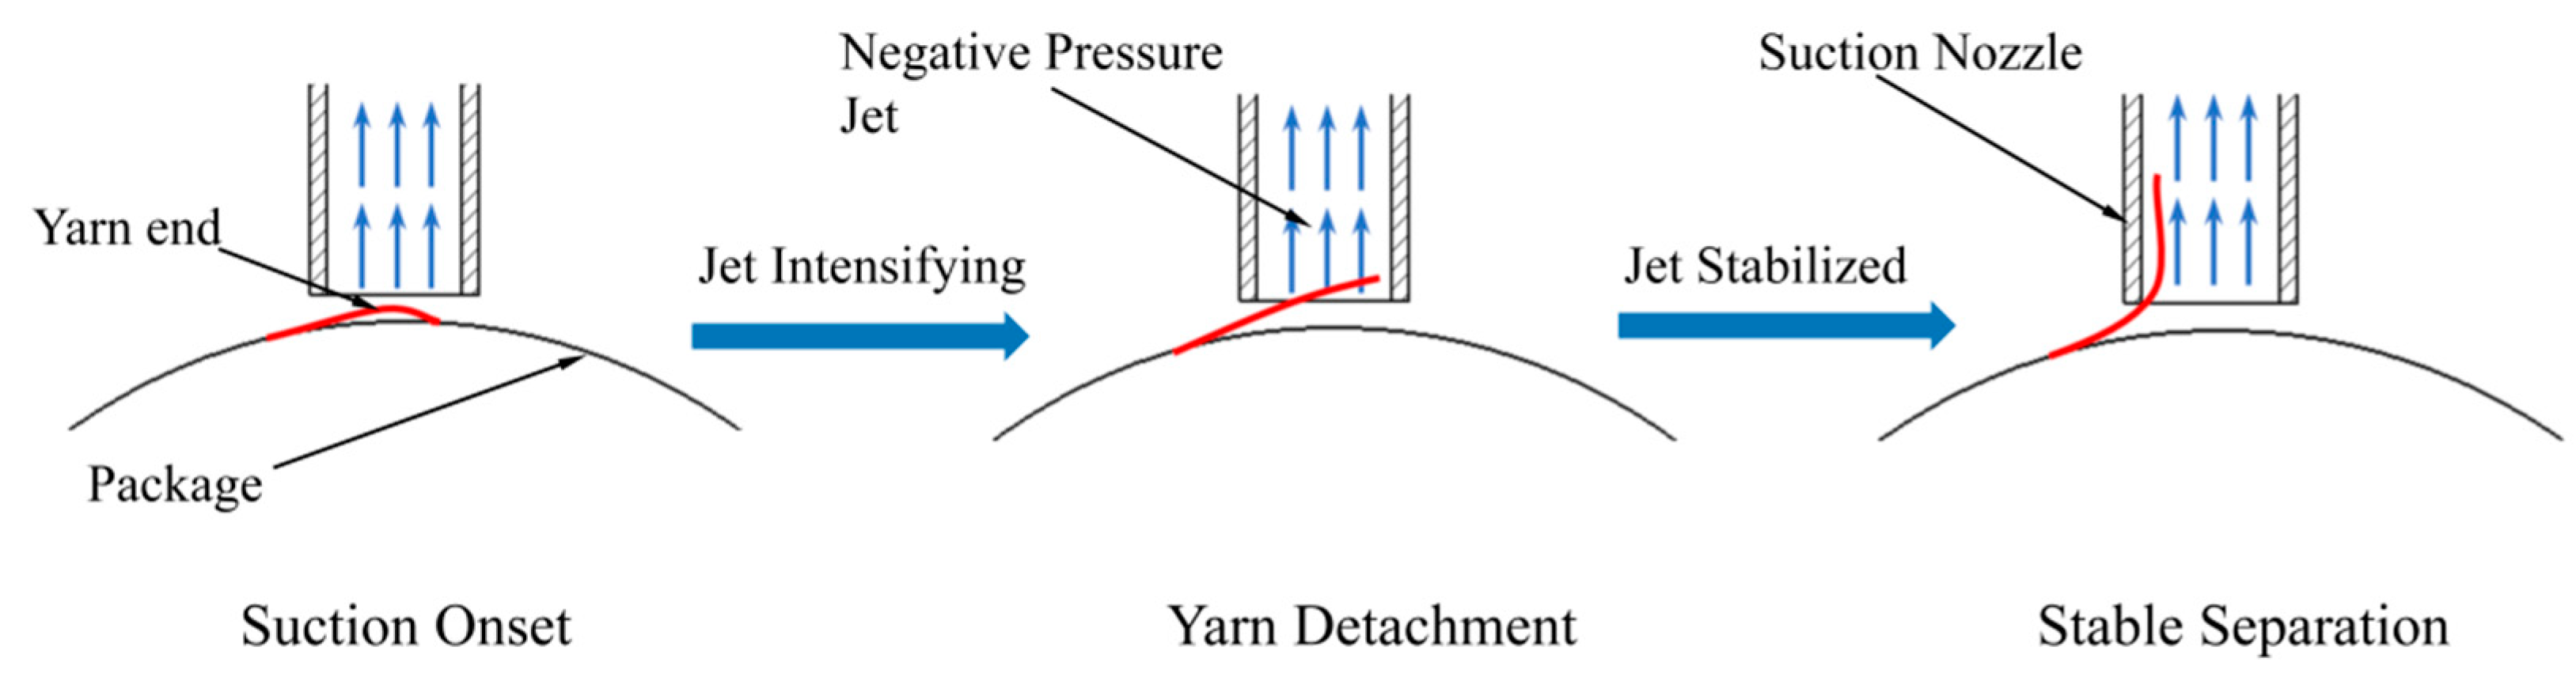
Figure 5: Numerical simulation flow chart.
The initial pressure of the negative-pressure jet has a decisive influence on governing the spatial motion of the yarn. When the inlet pressure varies, the internal flow structure of the suction nozzle changes, which further affects the yarn displacement during the capturing stage. To explore the relationship between the initial pressure and yarn displacement, the simulations were conducted in FLUENT under different inlet pressures of −0.04, −0.05, −0.06, and −0.07 MPa. The velocity and pressure contours along the axial plane of the nozzle are depicted in Fig. 6a–d, where the left and right columns represent the velocity and pressure fields, respectively.
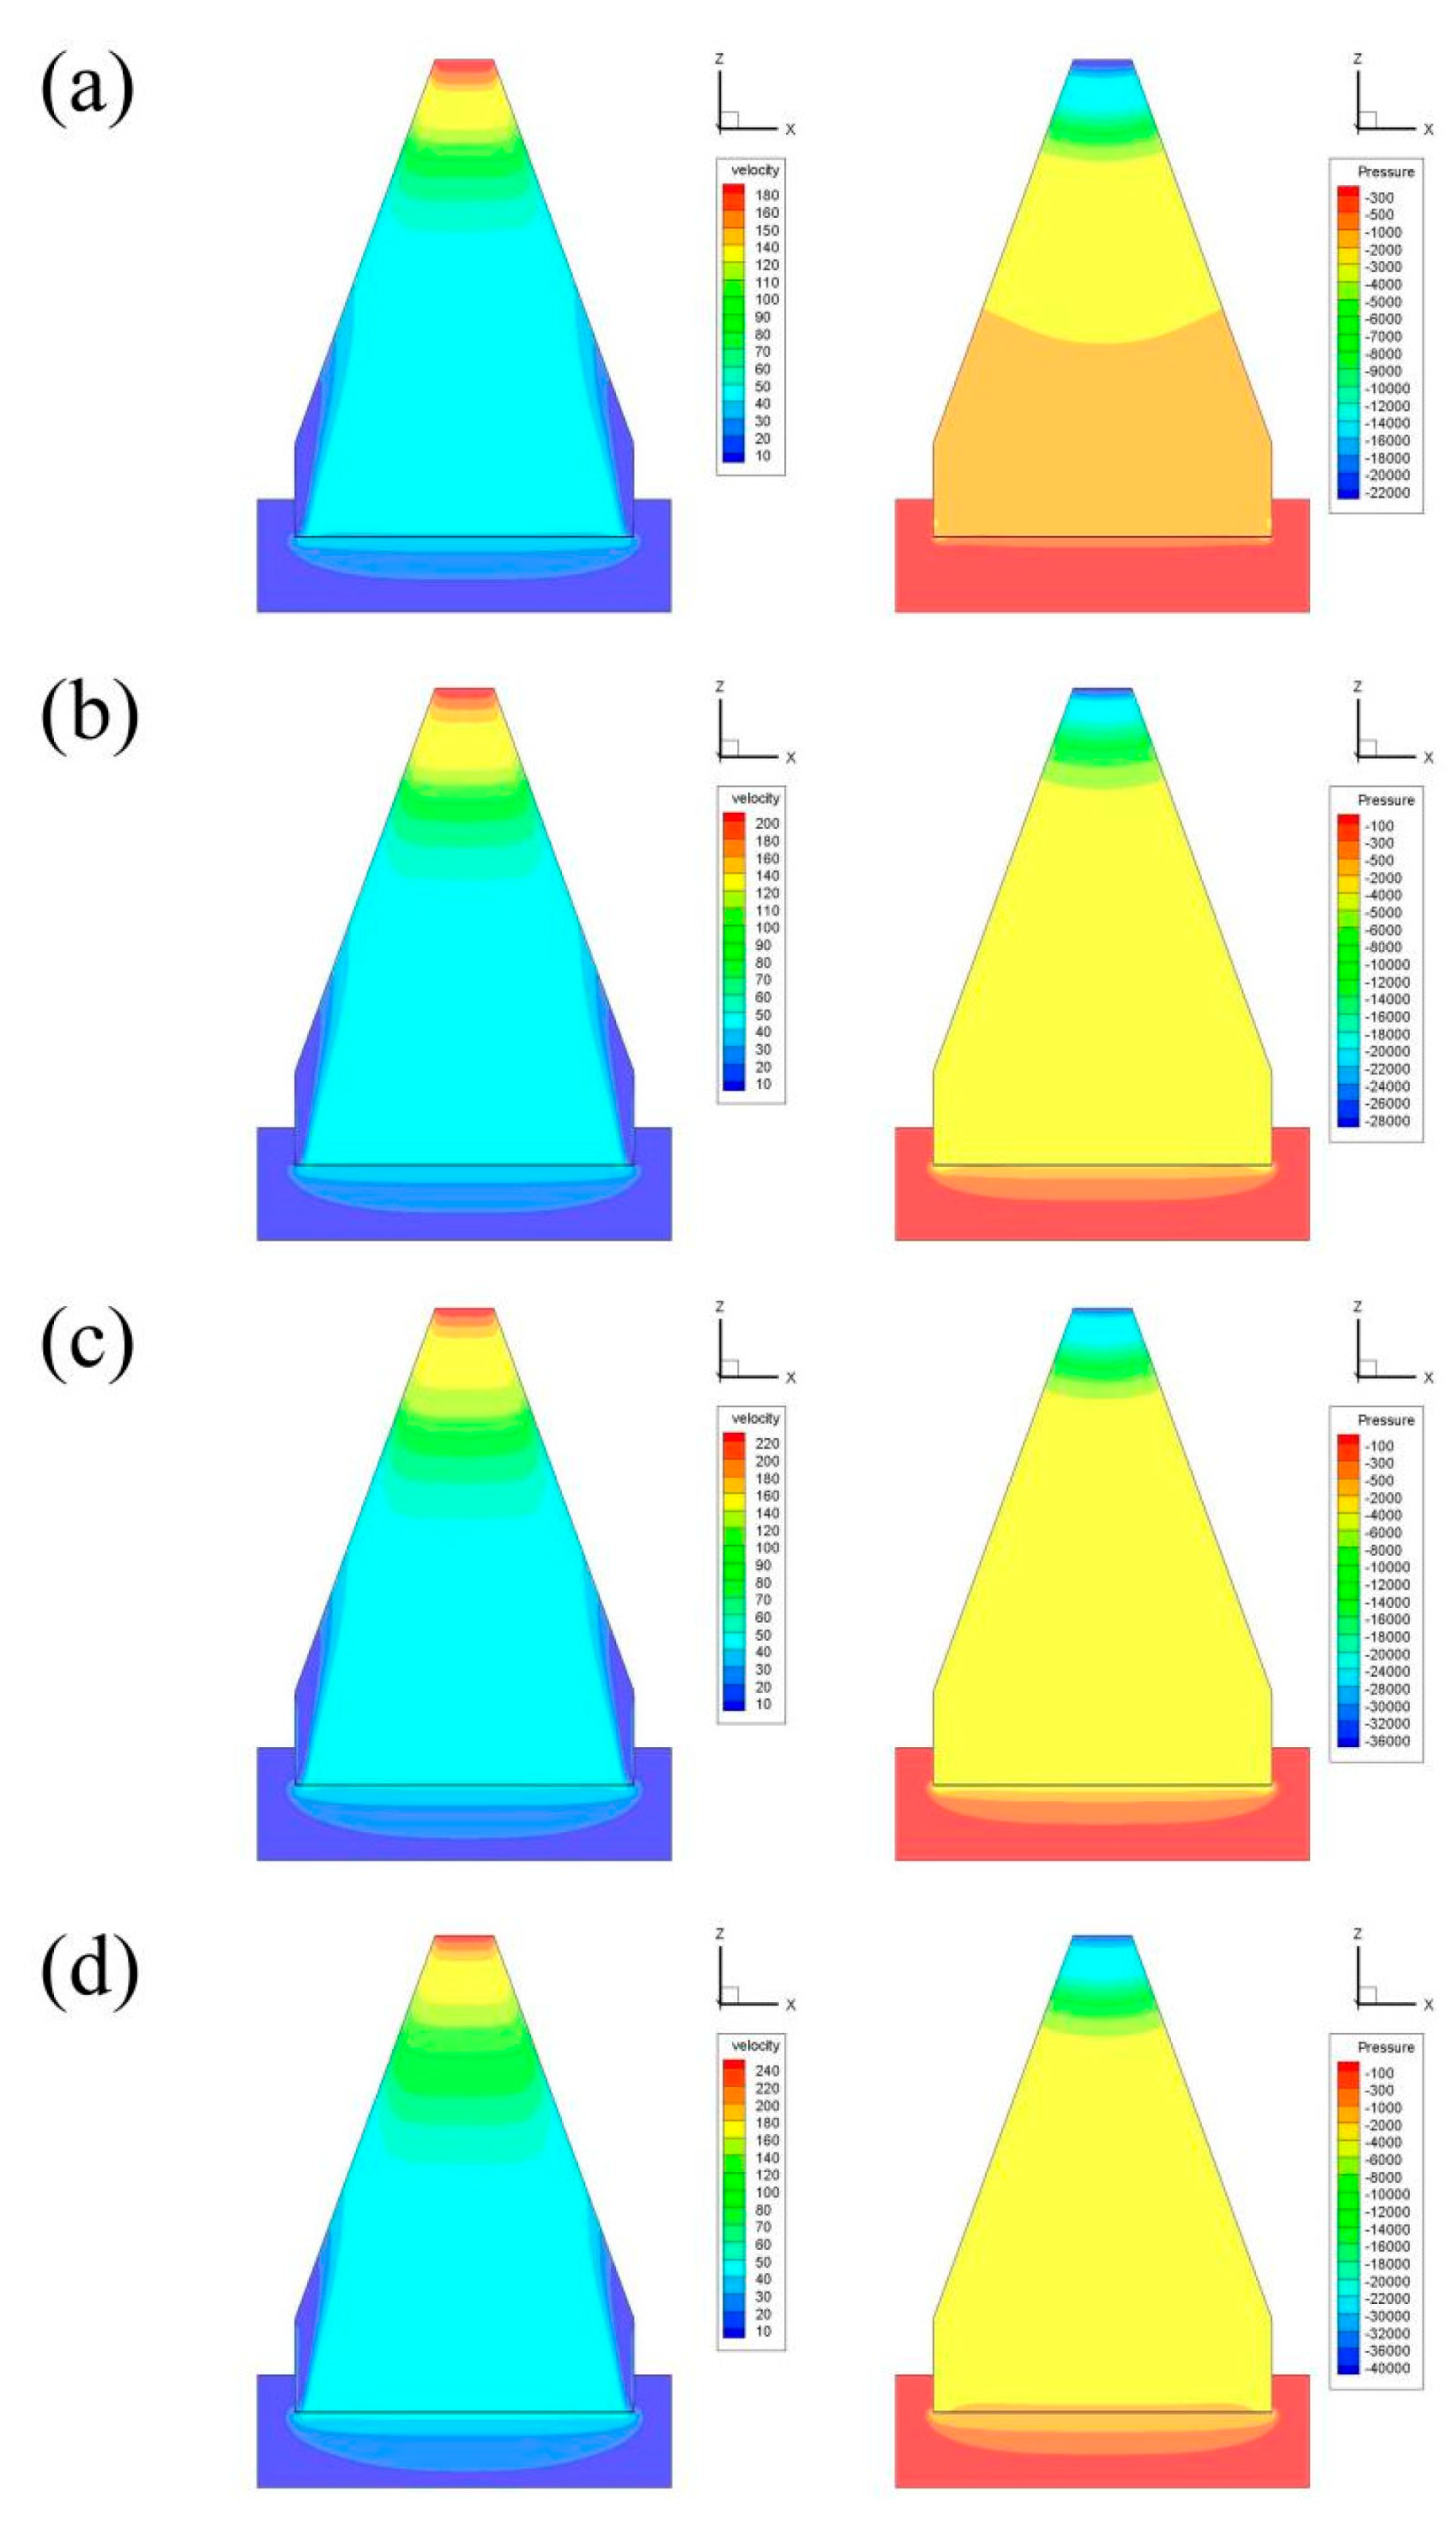
Figure 6: Velocity (left) and static-pressure (right) contours on the nozzle axial section at inlet negative pressures of (a) −0.04 MPa, (b) −0.05 MPa, (c) −0.06 MPa, and (d) −0.07 MPa.
As depicted in these results, the two fields exhibit strong spatial coupling: the area of the maximum velocity is mostly located at the position of the low-pressure core, and the two fields have an overlap of about 89%. This result reflects the classic Bernoulli energy conversion mechanism. With the increase in suction intensity, the acceleration of the throat jet becomes more significant. That is, when the inlet pressure varies from −0.04 MPa to −0.07 MPa, the maximum velocity at the throat increases from about 180 m/s to 240 m/s. This trend agrees well with the scaling law:
Meanwhile, the area of the low-velocity zone (v < 20 m/s) near the nozzle outlet becomes narrower, which indicates that a larger pressure difference would delay the growth of the boundary layer.
When the negative pressure is larger, the larger negative pressure not only increases the minimum pressure, but also enlarges the range of the low-pressure core from 8 mm to 20 mm after the outlet. In addition, the expansion of the low-pressure area extends the effective suction area and improves the yarn-capturing ability. However, when the negative pressure reaches the maximum level (−0.07 MPa), an annular vortex appears near the exit of the nozzle. This vortex may disturb the trajectory of the yarn and should be avoided in the design of the application. This annular vortex mainly originates from the strong adverse pressure gradient together with the rapid expansion of the high-speed jet at the nozzle exit. At a suction level of −0.07 MPa, the jet core undergoes a much more evident deceleration in the region near the nozzle bottom, which in turn triggers boundary-layer separation and causes the shear layer to roll up into a ring-shaped recirculation structure. The presence of this vortex introduces local unsteadiness and transverse velocity components near the nozzle bottom, and thus disturbs the stable entrainment of the yarn end.
In addition, as shown in Fig. 7a,b, the velocity and pressure are plotted from the inlet to the downstream region to further describe the flow development. Based on the shape of the nozzle and stream characteristics, the flow field can be classified into three parts: Region I corresponds to the divergent cone section extending from the throat to the outlet; Region II represents the outlet section with a constant cross-sectional area; and Region III denotes the free jet region downstream of the nozzle exit.
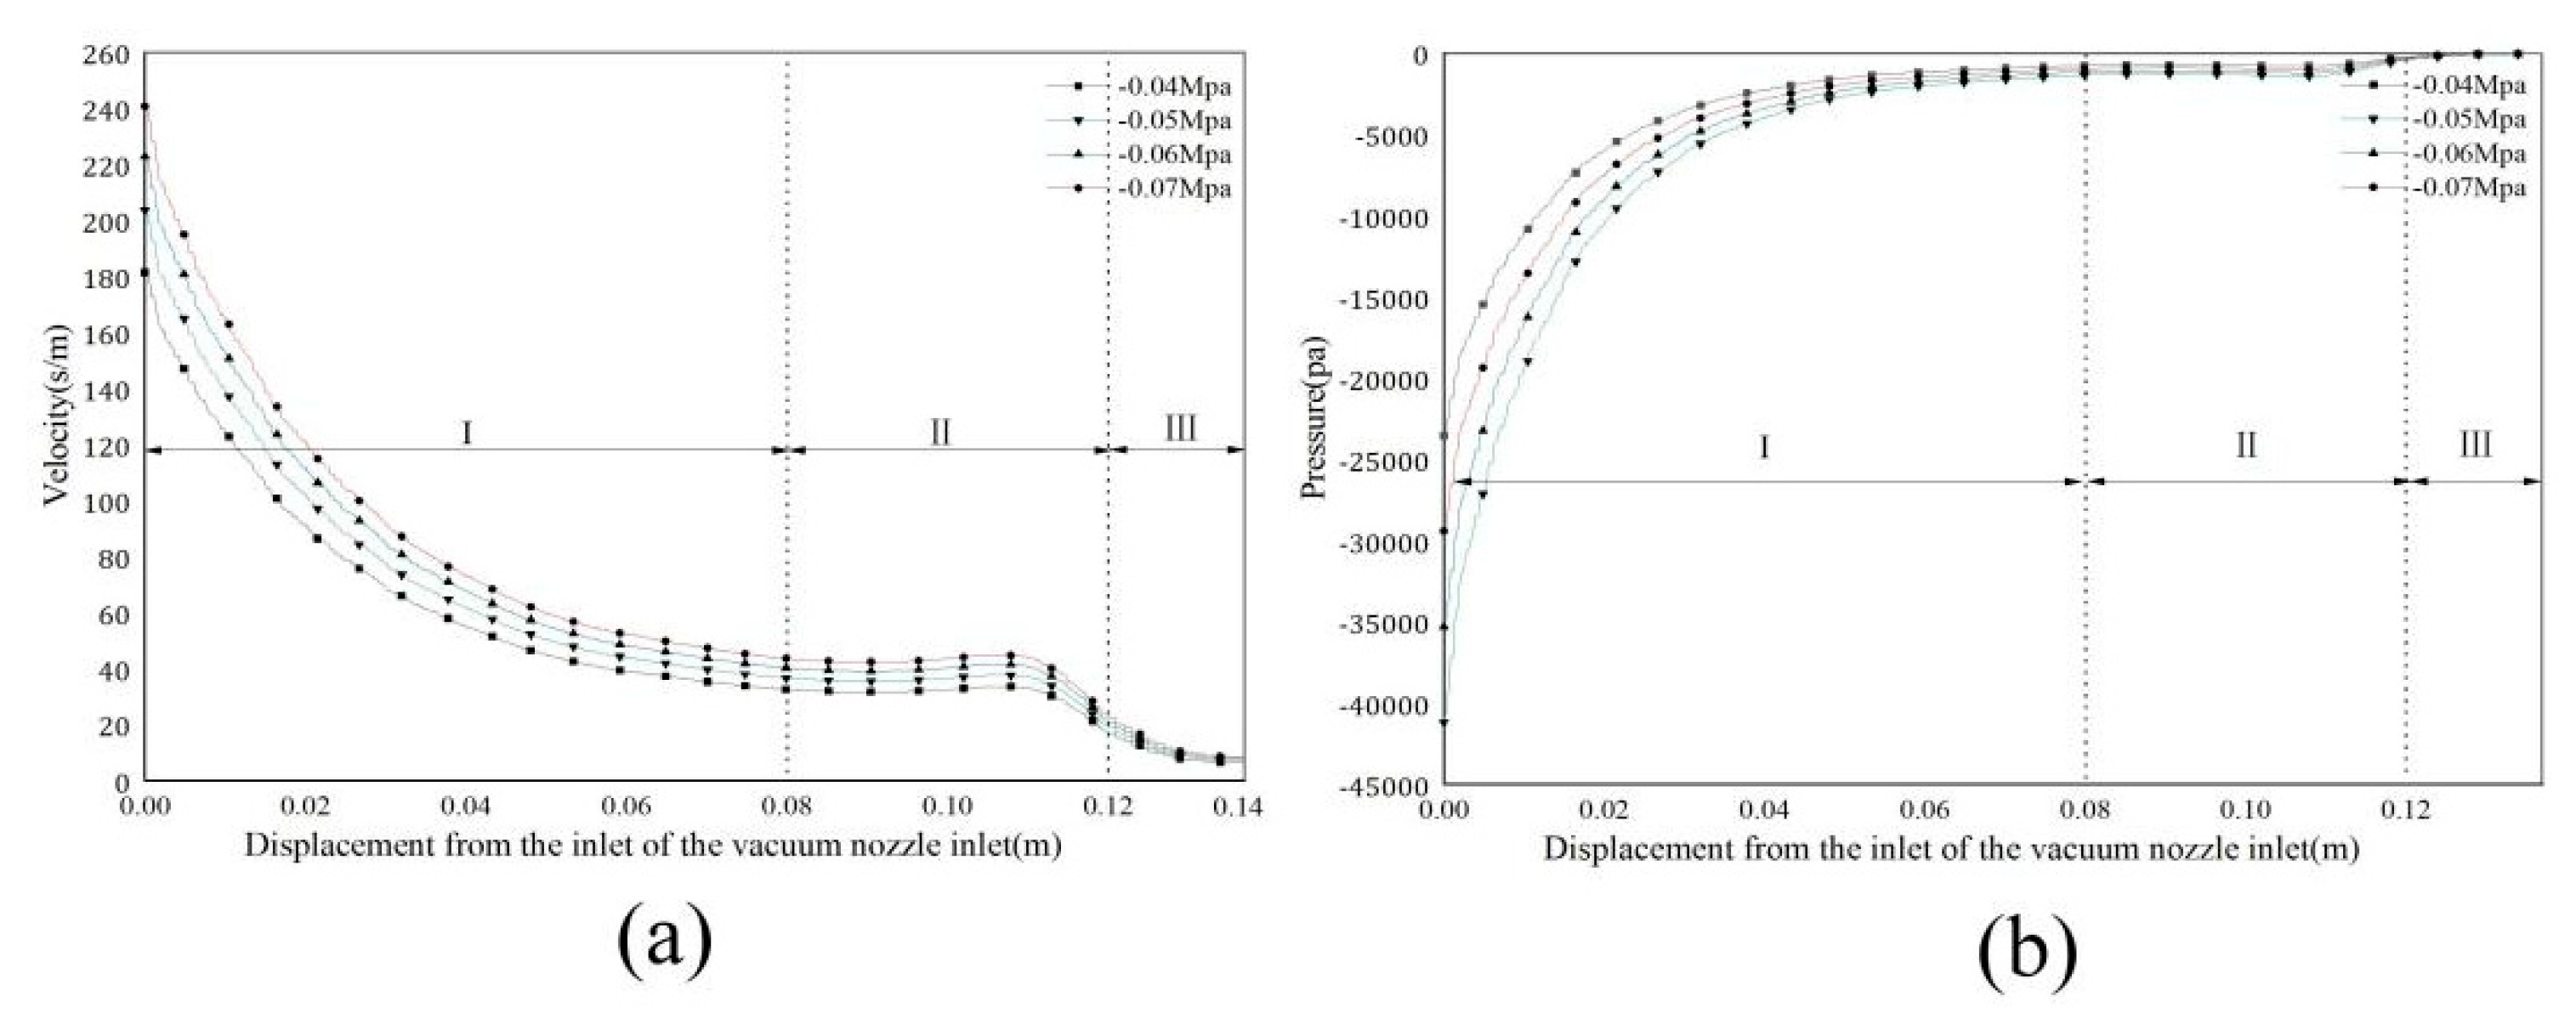
Figure 7: Axial distributions of (a) velocity and (b) pressure along the centerline of the vacuum nozzle under different suction pressures.
The analysis shows that in Region I, an increase in suction pressure leads to a marked rise in peak velocity at the nozzle throat, accompanied by a faster rate of velocity decay. At the same time, the absolute pressure reaches lower values under stronger suction, and the recovery distance to ambient pressure at the outlet becomes slightly longer. In Region II, owing to the constant cross-sectional area, both velocity and pressure remain relatively stable across different suction levels. However, under higher suction, the mean velocity is about 25%−40% greater than under lower suction, while the pressure profile as a whole shifts toward more negative values. In Region III, the jet emerging from the nozzle exhibits a higher initial velocity under strong suction, but the attenuation is more rapid, and the flow decays to near zero within roughly 20 mm from the outlet. By contrast, under weaker suction, the decay is more gradual.
To investigate the flight trajectory and mechanical mechanism of the yarn end within the negative-pressure suction flow, in the simulation, a yarn sample with a length equal to the width of the nozzle bottom and fixed at one end was used. A 10 mm long yarn was selected to analyze its three-dimensional motion and final equilibrium state under negative-pressure jet fields with initial intensities of −0.04 MPa, −0.05 MPa, −0.06 MPa, and −0.07 MPa, as shown in Fig. 8a–d.
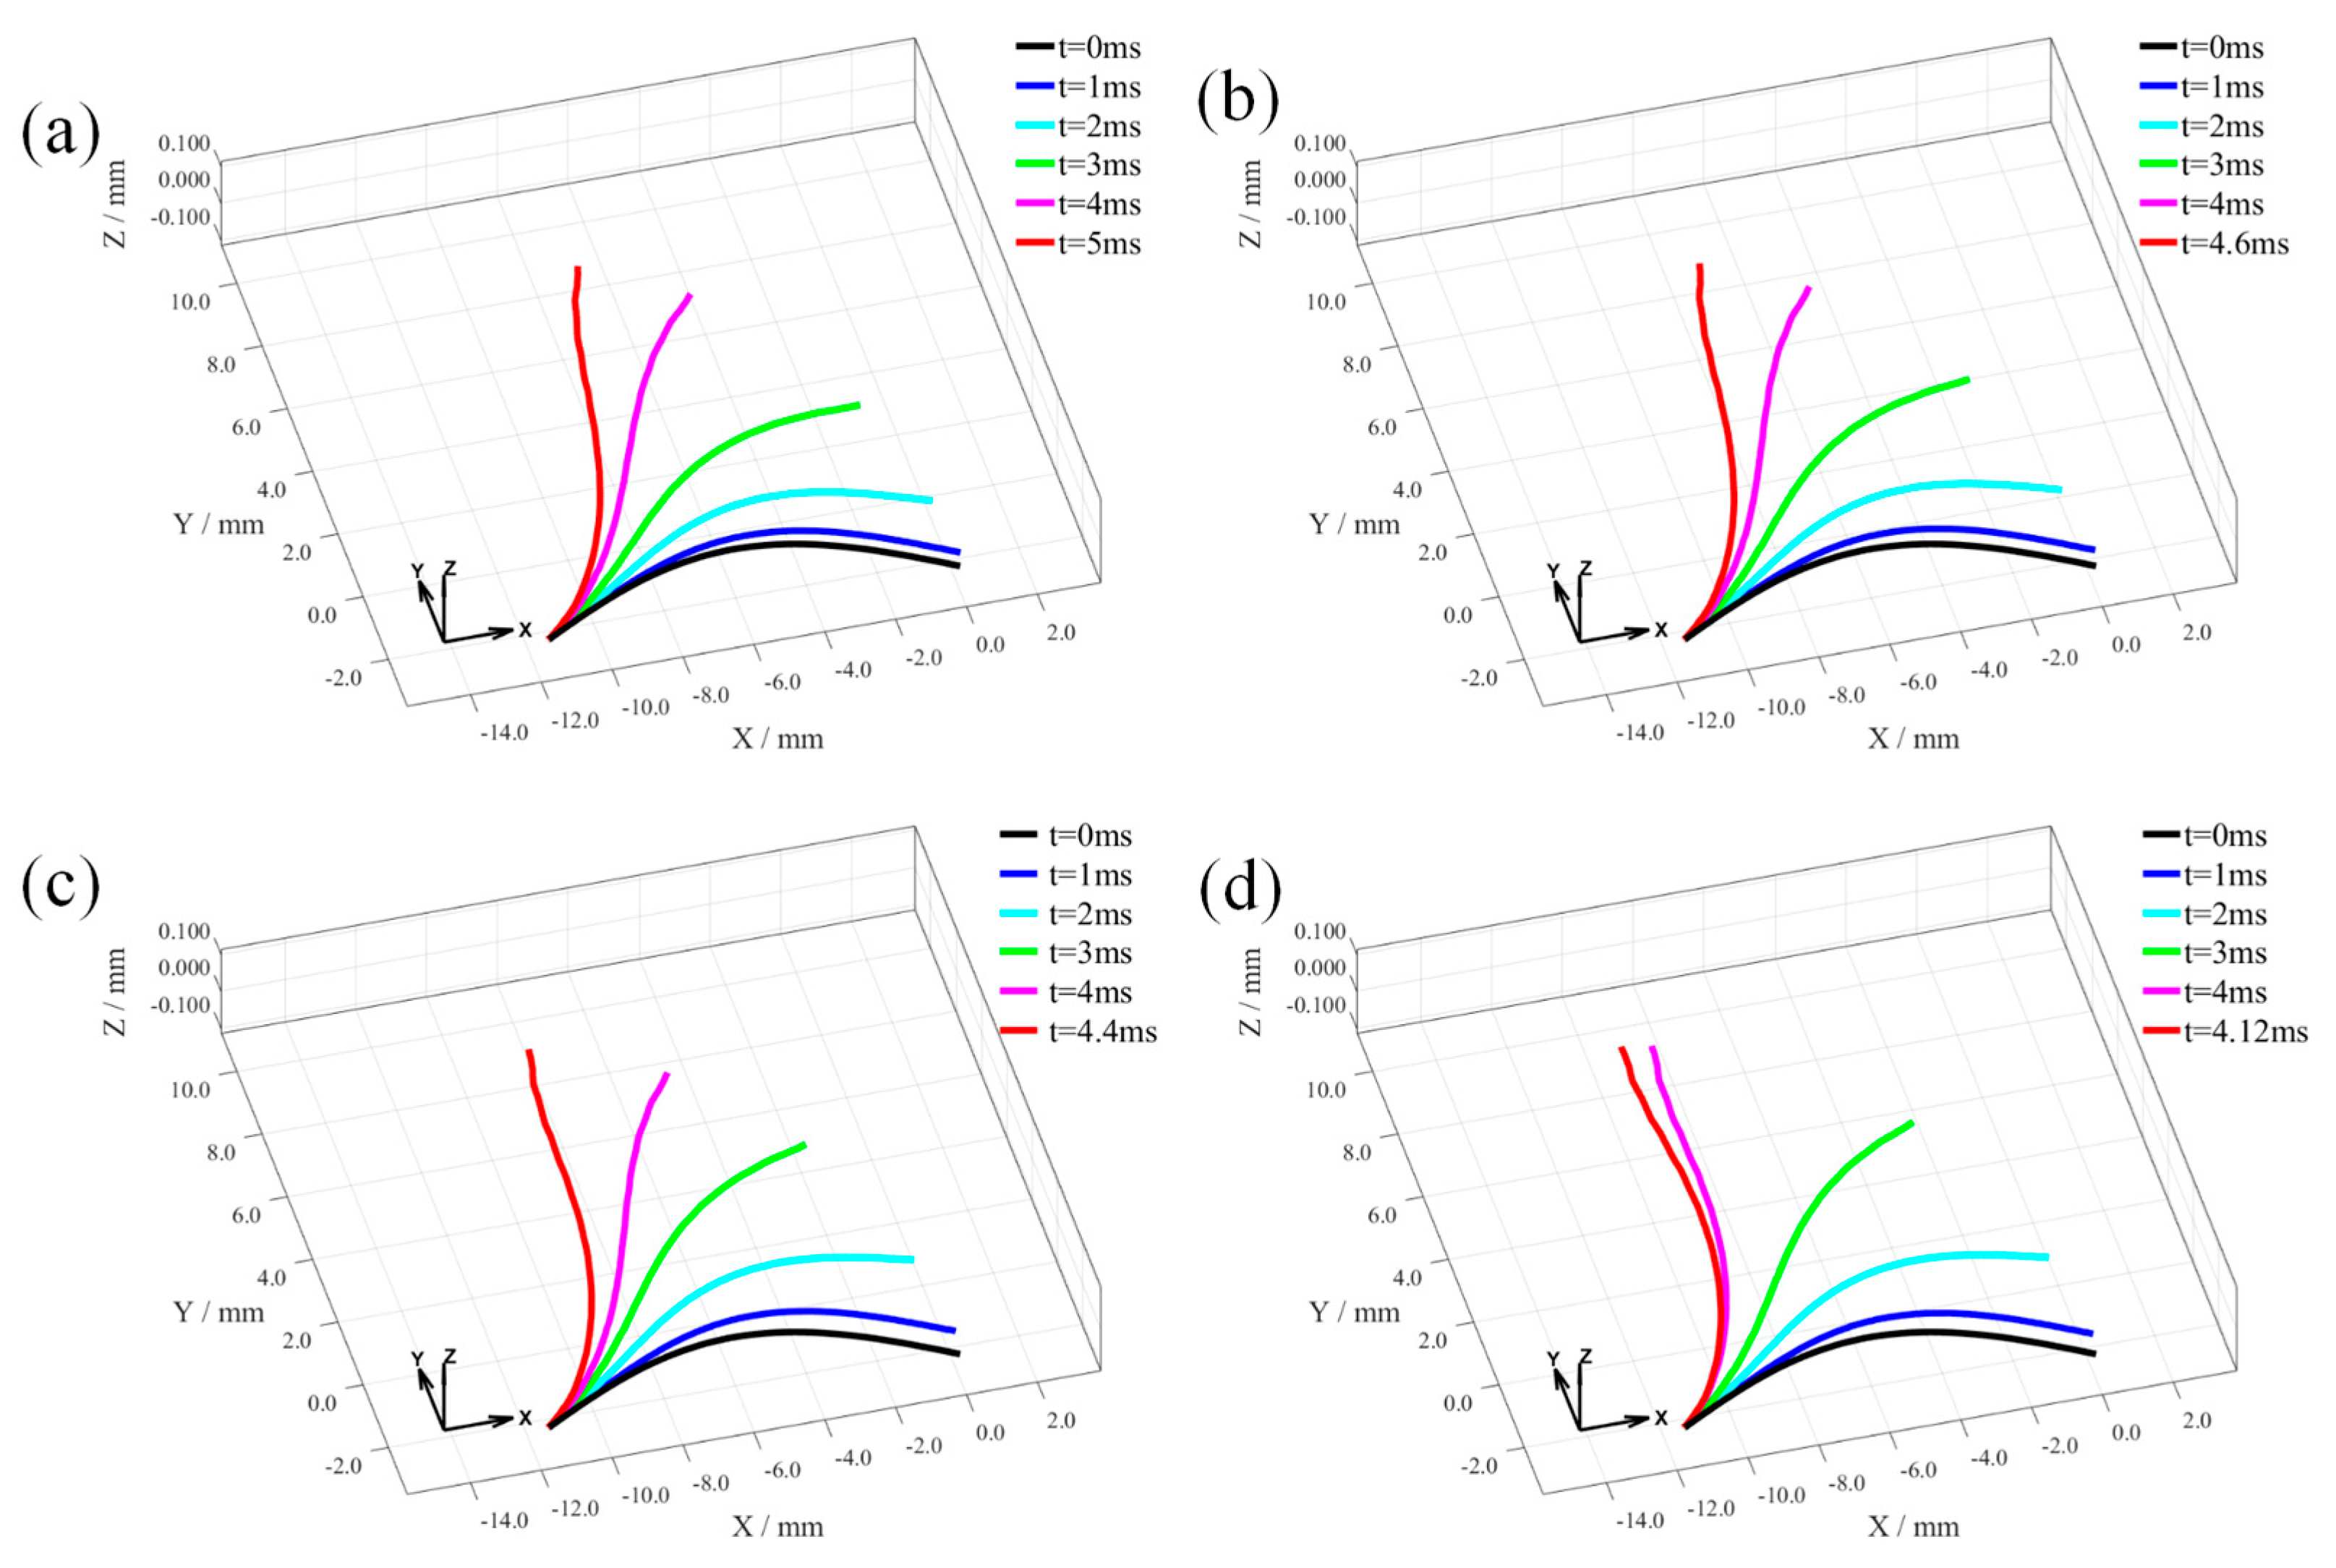
Figure 8: Simulated yarn-end trajectories under different inlet negative pressures: (a) −0.04 MPa; (b) −0.05 MPa; (c) −0.06 MPa; (d) −0.07 MPa.
Under the action of the negative-pressure jet, the motion trajectory of the yarn exhibits distinct stage-specific characteristics. During the initial suction phase, the yarn end remains in contact with the outer surface of the yarn package, and the overall configuration presents a curved arc profile. When the negative pressure is relatively low, the front and middle parts of the yarn move slowly to the positive Y-axis direction due to the aerodynamic forces. Since the suction force is relatively weak at this time, the middle and later parts respond slowly and cannot follow the movement of front part. With the free end gradually rising, the curvature of the yarn gradually decreases and tends to be straightened. After that, the free end of the yarn continues to be acted by the negative-pressure jet and moves faster. Not only does it move quickly to the positive Y-axis, but also moves toward the negative X-axis. When the free end of the yarn moves more, the yarn tends to be straightened and finally reaches the vertical state. The vertical state of the yarn represents the end of adsorption and the beginning of steady separation.
When the negative pressure at the beginning is small, the yarn lifts slowly, the straightening degree of curvature is limited, and the motion has a certain delay. When the negative pressure is high, the yarn lifts quickly, the follow ability is improved, and the time to reach the equilibrium is shortened.
In order to conduct a more detailed quantitative analysis of the force and displacement of the yarn, the yarn length data obtained through simulation during the adsorption process and the displacement and aerodynamic force data of the free end beam nodes of the yarn were calculated and presented in Table 3.
Table 3: Yarn length and aerodynamic response at free-end nodes.
| −0.04 MPa | t = 0 ms | t = 1 ms | t = 2 ms | t = 3 ms | t = 4 ms | t = 5 ms |
| Length (mm) | 10.000 | 10.748 | 10.843 | 10.947 | 11.131 | 11.317 |
| Aerodynamic force (mN) | 3.299 | 3.306 | 4.205 | 6.362 | 4.351 | 0.153 |
| Displacement (mm) | / | 0.442 | 1.529 | 2.978 | 4.581 | 4.477 |
| −0.05 MPa | t = 0 ms | t = 1 ms | t = 2 ms | t = 3 ms | t = 4 ms | t = 4.6 ms |
| Length (mm) | 10.000 | 10.788 | 10.863 | 10.998 | 11.227 | 11.351 |
| Aerodynamic force (mN) | 3.796 | 3.818 | 5.134 | 7.721 | 2.677 | 1.187 |
| Displacement (mm) | / | 0.510 | 1.7853 | 3.524 | 5.199 | 3.105 |
| −0.06 MPa | t = 0 ms | t = 1 ms | t = 2 ms | t = 3 ms | t = 4 ms | t = 4.4 ms |
| Length (mm) | 10.000 | 10.794 | 10.882 | 11.047 | 11.311 | 11.397 |
| Aerodynamic force (mN) | 4.258 | 4.308 | 6.038 | 8.720 | 0.736 | 0.221 |
| Displacement (mm) | / | 0.573 | 2.024 | 4.036 | 5.631 | 2.133 |
| −0.07 MPa | t = 0 ms | t = 1 ms | t = 2 ms | t = 3 ms | t = 4 ms | t = 4.12 ms |
| Length (mm) | 10.000 | 10.800 | 10.901 | 11.102 | 11.392 | 11.421 |
| Aerodynamic force (mN) | 4.721 | 4.837 | 6.9338 | 9.149 | 0.125 | 0.191 |
| Displacement (mm) | / | 0.636 | 2.268 | 4.552 | 5.942 | 0.691 |
The simulated data of yarn length, free-end displacement and aerodynamic force during the adsorption process were extracted and listed in Table 3. With the increase of negative pressure at the beginning from −0.04 MPa to −0.07 MPa, the aerodynamic force increases from 3.306 mN to 4.837 mN, which is about a 46% increase. The displacement of the free end increases from 0.442 mm to 0.637 mm, which is about a 44% increase. These results indicate that the larger pressure difference can lift the yarn more effectively and accelerate the reduction of bending curvature in the early insertion process.
When the instant aerodynamic force reaches 6.362 mN at 3 ms, the aerodynamic force suddenly increases from 6.362 mN to 9.149 mN, and the maximum displacement also increases from 4.351 mm to 5.942 mm. The amount of increase is approximately 45−50%, which indicates that the dynamic response of the yarn becomes harder with increasing suction. Thereafter, with the gradual stabilization of the system, both the aerodynamic force and the displacement decrease simultaneously to a certain level, which means that the stable separation state is achieved.
In addition, an increase in the negative pressure brings about a decrease in the time needed for the yarn to be perpendicular to the nozzle axis, which indicates that a larger pressure difference leads to a faster stabilization. During this period, the yarn was elongated slightly, and the extension amount was more significant with an increased suction intensity.
To validate the accuracy of the weakly coupled numerical results obtained in this study, the mechanical evolution of the yarn end under negative-pressure flow was investigated in three different stages: initiation of suction, yarn detachment, and achievement of steady separation. Based on the simulation results, a special negative-pressure suction nozzle for capturing the yarn end was designed and fabricated, and then a corresponding experimental visualization system was constructed. To capture the motion of the yarn tip on the bobbin, a high-speed imaging system was installed to record the transient process. The yarn motion was recorded using a high-speed digital camera (pco.dimax HS2, PCO, Germany), operated at a frame rate of 5469 fps with a spatial resolution of 1400 × 1050 pixels and a minimum exposure time of 1.5 μs. High-intensity continuous illumination was employed to ensure sufficient image quality during the experiments. The apparatus was composed of two main subsystems: a pneumatic circuit subsystem and an electrical control circuit subsystem. The schematic illustration of the operating principle is shown in Fig. 9.
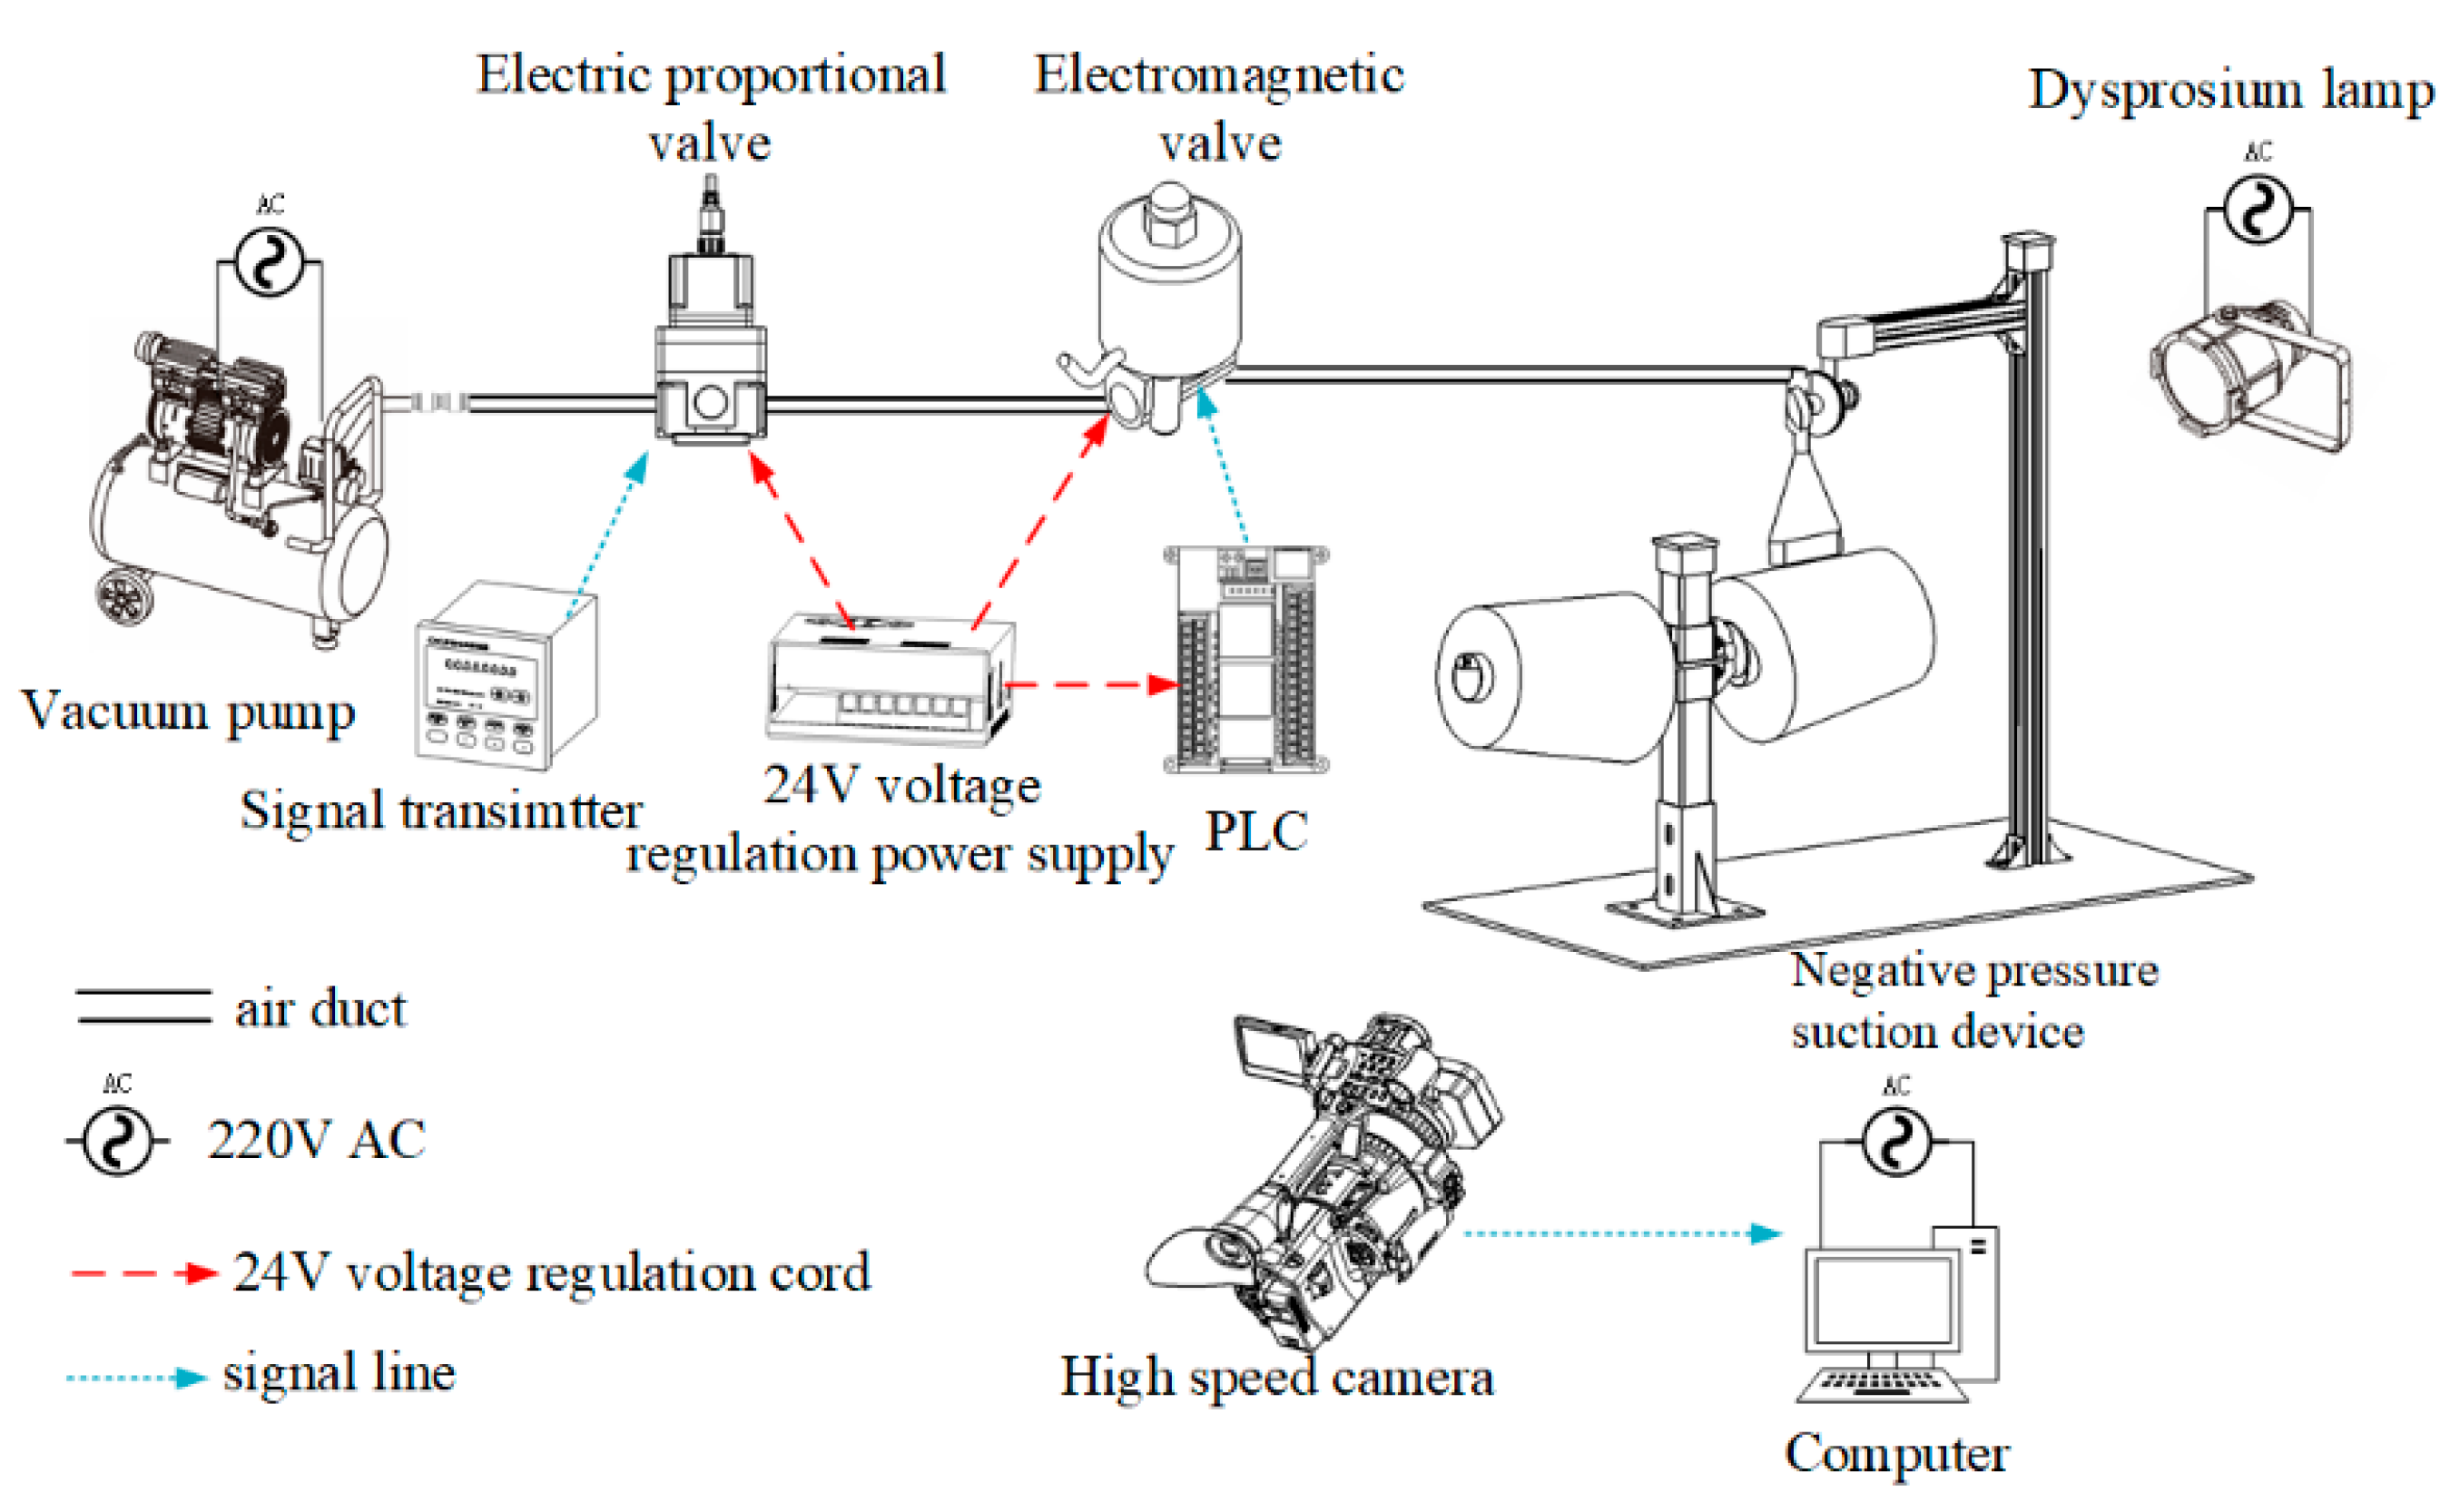
Figure 9: Schematic diagram of the experimental setup for negative-pressure yarn adsorption.
In the pneumatic section, the vacuum pump generated the necessary negative-pressure jet. The airflow first flowed through the electronic proportional valve and then through the solenoid valve and eventually reached the vacuum port of the pressure-detection device. The airflow interacted with the yarn located at the end of the bobbin between the nozzle and the jet. The electrical subsystem was supplied with regulated 24 V DC power. The signal transmitter, proportional valve, solenoid valve and the Omron PLC were continuously energized by the 24 V DC power, and the system was stably operated. The signal generator generated the pulse signal to modulate the output of the proportional valve, and the inlet pressure of the jet was kept constant. The PLC controlled the timing of the opening and closing of the solenoid valve, and then the solenoid valve was energized or de-energized at the required time to generate the suction at the nozzle opening and to stop the suction. The high-speed camera captured the motion of the yarn tip in real time at the required moment.
The primary objectives of this experiment were to validate the accuracy and reliability of the simulation results and to investigate the influence of the initial negative-pressure jet intensity on the spatial motion of the yarn within the airflow field. Based on empirical engineering practice, the height of the suction nozzle was adjusted to maintain a standoff distance of approximately 4 mm from the yarn bobbin surface, ensuring that sufficient negative pressure was applied to the yarn tip.
The process of adsorption will be unavailable if the suction pressure is not enough, and the adsorption process will be tested at negative pressures of −0.04 MPa, −0.05 MPa, −0.06 MPa, and −0.07 MPa, respectively. The motion sequences of yarn ends captured by high-speed photography are recorded in Fig. 10a–d.
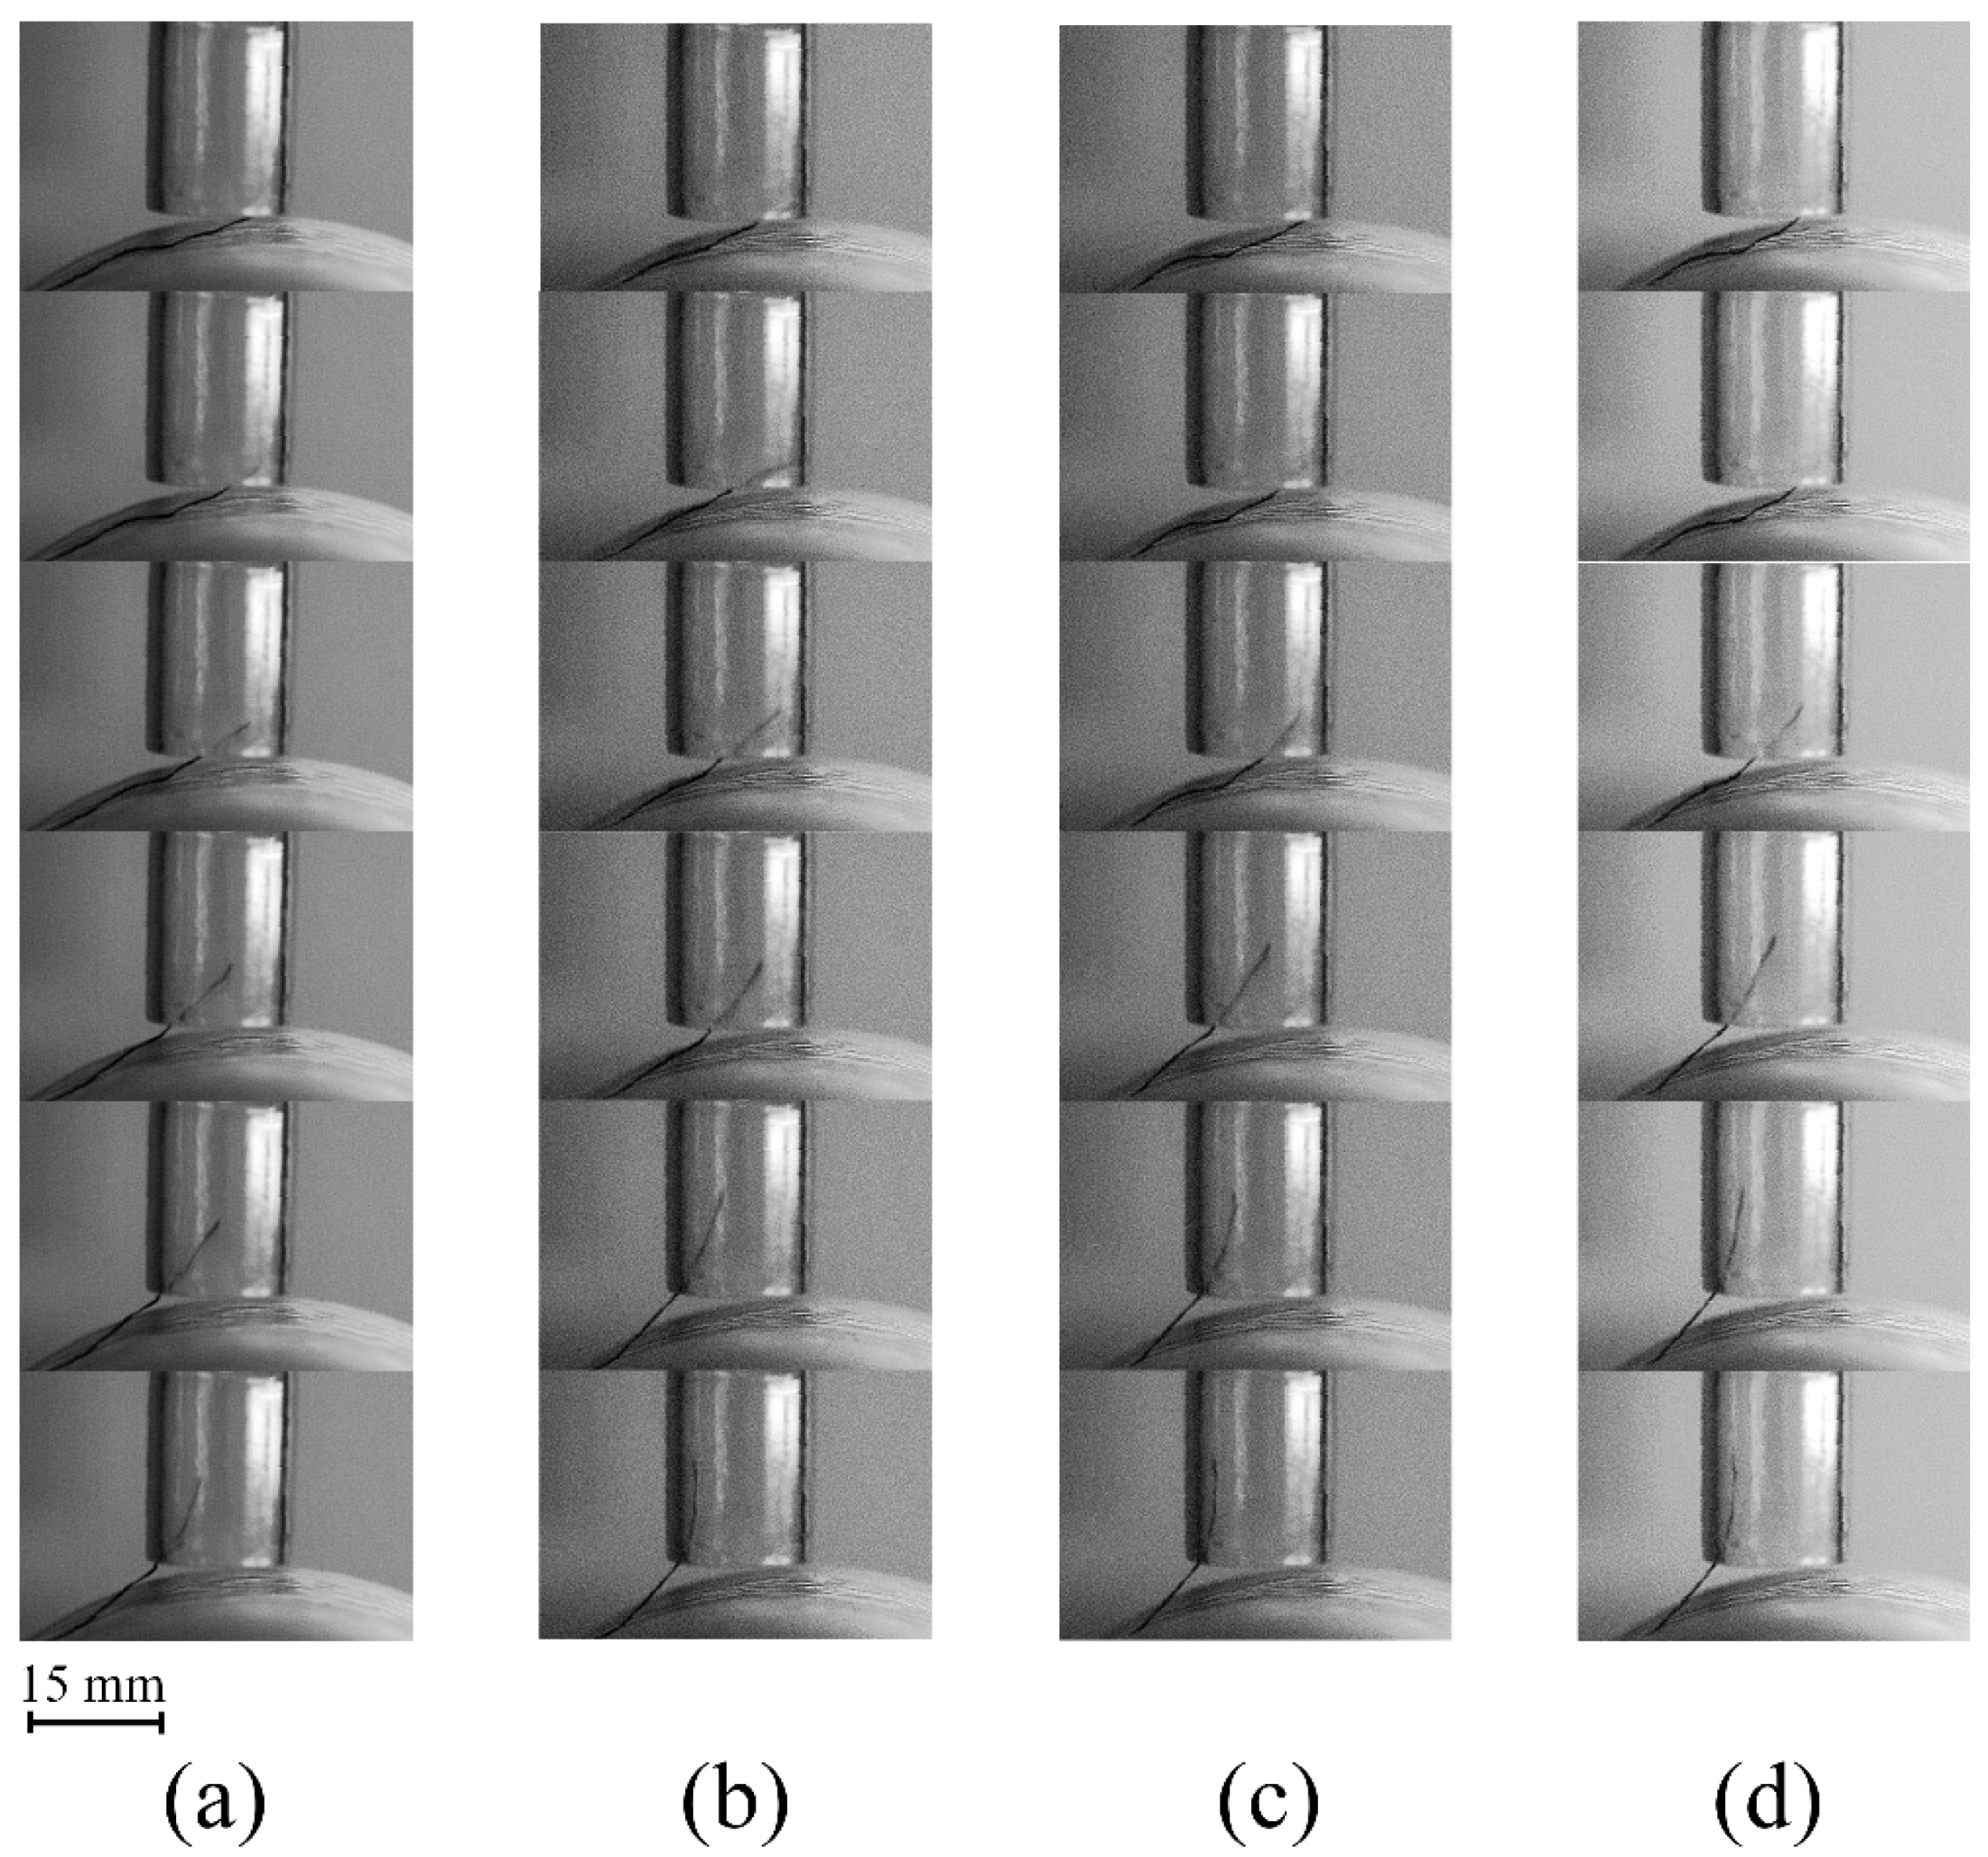
Figure 10: Experimental yarn end motion under varying negative pressures: (a) −0.04 MPa; (b) −0.05 MPa; (c) −0.06 MPa; (d) −0.07 MPa. The scale bar is referenced to the nozzle-bottom width (15 mm).
As shown in Fig. 10a–d, the yarn ends could be successfully captured at different pressures, and the trajectory of each yarn end was basically consistent with the simulation results in Fig. 8. The effect of suction intensity on the yarn trajectory was remarkable. If the suction pressure was only −0.04 MPa, the yarn ends would present obvious lateral oscillations near the entrance of the nozzle, and the yarns could not enter the nozzle axis, and then the adsorption was not stable. When the pressure was increased to −0.05 MPa, the yarn ends could enter the nozzle, and the yarn ends were still with a certain offset and unsteady motion, which indicated that the pressure was close to the threshold of capture. When the pressure was raised to −0.06 MPa, the best performance was achieved, and the trajectories of yarn ends were rapid and smooth, with a lateral oscillation distance of about 1 mm and the shortest adsorption time. When the suction pressure was increased to −0.07 MPa, although the yarn end could be captured faster due to the stronger suction, the instantaneous acceleration become very large, and the yarn was prone to being impacted onto the inner wall of the nozzle, which increases the risk of fiber damage. In the experiments, although the detailed vortex structure cannot be directly resolved, under this highest suction condition, the yarn was observed to exhibit pronounced lateral oscillations and intermittent contact with the inner wall of the nozzle, indicating an unsteady and disturbed motion. This behavior is qualitatively consistent with the numerical prediction and supports the conclusion that an excessively high suction level may deteriorate the stability of the capture process.
To ensure the repeatability of the experiment, the test was repeated 100 times at the same pressure level, and then the relationship between suction intensity, energy consumption and efficiency, as well as success rate, would be studied by comparing the mean ± standard deviation (SD) of the adsorption time and total elongation, and the success rate of yarn end capture. The mean air usage at different pressures was calculated based on the flow rate measured by the electromagnetic proportional valve.
As shown in Table 4, the dynamic response of the yarn was greatly different at different pressures. With the inlet pressure increased from −0.04 MPa to −0.07 MPa, the s mean experimental adsorption time decreases from 6.32 ms to 5.25 ms. Meanwhile, the corresponding standard deviation first decreases and reaches its minimum at −0.06 MPa, indicating improved capture efficiency together with enhanced process stability. The results of numerical simulation and experimental measurement are consistent, confirming that the yarn adsorption efficiency is enhanced when the negative pressure is stronger. In addition, the numerical and experimental results both indicate that the mean yarn elongation increases with the suction strength, and it means that the stronger suction generates a larger aerodynamic traction force, which directs the yarn more effectively toward the nozzle and thereby improves capture reliability.
However, at −0.07 MPa, although the capture process becomes faster, the much larger transient acceleration and the more pronounced wall contact and lateral oscillations inside the nozzle make the instantaneous stretching path of the yarn more sensitive to initial disturbances. As a result, the dispersion of the total elongation increases instead of decreasing.
From the point of energy and performance, although the mean air usage increases slightly (from 43.1 mL to 50.45 mL), the f mean adsorption time becomes shorter, and the success rate increases significantly (from 86% to 100%). More importantly, the standard deviation of the adsorption time at −0.06 MPa is the smallest among all cases, indicating the best repeatability and overall process stability under this condition. When the negative pressure was insufficient, the yarn failed to enter the suction cup smoothly or stably. However, a larger negative pressure can overcome the disturbed airflow and the inertia of the yarn and reach a quick and steady capture. From the whole process, it is concluded that the −0.06 MPa to −0.07 MPa pressure window provides a favorable compromise between short mean adsorption time and acceptable experimental dispersion. From an engineering perspective, the recommended pressure window (−0.06 to −0.07 MPa) indicates that this operating range falls within a common working-vacuum range in industrial vacuum applications. Moreover, this level is well below the maximum vacuum achievable by the pump used in this study (up to −0.093 MPa, rated power 550 W), corresponding to about 65%−75% of its maximum vacuum level. Given these considerations regarding installed power requirements, the proposed operating window does not impose stringent additional demands on installed power. At the same time, this window provides a favorable compromise between capture stability and air usage. Therefore, for the practical application of an automatic yarn-end capturing process, this pressure range is recommended to achieve stable and high-performance adsorption.
Table 4: The simulated and experimental data of yarn adsorption.
| Negative Pressure Intensity (MPa) | Adsorption Simulation Time (ms) | Experimental Adsorption Time (ms, mean ± SD) | Numerical Simulation of Total Elongation (mm) | Experimental Total Elongation (mm, mean ± SD) | Average Air Consumption Index (mL) | Success Rate |
|---|---|---|---|---|---|---|
| −0.04 | 5.0 | 6.32 | 1.317 | 1.62 | 43.1 | 0.86 |
| −0.05 | 4.6 | 5.85 | 1.351 | 1.68 | 46.3 | 0.93 |
| −0.06 | 4.2 | 5.35 | 1.397 | 1.74 | 46.89 | 1 |
| −0.07 | 4.12 | 5.25 | 1.421 | 1.77 | 50.45 | 1 |
This work was focused on the dynamic behavior of yarn tips during adsorption under a negative-pressure jet by integrating numerical simulation and high-speed visualization experiments. The three-dimensional model of the suction device was established considering the airflow field and finite element yarn. The computed results were validated by experimental observation in a systematic way. The main conclusions could be summarized as follows:
- 1.The proposed weakly coupled fluid–structure interaction (FSI) method could reproduce the yarn-end trajectory with good accuracy. The agreement between the simulated and observed results could offer further support for the reliability and validity of the numerical model.
- 2.The quantitative analysis indicated that with the inlet suction pressure rising from −0.04 MPa to −0.06 MPa, the average adsorption time would decrease by nearly by 62%, and the capture success rate was higher, and the energy demand was acceptable. With the inlet suction pressure further enhanced to −0.07 MPa, the capture rate would be nearly perfect, but the overshoot and wall impact would occur more frequently. Meanwhile, the air consumption would increase markedly, which might damage fiber integrity and reduce energy efficiency.
- 3.The adsorption time and elongation obtained from experiments were slightly larger than those from the numerical simulation. The airflow fluctuation and three-dimensional effect might be the main reason. However, the tendency of the two datasets was basically the same, which could further validate the prediction of the simulation method.
In general, the negative pressure could enhance both efficiency and stability of adsorption. However, too much negative pressure would damage reliability. When energy consumption, operation efficiency and capture accuracy require a balance, the inlet pressure should operate in the pressure window of −0.06 to−0.07 MPa. With only a slight increase in air consumption, near-complete yarn-end capturing could be attained.
It should be noted that the present study still has several limitations. First, only one type of cotton yarn was investigated, and the applicability of the proposed model to yarns with different materials, linear densities, or surface characteristics remains to be further examined. Second, the effects of environmental factors such as humidity and temperature on the aerodynamic behavior and mechanical properties of the yarn were not considered. Finally, in the numerical simulations, the inlet negative-pressure jet was assumed to be steady, whereas under practical operating conditions, the flow may exhibit certain unsteady fluctuations. Future work will focus on addressing these issues to further improve the generality and predictive capability of the proposed modeling framework.
Acknowledgement:
Funding Statement: The authors received no specific funding.
Author Contributions: The authors confirm contribution to the paper as follows: Conceptualization, Xufeng Sun and Yisheng Liu; methodology, Xufeng Sun; software, Xufeng Sun; validation, Xufeng Sun, Yisheng Liu and Zhifeng Chen; formal analysis, Xufeng Sun; investigation, Xufeng Sun; resources, Zhifeng Chen; data curation, Xufeng Sun; writing—original draft preparation, Xufeng Sun; writing—review and editing, Yisheng Liu and Zhifeng Chen; visualization, Xufeng Sun; supervision, Yisheng Liu and Zhifeng Chen; project administration, Yisheng Liu. All authors reviewed and approved the final version of the manuscript.
Availability of Data and Materials: The data that support the findings of this study are available from the corresponding author upon reasonable request.
Ethics Approval: Not applicable.
Conflicts of Interest: The authors declare no conflicts of interest.
References
1. Celik O, Eren R. Experimental investigation of the relationship between the yarn tension and bobbin diameter in the warping process. Fibres Text East Eur. 2019;27(1(133)):23–31. doi:10.5604/01.3001.0012.7504. [Google Scholar] [CrossRef]
2. Wu T, Kemper M, Stemmler S, Abel D, Gries T. Model predictive control of the weft insertion in air-jet weaving. IFAC-PapersOnLine. 2019;52(13):630–5. doi:10.1016/j.ifacol.2019.11.094. [Google Scholar] [CrossRef]
3. Cui J, Zhu X, Xiao L, Zhu Z, Lin R, Hu X, et al. Dynamics of a long flexible filament conveyed in the near field of a turbulent jet. J Fluids Struct. 2025;133:104261. doi:10.1016/j.jfluidstructs.2024.104261. [Google Scholar] [CrossRef]
4. Kim JH, Setoguchi T, Kim HD. Numerical study of sub-nozzle flows for the weft transmission in an air jet loom. Procedia Eng. 2015;105:264–9. doi:10.1016/j.proeng.2015.05.107. [Google Scholar] [CrossRef]
5. Thomas GJ, Finckh H, Bauder HJ, Gresser GT. Exploring the drawbacks of main nozzle design in air-jet weaving: Current challenges and future directions. Alex Eng J. 2025;121:213–22. doi:10.1016/j.aej.2025.02.055. [Google Scholar] [CrossRef]
6. He S, Xue W, Chen G, Cheng L. Experimental investigation and simulation of the performance of a pre-twister based on the jet vortex field used for the ring spinning frame. Text Res J. 2019;89(21–22):4647–57. doi:10.1177/0040517519839938. [Google Scholar] [CrossRef]
7. Wang K, Xue W, Cheng L. A numerical and experimental study on a pre-twisted ring spinning system. Polymers. 2018;10(6):671. doi:10.3390/polym10060671. [Google Scholar] [CrossRef]
8. Han C, Cheng L, Gao W, Hua Z, Xue W. Numerical simulation of the fiber trajectories in vortex spinning under different process parameters based on the finite element model. Text Res J. 2019;89(13):2626–36. doi:10.1177/0040517518798650. [Google Scholar] [CrossRef]
9. Shang S, Yu C, Li M. Numerical simulation of swirling airflow dynamics in vortex spinning. Text Res J. 2018;88(7):833–43. doi:10.1177/0040517517690631. [Google Scholar] [CrossRef]
10. Ünal PG. Investigation of some handle properties of fabrics woven with two folded yarns of different spinning systems. Text Res J. 2010;80(19):2007–15. doi:10.1177/0040517510369410. [Google Scholar] [CrossRef]
11. Liu Y, Zhou X, Cheng X, Liu D. Effect of initial pressure of oblique-blowing airflow and folding-in airflow on yarn tucked-in in the pneumatic tucked-in selvedge apparatus. Text Res J. 2021;91(21–22):2635–55. doi:10.1177/00405175211013419. [Google Scholar] [CrossRef]
12. Liu Y, Zhou S, Zhou X. Effect of incident angle of oblique-blowing airflow on yarn in pneumatic tucked-in selvedge apparatus. J Text Inst. 2025;116(8):1763–78. doi:10.1080/00405000.2024.2400024. [Google Scholar] [CrossRef]
13. Geoffre A, Wielhorski Y, Moulin N, Bruchon J, Drapier S, Liotier PJ. Influence of intra-yarn flows on whole 3D woven fabric numerical permeability: From Stokes to Stokes-Darcy simulations. Int J Multiph Flow. 2020;129:103349. doi:10.1016/j.ijmultiphaseflow.2020.103349. [Google Scholar] [CrossRef]
14. Tian FB, Luo H, Zhu L, Liao JC, Lu XY. An efficient immersed boundary-lattice Boltzmann method for the hydrodynamic interaction of elastic filaments. J Comput Phys. 2011;230(19):7266–83. doi:10.1016/j.jcp.2011.05.028. [Google Scholar] [CrossRef]
15. Qian YH, D’Humières D, Lallemand P. Lattice BGK models for navier-stokes equation. Europhys Lett. 1992;17(6):479–84. doi:10.1209/0295-5075/17/6/001. [Google Scholar] [CrossRef]
16. Vahidkhah K, Abdollahi V. Numerical simulation of a flexible fiber deformation in a viscous flow by the immersed boundary-lattice Boltzmann method. Commun Nonlinear Sci Numer Simul. 2012;17(3):1475–84. doi:10.1016/j.cnsns.2011.07.039. [Google Scholar] [CrossRef]
17. Niu XD, Shu C, Chew YT, Peng Y. A momentum exchange-based immersed boundary-lattice Boltzmann method for simulating incompressible viscous flows. Phys Lett A. 2006;354(3):173–82. doi:10.1016/j.physleta.2006.01.060. [Google Scholar] [CrossRef]
18. Cui J, Lin Z, Jin Y, Liu Y. Numerical simulation of fiber conveyance in a confined channel by the immersed boundary-lattice Boltzmann method. Eur J Mech Fluids. 2019;76:422–33. doi:10.1016/j.euromechflu.2019.04.010. [Google Scholar] [CrossRef]
19. Pei Z, Yu C. Numerical study on the effect of nozzle pressure and yarn delivery speed on the fiber motion in the nozzle of Murata vortex spinning. J Fluids Struct. 2011;27(1):121–33. doi:10.1016/j.jfluidstructs.2010.08.007. [Google Scholar] [CrossRef]
20. Yamamoto S, Matsuoka T. A method for dynamic simulation of rigid and flexible fibers in a flow field. J Chem Phys. 1993;98(1):644–50. doi:10.1063/1.464607. [Google Scholar] [CrossRef]
21. Guo HF, Chen ZY, Yu CW. Numerical study of the function of the slotting-tube in air-jet spinning. J Text Inst. 2010;101(3):197–203. doi:10.1080/00405000802346321. [Google Scholar] [CrossRef]
22. Guo HF, Chen ZY, Yu CW. 3D numerical simulation of compressible swirling flow induced by means of tangential inlets. Int J Numer Meth Fluids. 2009;59(11):1285–98. doi:10.1002/fld.1872. [Google Scholar] [CrossRef]
23. Li Z, Shang Z, Zappa E, Van Langenhove L, Malengier B. Yarn level finite element method simulation for bending over sheaves of braided ropes. J Ind Text. 2023;53:1–17. doi:10.1177/15280837231189891. [Google Scholar] [CrossRef]
24. Zheng F, Chen F, Liu Y. Finite element modeling of spherical indentation behavior of 3D mesh fabric at the yarn level. J Ind Text. 2023;53:1–20. doi:10.1177/15280837231209502. [Google Scholar] [CrossRef]
25. Li Y, Wang F, Shi X, Guo L, Huang C. Impact response of 3D orthogonal woven composites with different fiber types. Appl Compos Mater. 2023;30(6):1819–40. doi:10.1007/s10443-023-10150-8. [Google Scholar] [CrossRef]
26. Deng W, Wang X, Ke W, Wang C, Deng Z. Parametric 3D simulations of spun yarns and fabrics. J Text Inst. 2024;115(9):1413–22. doi:10.1080/00405000.2023.2230326. [Google Scholar] [CrossRef]
27. Kargar M, Payvandy P, Mozafary V. Simulation of draping behavior of woven fabrics with an optimized yarn-level numerical model. Fibres Polym. 2023;24(7):2503–19. doi:10.1007/s12221-023-00240-6. [Google Scholar] [CrossRef]
28. Xu G, Chen Y, Sun Y, Zhang Y, Sun Y. Numerical modeling and analysis of yarn-end-capturing based on the immersed boundary-lattice Boltzmann method. Appl Math Model. 2024;129:70–87. doi:10.1016/j.apm.2024.01.045. [Google Scholar] [CrossRef]
29. Kong RWM, Liu M, Kong THT. Design and experimental study of vacuum suction grabbing technology to grasp fabric piece. OALib. 2024;11(11):1–17. doi:10.4236/oalib.1112292. [Google Scholar] [CrossRef]
30. Prezelj J, Novaković T, Čurović L, Železnik A, Murovec J. An energy-efficient vacuum system as an alternative to the inefficient use of compressed air for the yarn suction gun. J Text Inst. 2024;115(3):460–70. doi:10.1080/00405000.2023.2195978. [Google Scholar] [CrossRef]
31. Ahmed HAH, Afify RS, Hassanin AH, El-Hawary IA, Mashaly RI. Numerical and experimental study of the influence of nozzle flow parameters on yarn production by jet-ring spinning. Alex Eng J. 2018;57(4):2975–89. doi:10.1016/j.aej.2018.06.002. [Google Scholar] [CrossRef]
32. Maluta F, Paglianti A, Montante G. Numerical simulations of a compact inline gas–liquid separator: A comparison between RANS and a hybrid LES-RANS approach. Int J Multiph Flow. 2024;171:104697. doi:10.1016/j.ijmultiphaseflow.2023.104697. [Google Scholar] [CrossRef]
33. Ahn SH, Xiao Y, Wang Z, Luo Y, Fan H. Unsteady prediction of cavitating flow around a three dimensional hydrofoil by using a modified RNG k-ε model. Ocean Eng. 2018;158:275–85. doi:10.1016/j.oceaneng.2018.04.005. [Google Scholar] [CrossRef]
34. Osman A, Delcour L, Hertens I, Vierendeels J, Degroote J. Toward three-dimensional modeling of the interaction between the air flow and a clamped–free yarn inside the main nozzle of an air jet loom. Text Res J. 2019;89(6):914–25. doi:10.1177/0040517518758006. [Google Scholar] [CrossRef]
35. Delcour L, Peeters J, Degroote J. Three-dimensional fluid-structure interaction simulations of a yarn subjected to the main nozzle flow of an air-jet weaving loom using a Chimera technique. Text Res J. 2020;90(2):194–212. doi:10.1177/0040517519862884. [Google Scholar] [CrossRef]
36. Song J, Kharoua N, Khezzar L, Alshehhi M. Numerical simulation of turbulent swirling pipe flow with an internal conical bluff body. Fluid Dyn Mater Process. 2021;17(2):455–70. doi:10.32604/fdmp.2021.014370. [Google Scholar] [CrossRef]
37. Liu J, Zeng Y, Zhao X, Chen H, Yan B, Lu Q. Influence of spray gun position and orientation on liquid film development along a cylindrical surface. Fluid Dyn Mater Process. 2023;19(10):2499–518. doi:10.32604/fdmp.2023.028413. [Google Scholar] [CrossRef]
38. Zhang D, Zhao B, Zhu K. Dynamic analysis of pipeline lifting operations for different current velocities and wave heights. Fluid Dyn Mater Process. 2023;19(3):603–17. doi:10.32604/fdmp.2022.023919. [Google Scholar] [CrossRef]
Cite This Article
 Copyright © 2026 The Author(s). Published by Tech Science Press.
This work is licensed under a Creative Commons Attribution 4.0 International License , which permits unrestricted use, distribution, and reproduction in any medium, provided the original work is properly cited.
 Downloads
 Citation Tools