
 Login
Login Register
 Submit a Paper
 Propose a Special lssue
 Open Access
ARTICLE
CFD–DEM Investigation of Material Composition Effects on the Transportability of While-Drilling Lost Circulation Materials in Directional Tools
1 Sinopec Shanghai Offshore Oil & Gas Company, Shanghai, China
2 Hubei Key Laboratory of Oil and Gas Drilling and Production Engineering, Yangtze University, Wuhan, China
* Corresponding Author: Lei Pu. Email:
(This article belongs to the Special Issue: Fluid and Thermal Dynamics in the Development of Unconventional Resources IV)
Fluid Dynamics & Materials Processing 2026, 22(5), 8 https://doi.org/10.32604/fdmp.2026.081184
Received 25 February 2026; Accepted 28 April 2026; Issue published 27 May 2026
 View Full Text
 Download PDF
Abstract
The passability (transport behavior) of while-drilling lost circulation materials (LCMs) through directional tools is strongly influenced by material composition and particle characteristics. In this study, a coupled computational fluid dynamics–discrete element method (CFD–DEM) model is developed to systematically evaluate the effects of particle size distribution, concentration, morphology, and fiber inclusion on LCM transport behavior. Visualization experiments conducted using a transparent screen section demonstrate good agreement with the simulated pressure-drop evolution, supporting the validity of the model. The results reveal that increasing particle size from 1.2–1.6 mm to above 2.8 mm shifts the system from a stable transport regime to one with a high risk of plugging, even at relatively low concentrations. Plugging risk rises markedly when particle concentration exceeds 30–35%. Multimodal particle size distributions enhance transport performance, achieving efficiencies of approximately 0.07%, compared with less than 0.035% for monomodal systems. Irregular particle shapes increase force-chain normal forces from 0.009–0.010 N to 0.017–0.020 N, while fiber inclusion significantly reduces steady-state flow velocity from about 1.6–1.7 m/s to below 0.6 m/s, thereby diminishing passability.Graphic Abstract
Keywords
Deep and ultra-deep wells, extended-reach horizontal wells, and high-displacement wells are increasingly deployed worldwide in oil and gas exploration and development. Under increasingly complex geological conditions and challenging operational environments, lost circulation has become one of the most critical drilling complications. This issue not only results in substantial non-productive time (NPT) but also poses serious risks of well control incidents and potential wellbore abandonment [1,2,3]. To mitigate losses without interrupting drilling or pumping operations, lost circulation materials while drilling (LCM) are widely applied. Unlike conventional squeeze-injection lost circulation techniques, while-drilling LCM are required to effectively seal fractures and vugs while simultaneously maintaining drilling fluid pumpability, ensuring sufficient cuttings transport efficiency, and minimizing interference with logging-while-drilling and directional control systems. These combined requirements impose more stringent constraints on LCM material design and evaluation methodologies [4,5,6].
The rapid development and widespread application of directional drilling systems, particularly rotary steerable systems (RSS), have significantly enhanced drilling efficiency and wellbore trajectory control accuracy in complex well types [6,7]. However, these downhole tools are typically characterized by intricate geometries and narrow annular clearances. When multi-component lost circulation materials (LCMs) are circulated through these confined spaces, particle bridging, solid accumulation, or localized blockage is likely to occur at tool surfaces or constricted sections. These phenomena may result in sudden pressure fluctuations, degraded steering performance, abnormal increases in torque and drag, and, in severe cases, stuck pipe or tool failure [8]. Consequently, the passability and compatibility of drilling lost circulation materials (LCMs) within the annulus surrounding directional tools have emerged as critical constraints that must be prioritized during LCM formulation design [9].
Current research on LCMs predominantly focuses on enhancing sealing efficiency and temperature/pressure resistance, including the development of granular, fibrous, elastically deformable particles, and multimodal particle-size systems, to improve fracture-bridging efficiency, pressure-bearing capacity, and long-term sealing stability [10]. Evaluation methodologies are primarily based on laboratory-scale bridging tests, fluid loss assessments, and bulk rheological characterization [11,12]. However, these design paradigms and evaluation metrics are largely grounded in the requirements for sealing formation fractures or vugs, with limited consideration of flow behavior under the complex geometric constraints imposed by modern rotary steerable systems (RSS) and restricted flow channels [13,14,15]. Existing engineering guidelines for LCM passability remain predominantly empirical, such as simplistic limits on maximum particle size or solid content ranges, and fail to comprehensively capture the coupled effects of tool geometry, flow-field distribution, and particle-laden suspension systems.
In practical applications, the design of multi-component LCMs for RSS operations is subject to intrinsic contradictions and constraints: on one hand, broad particle-size distributions, the incorporation of fibers and elastic particles, and high solid content facilitate rapid bridging of heterogeneous loss zones and enhance sealing strength and durability [16,17,18]; on the other hand, these characteristics substantially increase the risks of particle bridging, sedimentation, and excessive pressure drops in narrow annuli and tool clearances, thereby compromising system passability and operational safety. Due to the lack of quantitative understanding of these competing effects, field practices often adopt conservative strategies—either reducing particle size and concentration at the cost of insufficient sealing performance or overly constraining the material system to prioritize passability over sealing efficacy [19,20,21]. This situation underscores an urgent need for a systematic design and evaluation framework that balances effective sealing and adequate passability.
This study addresses the design and numerical simulation-based evaluation of multi-component LCM passability in rotary steerable systems. An LCM formulation optimization approach is proposed, in which the geometric constraints of RSS tools and annular flow-field characteristics are explicitly considered. A three-dimensional numerical model of fluid–particle flow in representative RSS–wellbore configurations is developed to systematically investigate the effects of particle size distribution, volume fraction, and LCM type on flow patterns, pressure drop characteristics, and bridging tendencies in critical constricted regions. By integrating sealing performance requirements, a design window and a passability evaluation method are established for multi-component LCMs in RSS applications. The findings provide mechanistic insights and quantitative guidance for the integrated design of LCMs and RSS tools, offering significant engineering value for enhancing drilling safety and efficiency in complex formations and high-risk loss circulation scenarios.
2.1 CFD–DEM Coupled Model for Non-Newtonian Fluids Containing Lost Circulation Particles
To quantitatively characterize the flow behavior and particle bridging mechanisms of multi-component lost circulation materials within the narrow annulus surrounding rotary steerable systems (RSS), a coupled computational fluid dynamics (CFD)–discrete element method (DEM) framework is employed. The continuous fluid phase is resolved using ANSYS Fluent, while the motion of solid lost circulation particles is explicitly tracked using DEM, implemented in EDEM. Momentum exchange between the fluid and particle phases is achieved through a coupling interface, enabling integrated simulation of particle-laden non-Newtonian flow fields and realistic particle–particle interaction processes, including contact, accumulation, and bridge formation [22,23].
2.1.1 Continuous Fluid Phase Model
The continuous phase is assumed to be a non-Newtonian drilling fluid system containing lost circulation materials, under the following assumptions: the fluid is incompressible and isothermal; the lost circulation particles are independently described using the DEM, with their volume-fraction feedback to the flow field accounted for through source terms within the scope of this study; and the local Reynolds number is evaluated based on the equivalent viscosity, with most operating conditions lying within the laminar or weakly turbulent regime.
The governing equations consist of the mass and momentum conservation equations, expressed as follows:
When the RANS model is applied, the additional Reynolds stress term
2.1.2 Discrete Element Model for the Particle Phase
The transportability of multi-component lost circulation materials during drilling is fundamentally governed by particle migration, collision, accumulation, and bridging evolution within the narrow annulus near drilling guidance tools. To accurately characterize the micromechanical responses of diverse lost circulation particles and fibers within complex geometric configurations, a discrete element model is established in EDEM, incorporating representative material classifications, contact models, and fluid-coupling interactions. The particle concentration considered in this study ranges from 5% to 30% in mass concentration, covering typical operating conditions of while-drilling LCM applications.
- (1)Equations of Particle Motion
The translational and rotational motion of an individual particle is governed by the following equations:
- (2)Contact Force Model
Particle–particle and particle–wall contacts are modeled using the Hertz–Mindlin contact model to describe normal and tangential contact behaviors. The normal contact force is described by the Hertzian contact model, expressed as:
- (3)Tangential Contact Force (Mindlin–Deresiewicz Model)
- (4)Rolling Resistance and Rotational Friction
To more accurately describe stable particle packing and bridge formation within narrow annuli, a rolling resistance model is introduced, expressed as:
The fluid drag force is calculated based on the local flow field provided by ANSYS Fluent and is expressed as:
At each coupling time step, the local velocity field and fluid properties are transferred from Fluent to the DEM solver for the calculation of fluid forces acting on particles. The reaction forces computed by DEM are volume-averaged and returned as the source term SDEM, thereby achieving two-way coupling between the fluid and particle phases and explicitly capturing particle transport, local retention, and progressive bridge formation under different formulations and operating conditions.
3 Model Construction and Validation
3.1 Wellbore Geometry and Model Construction
The localized geometric model of the drilling tool filter was constructed based on the structural parameters of a field-deployed 5-in. drill pipe filter (see Fig. 1). The filter body is composed of a tapered cylindrical section and inflow channels, with the outer diameter progressively decreasing from the inlet to the outlet. Uniformly distributed circular holes are arranged along the filter body, serving as the primary pathways for fluid and particle passage. In the numerical model, the total filter length, inlet and outlet diameters, taper length, hole diameter, and hole spacing were strictly reproduced according to the design drawings, ensuring that the minimum flow area matched that of the actual tool. To reduce computational cost and emphasize localized features most critical to passability, minor structural details, such as threaded connections, were appropriately simplified. The filter, together with adjacent upstream and downstream drill pipe segments, was incorporated into a representative annular flow domain to simulate the transport, retention, and bridging behavior of multicomponent lost circulation materials around this typical constricted and perforated structure.
As a critical flow-restricting component in the RSS bottom-hole assembly, the filter section forms the narrowest annular gap with the surrounding borehole, making it a key region for evaluating the passability of multicomponent LCMs and assessing potential blockage risks.

Figure 1: Geometry of the 5″ drill pipe filter used for CFD–DEM simulations.
This Fig. 1 illustrates a simplified geometric schematic of a 5-in. drill pipe screen used in CFD–DEM numerical simulations. The screen is composed of a left-side connection segment, a tapered conical filtering section, and a right-side outlet segment, with an overall length of approximately 552 mm. The outer diameter is 104 mm at the inlet end and 37 mm at the outlet end. A series of circular perforations with a diameter of 5 mm is arranged along the midsection of the conical segment, serving as the primary fluid inlet channels. This region represents a critical zone in which lost circulation materials are prone to retention and bridging. In the diagram, the black outlines delineate the external profile of the screen, red annotations indicate key structural dimensions, and the blue perforations highlight flow-restricting regions of interest for analyzing the passability of multicomponent lost circulation materials during drilling operations. For detailed numerical investigation, a localized segment corresponding to the potential blockage zone is extracted from this structure (see Fig. 2). The geometry in Fig. 2 is therefore intentionally simplified and does not represent the full-scale configuration, but rather a representative region used to improve computational efficiency and better capture the blockage mechanisms.

Figure 2: Geometry and finite-element mesh of the while-drilling directional tool.
The Fig. 2 illustration illustrates a simplified schematic of a 5-in. drill pipe screen geometry used in CFD–DEM numerical simulations. The screen assembly is composed of a left-side connection segment, a tapered conical filtering section, and a right-side outlet segment, with an overall length of approximately 552 mm. The outer diameter is 104 mm at the inlet and 37 mm at the outlet. A series of circular perforations with a diameter of 5 mm is arranged along the mid-region of the conical segment, serving as the primary inflow pathways and representing critical zones prone to particle accumulation and bridging of lost circulation materials. In the diagram, black lines delineate the external contour of the screen, red annotations indicate key structural dimensions, and blue circles highlight restricted flow regions relevant to the analysis of multicomponent lost circulation material transportability during drilling operations. The geometric model was constructed at a 1:1 scale with respect to the actual tool dimensions. The overall computational domain measures 0.0446 m × 0.1805 m × 0.0446 m, containing 54,891 boundary faces and 61,478 boundary nodes.
To ensure that the numerical results are independent of mesh resolution, a mesh sensitivity analysis was conducted. Three mesh densities were generated, including coarse, medium, and fine grids, with approximately 0.82 million, 1.53 million, and 2.28 million cells, respectively. A representative operating condition (particle diameter of 2.6 mm, total LCM volume fraction of 15%, and inlet velocity of 1.0 m/s) was selected to evaluate the effect of mesh refinement. Key variables, including pressure drop and average flow velocity, were monitored, as summarized in Table 1. As the mesh was refined from medium to fine, the variation in pressure drop was less than 2%, and the variation in average flow velocity was approximately 1%. These results indicate that the numerical solution has achieved mesh-independent convergence. Therefore, the medium mesh was adopted for all subsequent simulations to ensure a balance between computational efficiency and numerical accuracy.
Table 1: Mesh sensitivity analysis.
| Mesh Level | Number of Cells | Variation (%) | Average Velocity (m/s) | Variation (%) |
|---|---|---|---|---|
| Coarse | 0.82 million | – | 1.61 | – |
| Medium | 1.53 million | 2.48% | 1.65 | 2.42% |
| Fine | 2.28 million | 1.22% | 1.67 | 1.20% |
To characterize the flow behavior and passability of multi-component LCMs under typical drilling conditions, a velocity inlet boundary condition is applied at the screen entrance, with simultaneous specification of the total particle volume fraction and particle-size distribution. Specifically, the fluid properties were selected with reference to the field-applied drilling fluid system in the third drilling section of the Ledong block, China. The fluid density was set to 1500 kg/m3, and an apparent viscosity of 0.03 Pa·s at a representative shear rate was used as a reference value. The full non-Newtonian rheological behavior was obtained from laboratory measurements and described by the Herschel–Bulkley model. The total LCM volume fraction is set within the range of 5–25%, with five representative values (5%, 10%, 15%, 20%, and 25%) selected to represent scenarios ranging from conventional preventive dosing to extreme high-concentration loss-control operations. Under each condition, multicomponent particles (rigid, elastic, and fibrous) are introduced uniformly and randomly at the inlet cross-section according to predefined volume-fraction ratios, while maintaining a constant injection rate [24,25]. The inlet superficial velocity uin is assigned several representative values within the range of 1.0–3.0 m/s, corresponding to a field pumping rate of approximately 15–35 L/s for a 5″. drill pipe section. This ensures that the numerical simulations are both engineering-representative and sufficiently sensitive to capture particle accumulation and bridging tendencies. A no-slip boundary condition is applied to the tool and screen surfaces, and a 150 rpm axial rotation is incorporated in selected cases to account for shear effects during drilling. The gravity term is activated in the simulations to account for potential particle settling and local enrichment of different particle sizes in low-velocity regions [26,27].
The above inlet conditions and parameter configurations, with key parameters summarized in Table 2, provide a consistent and reproducible simulation framework for the subsequent systematic analysis of the effects of LCM concentration, particle-size distribution, and flow rate on material passability.
Table 2: Input parameters of CFD-DEM numerical simulation.
| DEM Parameters | Values | CFD Parameters | Values |
|---|---|---|---|
| Particle diameter (mm) | 1.2~3.2 | Fluid density (kg/m3) | 1500 |
| Particle density (kg/m3) | 2000 | Fluid dynamic viscosity (Pa·s) | 0.03 |
| Particle Young’s modulus (Pa) | 1.0 × 10⁸ | Inlet superficial velocity (m/s) | 1.0 |
| Particle Poisson’s ratio | 0.30 | Outlet boundary | Pressure outlet |
| Particle–particle static friction coefficient | 0.70 | Gravity acceleration (m/s2) | 9.81 |
| Particle–particle dynamic friction coefficient | 0.50 | Tool rotation speed (rpm) | 0 or 150 |
| Particle–wall restitution coefficient | 0.30 | Total LCM volume fraction (%) | 5–25 |
| Particle–wall static friction coefficient | 0.90 | ||
| Particle–wall dynamic friction coefficient | 0.60 |
To further validate the CFD–DEM model, a visualization experiment was carried out using a transparent filter screen section corresponding to the computational domain. The pressure drop reported in Fig. 3 refers to the pressure difference between the inlet and outlet boundaries of the test section associated with the potential blockage zone. The experimental model was constructed at a 1:1 scale with the simulated geometry. In both the experiment and the CFD–DEM simulation, the particle diameter was set to 2.6 mm, the concentration of multicomponent LCMs was 15%, the inlet fluid velocity was 1.0 m/s, and the fluid dynamic viscosity was 0.03 Pa·s. Under identical operating conditions, the temporal evolution of pressure drop was recorded and compared with the numerical results.

Figure 3: Comparison of experimental measurements and CFD–DEM simulations of pressure drop evolution during screen blockage.
As illustrated in Fig. 3, the time evolution of pressure drop during screen clogging obtained from experiments and CFD–DEM simulations is compared. Strong agreement is observed in the overall trend and key phase characteristics. In the initial stage (0–4 s), the pressure drop increases gradually, corresponding primarily to particle entry into pore throats and dispersed deposition. The experimental and simulated curves are nearly coincident during this period. Subsequently (approximately 4–7 s), the pressure drop rises rapidly, indicating the formation of bridging structures at the screen pores and the onset of localized clogging. The numerical simulation predicts the sharp increase in pressure drop slightly earlier than that observed experimentally, but the discrepancy remains minor. In the final stage, the pressure drop stabilizes, and the simulated steady-state pressure drop is consistent with the experimental measurement, indicating that the CFD–DEM model can reasonably capture the flow-restricted behavior after clogging structure formation. Overall, the CFD–DEM model demonstrates satisfactory capability in predicting the temporal evolution of pressure drop during screen clogging, thereby validating its effectiveness in simulating localized clogging and bridging dynamics.
4.1 Flow Field and Particle Migration Characteristics under Typical Operating Conditions
Under typical operating conditions, a numerical investigation was conducted to examine the structure of the fluid flow field and particle migration behavior, with particular emphasis on the spatial distribution of distinct flow regions under plugged and unplugged conditions and their influence on particle motion. The primary focus includes the formation characteristics of the mainstream zone, recirculation zone, and low-velocity stagnant zone, as well as particle migration paths, accumulation locations, and evolution processes within these flow regions. This analysis provides a basis for elucidating the coupling mechanisms between the flow field and particle migration behavior.
In addition to the particle trajectories, the fluid-flow field in the screen section exhibits clear spatial heterogeneity due to the combined effects of geometric contraction and perforated-wall disturbance. The central region of the tool forms the mainstream zone, where the axial velocity remains relatively high and provides the dominant transport capacity for the particles. In contrast, near the perforated wall and in the vicinity of abrupt geometric transitions, local low-velocity and disturbed-flow regions develop. These regions weaken the local carrying capacity of the fluid and increase the residence time of particles, thereby creating favorable conditions for particle deviation, transient retention, and subsequent accumulation.
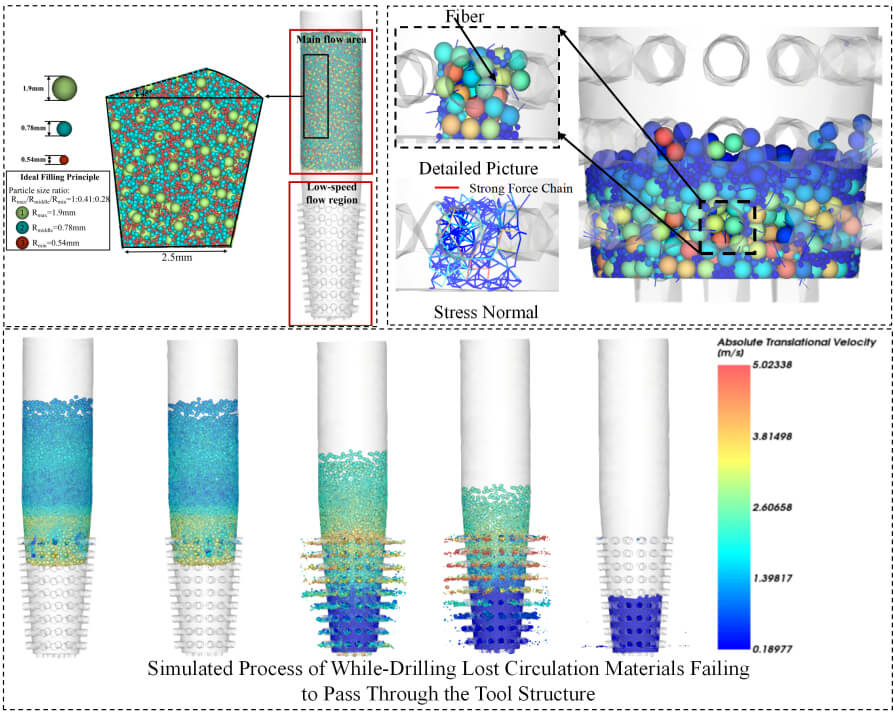
As illustrated in Fig. 4, the lost circulation particles system is released from the upper region of the tool, which simultaneously functions as both a particle generation zone and an initial transport zone. The particle size distribution is designed based on the ideal packing theory to characterize the differential migration behavior of particles of varying sizes under the influence of the flow field. Driven by fluid flow, the particles travel along the main flow direction into the internal pore structure of the tool and progressively migrate toward narrow channel regions prone to blockage. By observing the trajectories and spatial distribution of the particles within the tool, an analysis is conducted to determine whether the particles can pass through the tool structure unobstructed or if they tend to accumulate and cause clogging at the tool tip or pore-throat sections.

Figure 4: Flow regions of while-drilling lost circulation materials passing through downhole tools.
4.1.1 Particle Migration and Evolution under Unplugged Conditions
Fig. 5 shows the transient evolution of particle transport in the drill pipe screen section under unplugged conditions. At the initial stage, lost circulation particles enter the tool and move predominantly downward along the main flow direction with relatively high translational velocity under the drag of the carrier fluid. In the upstream section, particle distribution remains relatively uniform, and their motion is mainly governed by convective transport, with weak particle–particle and particle–wall interactions. As the particles migrate downstream, geometric contraction, perforated-wall disturbance, and local structural discontinuities give rise to localized low-velocity or weakly disturbed-flow regions near the screen holes and wall surfaces, causing minor trajectory deflections and short-term particle retention. Consequently, a particle-rich zone may temporarily develop in the vicinity of the perforated section, where local particle mobility is reduced. However, due to the persistence of a continuous high-velocity transport channel through the main flow passage, most particles are readily re-entrained into the mainstream under fluid shear and drag forces. High-velocity particles are therefore mainly concentrated in the central flow channel, whereas low-velocity particles are distributed near wall surfaces and localized disturbed regions. Although some retained particles appear near the lower part of the screen section in the later stage, no stable load-bearing contact network or persistent bridging structure is formed at the tool tip or pore throats. This indicates that the low-velocity regions remain limited in both size and intensity, and the carrying capacity of the mainstream is still sufficient to maintain overall particle passability through the screen structure under the present operating conditions.

Figure 5: Simulated Process of while-drilling lost circulation materials passing smoothly through the tool structure. (a) t = 0.00 s, (b) t = 0.10 s, (c) t = 0.20 s, (d) t = 0.30 s, (e) t = 0.40 s.
As illustrated in Fig. 6, during the passage of lost circulation materials through the tool under drilling conditions, the average axial velocity and static pressure exhibit distinct transient responses followed by stabilization. In the initial phase (t < 0.1 s), the average static pressure rapidly increases from near zero to approximately (1.4–1.6) × 104 Pa and quickly stabilizes, indicating that the pressure field within the tool flow channels is established within a short duration. Concurrently, the average axial velocity exhibits pronounced fluctuations during this initial stage, reaching an instantaneous peak of approximately −0.06 m/s, followed by rapid attenuation. Between 0.2 s and 1.0 s, the average axial velocity decreases to approximately −0.01 to −0.02 m/s, reflecting flow disturbances induced by particles passing through pore throats and structurally discontinuous regions. With further progression in time (t > 1.0 s), the average axial velocity gradually stabilizes at approximately −0.025 to −0.030 m/s, while the average static pressure remains steady at around 1.5 × 10⁴ Pa, exhibiting only minor fluctuations. These findings indicate that under non-plugging conditions, particle passage induces only transient perturbations in the flow field, while the main flow channels remain continuously unobstructed, and the overall flow maintains a stable transport regime.

Figure 6: Evolution characteristics of flow velocity and pressure during the passage of while-drilling lost circulation materials through the tool.
4.1.2 Particle Flow Rate Evolution under Plugged Conditions
The transition from smooth particle transport to blockage is closely associated with the progressive redistribution of the local fluid-flow field within the tool. As illustrated in Fig. 7, under plugged conditions, lost circulation particles gradually accumulate in the lower perforated section and near the tool tip, reducing the effective flow area and forcing the carrier fluid to pass through fewer remaining open channels. As a result, the velocity contrast between the residual high-speed flow paths and the surrounding low-velocity particle-rich regions becomes increasingly pronounced. During the initial stage, particles can still enter the tool interior under fluid drag; however, their velocities decrease significantly near pore throats and geometrically abrupt regions, leading to the gradual expansion of low-velocity particle zones. As particle retention intensifies, these regions progressively evolve into a dense retained particle bed in the lower section of the tool, where particle mobility is markedly reduced. At this stage, particle transport is no longer governed primarily by fluid drag, but increasingly controlled by persistent particle–particle contacts, particle–wall friction, and local structural constraints. The main flow channel is therefore progressively constricted, while enhanced contact interactions shift the transport mechanism from fluid-driven migration to a contact-dominated, load-bearing state. In the final stage, a stable low-velocity accumulation zone is formed in the lower part of the tool, and downward particle migration nearly ceases, indicating that a stable sealing structure has been fully established. These results demonstrate that blockage development in the tool is essentially a coupled hydrodynamic–contact-mechanical process rather than a simple static deposition phenomenon.

Figure 7: Simulated process of while-drilling lost circulation materials failing to pass through the tool structure.
Fig. 8 further reveals the hydrodynamic response associated with blockage development inside the tool. Under conditions where the while-drilling lost circulation materials cannot pass smoothly through the screen section, the average axial velocity and static pressure exhibit evolution characteristics distinctly different from those under unplugged conditions. During the initial stage (t < 0.05 s), the average static pressure rises rapidly from near zero to approximately (1.8–2.0) × 104 Pa, followed by a decrease and stabilization within the range of (1.2–1.4) × 104 Pa, reflecting a transient pressure response induced by flow restriction after particle ingress. Meanwhile, the average axial velocity increases sharply to a transient peak of about −0.05 m/s and remains within −0.03 to −0.04 m/s during 0.05–0.25 s.

Figure 8: Evolution of flow velocity and pressure during failed passage of while-drilling lost circulation materials through the tool.
As the sealing structure progressively develops (t ≈ 0.3–0.5 s), the average axial velocity rises further to approximately −0.08 to −0.09 m/s and then fluctuates around this level. This sustained increase in local velocity does not indicate improved transportability; rather, it reflects the progressive reduction of the effective flow area and the concentration of fluid flow into a limited number of residual narrow channels after partial blockage has formed. Correspondingly, the pressure response indicates that the dominant flow resistance is gradually transferred from distributed minor losses to localized constriction-controlled losses. These results demonstrate that blockage initiation is accompanied by a fundamental restructuring of the internal flow field, in which the transport mode shifts from continuous bulk passage to confined channel flow, and the sealing effect is progressively established and stabilized.
4.1.3 Local Particle Bridging Formation and Pressure Drop Response in Narrow Regions
As illustrated in Fig. 9, within a confined region, lost circulation particles progressively accumulate and form localized bridging structures during transport with the drilling fluid. The local pressure and tool structural stress exhibit a distinct stage-wise evolution. During the initial sealing phase (t < 0.1 s), the maximum local static pressure increases rapidly to approximately (3–4) × 104 Pa, reflecting a sharp increase in flow resistance caused by the constriction of flow passages. As the bridging structure stabilizes (t ≈ 0.1–0.4 s), the local maximum static pressure further increases and reaches a plateau at approximately 5 × 10⁴ Pa. Concurrently, pronounced stress concentration is observed in the tool structure within the constricted zone, with high stress primarily distributed at particle–tool contact interfaces. These results indicate that geometric constraints imposed by the narrow flow channel provide favorable spatial conditions for directional particle accumulation, promoting the progressive establishment of local bridging structures. This process directly induces a rapid increase in flow resistance, manifested as a sharp rise in local pressure.

Figure 9: Evolution of local pressure and tool stress during particle plugging in narrow regions.
Combined with the evolution of local pressure, the normal-force response further reveals the microscale mechanical process of bridging formation in the constricted region. As shown in Fig. 10, the development of plugging can be divided into four successive stages: particle migration toward the narrow section, local accumulation induced by flow deceleration, rapid particle rearrangement accompanied by strong contact-force fluctuations, and eventual stabilization into a force-chain-supported load-bearing structure. During the initial stage (t ≤ 0.2 s), the normal force exhibits pronounced fluctuations, reaching a peak value of approximately 8 × 10⁻⁴ N. This stage corresponds to the rapid aggregation and rearrangement of particles within the constricted region, as evidenced by the locally enlarged particle distribution shown on the right side of Fig. 10. As particles migrate into the narrow flow channel, interparticle contact and compressive interactions intensify rapidly, leading to frequent collisions, force redistribution, and sharp oscillations in the normal force. With the progressive formation of a local bridging structure, the particle contact network gradually evolves from transient collision-dominated interactions to a relatively balanced force state. Consequently, the fluctuation amplitude of the normal force decreases and eventually approaches a stable plateau, indicating that the local contact network has developed into a mechanically stabilized load-bearing skeleton. These results indicate that plugging formation is not a simple deposition process, but a contact-mechanical evolution driven by pressure redistribution and particle interactions.

Figure 10: Evolution of local pressure and internal structural stress during particle plugging in narrow regions.
4.2 Effects of Particle Size and Concentration on Plugging Risk in While-Drilling Tools
4.2.1 Different Passability States of While-Drilling Lost Circulation Materials Inside the Tool
As illustrated in Fig. 11, a comparative analysis was performed on the temporal evolution of the average axial velocity under three typical passability states of while-drilling lost circulation materials: free-flow, close toplugging, and plugging. All three states exhibit distinct velocity peaks during the initial transient phase (t < 0.1 s), but marked differences are observed in their subsequent evolution.

Figure 11: Different passability states of while-drilling lost circulation materials within the tool.
Under free-flow conditions, the average axial velocity exhibits a brief initial peak, reaching approximately −0.9 m/s, followed by rapid decay toward zero. This behavior indicates that particles pass smoothly through the tool structure without inducing sustained blockage in the main flow channel, allowing the flow field to rapidly return to a stable transport state. In the near-plugging state, the initial velocity peak increases significantly, reaching approximately −1.5 to −1.6 m/s. Although the velocity decreases rapidly thereafter, it remains at a low but non-zero level (approximately −0.05 m/s) in the subsequent phase. This pattern suggests that particles induce significant disturbances within the narrow regions of the tool, leading to markedly reduced passability; however, a fully stabilized plugging structure has not yet formed.
In contrast, under plugging conditions, the initial transient velocity peak reaches the highest value, exceeding −1.7 m/s. Subsequently, the average axial velocity does not decay toward zero but gradually increases and stabilizes at approximately −1.6 m/s. This observation indicates that, as the plugging structure forms, the effective flow area inside the tool is significantly reduced. Consequently, the fluid is forced through the remaining narrow channels, resulting in a persistently elevated local flow velocity, which reflects the characteristic flow behavior of a constricted channel.
4.2.2 Risk Assessment of Particle Passage through While-Drilling Tools for Different Particle Sizes and Concentrations
As illustrated in Fig. 12, a zonal assessment of plugging risk was performed based on the passability performance of LWD tools under varying particle sizes and concentrations. The results delineate three distinct risk zones: the Safe Zone, Transition Zone, and High-Risk Zone. The findings indicate a significant coupled effect between particle size and concentration on plugging risk. For smaller particle sizes (approximately 1.2–1.6 mm), the system remains within the Safe Zone when the particle concentration is below approximately 10%–15%. As the concentration increases to approximately 20%–30%, the system transitions into the Transition Zone, and when the concentration exceeds approximately 30%–35%, it enters the High-Risk Zone. With increasing particle size, the plugging risk zones shift markedly toward lower concentration ranges. At particle sizes of 2.0–2.5 mm, the Safe Zone is restricted to low concentrations of ≤5%–8%. When the particle size further increases to ≥2.8 mm, the system tends to enter the Transition Zone or even the High-Risk Zone, even at relatively low concentrations. Overall, the plugging risk of LWD tools is jointly governed by particle size and concentration, exhibiting a clear coupling relationship. An increase in particle size significantly narrows the safe operating window, thereby heightening the plugging risk even under lower concentration conditions. This provides a quantitative basis for optimizing particle size distribution and dosage control of lost circulation materials in LWD operations.

Figure 12: Risk assessment of particle passage through while-drilling tools for different particle sizes and concentrations.
4.3 Effects of Multimodal Particle Size Distributions on Plugging Risk in While-Drilling Tools
Fig. 13 illustrates the particle migration and accumulation behaviors of multimodal particle size distributions during passage through the while-drilling tool. The parameter η is introduced to characterize particle transport efficiency and the associated plugging risk of the downhole tool during drilling operations, as defined in Eq. (10). A higher value of η indicates that only a small proportion of particles entering the tool are successfully discharged, implying an elevated risk of particle retention and clogging within the tool.

Figure 13: Analysis of particle migration states during passage through the tool.
A comparative evaluation of the transportability of the lost circulation material system within the downhole tool was conducted using various particle size distributions listed in Table 3.
Table 3: Passability evaluation of while-drilling LCM systems with monomodal and multimodal particle size distributions in while-drilling tools.
| Type | Particle Size Combination (mm) | Passability State |
|---|---|---|
| Monomodal particle size | 2.1 | High risk |
| Trimodal particle size combination | 2.1-0.8694-0.4725 | Low risk |
Fig. 14 presents a comparative analysis of the transport efficiency evolution under two distinct systems: monomodal (“Single Particles”) and multimodal (“Multiple Particles”) particle systems. Both systems exhibit an initial peak in entry efficiency during the transient phase (t < 0.1 s); however, their subsequent evolutionary trends differ markedly.

Figure 14: Transport efficiency of monomodal and multimodal particle size combinations in the tool.
In the monomodal particle system, the peak entry efficiency ranges from approximately 0.03% to 0.035%, after which it rapidly declines toward zero. This behavior indicates that monodisperse particles are prone to accumulation within narrow sections of the tool, making the establishment of a sustained flow path difficult. In contrast, the multimodal particle system exhibits a higher initial peak, reaching approximately 0.05%–0.055%, with entry efficiency remaining stable over a prolonged period within the range of 0.03%–0.06%. A maximum efficiency of nearly 0.07% is attained at t ≈ 0.8–1.2 s. These observations suggest that cooperative interactions among multi-scale particles contribute to maintaining a stable flow passage. Overall, the results demonstrate that multimodal particle blends significantly enhance overall particle transport capability within the tool, not only increasing the peak entry efficiency but also extending the duration of effective transport.
As illustrated in Fig. 15, under both monomodal and multimodal particle size distribution conditions, the average fluid velocity inside the tool exhibits a pronounced surge during the initial transient phase (t < 0.1 s), albeit with significant differences in peak magnitude. Under the monomodal particle size condition, the peak average fluid velocity approaches approximately 2.0 m/s and subsequently decays rapidly, indicating that uniform-sized particles tend to induce localized flow constriction in narrow regions of the tool, thereby generating transient high-velocity flow. In contrast, under multimodal particle size conditions, the peak velocity is markedly lower, reaching approximately 0.9–1.0 m/s, accompanied by faster attenuation and improved flow-field stability. These findings demonstrate that multimodal particle size distributions effectively suppress transient high-velocity flow inside the tool, thereby enhancing flow stability and reducing the risk of clogging.

Figure 15: Average fluid velocity inside the tool under monomodal and multimodal particle size conditions.
4.4 Effects of Irregular Particle Characteristics on Plugging Risk in While-Drilling LCM Systems
4.4.1 Transportability of Irregular Particles in Downhole Tools
In practical engineering applications, LCMs often exhibit irregular morphologies, pronounced edges, and rough surfaces, which distinguish their geometric configurations and contact behaviors from those of idealized spherical particles. Irregular particles are more prone to constrained rotation and multi-point contact during transport, thereby enhancing interparticle force-chain formation. This, in turn, alters particle migration, accumulation, and bridging behaviors within the confined geometries of downhole tools, significantly influencing tool passability and plugging risk. Consequently, the characteristics of irregular particles must be incorporated to systematically evaluate their impact on particle transport behavior and plugging risk in drilling tools. Relevant numerical simulation results are summarized in Table 4.
Table 4: Influence of particle irregularity on transportability of while-drilling LCM systems in downhole tools.
| Particle Type | Particle Composition | Passability State | |
|---|---|---|---|
| Spherical Particles/% | Irregular Particles/% | ||
| Spherical particles | 100 | 0 | Transition Zone |
| Spherical/dodecahedral particles | 50 | 50 | High-Risk Zone |
Fig. 16 compares the evolution of the flow field and particle transport behavior within the downhole tool under spherical and irregular particle conditions. Under both conditions, a pronounced velocity surge and a particle discharge peak are observed during the initial stage (t < 0.05 s), reflecting transient disturbances of the flow field as particles enter the narrow sections of the tool. However, significant differences emerge in flow-field stability and sustained particle transport capacity as the process evolves.

Figure 16: Transport efficiency of monomodal and multimodal particle size combinations in the tool.
Under spherical particle conditions, the average fluid velocity inside the tool rapidly recovers and stabilizes at approximately 1.6–1.7 m/s, accompanied by an initial particle discharge peak of about 5000, which subsequently levels off at 600–700. This behavior indicates that spherical particles exhibit enhanced rolling and rearrangement capabilities, facilitating the maintenance of continuous primary flow channels and thereby supporting steady and sustained particle discharge. In contrast, under irregular particle conditions, the stabilized fluid velocity is substantially lower, reaching only approximately 0.9–1.0 m/s, with a slower recovery process. The particle discharge peak is also markedly reduced (approximately 3000–3500) and further declines to 100–200 during the steady phase, indicating a pronounced weakening of particle transport capacity.
Overall, irregular particles, due to their complex morphology, restricted rotation, and enhanced multi-point contacts, are more prone to forming localized stagnation zones and restricted flow paths within the tool. This behavior results in reduced flow passability and diminished continuous discharge capacity, thereby substantially increasing the risk of tool blockage. These findings underscore that particle morphological characteristics constitute a critical factor influencing passage efficiency and plugging risk of downhole tools.
4.4.2 Increase in Frictional Resistance Induced by Irregular Particles
As illustrated in Fig. 17, the evolution characteristics of the normal force within the force chain of the granular system were compared under conditions involving spherical particles and irregular particles. Under the spherical particle condition, the normal force of the force chain stabilizes at approximately 0.009–0.010 N within a short period, exhibiting relatively minor fluctuations overall. This indicates that the particle interactions are dominated by point contacts, resulting in a relatively simple contact network and limited internal friction effects. In contrast, under the irregular particle condition, the normal force of the force chain increases significantly, stabilizing at approximately 0.017–0.020 N, approximately 1.7 to 2.0 times that observed with spherical particles. Moreover, even during the stable phase, pronounced fluctuations persist, reflecting a more complex and dynamically active particle contact network.

Figure 17: Increase in friction induced by the inclusion of irregular particles.
Due to the presence of pronounced edges and complex morphology, irregular particles are more prone to forming multi-point contacts and interlocking structures, thereby constructing a more continuous and higher-strength force chain network in localized regions. At the same time, the inclusion of irregular particles also intensifies the frictional interaction between particles and the well wall, as their angular features and uneven surfaces increase contact opportunities and mechanical interlocking with the wall boundary. Therefore, the involvement of irregular particles significantly enhances both inter-particle internal friction and particle–wall friction, strengthening force transmission and resistance to motion within the granular system. This is one of the key microscopic mechanisms leading to restricted flow, increased particle retention, and a heightened risk of clogging in engineering equipment.
4.5 Effects of Fiber Inclusion on Plugging Risk in While-Drilling Tools
4.5.1 Effect of Fiber Inclusion on the Passability of While-Drilling Lost Circulation Materials in the Tool
Building upon the aforementioned analysis of particle size distribution, gradation, and morphological characteristics, fiber components were further introduced to investigate their effects on the passability and plugging risk of lost circulation materials in while-drilling tools. As high-aspect-ratio components, fibers are prone to orientation, bending, and entanglement during flow, which may significantly alter the structural characteristics and flow behavior of the particle system, thereby exerting a dual effect on tool passability. Accordingly, under identical spherical particle size gradation conditions (1.9 mm–0.7866 mm–0.4275 mm), fibers with varying lengths were incorporated while maintaining a constant fiber volume fraction. A comparative assessment of the passability performance of the lost circulation system within the tool was conducted, and the results are summarized in Table 5.
Table 5: Passability of while-drilling LCM systems with particle irregularity in while-drilling tools.
| While-Drilling LCM System | Particle Composition | Passability State | |
|---|---|---|---|
| Spherical Particles/% | Fibers/% | ||
| Spherical particles (1.9 mm-0.7866 mm-0.4275 mm) | 100 | 0 | Safe |
| Spherical particles (1.9 mm-0.7866 mm-0.4275 mm)/fibers (3 mm) | 95.5 | 4.5 | Transition Zone |
| Spherical particles (1.9 mm-0.7866 mm-0.4275 mm)/fibers (5 mm) | 95.5 | 4.5 | High-Risk Zone |
As illustrated in Fig. 18, a comparative analysis was conducted to examine the transport behavior of lost circulation materials through the tool under three distinct conditions: no fiber, 3 mm fibers, and 5 mm fibers. Under all conditions, a transient peak is observed during the initial phase (t < 0.05 s), indicating transient flow disturbances as the system enters the narrow section of the tool. In the absence of fibers, the average fluid velocity inside the tool rapidly recovers and stabilizes at approximately 1.6–1.7 m/s, indicating favorable transport characteristics of the system. In contrast, fiber inclusion results in a significant reduction in steady-state flow velocity, which decreases to approximately 0.5–0.55 m/s with 3 mm fibers and further diminishes with 5 mm fibers. This behavior suggests that fiber inclusion substantially impedes fluid transport.

Figure 18: Fluid velocity and average discharged particle velocity inside the tool under different fiber types.
Variations in the number of discharged particles are consistent with the observed velocity response. Compared to the fiber-free condition, the presence of fibers increases the likelihood of particle retention and accumulation within the tool, an effect that becomes more pronounced with increasing fiber length. In particular, under the 5 mm fiber condition, pronounced particle–fiber entanglement is observed, thereby substantially increasing the risk of tool blockage.
4.5.2 Increase in Internal Friction Induced by Fibers
As illustrated in Fig. 19, a comparative analysis is presented of the temporal evolution of normal force within force chains under three conditions: without fibers, with 3 mm fibers, and with 5 mm fibers. In all three scenarios, a pronounced peak is observed during the initial stage (t < 0.05 s), reflecting the rapid establishment of contact networks as the granular–fiber system enters the constrained region of the tool. In the absence of fibers, the normal force within force chains stabilizes at approximately 0.55–0.60 N following transient fluctuations, with relatively small amplitude variations, indicating that interparticle contacts remain relatively loose and the internal friction level is low. With fiber inclusion, the normal force within the system increases significantly, stabilizing at approximately 0.70 N with 3 mm fibers and further rising to approximately 1.1–1.2 N under 5 mm fiber conditions, where considerable fluctuations persist even in the steady state. Combined with the granular–fiber contact diagrams and force-chain distributions shown on the right, it is evident that fiber inclusion promotes the formation of more continuous and densely distributed force-chain networks among particles. Longer fibers are more prone to entanglement and interlocking with multiple particles, thereby substantially enhancing internal friction and load-transfer capacity within the granular system. This increase in internal friction restricts relative particle motion, serving as a critical microscale mechanism responsible for flow restriction and elevated plugging risk inside the tool.

Figure 19: Increase in internal friction induced by fiber participation.
In this study, a CFD–DEM approach was developed to simulate the transport behavior of while-drilling lost circulation materials (LCMs) in directional tools and was validated through visualization experiments, demonstrating its capability to capture particle accumulation and pressure evolution during bridging formation. The results indicate that the transition from stable transport to plugging is governed by the combined effects of particle size and concentration. Particles smaller than approximately 1.6 mm can pass through the tool smoothly over a wide concentration range, whereas particles larger than about 2.5–2.8 mm may cause plugging even at relatively low concentrations, significantly reducing the safe operating window. Multimodal particle size distributions help maintain flow continuity and improve discharge stability, with transport efficiency remaining within 0.03–0.07% during steady flow. Irregular particles increase force-chain intensity to approximately 1.7–2.0 times that of spherical particles, enhancing particle interlocking and restricting rearrangement. Fiber inclusion further modifies the flow structure, reducing the average fluid velocity to less than 40% of that observed without fibers and increasing flow resistance. From an engineering perspective, these results suggest that reliable passability of directional drilling tools can be achieved by controlling the particle size below about 2 mm, maintaining the LCM concentration within a moderate range, adopting graded particle systems, and carefully limiting the fiber content. These findings provide practical guidance for optimizing the particle size range, concentration, and grading strategy of while-drilling LCMs. More importantly, the present work provides a clearer basis for the practical use of while-drilling LCMs by helping define the safe operating limits of particle size and concentration, thereby enabling higher LCM loading within the safe passability range of the tool and improving the effectiveness and flexibility of loss-control treatments in field applications.
Acknowledgement:
Funding Statement: This research was supported by the Open Fund of Hubei Key Laboratory of Oil and Gas Drilling and Production Engineering (Yangtze University), No. YQZC202513; The Natural Science Foundation of the Hubei Province of China (No. 2025AFB330), the China Postdoctoral Science Foundation (No. 2024M762777), the Postdoctoral Fellowship Program of CPSF (No. GZB20250680).
Author Contributions: Xiaoshan Wang: Conceptualization, Data curation, Formal analysis, Investigation, Methodology, Writing—original draft; Qiang Cui: Formal analysis, Investigation, Software, Visualization; Lei Pu: Conceptualization, Funding acquisition, Project administration, Resources, Supervision, Validation, Writing—review & editing. All authors reviewed and approved the final version of the manuscript.
Availability of Data and Materials: Data available on request from the authors. The data that support the findings of this study are available from the corresponding author, Lei Pu, upon reasonable request.
Ethics Approval: Not applicable.
Conflicts of Interest: The authors declare no conflicts of interest.
References
1. Yang J , Sun J , Bai Y , Lv K , Zhang G , Li Y . Status and prospect of drilling fluid loss and lost circulation control technology in fractured formation. Gels. 2022; 8( 5): 260. doi:10.3390/gels8050260. [Google Scholar] [CrossRef]
2. Jia L , Chen M , Hou B , Sun Z , Jin Y . Drilling fluid loss model and loss dynamic behavior in fractured formations. Petrol Explor Dev. 2014; 41( 1): 105– 12. doi:10.1016/S1876-3804(14)60012-4. [Google Scholar] [CrossRef]
3. Xu C , Kang Y , Chen F , You Z . Fracture plugging optimization for drill-in fluid loss control and formation damage prevention in fractured tight reservoir. J Nat Gas Sci Eng. 2016; 35: 1216– 27. doi:10.1016/j.jngse.2016.09.059. [Google Scholar] [CrossRef]
4. Kulkarni SD , Jamison DE , Teke KD , Savari S . Managing suspension characteristics of lost-circulation materials in a drilling fluid. SPE Drill Complet. 2016; 30( 4): 310– 5. doi:10.2118/170271-pa. [Google Scholar] [CrossRef]
5. Jaf PT , Razzaq AA , Ali JA . The state-of-the-art review on the lost circulation phenomenon, its mechanisms, and the application of nano and natural LCM in the water-based drilling fluid. Arab J Geosci. 2023; 16( 1): 32. doi:10.1007/s12517-022-11104-3. [Google Scholar] [CrossRef]
6. Brovko K , Marquinez V , Ignova M , Mantle K , Jones M , Elsaadi H , et al. Achieving level 3 automation in rotary steerable systems downhole control: one step closer to self-steering RSS. In: Proceedings of the SPE/IADC Middle East Drilling Technology Conference and Exhibition; 2025 May 27–29; Abu Dhabi, United Arab Emirates. p. D011S001R003. doi:10.2118/225656-ms. [Google Scholar] [CrossRef]
7. Wang YL , Liu ZL , Cheng WB , Yang YN . Study on fault-tolerant technique of downhole steering system for rotary steering drilling. In: Proceedings of 2012 International Conference on Measurement, Information and Control; 2012 May 18–20; Harbin, China. p. 896– 9. doi:10.1109/MIC.2012.6273431. [Google Scholar] [CrossRef]
8. Ba S , Kim J , Goel P , Sahli H , Chacko A , Olanubi O , et al. Expanding downlink capabilities using autonomous directional drilling with rotary steerable systems. In: Proceedings of the Abu Dhabi International Petroleum Exhibition and Conference; 2022 Oct 31–Nov 3; Abu Dhabi, United Arab Emirates. p. D031S107R003. doi:10.2118/211067-ms. [Google Scholar] [CrossRef]
9. Yan WH , Peng Y , Zhang SH , Wu H . Research of mechanical system on rotary steering drilling tool. Appl Mech Mater. 2013; 345: 511– 5. doi:10.4028/www.scientific.net/amm.345.511. [Google Scholar] [CrossRef]
10. Xu C , Kang Y , Chen F , You Z . Analytical model of plugging zone strength for drill-in fluid loss control and formation damage prevention in fractured tight reservoir. J Petrol Sci Eng. 2017; 149: 686– 700. doi:10.1016/j.petrol.2016.10.069. [Google Scholar] [CrossRef]
11. Pu L , Xu P , Xu M , Zhou J , Liu Q , Song J . Numerical simulation study on the flow properties of materials for plugging while drilling in MWD. Processes. 2022; 10( 10): 1955. doi:10.3390/pr10101955. [Google Scholar] [CrossRef]
12. Salehi S , Nygaard R . Numerical modeling of induced fracture propagation: a novel approach for lost circulation materials (LCM) design in borehole strengthening applications of deep offshore drilling. In: Proceedings of the SPE Annual Technical Conference and Exhibition; 2012 Oct 8–10; San Antonio, TX, USA. p. SPE-135155-MS. doi:10.2118/135155-ms. [Google Scholar] [CrossRef]
13. Wang G , Jiang H , Li W . Design and experimental study of a new hydraulic tool for lost-circulation materials (LCM) plugging while drilling. Sci Rep. 2024; 14: 29663. doi:10.1038/s41598-024-80867-4. [Google Scholar] [CrossRef]
14. Guo T , Hao T , Yang X , Li Q , Liu Y , Chen M , et al. Numerical simulation study of fracture propagation by internal plugging hydraulic fracturing. Eng Fract Mech. 2024; 310: 110480. doi:10.1016/j.engfracmech.2024.110480. [Google Scholar] [CrossRef]
15. Li B , Feng Y , Ma C , Li S , Lai C , Zhang S , et al. Particle size optimization of lost circulation materials: a comprehensive experimental study. In: Proceedings of the ARMA US Rock Mechanics/Geomechanics Symposium; 2023 Jun 25–28; Atlanta, GA, USA. p. ARMA– 2023. doi:10.56952/ARMA-2023-0359. [Google Scholar] [CrossRef]
16. Liu X , Wu J , Hu J , He G , Huang S , Yang L . Development of a polyurethane lost circulation material suitable for malignant leakage of drilling fluid. Processes. 2025; 13( 11): 3707. doi:10.3390/pr13113707. [Google Scholar] [CrossRef]
17. Kang Y , Tan Q , You L , Zhang X , Xu C , Lin C . Experimental investigation on size degradation of bridging material in drilling fluids. Powder Technol. 2019; 342: 54– 66. doi:10.1016/j.powtec.2018.09.086. [Google Scholar] [CrossRef]
18. Chen Z , Wu G , Zhou J , Ai C , Zhang A , Xie X , et al. Optimization of degradable temporary plugging material and experimental study on stability of temporary plugging layer. Front Phys. 2023; 11: 1167215. doi:10.3389/fphy.2023.1167215. [Google Scholar] [CrossRef]
19. Ma C , Feng Y , Dou Y , Chu M , Zhao K , Deng J . Experimental study on the design method of lost circulation materials for induced fractures. Geoenergy Sci Eng. 2024; 240: 213086. doi:10.1016/j.geoen.2024.213086. [Google Scholar] [CrossRef]
20. Kang Y , Hao K , Xu C , Guo K , Zhou J , Wang R , et al. Experimental evaluation method of density suitability between bridging lost circulation materials and drilling fluid. Petroleum. 2025; 11( 3): 334– 41. doi:10.1016/j.petlm.2025.04.001. [Google Scholar] [CrossRef]
21. Hu ZW , Zhang YQ , Wang JS , Wang XY , Qin Y , Liu Y . Experimental study of a circulation agent dynamic plugging for multi-scale natural fractures. Petrol Sci. 2025; 22( 9): 3641– 54. doi:10.1016/j.petsci.2025.07.010. [Google Scholar] [CrossRef]
22. Wang X , Gong L , Li Y , Yao J . Developments and applications of the CFD-DEM method in particle–fluid numerical simulation in petroleum engineering: a review. Appl Therm Eng. 2023; 222: 119865. doi:10.1016/j.applthermaleng.2022.119865. [Google Scholar] [CrossRef]
23. Ren M , Shu X . A novel approach for the numerical simulation of fluid-structure InteractionProblems in the presence of debris. Fluid Dyn Mater Process. 2020; 16( 5): 979– 91. doi:10.32604/fdmp.2020.09563. [Google Scholar] [CrossRef]
24. Lietard O , Unwin T , Guillot D , Hodder M . Fracture width LWD and drilling mud/LCM selection guidelines in naturally fractured reservoirs. In: Proceedings of the European Petroleum Conference; 1996 Oct 22–24; Milan, Italy. p. SPE-36832-MS. doi:10.2118/36832-ms. [Google Scholar] [CrossRef]
25. Wang S , Li H , Wang R , Tian R , Sun Q , Ma Y . Numerical simulation of flow behavior of particles in a porous media based on CFD-DEM. J Petrol Sci Eng. 2018; 171: 140– 52. doi:10.1016/j.petrol.2018.07.039. [Google Scholar] [CrossRef]
26. Savari S , Whitfill DL , Kumar A . Resilient lost circulation material (LCM): a significant factor in effective wellbore strengthening. In: Proceedings of the SPE Deepwater Drilling and Completions Conference; 2012 Jun 20–21; Galveston, TX, USA. p. SPE 153154-MS. doi:10.2118/153154-ms. [Google Scholar] [CrossRef]
27. Amanullah M , Arfaj M , Alouhali R . Novel plant-based particulate and fibrous LCM products for loss control while drilling. In: Proceedings of the International Petroleum Technology Conference; 2019 Mar 26–28; Beijing, China. p. D021S038R005. doi:10.2523/iptc-19305-ms. [Google Scholar] [CrossRef]
Cite This Article
 Copyright © 2026 The Author(s). Published by Tech Science Press.
This work is licensed under a Creative Commons Attribution 4.0 International License , which permits unrestricted use, distribution, and reproduction in any medium, provided the original work is properly cited.
 Downloads
 Citation Tools
