
 Login
Login Register
 Submit a Paper
 Propose a Special lssue
 Open Access
ARTICLE
Staged Pressure Reduction and Cavitation Suppression in Multi-Stage Sleeve-Type Valves Using Perforated Plates
1 Beijing Key Laboratory of Health Monitoring and Self-Recovery for High-End Mechanical Equipment, Beijing University of Chemical Technology, Beijing, China
2 State Key Laboratory of Fluid Power and Mechatronic Systems, Zhejiang University, Hangzhou, China
3 State Key Laboratory of High-End Compressor and System Technology, Beijing University of Chemical Technology, Beijing, China
* Corresponding Author: Fuqiang Chen. Email:
(This article belongs to the Special Issue: Multiphase Flow in Fluid Machinery)
Fluid Dynamics & Materials Processing 2026, 22(9), 3 https://doi.org/10.32604/fdmp.2026.087295
Received 14 June 2026; Accepted 02 September 2026; Issue published 28 September 2026
 View Full Text
 Download PDF
Abstract
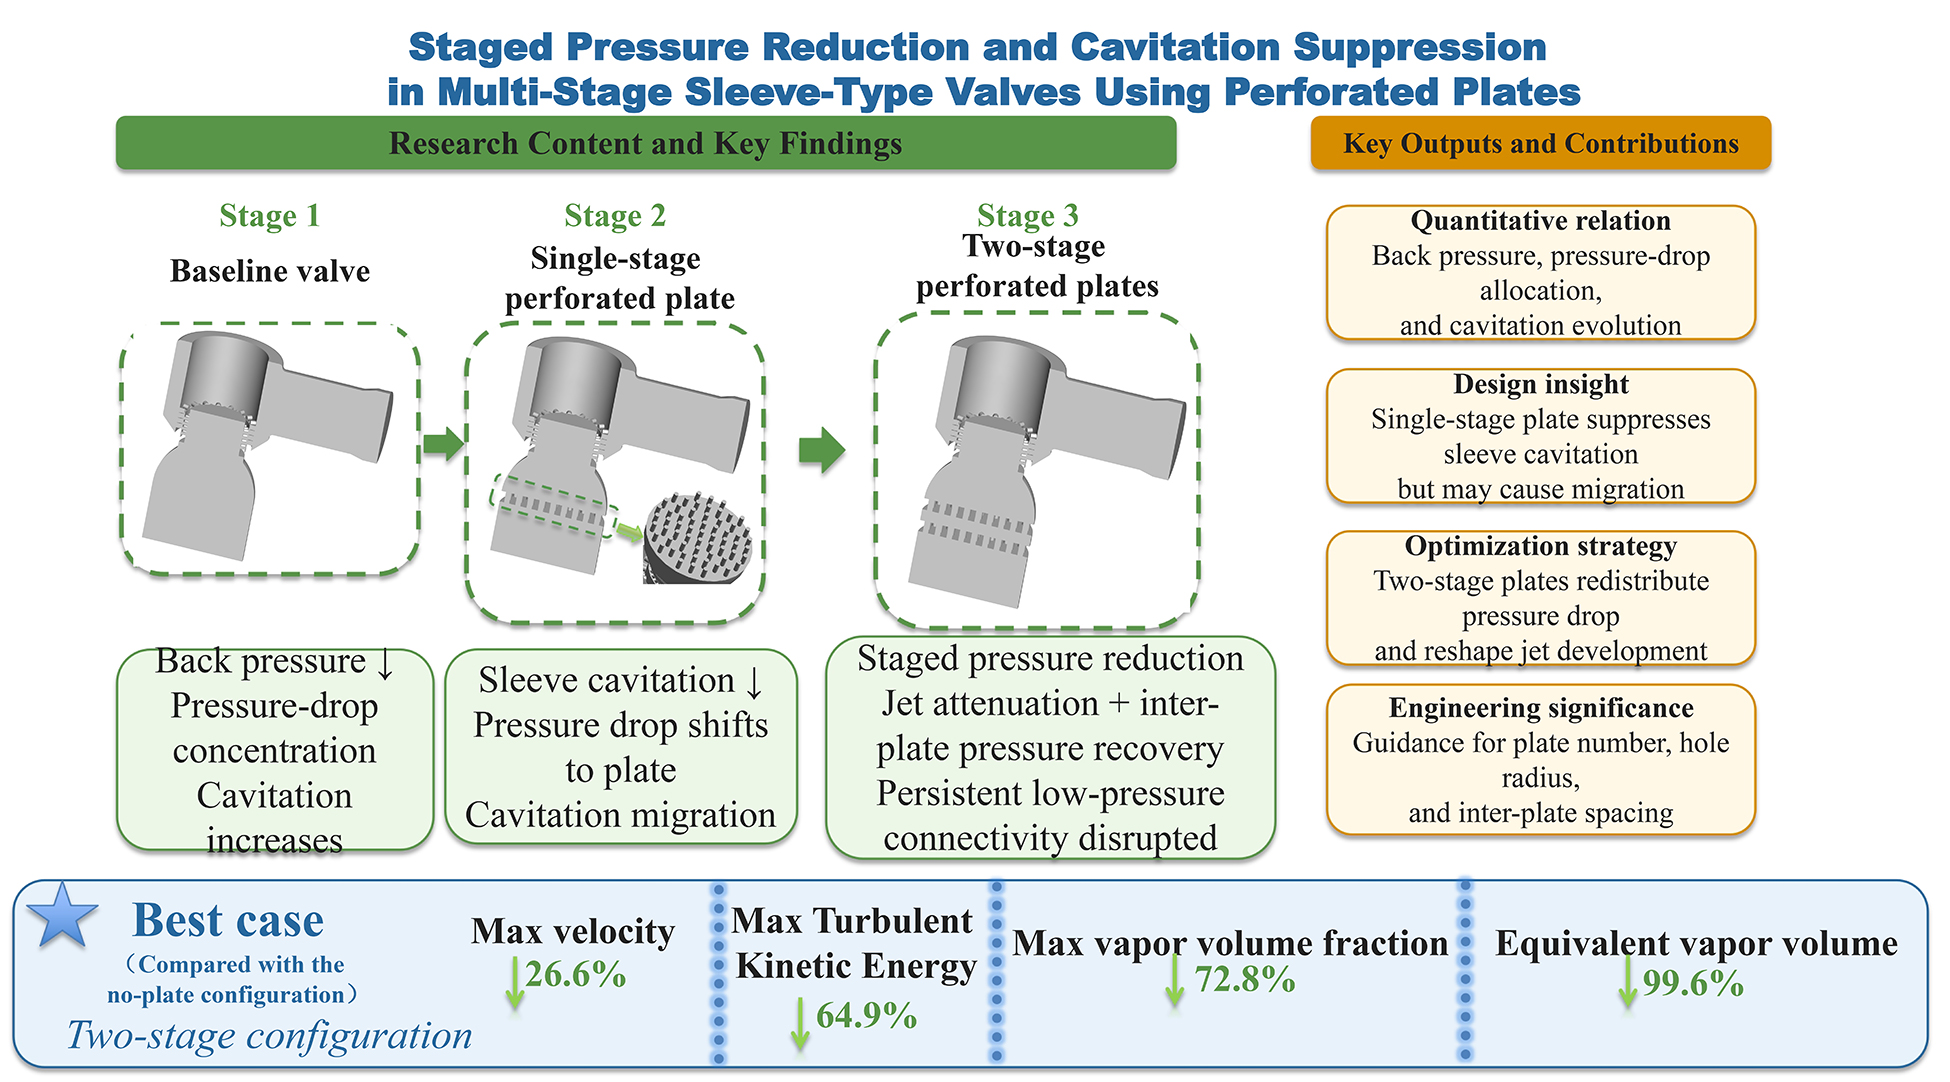
This study develops a numerical framework to elucidate how staged perforated plates regulate flow and suppress cavitation in a multi-stage sleeve-type pressure-reducing valve (MSPRV) for nuclear feedwater systems under high-pressure-drop conditions. Steady Reynolds-averaged Navier–Stokes (RANS) simulations, coupled with the standard k–ω turbulence model and the Zwart–Gerber–Belamri cavitation model, were conducted at an inlet pressure of 2 MPa. The effects of outlet back pressure, perforated-plate hole radius, and inter-plate spacing were systematically examined through comparisons of a baseline valve without a perforated plate, single-stage configurations, and two-stage configurations. Lower outlet back pressure was found to concentrate the pressure drop across the secondary sleeve, intensify downstream high-velocity jets, promote the coalescence of low-pressure regions, and substantially increase vapor formation. A single perforated plate alleviated sleeve cavitation by increasing downstream back pressure, but smaller holes shifted the dominant pressure drop and cavitation toward the plate itself, limiting the overall mitigation effect. In contrast, staged pressure reduction in the two-plate configuration progressively attenuated the jets, enhanced inter-plate pressure recovery, and disrupted the continuity of persistent low-pressure regions. An inter-plate spacing of 15 mm provided a favorable balance between jet attenuation, flow conditioning, and structural compactness. Within the investigated design space, the two-stage configuration with a 3.0 mm hole radius exhibited the most favorable overall flow and cavitation characteristics. At an outlet pressure of 0.1 MPa, this configuration reduced the maximum velocity, maximum turbulent kinetic energy, maximum vapor volume fraction, and equivalent vapor volume by 26.6%, 64.9%, 72.8%, and approximately 99.6%, respectively, relative to the no-plate configuration. Overall, the results demonstrate that coordinated control of plate number, hole size, and inter-plate spacing can redistribute the pressure drop, reshape jet development, and disrupt sustained low-pressure connectivity, providing an effective strategy for reducing time-averaged cavitation in high-pressure-drop MSPRVs.Graphic Abstract
Keywords
Control valves are key components for pressure regulation, flow control, and system protection in nuclear feedwater systems and related high-pressure water circuits. Their design must balance flow capacity, control accuracy, safety, and service reliability [1,2]. Under high-pressure-drop conditions, intense conversion of pressure energy into kinetic energy occurs within a confined flow passage, readily producing high-velocity jets, strong shear layers, and local low-pressure zones at sleeve orifices, valve-throttling regions, and sudden expansions. Studies of nuclear secondary-circuit safety valves and charging-flow control valves have shown that localized pressure-drop concentration intensifies cavitation and may cause a spatial offset between the vapor region and the actual erosion site [3,4]. Dynamic coupling between the valve and the upstream/downstream piping can also induce flutter, impact, and pressure fluctuations [5], while bubble collapse in pressure-recovery regions generates shock waves and microjets that promote material fatigue, surface pitting, and erosion–corrosion synergy [6]. Such damage degrades control performance, shortens the service life of valve internals, and may compromise operational safety and maintenance intervals. Accordingly, the design of nuclear feedwater control valves should address not only the overall pressure drop and flow capacity, but also local pressure-drop allocation, jet organization, cavitation location, and potential damage risk.
From a mechanistic perspective, cavitation nuclei begin to grow when the local absolute liquid pressure approaches the saturation vapor pressure. The resulting cavities are convected downstream and subsequently shrink and collapse in pressure-recovery regions [7,8]. In complex internal valve flows, cavitation development is further modulated by orifice jets, shear-layer instability, recirculation zones, and vortical structures. Unsteady investigations of nuclear control valves have shown that valve opening, throat length-to-diameter ratio, and expansion angle alter the spatial interaction between cavities and vortical structures as well as the associated pressure fluctuations [9]. Turbulence-model and phase-change-model parameters also substantially affect predicted cavity length, vapor extent, and cloud-cavitation evolution [10]. Thus, attainment of the vaporization pressure is the direct condition for cavitation inception, whereas jet shear, velocity fluctuations, and vortical structures influence subsequent development by modifying the size and persistence of low-pressure regions and the pressure-recovery process. In this study, the Q criterion evaluated from the time-averaged velocity field is used to identify vortical regions and compare their spatial distribution and relative extent among configurations. A single metric, such as the maximum vapor volume fraction, turbulent kinetic energy, or vorticity, is insufficient to characterize the full evolution and potential risk of valve cavitation.
Homogeneous-mixture formulations combined with interphase mass-transfer models are widely used to simulate cavitating internal throttling flows. The Singhal, Kunz, Schnerr–Sauer, and Zwart–Gerber–Belamri models describe liquid–vapor phase change from different perspectives, including non-condensable gas effects, empirical mass-transfer timescales, and bubble dynamics [11,12,13,14]. Each model has distinct characteristics in predicting cavitation inception, vapor volume, and unsteady behavior; no model is universally optimal for all cavitating flows. The Zwart–Gerber–Belamri model has an explicit mass-transfer formulation and is comparatively straightforward to implement numerically. It has been applied to complex throttling flows such as nuclear safety valves, and the sensitivity of its empirical coefficients has been systematically investigated [3,10]. Because the present work requires consistent multi-configuration and multi-condition comparisons, this model was selected to describe liquid–vapor mass transfer, and the conclusions are limited to relative differences and time-averaged cavitation characteristics under a common modeling framework.
The standard k–ω model is well suited to near-wall flows and adverse pressure gradients and can represent the mean-flow characteristics of orifice jets, wall shear layers, and local separation [15]. Because RANS achieves turbulence closure via statistical averaging of turbulent fluctuations, its ability to resolve periodic cloud shedding, large-scale coherent structures, and transient pressure loading is limited [16]. Large-eddy simulation (LES) can more directly resolve the transition from sheet to cloud cavitation and the shedding frequency [17], whereas delayed detached-eddy simulation provides a compromise between near-wall RANS and LES in separated regions [18]. Comparative studies further demonstrate that high-fidelity approaches provide superior resolution of cavity shedding, coherent vortical structures, and dynamic loads [19]. However, such transient simulations require substantially finer meshes, smaller time steps, and longer sampling periods, making them impractical for systematic screening of numerous hole radii, plate numbers, and inter-plate spacings. Numerical approaches have been widely applied to safety valves, perforated plates, multi-stage sleeves, and cage-type structures for comparative analyses of internal flow and cavitation characteristics [3,20,21,22,23,24,25]. Accordingly, steady RANS is appropriate for the mean pressure-drop allocation, structural sensitivity, and engineering screening considered here, but it cannot resolve transient cavity growth, shedding frequency, or collapse-induced impacts.
Numerical error and model-form uncertainty also affect the credibility of cavitation predictions. The Grid Convergence Index (GCI) provides a standardized framework for evaluating CFD discretization error [26], while uncertainty-quantification studies have shown that cavity length, pressure coefficient, and vapor volume can be sensitive to turbulence-closure parameters [27]. Cavitation models should therefore be assessed, where possible, against both global hydraulic quantities, such as mass flow rate and pressure drop, and local characteristics, such as cavity location, length, and vapor distribution; qualitative similarity of contours alone does not establish quantitative predictive accuracy [28]. Grid sensitivity, iterative convergence, model-parameter uncertainty, and experimental validation should thus be regarded as distinct levels of credibility assessment. In the present work, grid independence, mass conservation, and monitored-solution stability are used to assess numerical convergence, while comparison with published trends is explicitly treated as a qualitative consistency analysis rather than experimental validation.
Cavitation-mitigation designs based on perforated plates, multi-stage sleeves, labyrinth passages, and multilayer cages share a common principle: converting a concentrated pressure drop into staged dissipation across several throttling elements. Studies of honeycomb-type perforated plates have shown that open area, plate number, hole arrangement, and inter-plate spacing jointly govern pressure loss, pressure recovery, and cavitation tendency. Increasing the number of plates and selecting an appropriate spacing can reduce the loading of each stage and improve the inlet flow to the downstream plate [20]. Research on perforated plates in series further indicates that closely spaced plates exhibit strong hydrodynamic coupling, whereas the pressure-loss characteristics of individual plates become progressively more independent as the spacing increases [29]. Parametric optimization of multi-stage sleeves has revealed coupled effects of hole diameter, pitch, depth, and sleeve spacing, although the corresponding objectives have primarily focused on flow capacity and noise [21]. Multilayer cage structures can distribute the pressure drop and reduce cavitation nucleation and equivalent vapor volume [22], and multi-stage pressure-reducing valves have likewise shown that downstream high-velocity jets and intense turbulence are major sources of broadband flow-induced noise [30]. Studies of labyrinth passages, control-valve internals, and pilot valves further confirm that orifice size, turning passages, and outlet geometry strongly influence the minimum pressure, jet intensity, and vapor distribution [23,24,25].
These studies consistently identify staged dissipation and progressive pressure recovery as important means of reducing local cavitation risk. Nevertheless, adding throttling stages does not necessarily suppress cavitation throughout the valve. If the holes are excessively small, the stage-wise pressure drops are poorly matched, or the inter-plate passage is too short to permit jet expansion and pressure recovery, the added throttling element can itself become a new high-velocity, low-pressure region. Previous optimization studies have often relied on the minimum pressure, maximum vapor volume fraction, or cavitation extent near the original throttling component, with limited attention to whether an added plate truly reduces the overall vapor field or merely relocates it. Surrogate-model and parametric studies also tend to emphasize flow rate, noise, or a single geometric variable, and clear design guidance linking hole size, inter-plate spacing, and pressure-drop allocation remains limited.
The long-term engineering consequences of valve cavitation also involve structural dynamics, material damage, and fluid temperature. Fluid–Structure Interaction (FSI) studies show that piping characteristics, fluid loading, and valve-disc dynamics affect valve stability [31]. Existing cavitation-erosion approaches commonly use pressure pulses, bubble-collapse rates, or energy-based indicators to identify relative high-risk regions, but quantitative prediction of actual material loss and service life remains highly uncertain [32]. High-pressure nozzle studies have also shown that the region of maximum vapor content does not necessarily coincide with the most severe erosion; near-wall pressure-recovery zones reached after cavity convection may present a higher damage potential [33]. Temperature influences cavitation through the saturation vapor pressure, density, viscosity, and thermodynamic phase-change effects. Available studies indicate that model coefficients are not necessarily transferable across temperatures and that sustained flashing may occur when pressurized hot water undergoes rapid depressurization [34,35].
Although these multiphysics effects are important to the long-term operational safety of nuclear valves, simultaneously accounting for transient flow, high-temperature thermophysical properties, structural response, and material damage would substantially increase model complexity and obscure the isolated effects of structural parameters such as plate number, hole radius, and inter-plate spacing. The use of a uniform room-temperature reference fluid for structural comparisons has also been adopted in CFD studies of control valves for nuclear power plants. For example, Qian et al. [36] used a room-temperature working fluid to investigate the flow characteristics of nuclear control valves with different valve-core geometries and to compare their hydraulic responses under consistent fluid conditions. Following a similar controlled-comparison approach, the present study uses room-temperature water as a common reference fluid to remove variations associated with temperature and thermophysical properties and to focus on the effects of plate number, hole radius, and inter-plate spacing on the hydraulic characteristics, pressure-drop allocation, and time-averaged cavitation behavior. The conclusions therefore primarily reflect the relative trends and staged-design principles under the specified reference-temperature conditions.
In service, an MSPRV in a nuclear feedwater system must accommodate wide-ranging load regulation and back-pressure variation, and its full-operating-range cavitation behavior directly affects service reliability. Three issues still require quantitative clarification. First, most existing valve-cavitation studies consider a fixed pressure drop or only a few representative conditions; the coupled evolution of stage-wise sleeve pressure-drop redistribution, pressure, jets, turbulence quantities, vortical structures, and vapor volume as the outlet back pressure is continuously reduced at a fixed inlet pressure has received limited attention. Second, structural optimization seldom evaluates both the downstream cavitation number and the equivalent vapor volume at newly introduced throttling elements, making it difficult to distinguish true overall mitigation from spatial migration of cavitation. Such migration may also transfer erosion risk to downstream components that have not been locally reinforced. Third, for an MSPRV equipped with two downstream perforated plates, the combined influence of hole radius and inter-plate spacing on stage-wise pressure-drop allocation, inter-plate jet attenuation, and turbulent kinetic energy dissipation has not been systematically quantified.
To address these issues, the present study investigates an MSPRV for high-pressure-drop regulation in a nuclear feedwater system using steady RANS simulations with the standard k–ω turbulence model and the Zwart–Gerber–Belamri cavitation model. First, with the inlet pressure fixed at 2 MPa and the outlet pressure set to 0.8, 0.5, 0.3, 0.2, and 0.1 MPa, the stage-wise pressure-drop allocation in the baseline valve without a perforated plate is analyzed together with the velocity, turbulence quantities, vortical structures identified using the Q criterion applied to the time-averaged flow field, downstream cavitation number, and equivalent vapor volume. Next, single-stage perforated plates with different hole radii are examined at an outlet pressure of 0.1 MPa. Pressure and cavitation metrics in the sleeve and plate regions are compared to distinguish overall cavitation mitigation from spatial migration. Finally, a second perforated plate is added to the hole-radius cases that exhibit pronounced cavitation in the single-stage configuration, and inter-plate spacings of 10, 15, and 20 mm are compared using section-averaged velocity and turbulent kinetic energy. The objective is to quantify the relation between pressure-drop allocation and cavitation evolution under varying back pressure, clarify the dual effect whereby a single perforated plate raises sleeve back pressure but may induce cavitation migration, and reveal how the two-stage configuration reduces cavitation risk through staged pressure reduction, inter-plate jet conditioning, and progressive pressure recovery. The findings provide quantitative guidance and design insight for selecting the number of plates, hole radius, and inter-plate spacing in an MSPRV. The overall research methodology and workflow are summarized in Fig. 1.
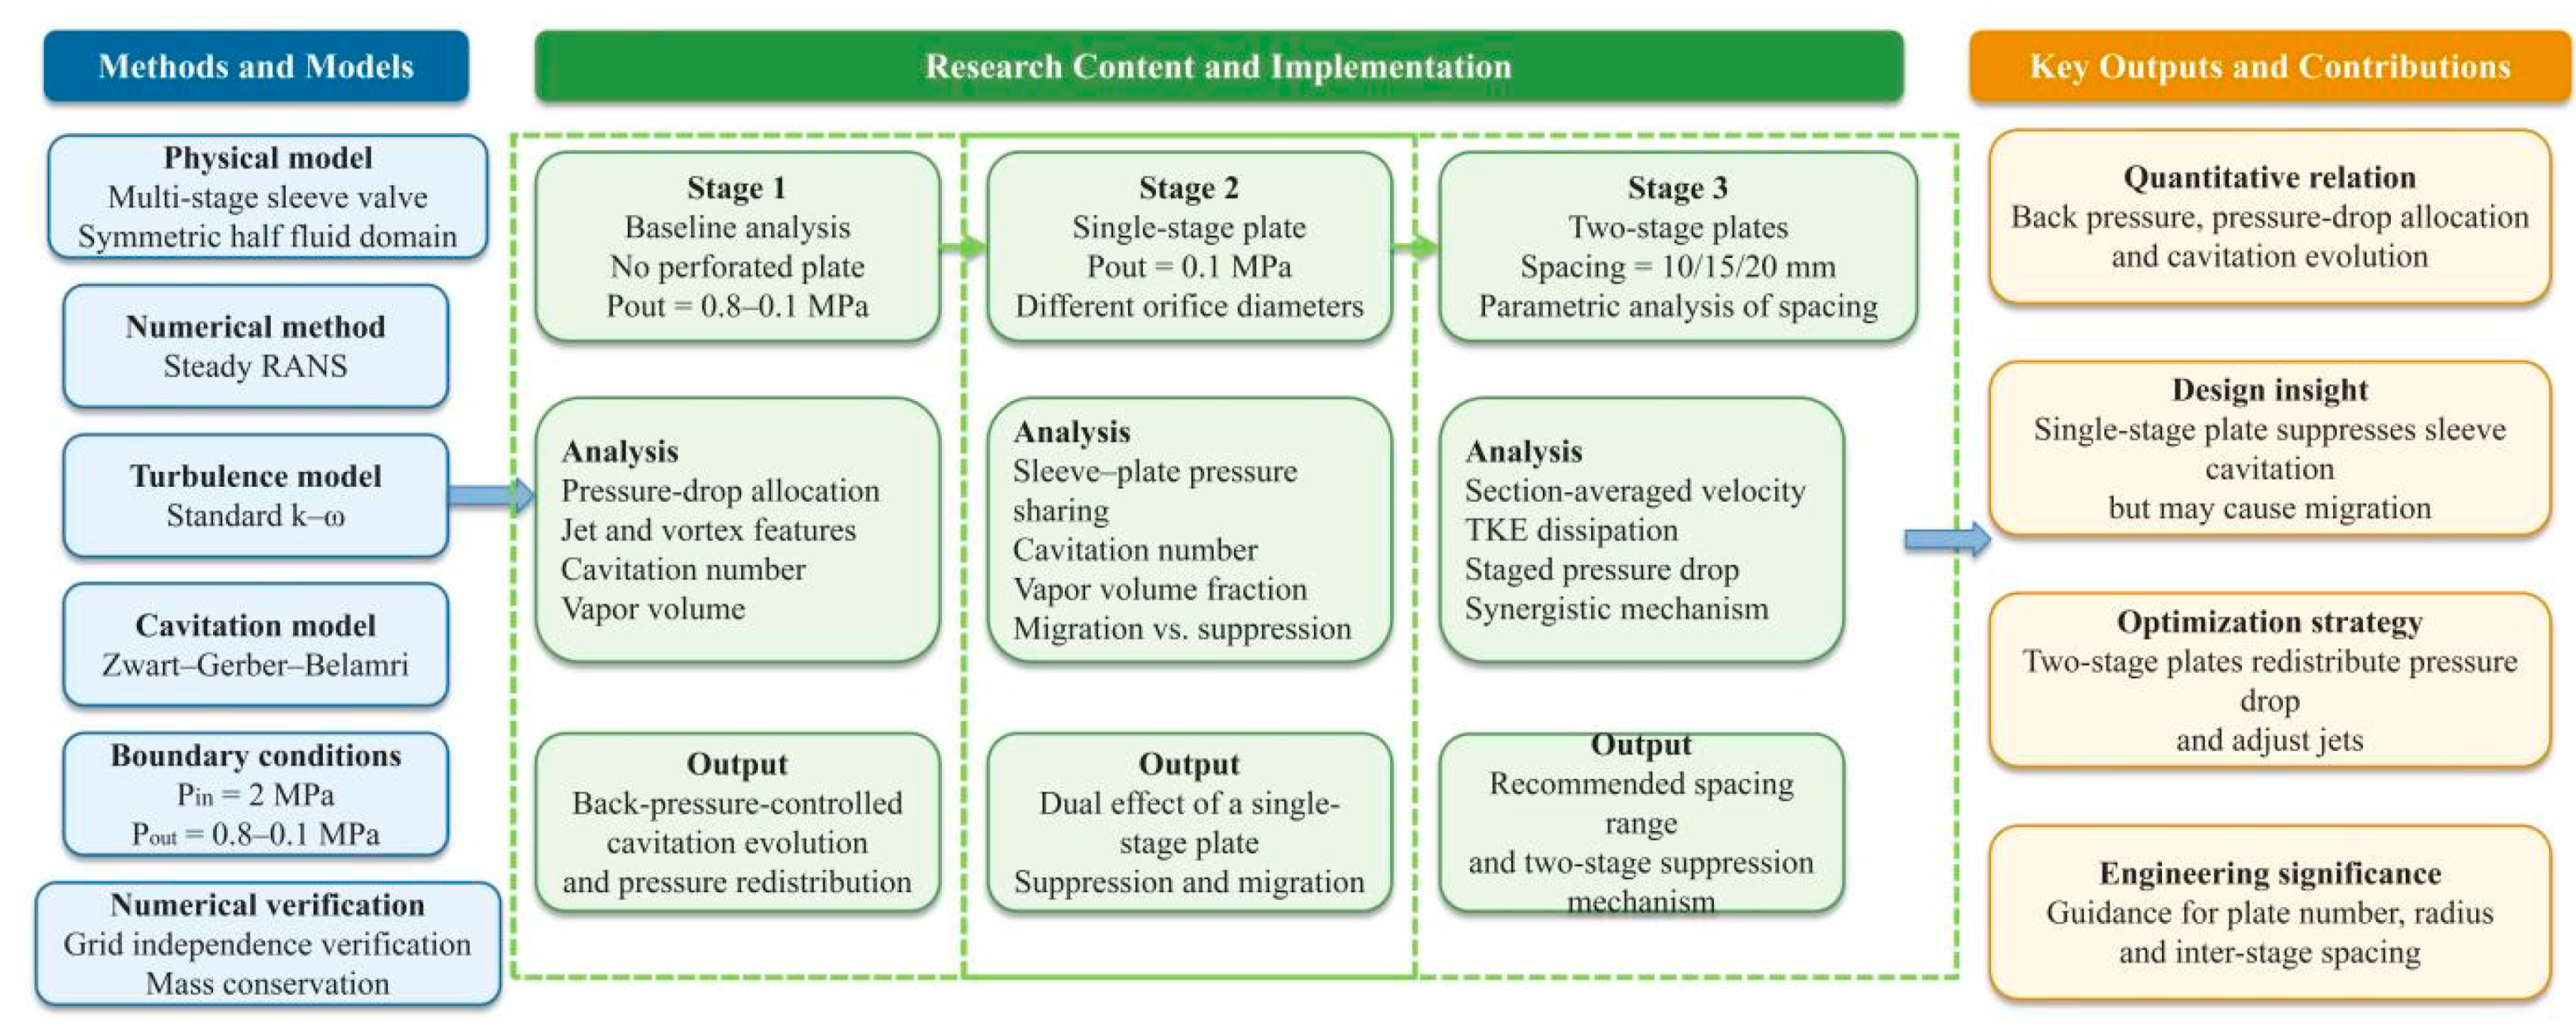
Figure 1: Research methodology and workflow.
Fig. 2 illustrates the half-domain fluid model of the MSPRV and the locations of the characteristic sections. The fluid enters the valve chamber from the right-hand inlet, passes through the multi-stage sleeves for progressive throttling, and then enters the downstream outlet chamber before leaving through the bottom outlet. The primary throttling components are the multi-stage sleeves and the perforated plates. The sleeves are positioned between the inlet and outlet chambers and contain intermediate grooves that provide the initial stages of pressure reduction and energy dissipation. The perforated plates are installed in the outlet passage downstream of the sleeves to further redistribute the downstream pressure drop, enhance flow-energy dissipation, and mitigate cavitation. The baseline geometry was developed with reference to the representative configuration of a multi-stage sleeve-type pressure-reducing valve used in a nuclear secondary circuit [25]. The sleeve-orifice diameters, groove thickness, and plate thickness were selected by considering geometric matching of the passages, the required throttling intensity, and the available installation space inside the valve body. To maintain comparability, all dimensions other than hole radius, plate number, and inter-plate spacing were held constant across the simulations. The principal geometric parameters are listed in Table 1.
To quantify pressure-drop allocation and pressure recovery in the different throttling regions, six characteristic sections (Planes A–F) were defined using the two-stage perforated-plate configuration. Plane A is located in the inlet passage near the valve core and represents the pressure immediately upstream of the sleeves. Plane B lies between the primary and secondary sleeves and is used to evaluate the pressure change across the primary sleeve. Plane C is positioned at the interface between the secondary-sleeve outlet and the downstream chamber and characterizes the pressure drop and back-pressure level downstream of the secondary sleeve. Plane D is located upstream of the first perforated plate and represents the pressure plateau ahead of the plate. Plane E lies between the two plates and is used to evaluate pressure recovery downstream of the first plate. Plane F is located downstream of the second plate and characterizes the pressure in the outlet section after two-stage throttling. Comparison of the area-averaged pressures at Planes A–F identifies the distribution of the overall pressure drop among the sleeves and the two perforated plates and provides the basis for subsequent analyses of pressure-drop redistribution, flow stability, and cavitation mitigation.
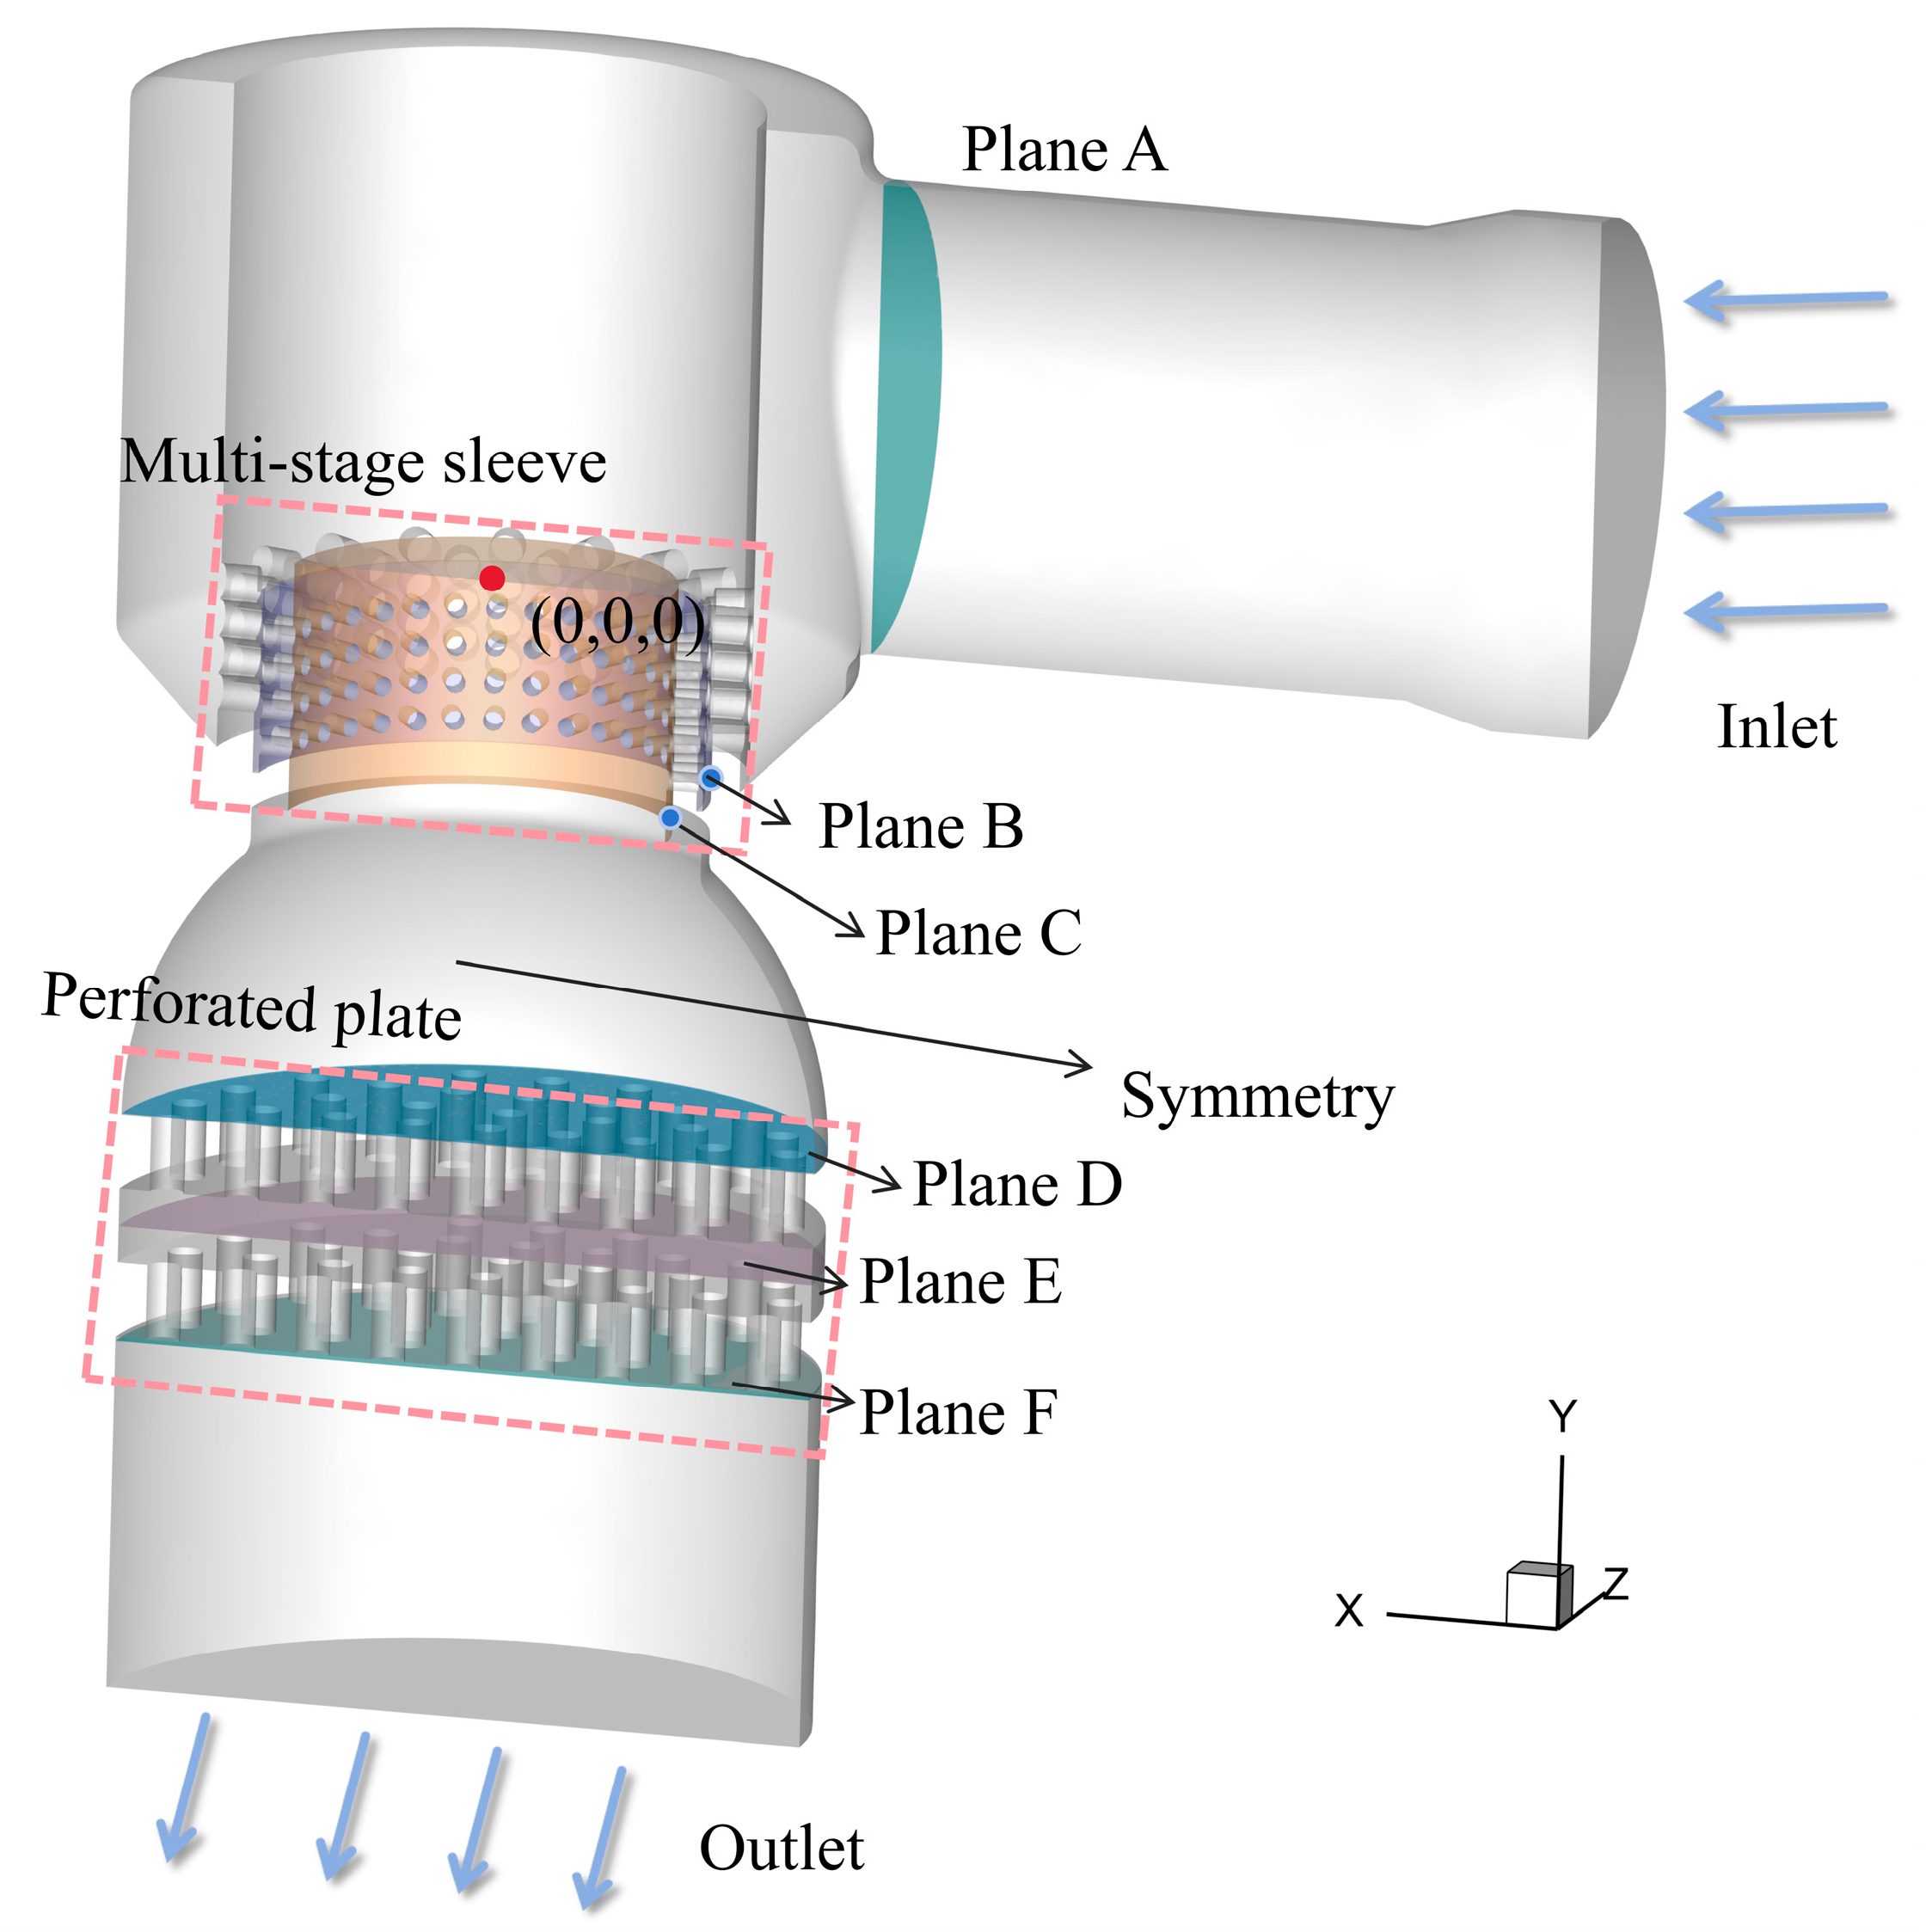
Figure 2: Half computational domain of the MSPRV, flow direction, and characteristic-plane locations.
Table 1: Baseline geometric parameters of the MSPRV.
| Parameter | Value |
|---|---|
| Inlet diameter | 104.5 mm |
| Outlet diameter | 142.5 mm |
| Primary-sleeve orifice diameter | 7 mm |
| Secondary-sleeve orifice diameter | 4 mm |
| Groove thickness | 1.25 mm |
| Perforated-plate thickness | 15 mm |
| Inlet radial-passage length | 152.5 mm |
| Axial length from the main throttling section to the outlet | 200 mm/230 mm (two-stage perforated-plate configuration) |
3.1 Computational Domain, Mesh Generation, and Grid-Independence Assessment
To balance numerical accuracy and computational cost, the fluid domain was extracted and a symmetric half model was adopted as the computational domain. The mesh was generated using ANSYS Meshing, with local refinement applied to the sleeve throttling holes, valve-core grooves, perforated plates, and other geometrically complex regions.
A grid-independence assessment was performed to establish the numerical accuracy and reliability of the simulations. For the high-pressure-drop cavitating condition with an outlet pressure of 0.1 MPa, six meshes containing 8.82 × 10⁵, 1.06 × 10⁶, 1.31 × 10⁶, 1.62 × 10⁶, 1.95 × 10⁶, and 2.54 × 10⁶ cells were generated. The outlet mass flow rate was selected as the grid-sensitivity metric.
As shown in Fig. 3, the outlet mass flow rate increased from 21.90 to 25.58 kg/s as the mesh was refined, exhibiting an initially rapid variation followed by convergence. Increasing the cell count from 8.82 × 10⁵ to 1.62 × 10⁶ produced a pronounced change in mass flow rate, indicating that the coarser meshes did not adequately resolve the flow. Further refinement substantially reduced the variation. When the cell count increased from 1.95 × 10⁶ to 2.54 × 10⁶, the outlet mass flow rate changed from 25.70 to 25.58 kg/s, corresponding to a relative difference of only approximately 0.47%. Additional refinement therefore had little effect on the result. Considering both accuracy and computational cost, the mesh containing approximately 1.95 × 10⁶ cells was adopted for all subsequent simulations.
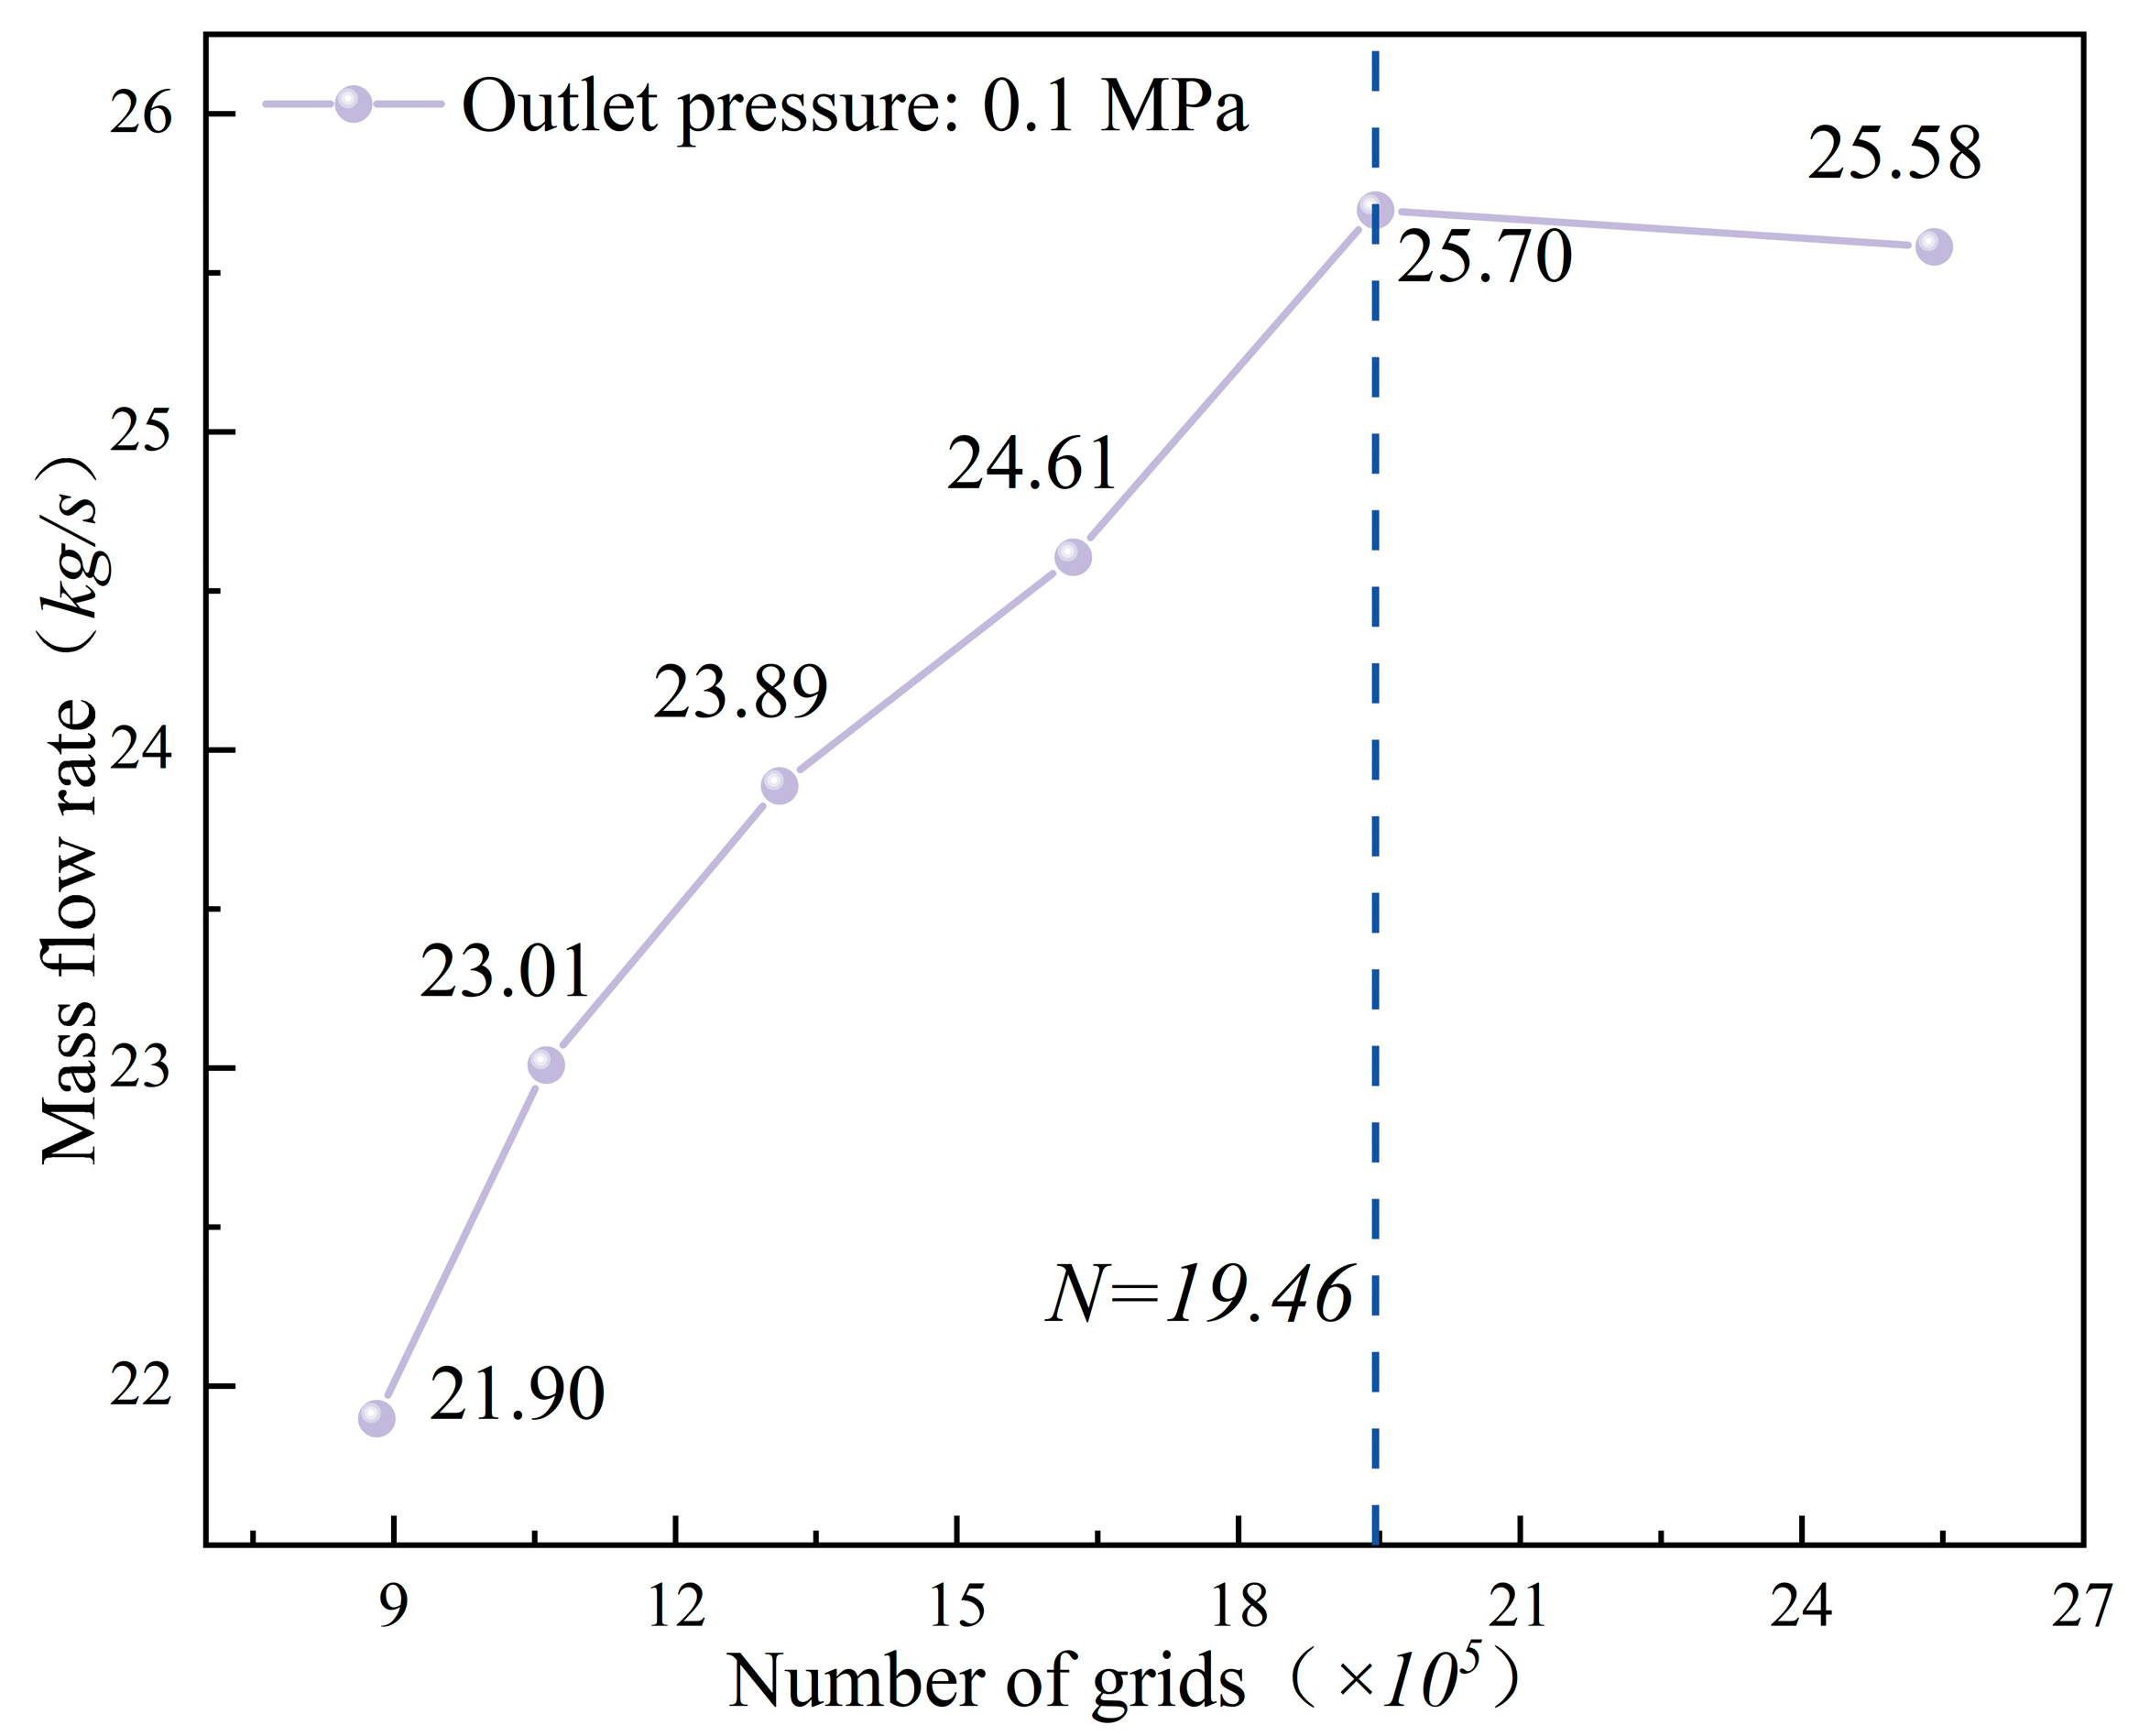
Figure 3: Grid-independence assessment based on outlet mass flow rate at an outlet pressure of 0.1 MPa.
Water was used as the working fluid to investigate the flow and cavitation characteristics of the MSPRV under high-pressure-drop conditions. Because the internal flow involves localized high-velocity jets, intense shear, flow separation, and liquid–vapor phase change, liquid water and water vapor were treated as a homogeneous mixture sharing a common velocity field, and a cavitation model was used to describe phase change in local low-pressure regions. The governing equations comprise the mixture continuity equation, momentum equation, vapor-volume-fraction transport equation, and turbulence-model equations. The mixture continuity equation is [9]:
Neglecting the weak compressibility of pressurized water, the mixture momentum equation is written as [14,29]:
The generation and condensation of vapor during cavitation are described by the vapor-volume-fraction transport equation:
To model liquid–vapor phase change caused by local pressure reduction inside the valve, the Zwart–Gerber–Belamri cavitation model was adopted. The model is derived from a simplified Rayleigh–Plesset bubble-dynamics relation and constructs the vaporization and condensation mass-transfer terms using the nucleation-site volume fraction, bubble radius, and vaporization and condensation coefficients [14]. It has been applied to cavitation prediction in complex throttling flows, including nuclear safety valves [3]. Previous studies have shown that predicted vapor distributions and cavity scales are sensitive to the turbulence model and empirical coefficients [10,16]. The present study requires steady parametric calculations for numerous hole radii, plate numbers, and outlet pressures in a complex multi-hole throttling passage. Owing to its relatively concise mass-transfer formulation and suitability for consistent multi-case calculations, the Zwart–Gerber–Belamri model was used to describe liquid–vapor mass transfer. The vaporization and condensation source terms are expressed as follows [14]:
For
For
Because strong near-wall shear, jet expansion, and rotational flow occur around the annular sleeve orifices, perforated-plate holes, and passage bends, the standard k–ω model was used for turbulence closure. Its steady transport equations are [9]:
3.3 Boundary Conditions and Solver Settings
Pressure-inlet and pressure-outlet boundary conditions were prescribed for the MSPRV. The inlet pressure was maintained at 2 MPa. For the configuration without a perforated plate, the outlet pressure was set to 0.8, 0.5, 0.3, 0.2, and 0.1 MPa to examine the flow and cavitation response to varying pressure drop. For the single- and two-stage perforated-plate configurations, the outlet pressure was fixed at 0.1 MPa to evaluate the effects of the plates under high-pressure-drop conditions on pressure-drop distribution, flow stability, and cavitation mitigation.
To compare the alternative throttling configurations under identical thermophysical conditions, the working fluid was simplified as water and the process was assumed to be isothermal, with heat transfer between the fluid and valve body neglected. The inlet vapor volume fraction was set to zero and the liquid volume fraction to unity. A pressure-outlet condition was imposed at the outlet, and all solid walls were treated as no-slip boundaries. Wall heat transfer was neglected and the saturation vapor pressure was held constant at 3540 Pa so that the effects of pressure, velocity, and turbulence structure on cavitation evolution could be isolated.
A pressure-based solver was employed, and pressure–velocity coupling was achieved using the SIMPLEC algorithm. Spatial gradients were evaluated using the least-squares cell-based method, and pressure was discretized using PRESTO! to improve resolution in regions of large pressure drop and strong pressure gradients. Under severe cavitation, interphase mass transfer, abrupt density variation, and rapid changes in the vapor interface can produce pronounced iterative oscillations. The momentum, vapor-volume-fraction, turbulent-kinetic-energy, and specific-dissipation-rate equations were therefore discretized using first-order upwind schemes to ensure stable and consistent convergence across all cases. It should be noted that first-order upwind discretization introduces numerical diffusion, which may smooth steep spatial gradients and attenuate the local peak values of velocity, turbulent kinetic energy, and vapor volume fraction. Accordingly, the present results are used primarily for relative comparisons among configurations evaluated using identical numerical settings.
Convergence was judged using the following criteria: the residual of the continuity equation was no greater than 1 × 10⁻³, those of the remaining governing equations were no greater than 1 × 10⁻⁴, inlet and outlet mass-flow fluctuations were below 0.5%, and the area-averaged pressures at key monitoring planes varied by less than 1%. After convergence, the inlet and outlet mass flow rates were in close agreement and satisfied global mass conservation, indicating stable numerical behavior.
3.4 Numerical Reliability Assessment and Qualitative Consistency Analysis
A reliability assessment of the numerical results is required before analyzing the flow and cavitation characteristics. The MSPRV considered here contains complex multi-stage sleeve passages, throttling grooves, and perforated plates. Owing to the geometric complexity of the complete valve, the safety constraints associated with high-pressure-drop testing, and the requirements for cavitation visualization, a full-valve cavitation experiment was not conducted in the present study.
Numerical reliability was assessed from four perspectives: grid independence, mass conservation, iterative convergence, and qualitative consistency with published results. The grid-independence study quantified the sensitivity to mesh density; comparison of inlet and outlet mass flow rates verified global mass conservation; and the residual histories, outlet mass flow rate, and area-averaged pressures at characteristic sections were monitored to confirm that a stable solution had been reached. These checks establish numerical convergence and internal consistency.
The predicted cavitation trends are also consistent with the fundamental behavior reported for nuclear valves, control valves, and porous throttling structures [3,4,9,20,23,24,25]. As the outlet back pressure decreases, the overall pressure drop increases, the local pressure in the throttling holes and downstream jet regions falls, and both the vapor volume fraction and cavitation extent increase. Cavitation is concentrated at sleeve and perforated-plate holes and in downstream low-pressure jets and pressure-recovery regions [3,4,9,23,25]. Adding a single perforated plate increases the local resistance in the outlet section, raises the back pressure downstream of the secondary sleeve, and reduces sleeve cavitation. If the holes are too small, however, the pressure drop becomes concentrated across the plate, creating a new low-pressure cavitating region at and immediately downstream of the holes [20,23,24,25]. Previous investigations of multi-stage perforated plates and multilayer cages have likewise shown that appropriate staging and spacing redistribute the total pressure drop and reduce the loading on each throttling element [20,22,29]. The present results are therefore physically consistent with published observations in terms of cavitation location and qualitative trends.
Previous studies indicate that the credibility of a cavitation model should be evaluated against both global hydraulic quantities, such as mass flow rate and pressure drop, and local features, such as cavity location, length, and vapor distribution [3,28]. Cavitation predictions are also affected by the turbulence model, empirical phase-change coefficients, and discretization error [10,26,27]. Consequently, the present results are used for relative comparison among configurations, flow-mechanism analysis, and engineering screening under common boundary conditions. Their quantitative accuracy for mass flow rate, cavity scale, and local peak values still requires confirmation through future full-valve or equivalent throttling-element experiments.
4 Flow and Cavitation Characteristics of the MSPRV without Perforated Plates under Varying Back Pressure
4.1 Pressure-Gradient Characteristics
Preliminary calculations indicated no cavitation at an outlet pressure of 1 MPa. Five outlet-pressure conditions—0.8, 0.5, 0.3, 0.2, and 0.1 MPa—were therefore selected to span the transition from weak to severe cavitation.
To quantify the pressure evolution along the main flow path under different pressure-drop conditions, the static pressure was extracted along the centerline in the negative Y direction, as shown in Fig. 4A. The sampling path extends from below the valve core to the outlet section and captures the pressure change as the fluid passes through the multi-stage sleeves and enters the downstream passage. The pressure profiles exhibit similar overall trends for all outlet pressures. Pressure remains high near the upstream sleeve and valve core, decreases sharply through the sleeve-throttling region, and then approaches the prescribed outlet pressure in the downstream passage. The principal pressure drop therefore occurs across the sleeve region. As the outlet pressure decreases from 0.8 to 0.1 MPa, the entire pressure profile shifts downward and the pressure gradient increases markedly.
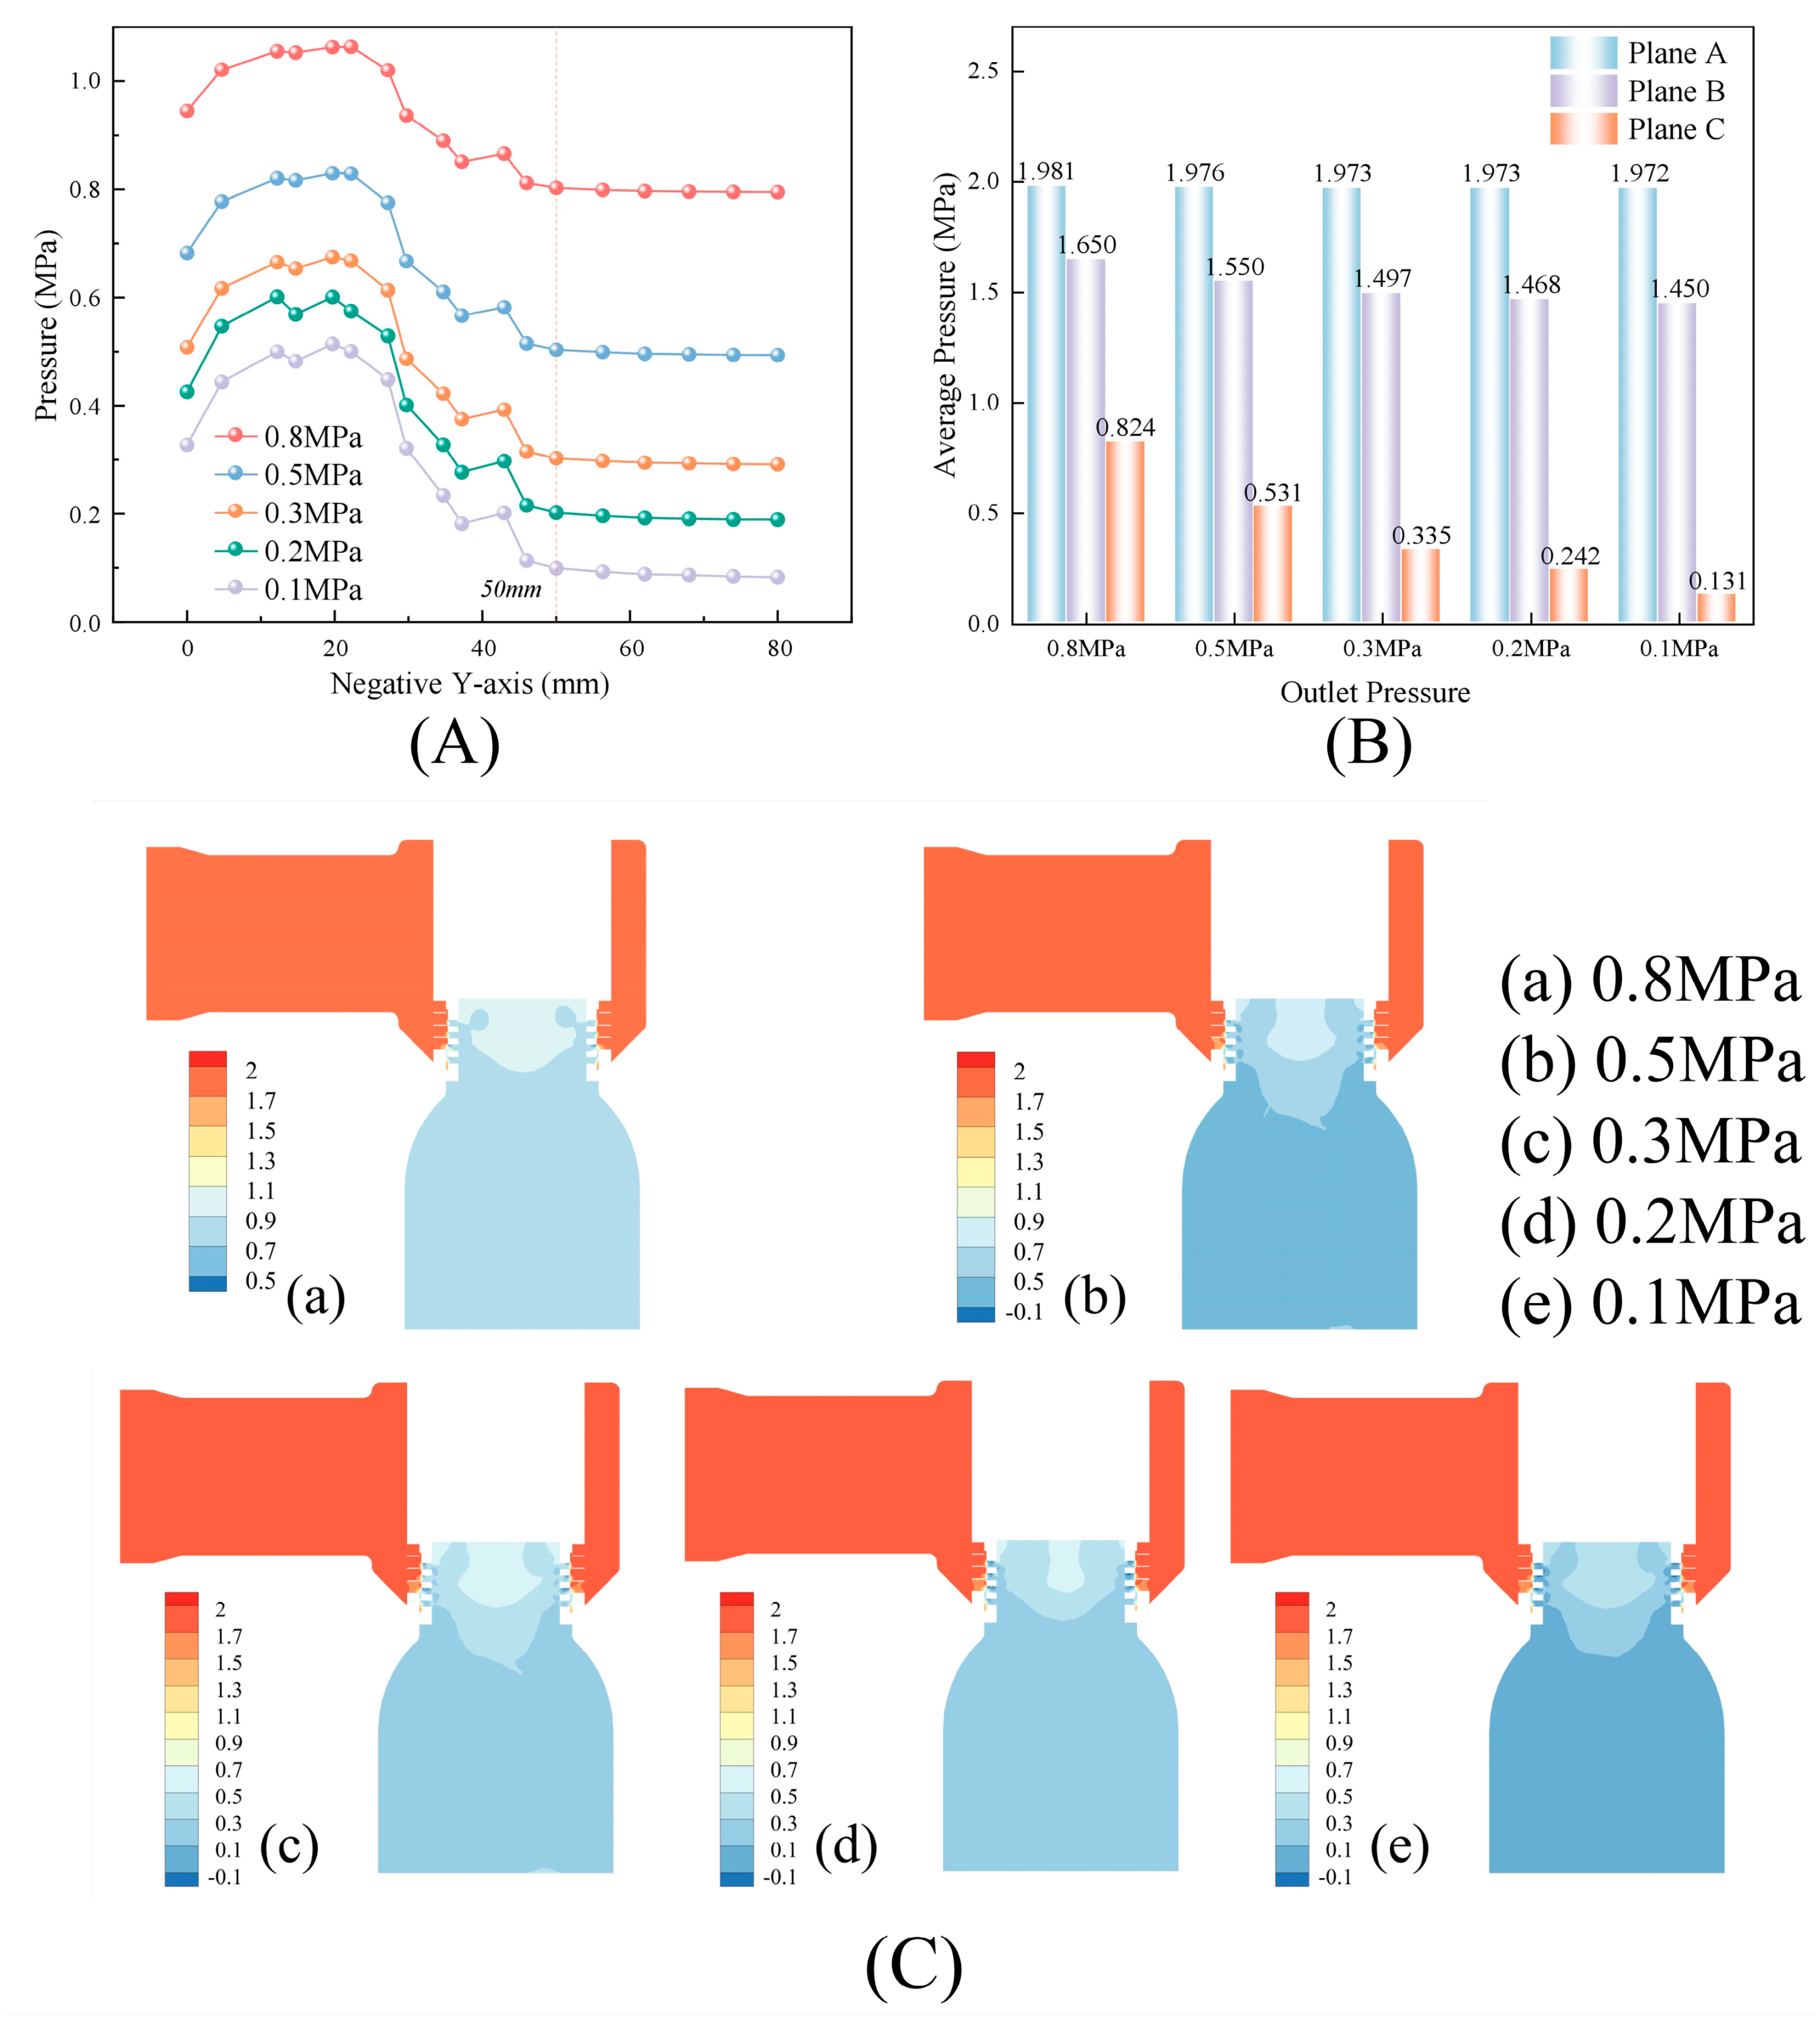
Figure 4: Pressure characteristics at different outlet pressures: (A) static-pressure distribution along the negative Y direction; (B) area-weighted average static pressure at the characteristic planes; (C) static-pressure contours.
As shown in Fig. 4B, the pressure at Plane A changes only slightly as the outlet pressure decreases, indicating that the inlet passage and the region upstream of the valve core are governed primarily by the inlet boundary condition. In contrast, the pressure at Plane B decreases from 1.650 to 1.450 MPa, while that at Plane C drops sharply from 0.824 to 0.131 MPa. At an outlet pressure of 0.1 MPa, the pressure drop from Plane A to Plane B is 0.522 MPa, accounting for approximately 28.4% of the principal throttling pressure drop, whereas the pressure drop from Plane B to Plane C is 1.319 MPa, accounting for approximately 71.6%. The outlet back pressure therefore acts most strongly on the secondary-sleeve region, which carries the dominant portion of the pressure release. As the fluid passes through the sleeve orifices, contraction converts static-pressure energy into kinetic energy and produces high-velocity downstream jets. These jets undergo sudden expansion in the larger outlet chamber, generating strong velocity gradients, shear layers, flow separation, and local recirculation. The corresponding static-pressure contours are shown in Fig. 4C.
As the jets expand downstream, entrainment of the surrounding low-velocity fluid and transverse momentum exchange progressively attenuate the axial momentum. Part of the kinetic energy is transferred through the turbulent cascade and dissipated, while the static pressure gradually recovers. Lowering the outlet pressure increases the pressure difference across the orifices, strengthens the jet momentum, extends the downstream low-pressure core, and shifts pressure recovery farther downstream. Pressure-drop concentration across the secondary sleeve therefore controls not only the local velocity peak but also jet expansion, recirculation development, and the axial extent of the low-pressure core. The secondary sleeve and its immediate downstream region are consequently the principal cavitation-prone locations in the valve.
4.2 Jet Expansion, Turbulent Dissipation, and Evolution of Vortical Structures
Fig. 5 presents the velocity and turbulent kinetic energy (TKE) distributions along the negative Y direction at different outlet pressures. The corresponding velocity contours and high-TKE regions are shown in Fig. 6A,B, respectively. In all cases, the velocity rises rapidly in the secondary-sleeve region and then decays along the outlet passage. When the outlet pressure decreases from 0.8 to 0.1 MPa, the maximum velocity increases from 47.134 to 61.876 m/s. The lower back pressure intensifies contraction and acceleration through the sleeve holes. After leaving the holes, multiple high-velocity jets expand into the surrounding low-speed fluid and lose axial momentum through entrainment, mixing, and wall interactions. A lower outlet pressure produces larger initial jet momentum and a longer jet core, thereby delaying both downstream velocity decay and static-pressure recovery.
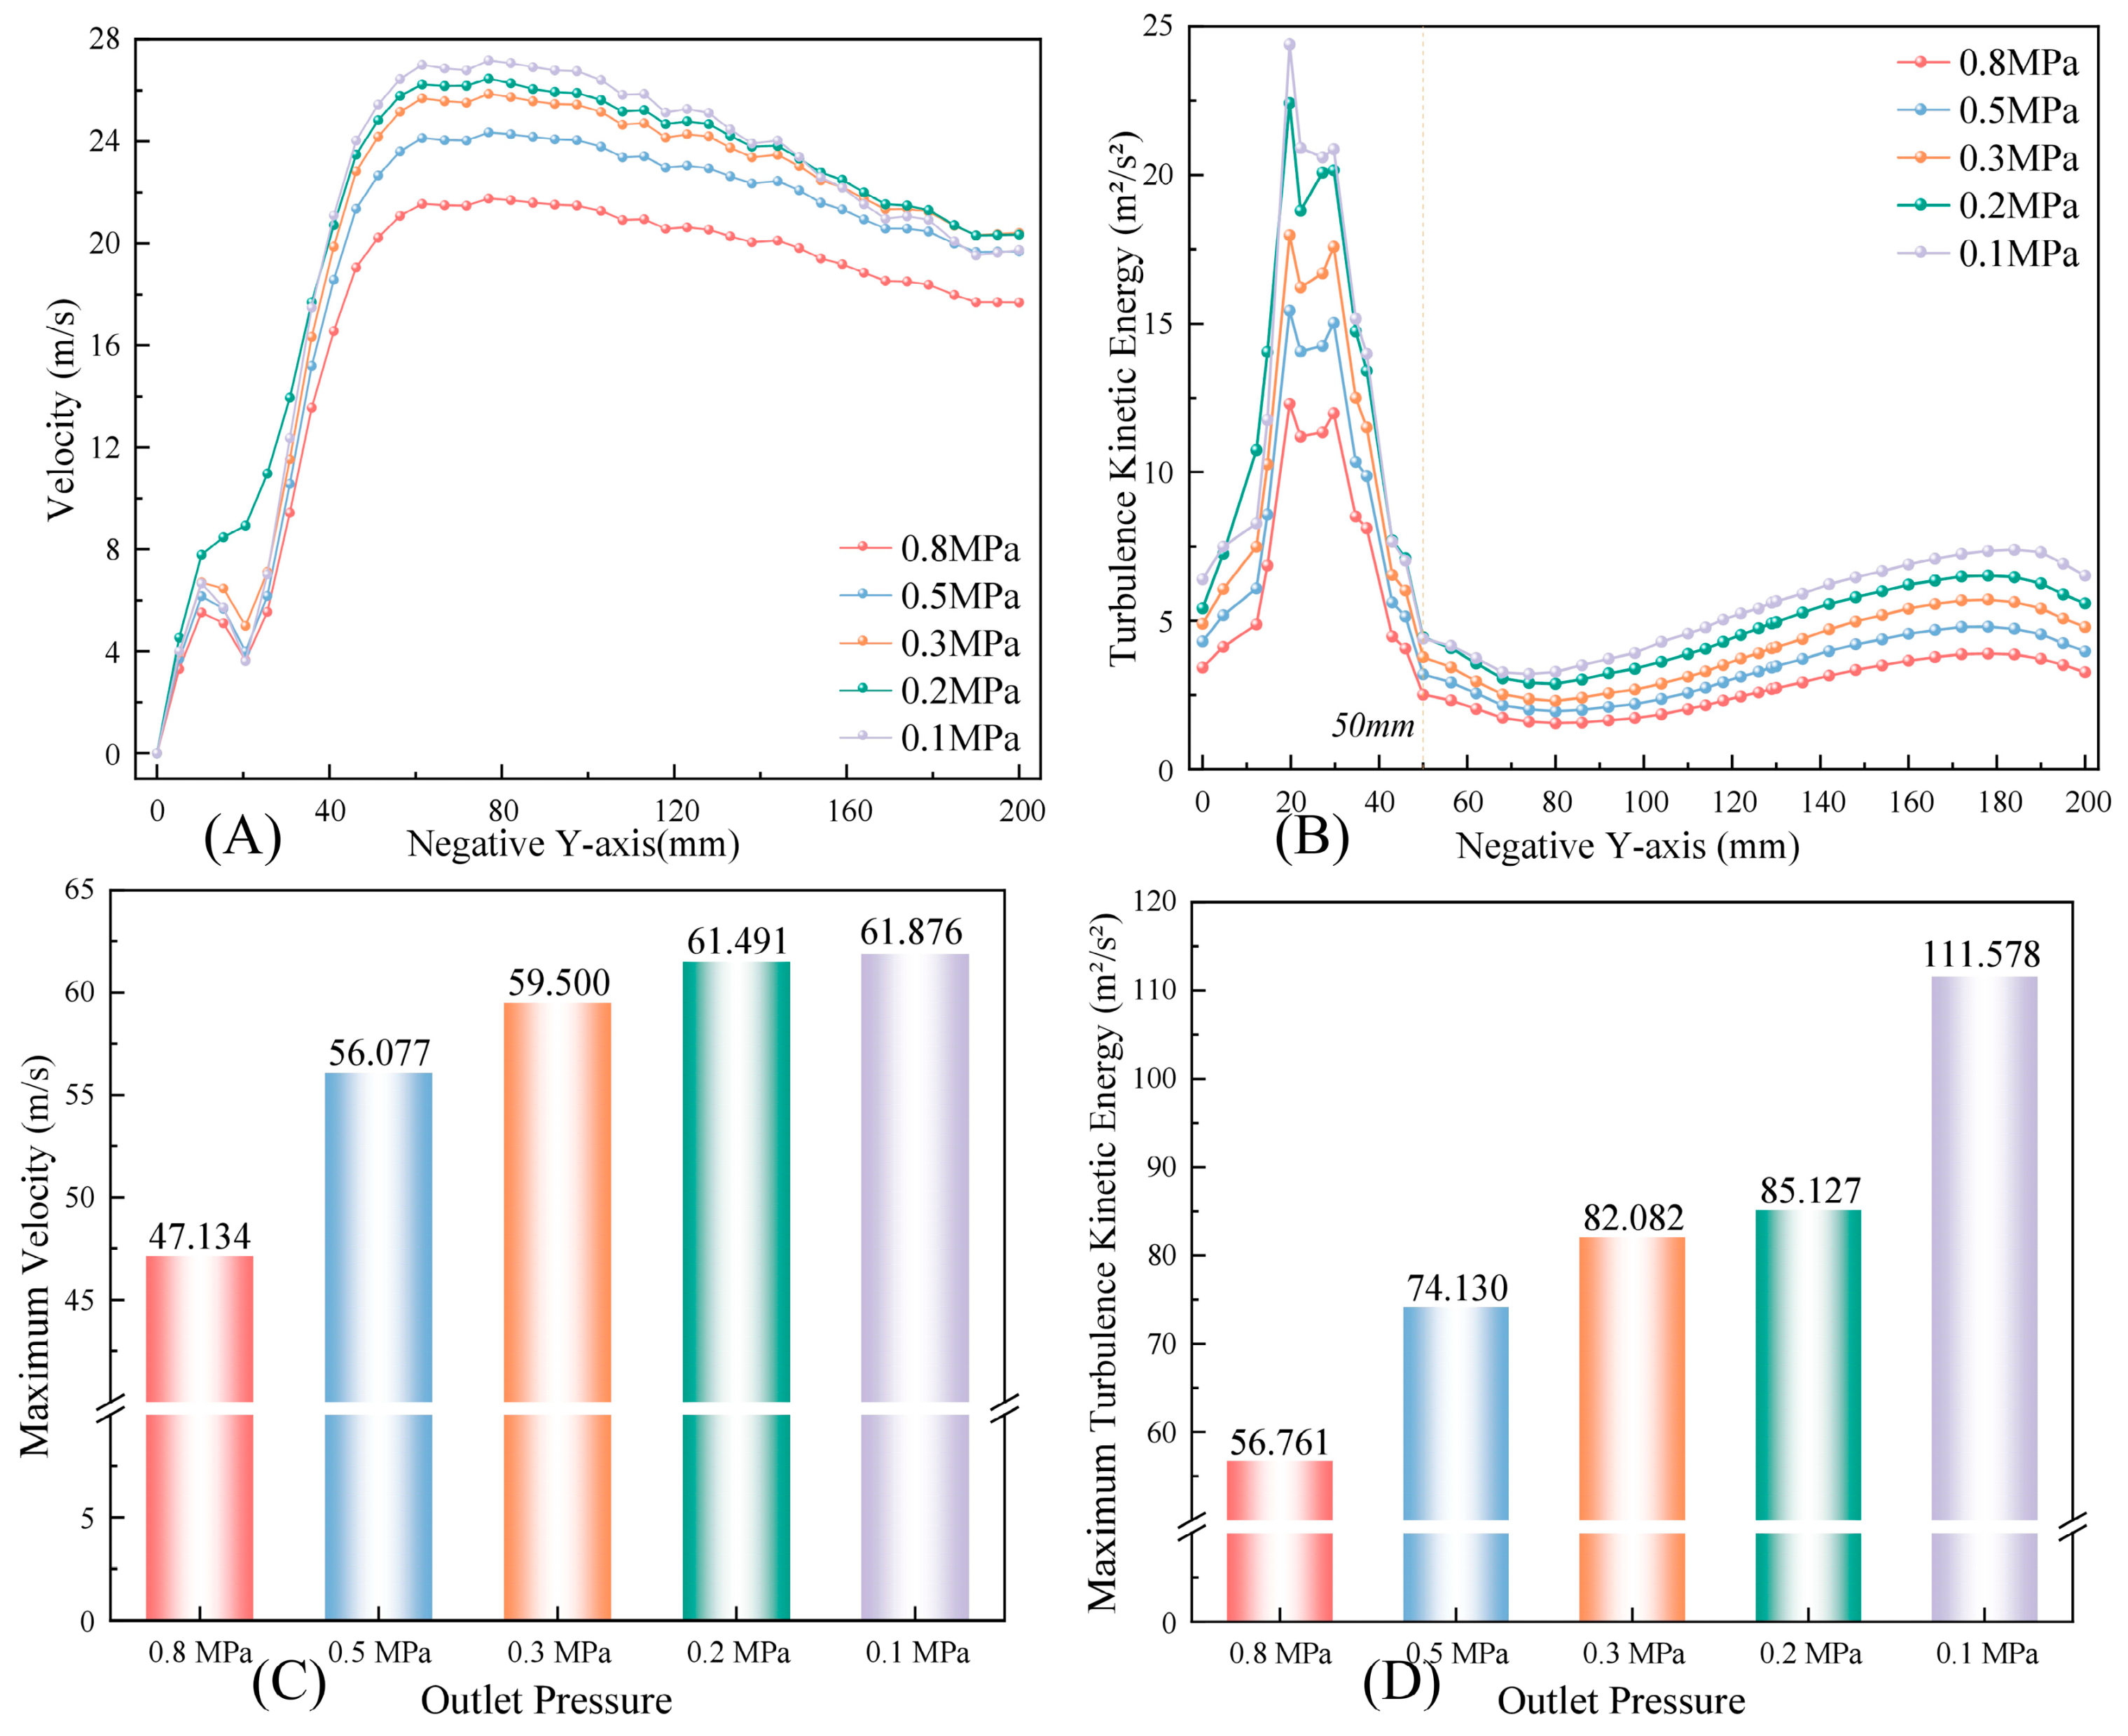
Figure 5: Flow parameters at different outlet pressures: (A) velocity along the negative Y direction; (B) TKE along the negative Y direction; (C) maximum velocity; (D) maximum TKE.
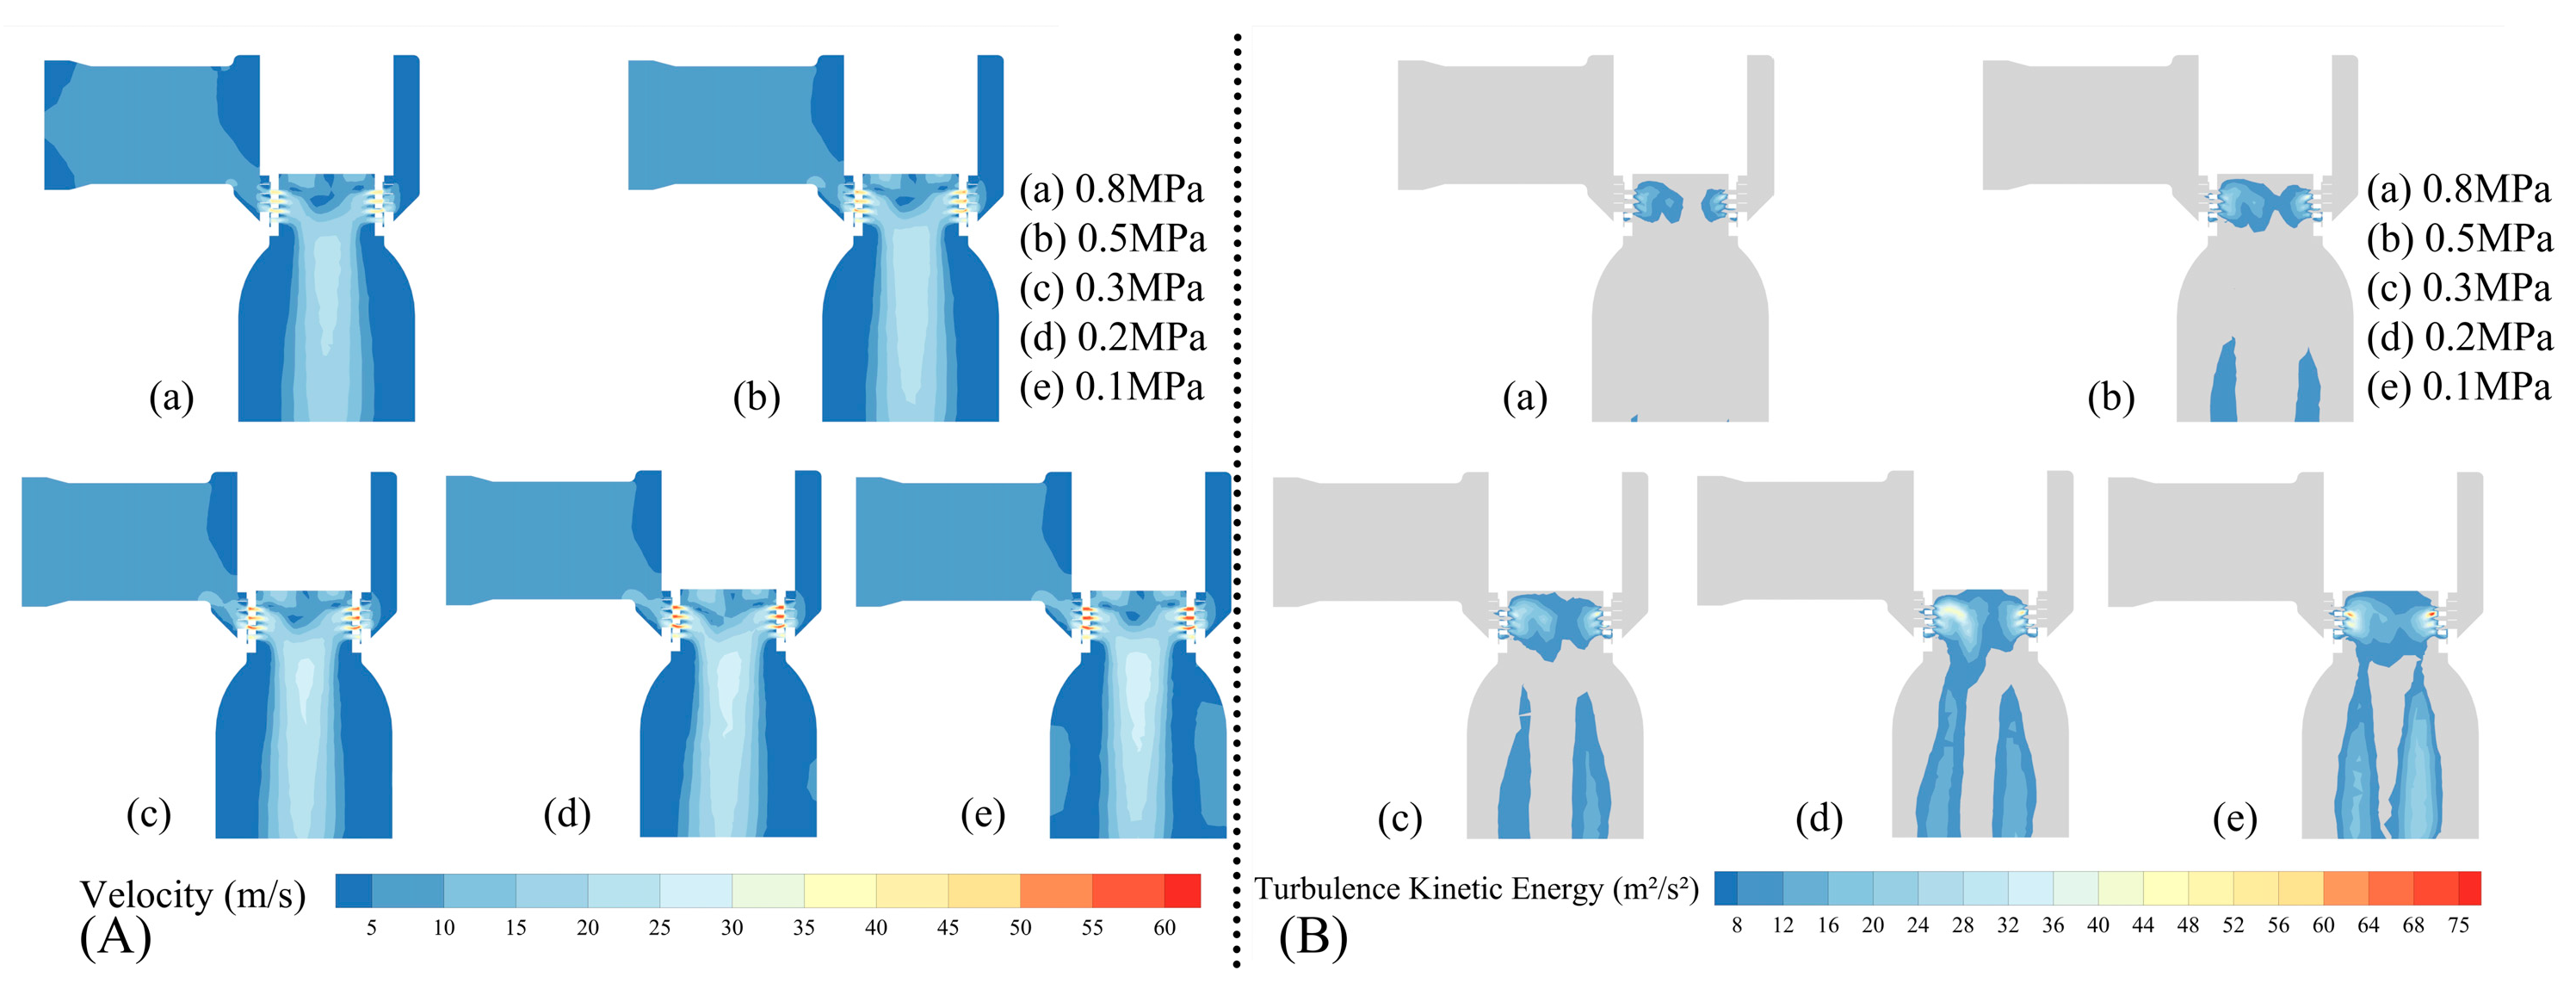
Figure 6: (A) Velocity contours and (B) high-TKE regions (k > 8 m2/s2) at different outlet pressures: (a) 0.8 MPa; (b) 0.5 MPa; (c) 0.3 MPa; (d) 0.2 MPa; and (e) 0.1 MPa.
The TKE peak is likewise concentrated at the secondary-sleeve holes and in the immediate downstream region, increasing from 56.761 to 111.578 m2/s2 as the outlet pressure decreases. This trend reflects the intensified shear between the high-velocity jets and the surrounding slower fluid. Interaction among the multiple jets, continuous entrainment across the shear layers, and flow separation and recirculation in the expansion chamber cause the mean turbulent fluctuation energy to accumulate rapidly near the sleeve. Farther downstream, the velocity gradient and TKE decrease, indicating that the jet cores expand and attenuate and that the flow enters a stage of momentum equalization and static-pressure recovery.
The turbulent dissipation rate in Fig. 7A provides further insight into the TKE-transfer process. Multiple dissipation peaks occur between approximately 15 and 40 mm along the negative Y direction, coinciding with the sleeve holes, jet-interaction zones, and geometric discontinuities. The dissipation rate increases markedly as the outlet pressure decreases; under the 0.1 MPa condition, the near-field peak is on the order of 8 × 10⁴ m2/s3. This indicates that TKE generated by intense shear is rapidly transferred to smaller scales and ultimately dissipated by viscosity. The simultaneous occurrence of high TKE and high dissipation identifies the secondary-sleeve near field as both a turbulence-production zone and an energy-dissipation zone. The pronounced reduction in dissipation downstream indicates weakening jet shear and gradual flow recovery.
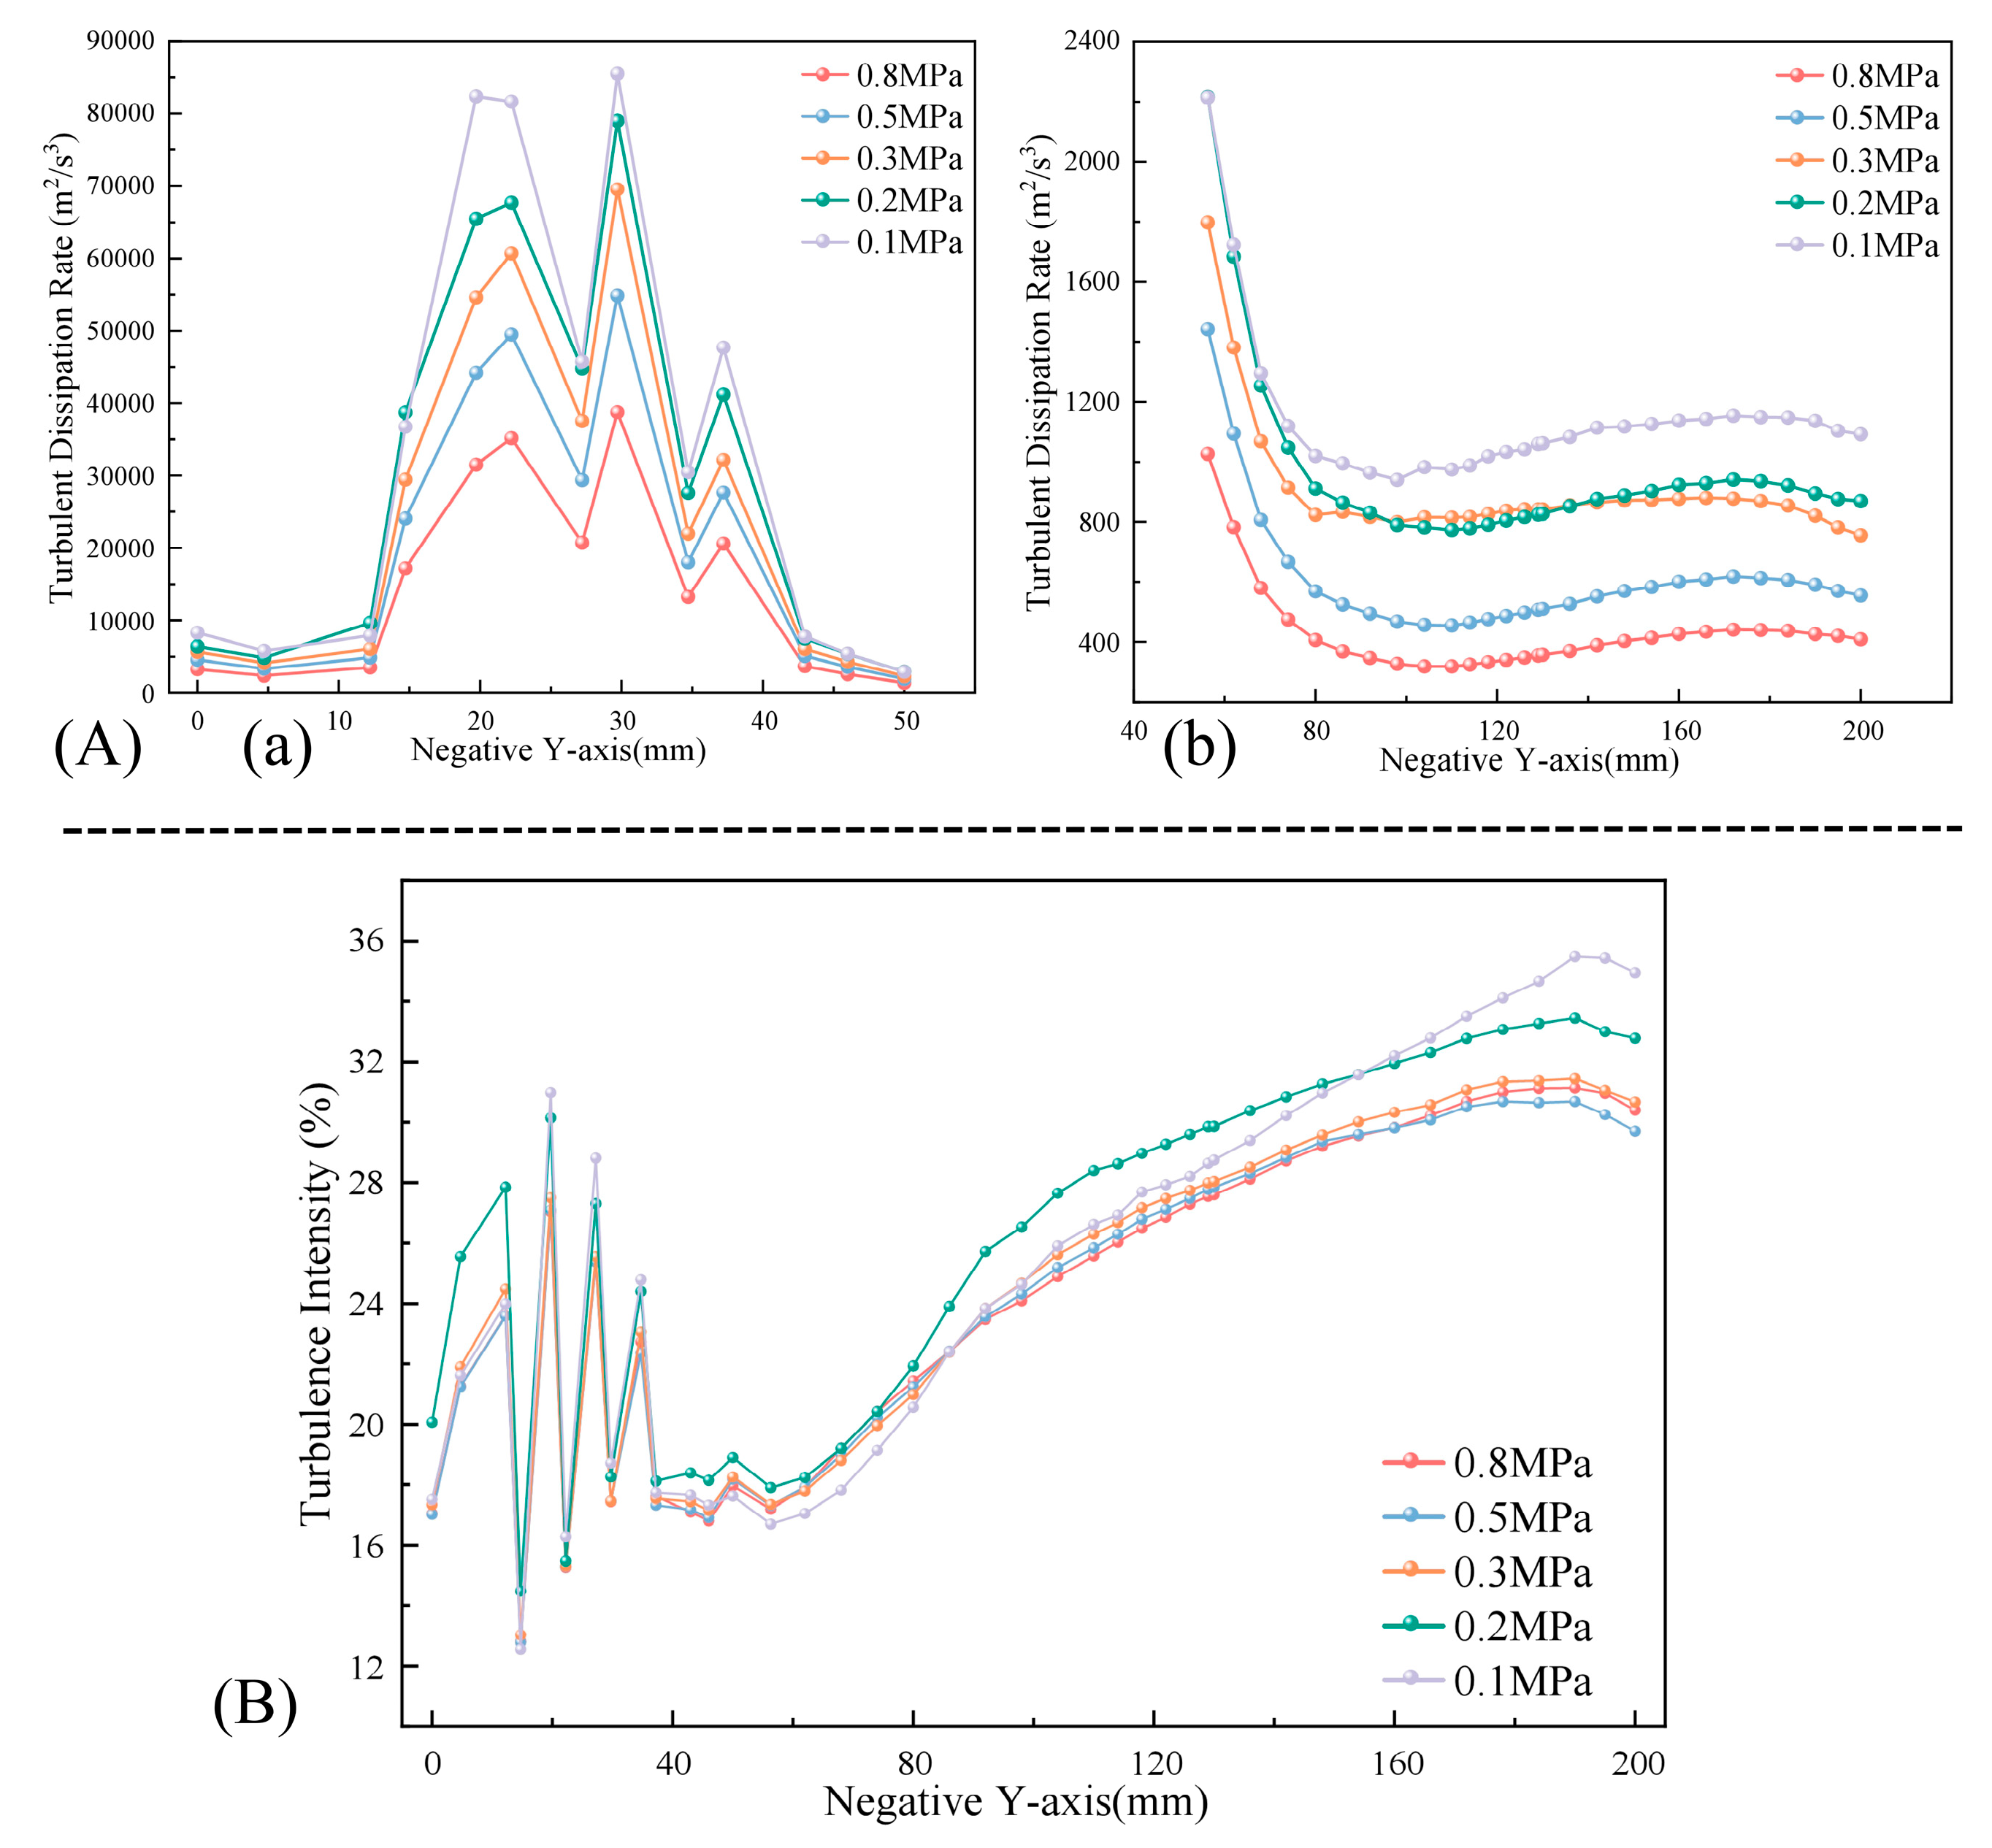
Figure 7: Turbulence characteristics along the negative Y direction at different outlet pressures: (A) turbulent dissipation rate, including (a) the near-field region from 0 to 50 mm and (b) the downstream region from 40 to 200 mm; (B) turbulence intensity.
Turbulence intensity characterizes the velocity fluctuation relative to the local mean velocity and is defined as
Turbulence intensity characterizes the strength of velocity fluctuations relative to the local mean velocity. It, as shown in Fig. 7B, exhibits a pronounced multi-peak distribution along the flow direction. Peak values of approximately 25%–31% occur near the sleeves, indicating strong relative velocity fluctuations associated with the orifice jets, flow separation, and recirculation. The turbulence intensity continues to increase in the downstream passage and approaches 35% at an outlet pressure of 0.1 MPa. Because turbulence intensity is the ratio of fluctuation velocity to mean velocity, an increase may reflect either stronger fluctuations or a reduction in the mean velocity; it cannot, by itself, be interpreted as an increase in absolute turbulent energy. Considered together with the TKE and dissipation-rate distributions, the results show that lower outlet pressures sustain a higher level of downstream turbulent activity, and the non-uniformity generated by the high-velocity jets requires a longer distance for momentum equalization and energy dissipation.
The vorticity profiles in Fig. 8A exhibit multiple peaks near 15, 23, 30, and 38 mm along the negative Y direction, indicating large velocity gradients at the sleeve holes, jet boundaries, and geometric discontinuities. Flow through the multi-stage sleeves is therefore not a simple one-dimensional acceleration process but involves three-dimensional jet interaction, separation, reattachment, and time-averaged rotational motion. Vorticity contains contributions from both shear and rotation and cannot by itself identify vortical structures. The Q criterion was therefore applied to the mean velocity field. Regions with Q > 0 are considered vortical because the local rotation rate exceeds the strain rate. A common iso-value of Q = 1.0 × 10⁴ s−2 was used for all comparative cases. This threshold was selected to provide clear identification of the dominant structures in the baseline case; the Q-criterion results are used only to compare spatial location and connectivity rather than as a universal physical threshold. Vortical structures shown in Fig. 8B are concentrated downstream of the secondary sleeve, in jet-interaction regions, and in recirculation zones along the sides of the expansion passage. At higher outlet pressures they remain confined to the sleeve near field, whereas decreasing the outlet pressure increases their volume and connectivity and extends them downstream.
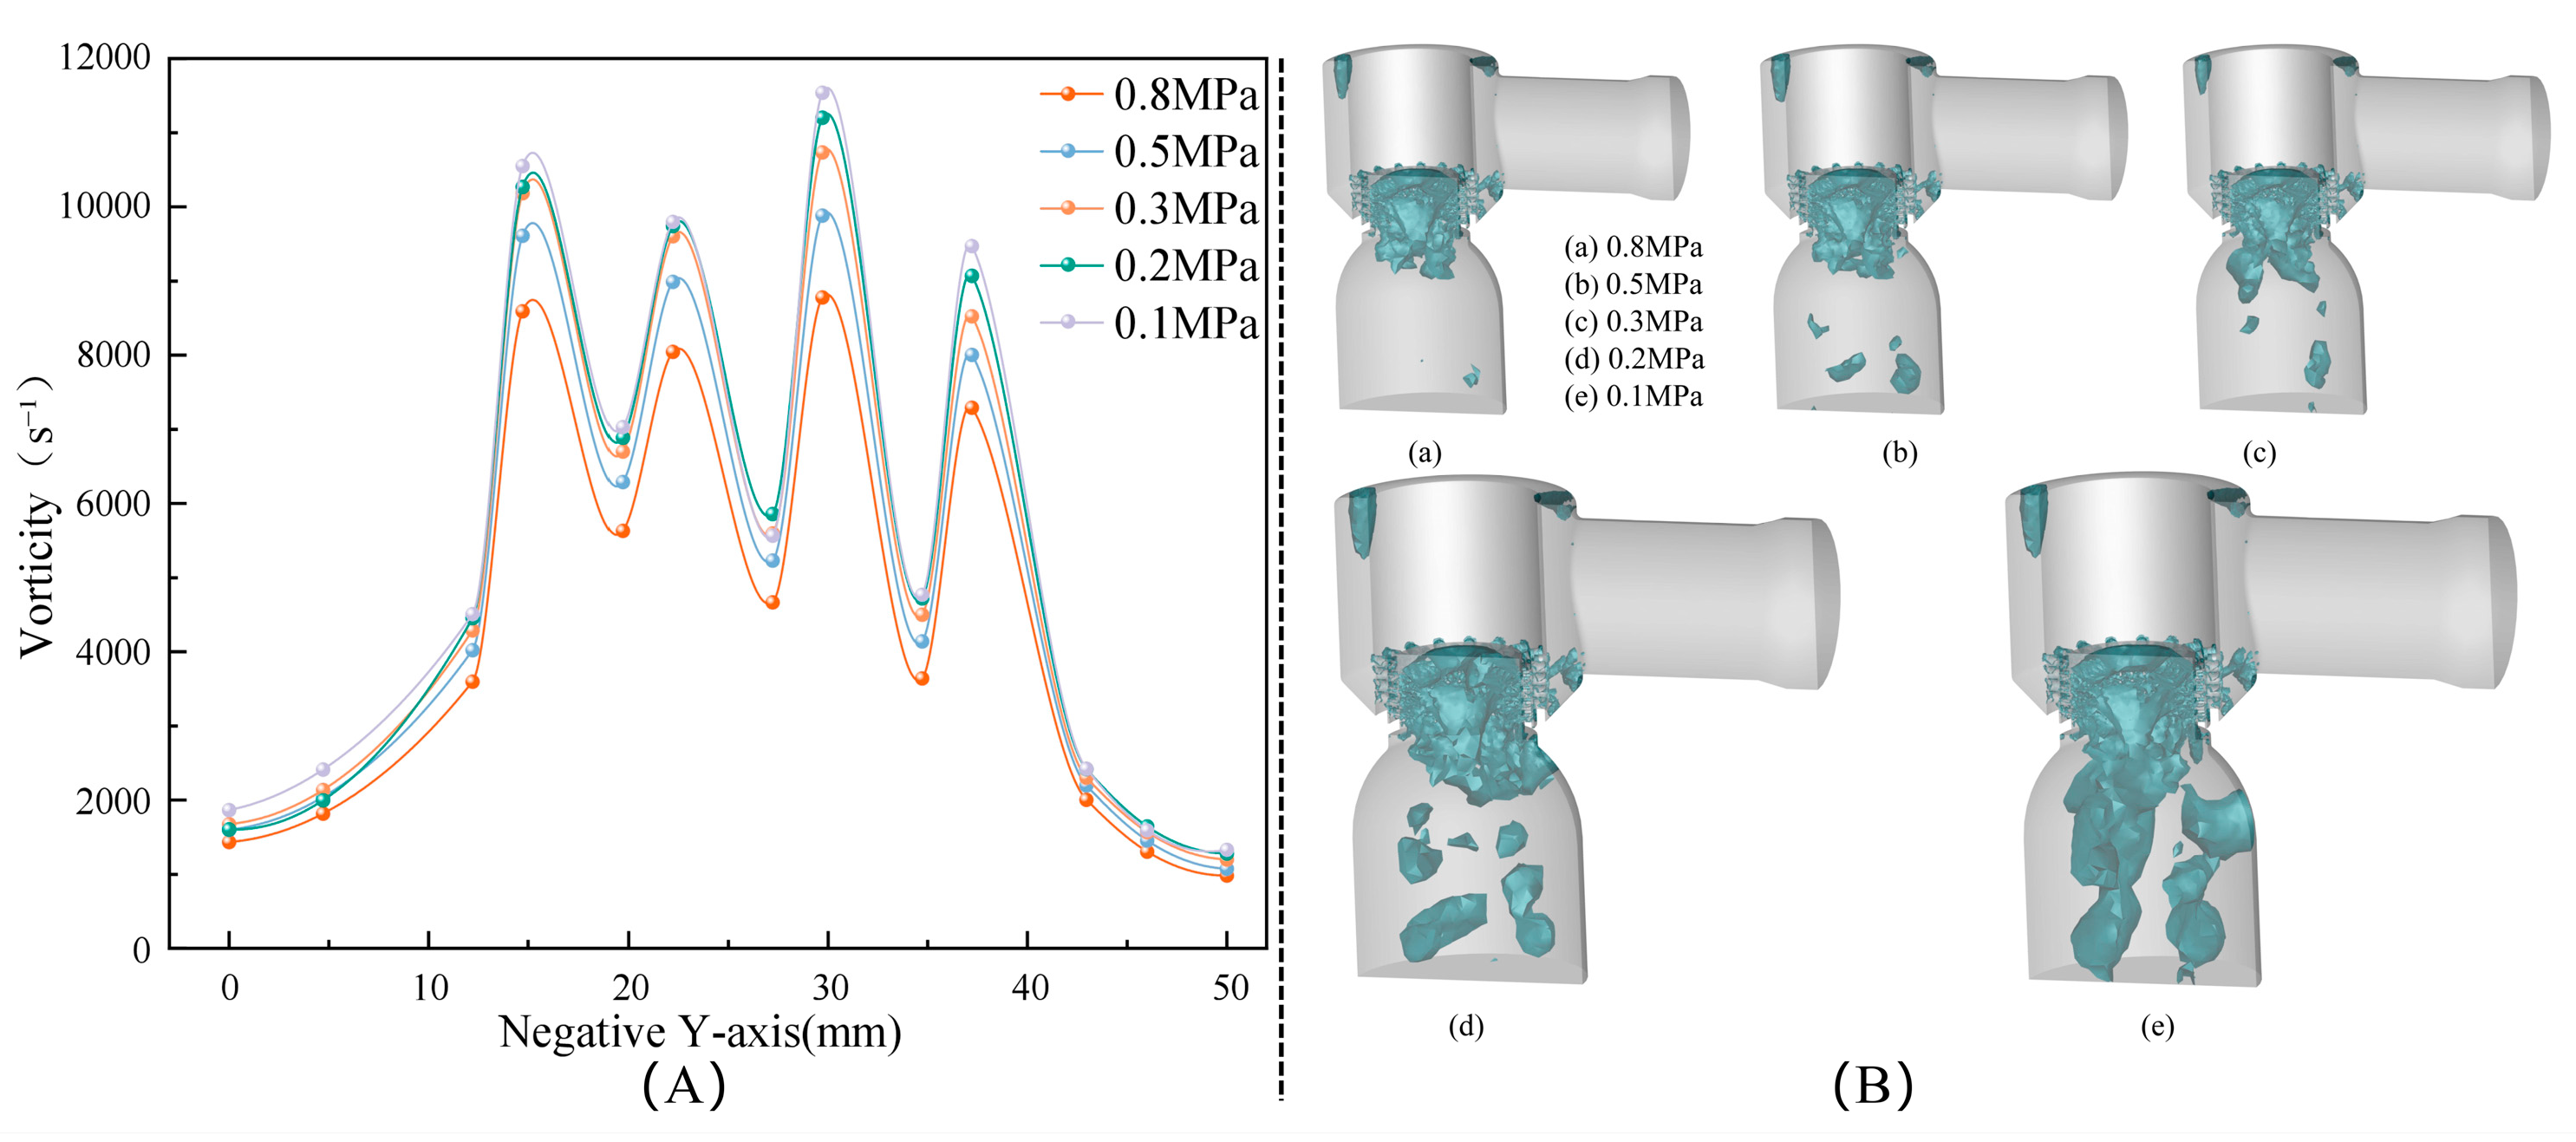
Figure 8: Rotational-flow characteristics at different outlet pressures: (A) vorticity distribution along the negative Y direction; (B) time-averaged vortical structures identified using the Q criterion (Q = 1.0 × 10⁴ s−2).
The combined pressure, velocity, TKE, dissipation-rate, turbulence-intensity, and Q-criterion results reveal the following flow-development mechanism for the configuration without a perforated plate. The concentrated pressure drop across the secondary sleeve first generates high-velocity jets. Sudden expansion downstream of the holes creates intense shear layers, flow separation, and local recirculation. Interaction between the shear layers and multiple jets rapidly generates TKE and produces high dissipation in the sleeve near field. Recirculation and vortical structures delay jet-momentum equalization and static-pressure recovery, allowing the low-pressure core to persist over a longer downstream distance. Cavitation inception is directly governed by the local static pressure approaching or falling below the saturation vapor pressure; turbulence and vortical structures are not sufficient conditions for cavitation, but they modulate its development by altering jet mixing, recirculation, and the persistence of low-pressure regions. Because the present analysis is based on steady RANS, the Q criterion and turbulence quantities represent time-averaged flow features and do not resolve transient vortex shedding or pressure pulsation.
4.3 Cavitation Development at Different Outlet Pressures
Cavitation is evaluated from three complementary perspectives: tendency to vaporize, local vapor intensity, and overall vapor extent. To characterize the mean vaporization-pressure margin near the outlet of the terminal throttling element, the downstream cavitation number is defined as follows:
Fig. 9A shows the vapor-volume-fraction distribution in the secondary-sleeve region at different outlet pressures, and Fig. 9B compares the maximum and regional mean vapor volume fractions. Table 2 lists the corresponding downstream cavitation number, σd, and equivalent vapor volume. As the outlet pressure decreases from 0.8 to 0.1 MPa, σd decreases continuously from 7.861 to 1.088, indicating a progressively smaller pressure margin above the saturation vapor pressure downstream of the secondary sleeve. Over the same range, the maximum vapor volume fraction increases from 0.213 to 0.929, the regional mean value increases from 0.049% to 29.372%, and equivalent vapor volume increases from 5.323 × 10⁻¹⁰ to 1.070 × 10⁻⁶ m3, an increase of approximately 2.0 × 10³. Lowering the outlet pressure therefore increases both the local vapor peak and the overall volume and spatial coverage of the vapor region.
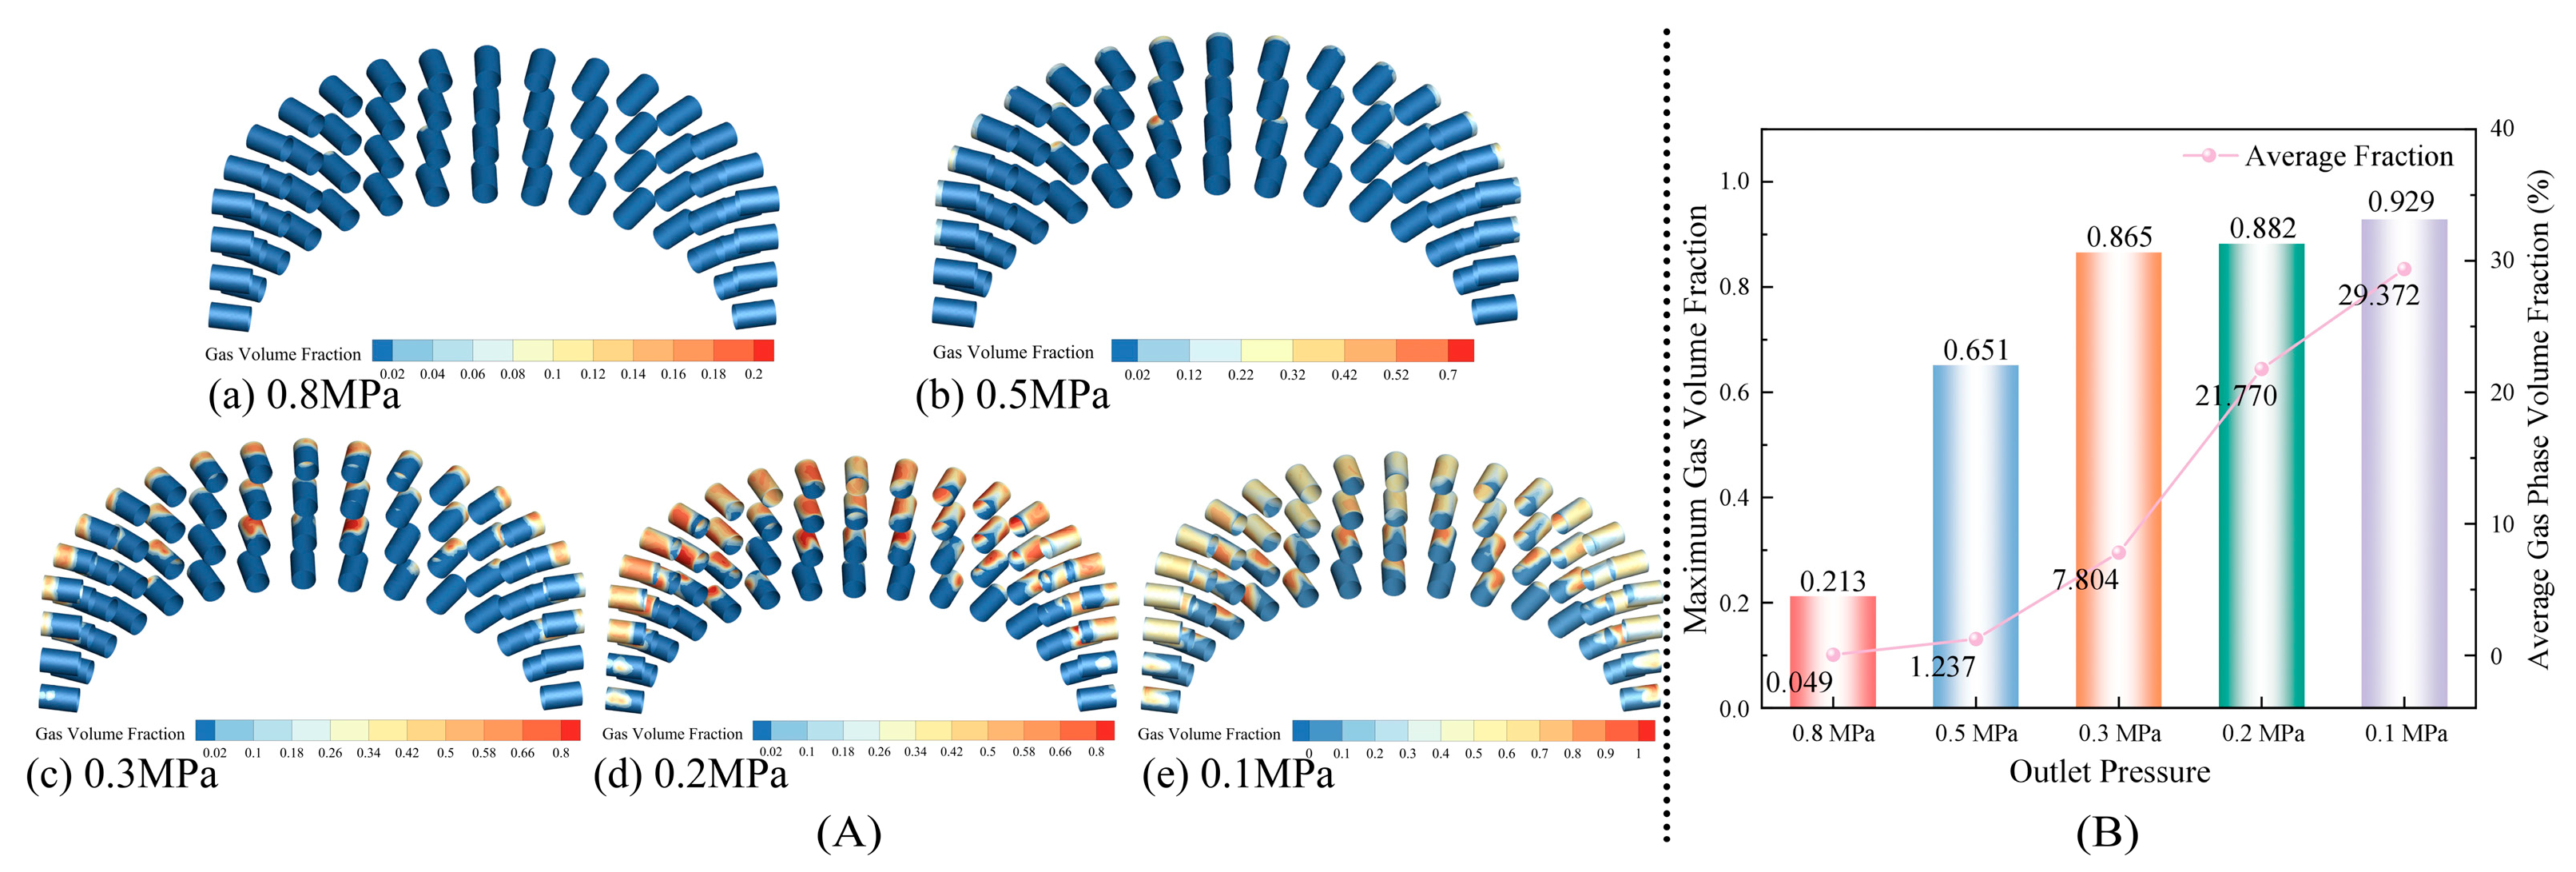
Figure 9: Vapor characteristics in the secondary-sleeve region at different outlet pressures: (A) vapor-volume-fraction distribution; (B) maximum and regional mean vapor volume fractions.
Table 2: Steady cavitation metrics for the configuration without a perforated plate.
| Outlet Pressure/MPa | 0.8 | 0.5 | 0.3 | 0.2 | 0.1 |
|---|---|---|---|---|---|
| Downstream cavitation number, σd | 7.861 | 4.189 | 2.481 | 1.791 | 1.088 |
| Equivalent vapor volume, V/m3 | 5.323367 × 10⁻¹⁰ | 1.757115 × 10⁻⁸ | 1.723459 × 10⁻⁷ | 5.798089 × 10⁻⁷ | 1.070069 × 10⁻⁶ |
As shown in Fig. 9A, at an outlet pressure of 0.8 MPa, vapor appears only as a small number of isolated patches near the sharp hole edges and in the immediate near field, corresponding to weak localized cavitation. At 0.5–0.3 MPa, the regional mean vapor volume fraction and equivalent vapor volume increase much more rapidly than the local maximum, and the initially isolated regions expand and begin to merge. This range therefore represents a sensitive transition from local inception to more extensive developed cavitation. When the outlet pressure is further reduced to 0.2–0.1 MPa, the maximum vapor volume fraction approaches its upper limit while equivalent vapor volume continues to increase, indicating that further deterioration is governed primarily by expansion and increased connectivity of the vapor region rather than by a substantial rise in the local peak. The maximum vapor volume fraction alone is therefore insufficient under severe cavitation; the regional mean value and equivalent vapor volume more effectively characterize the overall expansion.
The pressure and flow fields explain this progression. Reducing the outlet back pressure increases the pressure drop carried by the secondary sleeve, accelerates the flow through the holes, and generates stronger downstream jets. When these jets enter the expansion chamber, intense shear develops against the surrounding low-speed fluid and induces separation and local recirculation. Vortical regions identified by the Q criterion are concentrated downstream of the sleeve and at jet-interaction locations, where they delay momentum equalization and pressure recovery and thereby sustain the low-pressure core. Vapor first appears at sharp edges and within the low-pressure jet cores when the local static pressure approaches the saturation vapor pressure, and then expands along the shear layers and recirculation boundaries. Pressure-drop concentration and inadequate pressure recovery are thus the direct causes of inception, while jet shear, recirculation, and rotational motion modulate the spatial development. The secondary sleeve and its immediate downstream region are the dominant locations for cavitation inception and growth.
5 Flow and Cavitation Characteristics of the Single-Stage Perforated-Plate Configuration
In the configuration without a perforated plate, increasing the pressure drop produces pronounced pressure-drop concentration, high-velocity jets, and elevated TKE in and downstream of the secondary sleeve, where cavitation is primarily located. To redistribute the excessive pressure drop carried by the secondary sleeve, a single perforated plate was installed in the outlet passage. Four plate designs with hole radii of 5.5, 4.5, 3.5, and 3.0 mm were evaluated at an outlet pressure of 0.1 MPa to determine the effect of hole size on the flow and cavitation behavior.
5.1 Design of the Single-Stage Perforated Plate
As shown in Fig. 10, the single perforated plate was installed in the valve outlet passage at a distance of 114.215 mm from the coordinate origin. The plate outer diameter matches the outlet-passage inner diameter, and the plate thickness is 15 mm. The plate contains 61 circular holes whose axes are parallel to the main flow direction. The hole centers are symmetrically arranged about the plate centerline in a staggered pattern to avoid excessive concentration of downstream jets at the same radial positions and to improve the uniformity of the cross-sectional flow distribution.
The 61 holes are not arranged at a uniform center-to-center spacing. The vertical pitch between adjacent rows is 15.4 mm. From the bottom row upward, the horizontal center-to-center spacings are 15.4, 15.4, 18.6, 15.0, and 17.0 mm. The horizontal spacing was adjusted according to the circular plate boundary and the number of holes that could be accommodated in each row, thereby maintaining sufficient ligament width while distributing the open area as uniformly as possible. Across the four designs, only the hole radius was varied; all hole-center locations and the staggered layout were retained. Hole radii of 5.5, 4.5, 3.5, and 3.0 mm were considered to quantify their effects on pressure-drop allocation, flow acceleration, turbulent dissipation, and cavitation. The detailed geometric parameters are listed in Table 3.
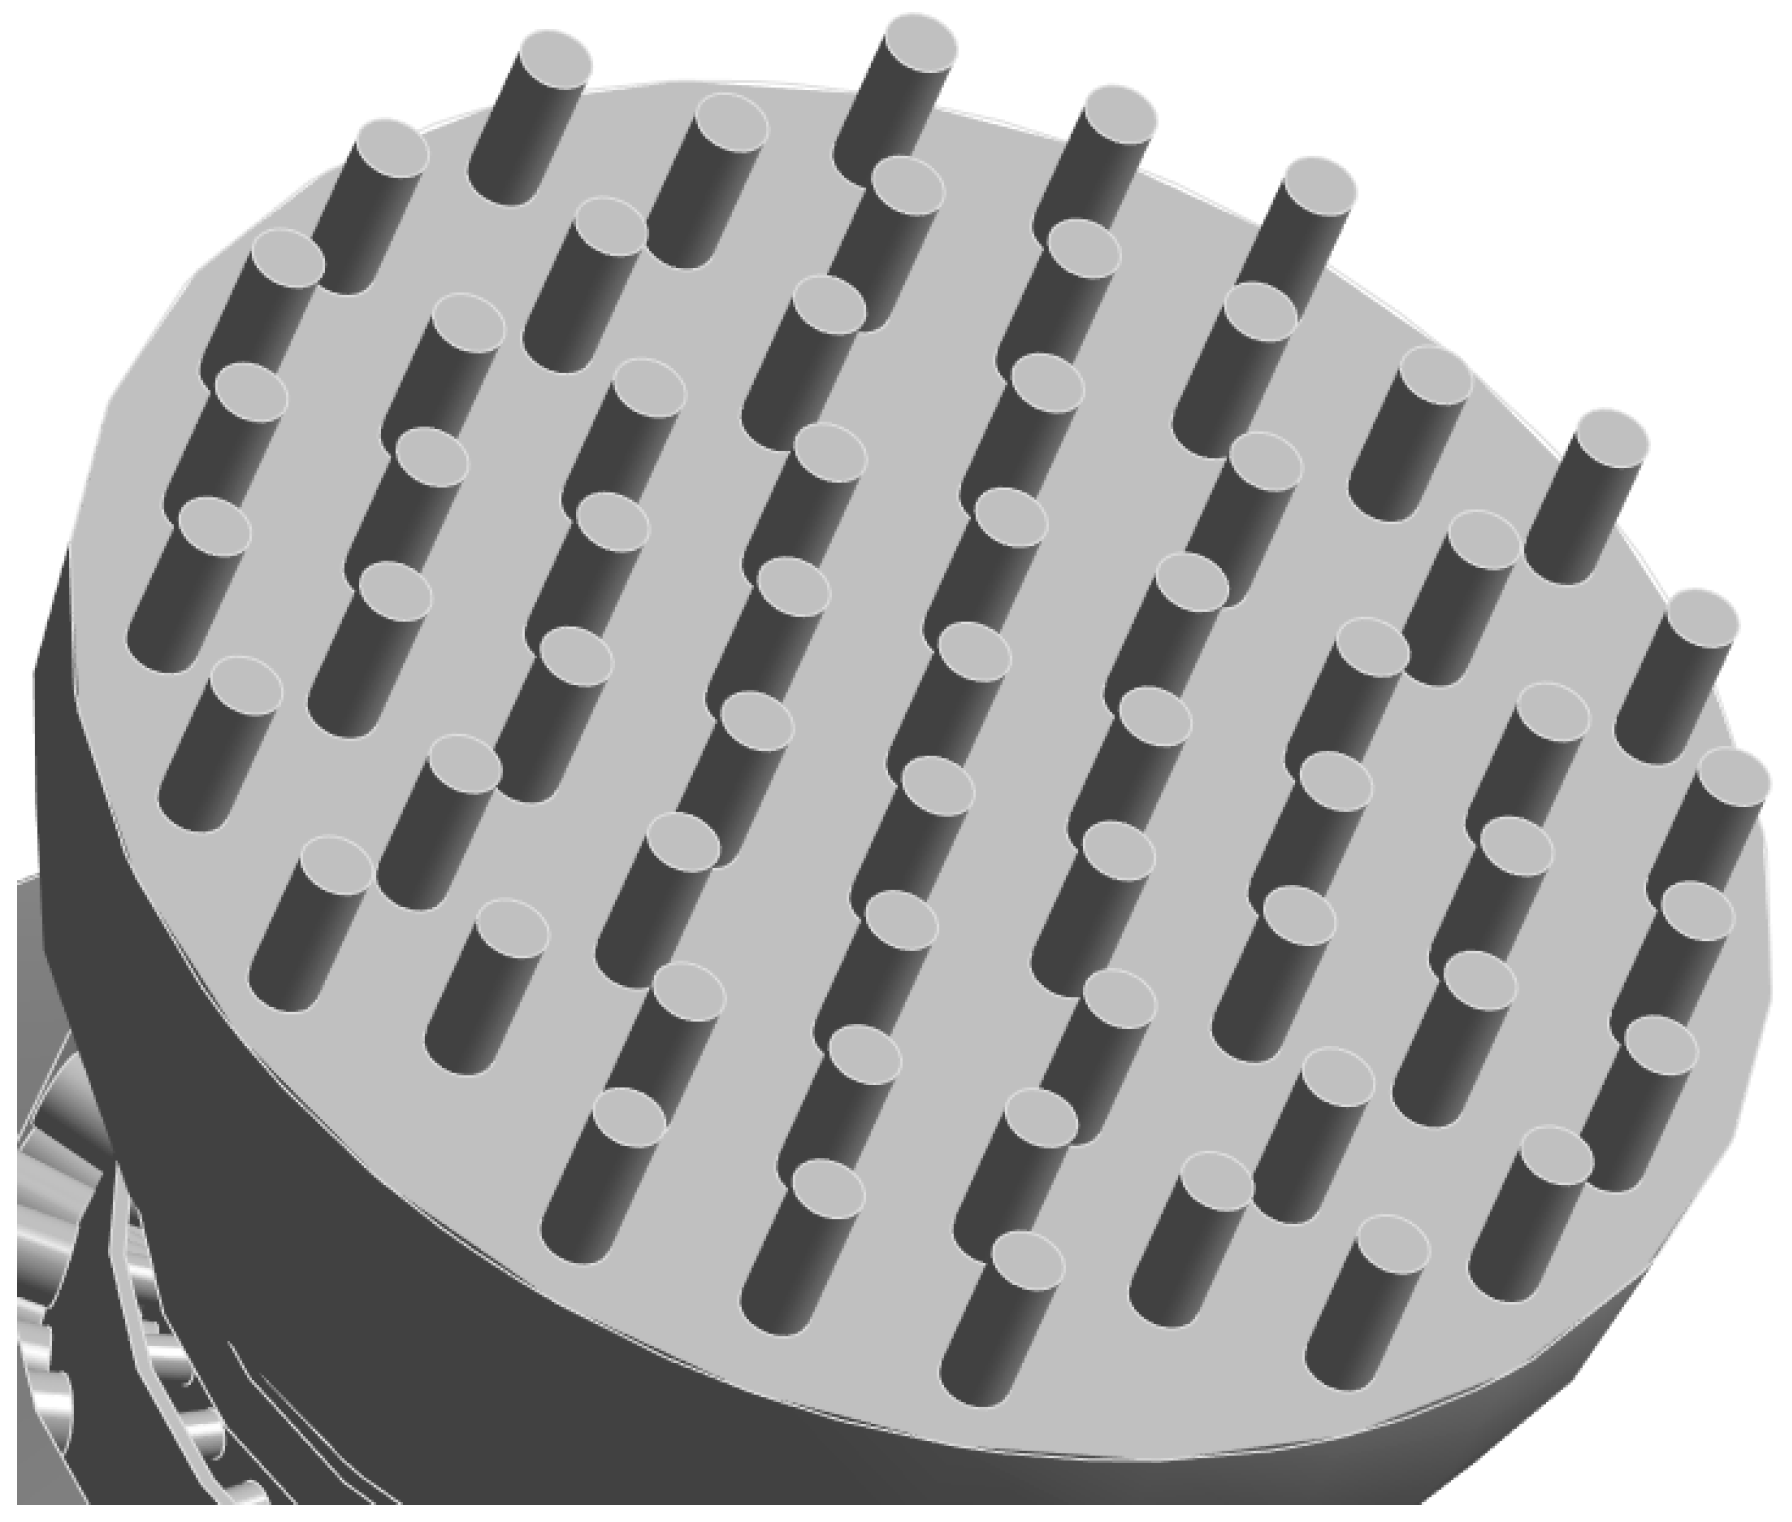
Figure 10: Geometry and hole arrangement of the single perforated plate.
Table 3: Geometric parameters of the single perforated plate.
| Hole Radius, R/mm | Single-Hole Area/mm2 | Total Open Area/mm2 | L/d |
|---|---|---|---|
| 5.5 | 95.03 | 5797.02 | 1.36 |
| 4.5 | 63.62 | 3880.65 | 1.67 |
| 3.5 | 38.48 | 2347.56 | 2.14 |
| 3.0 | 28.27 | 1724.73 | 2.50 |
As shown in Table 3, decreasing the hole radius from 5.5 to 3.0 mm reduces the total open area from 5797.02 to 1724.73 mm2, a decrease of approximately 70.25%, while increasing the hole length-to-diameter ratio from 1.36 to 2.50. In addition to reducing the flow area and increasing the plate resistance, the smaller holes increase wall-friction losses within the holes and strengthen the local throttling effect.
As shown in Fig. 11, the single perforated plate changes the pressure-release path between the secondary sleeve and the outlet. Without a plate, the fluid leaving the secondary sleeve enters the expansion chamber directly, and most of the pressure energy is released over a limited distance. Adding the plate establishes a higher pressure plateau between the sleeve and the plate, demonstrating that part of the pressure drop is transferred from the sleeve to the plate. As the hole radius decreases from 5.5 to 3.0 mm, the total open area decreases, the local resistance increases, and the area-averaged pressures at Planes C and D rise markedly, whereas the upstream pressure changes only slightly. Smaller holes therefore make the pressure drop across the secondary sleeve more gradual and increase the local minimum pressure, alleviating the original pressure-drop concentration.
The redistributed pressure field directly changes downstream jet development. Flow contracts and accelerates through the secondary-sleeve holes and then forms expanding jets in the larger downstream passage. Strong velocity gradients develop between the jets and the surrounding slower fluid, accompanied by shear-layer growth, separation, and recirculation. The increased back pressure imposed by the perforated plate reduces the initial momentum and expansion of the sleeve jets and contracts both the low-pressure jet cores and the recirculation regions. At the same time, reducing the plate-hole radius increases the pressure drop carried by the plate itself, causing renewed contraction and acceleration within the holes. The dominant jets and low-pressure regions therefore migrate from downstream of the secondary sleeve to the plate holes and their near wake.
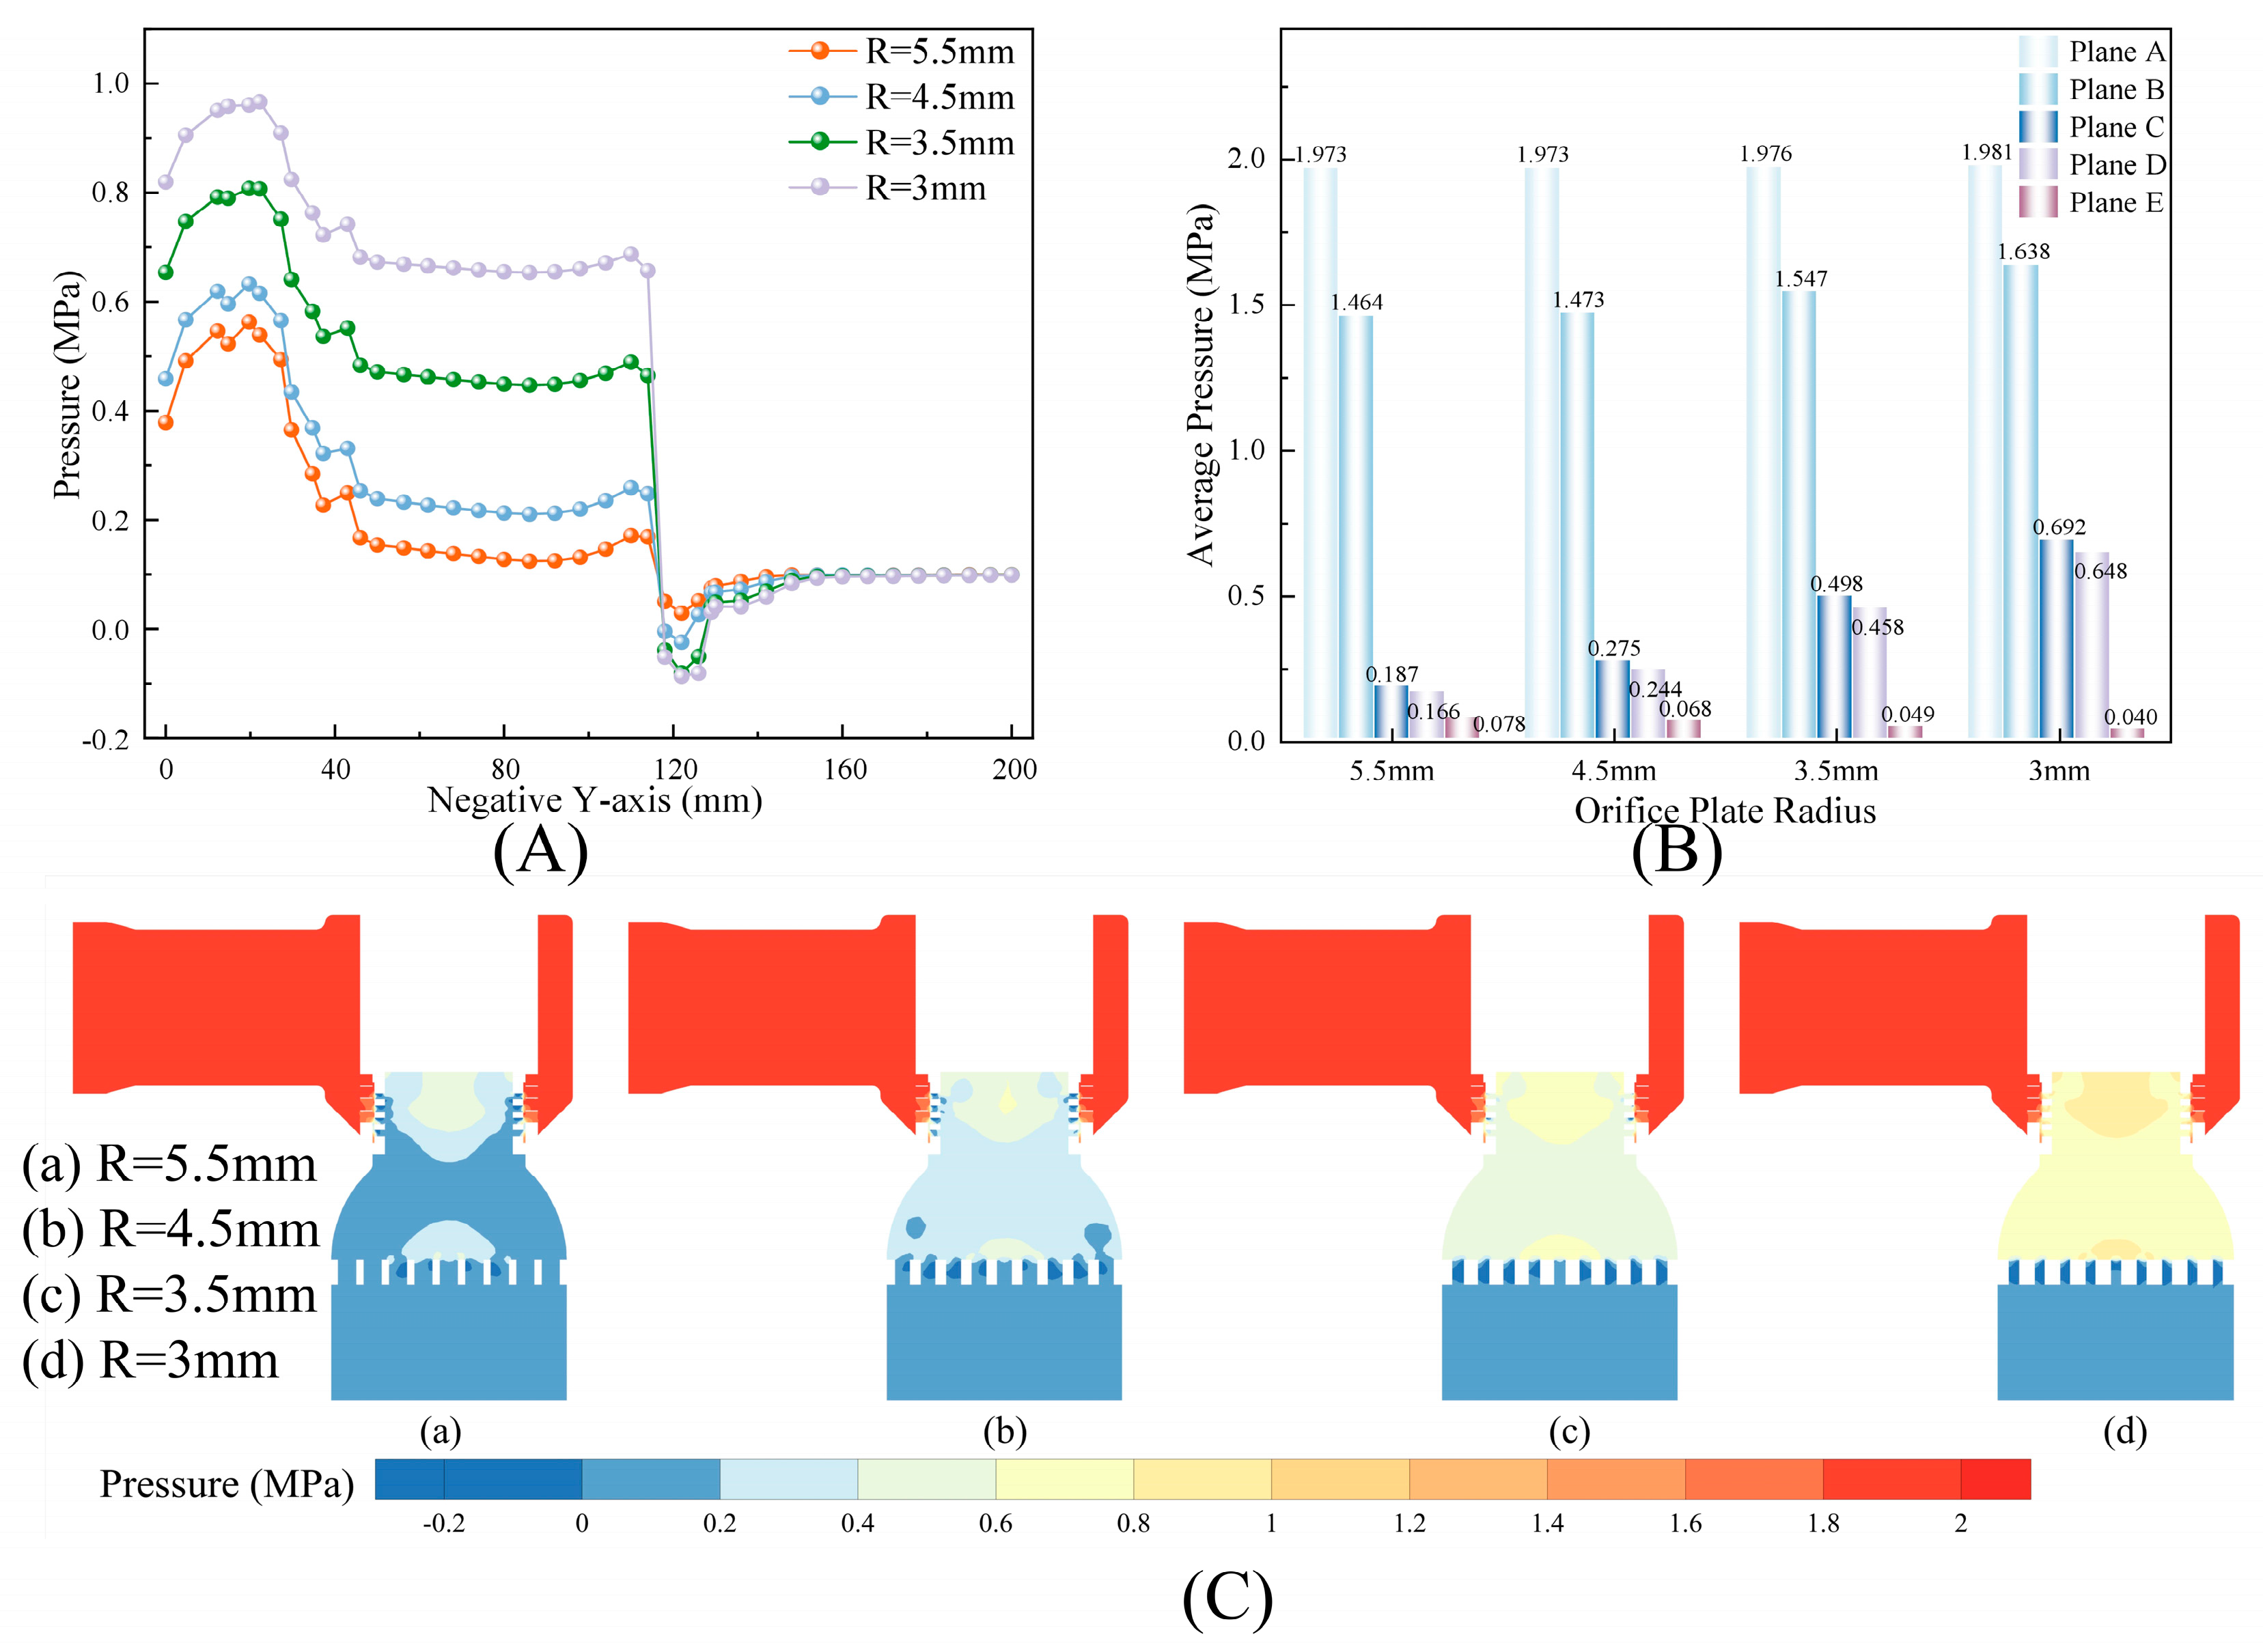
Figure 11: Pressure characteristics of the single-stage perforated-plate configurations with different hole radii: (A) static-pressure distribution along the negative Y direction; (B) area-weighted average static pressure at the characteristic planes; (C) static-pressure contours.
The velocity and TKE results shown in Fig. 12 further confirm this flow reorganization. As the hole radius decreases from 5.5 to 3.0 mm, the global maximum velocity decreases by approximately 22.5% and the maximum TKE by approximately 51.0%. The higher back pressure downstream of the sleeve weakens the conversion of pressure energy into kinetic energy across the sleeve holes and reduces the relative velocity between the jets and the surrounding fluid. Consequently, TKE production in the downstream shear layers decreases, and jet breakup and momentum exchange in the sleeve region are weakened.
Fig. 13 presents the turbulent dissipation rate and turbulence intensity along the negative Y direction. The turbulent dissipation rate reveals the spatial progression from TKE production to dissipation. Multiple dissipation peaks occur in the secondary-sleeve near field between approximately 15 and 40 mm along the negative Y direction, and the peak values decrease as the hole radius is reduced, indicating weaker sleeve-jet shear and less small-scale energy dissipation. New dissipation peaks appear near the perforated plate between approximately 110 and 150 mm. The near-plate dissipation levels for R = 3.5 and 3.0 mm are substantially higher than those for the larger-hole cases, showing that after the pressure drop migrates downstream, contraction jets, interaction among adjacent jets, and wake recirculation become the principal sources of TKE production and dissipation. The corresponding velocity contours and high-TKE regions are shown in Fig. 14A,B, respectively.
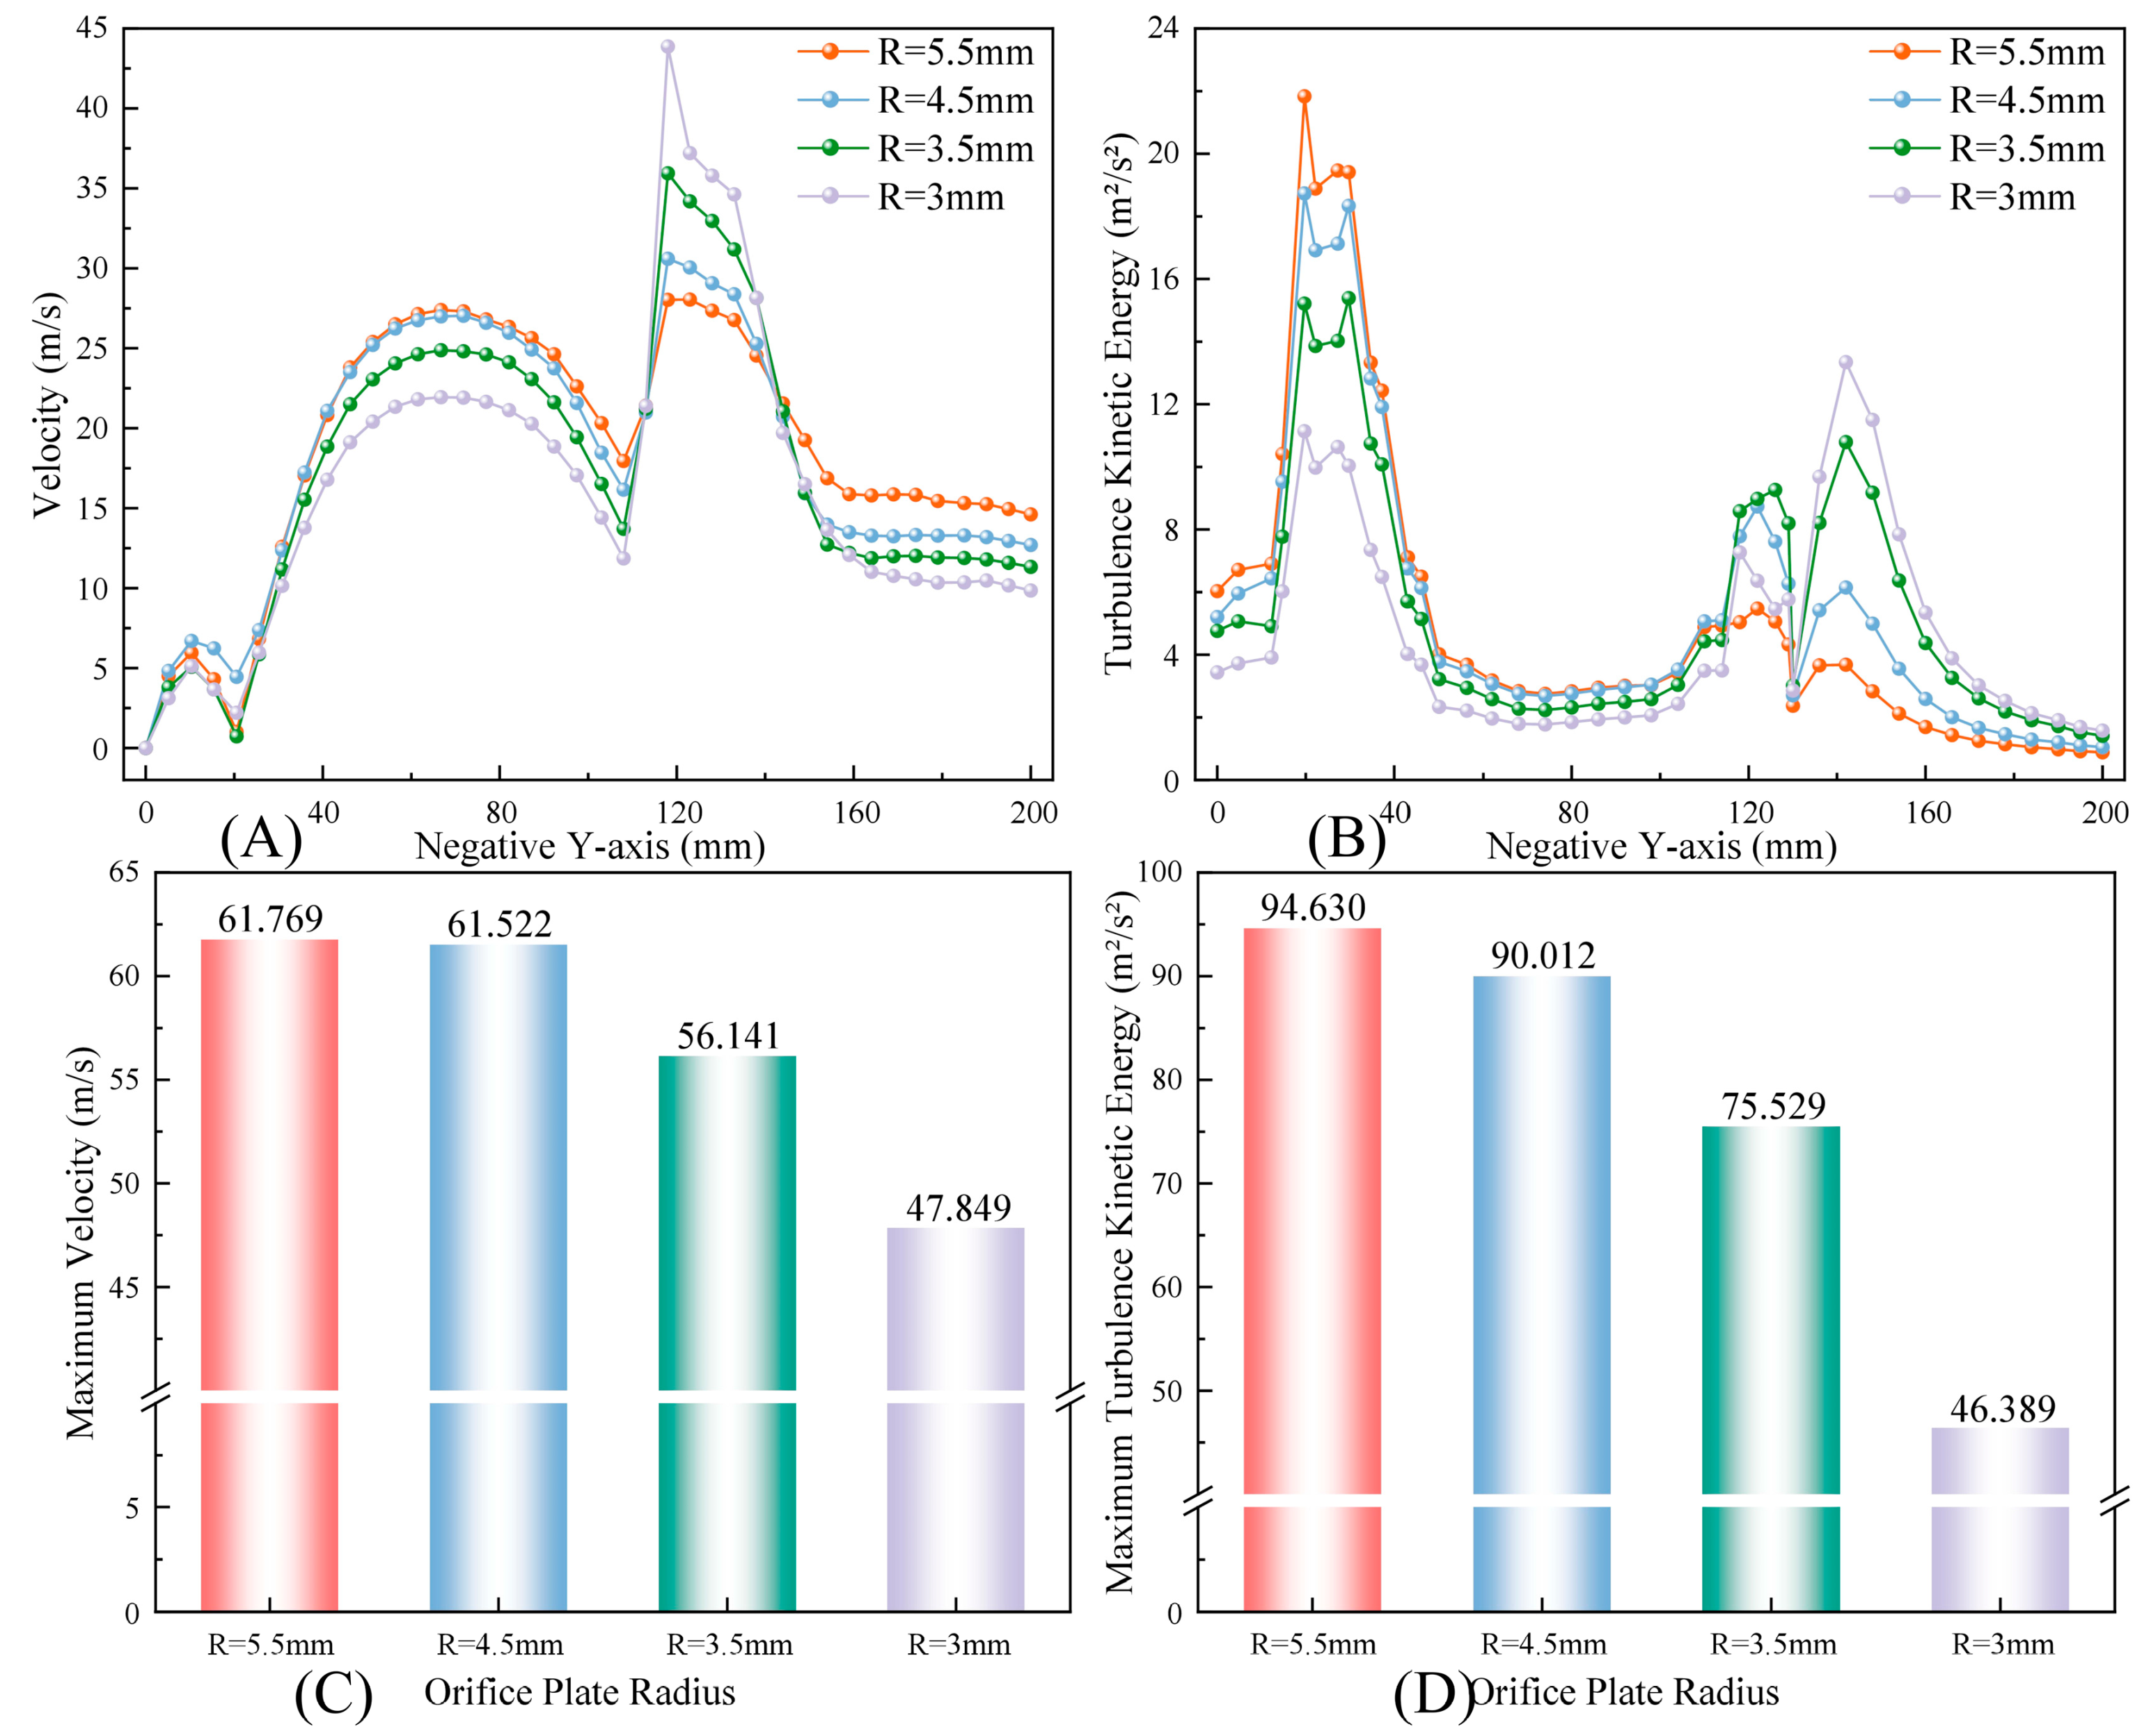
Figure 12: Flow parameters of the single-stage perforated-plate configurations with different hole radii: (A) velocity along the negative Y direction; (B) TKE along the negative Y direction; (C) maximum velocity; (D) maximum TKE.
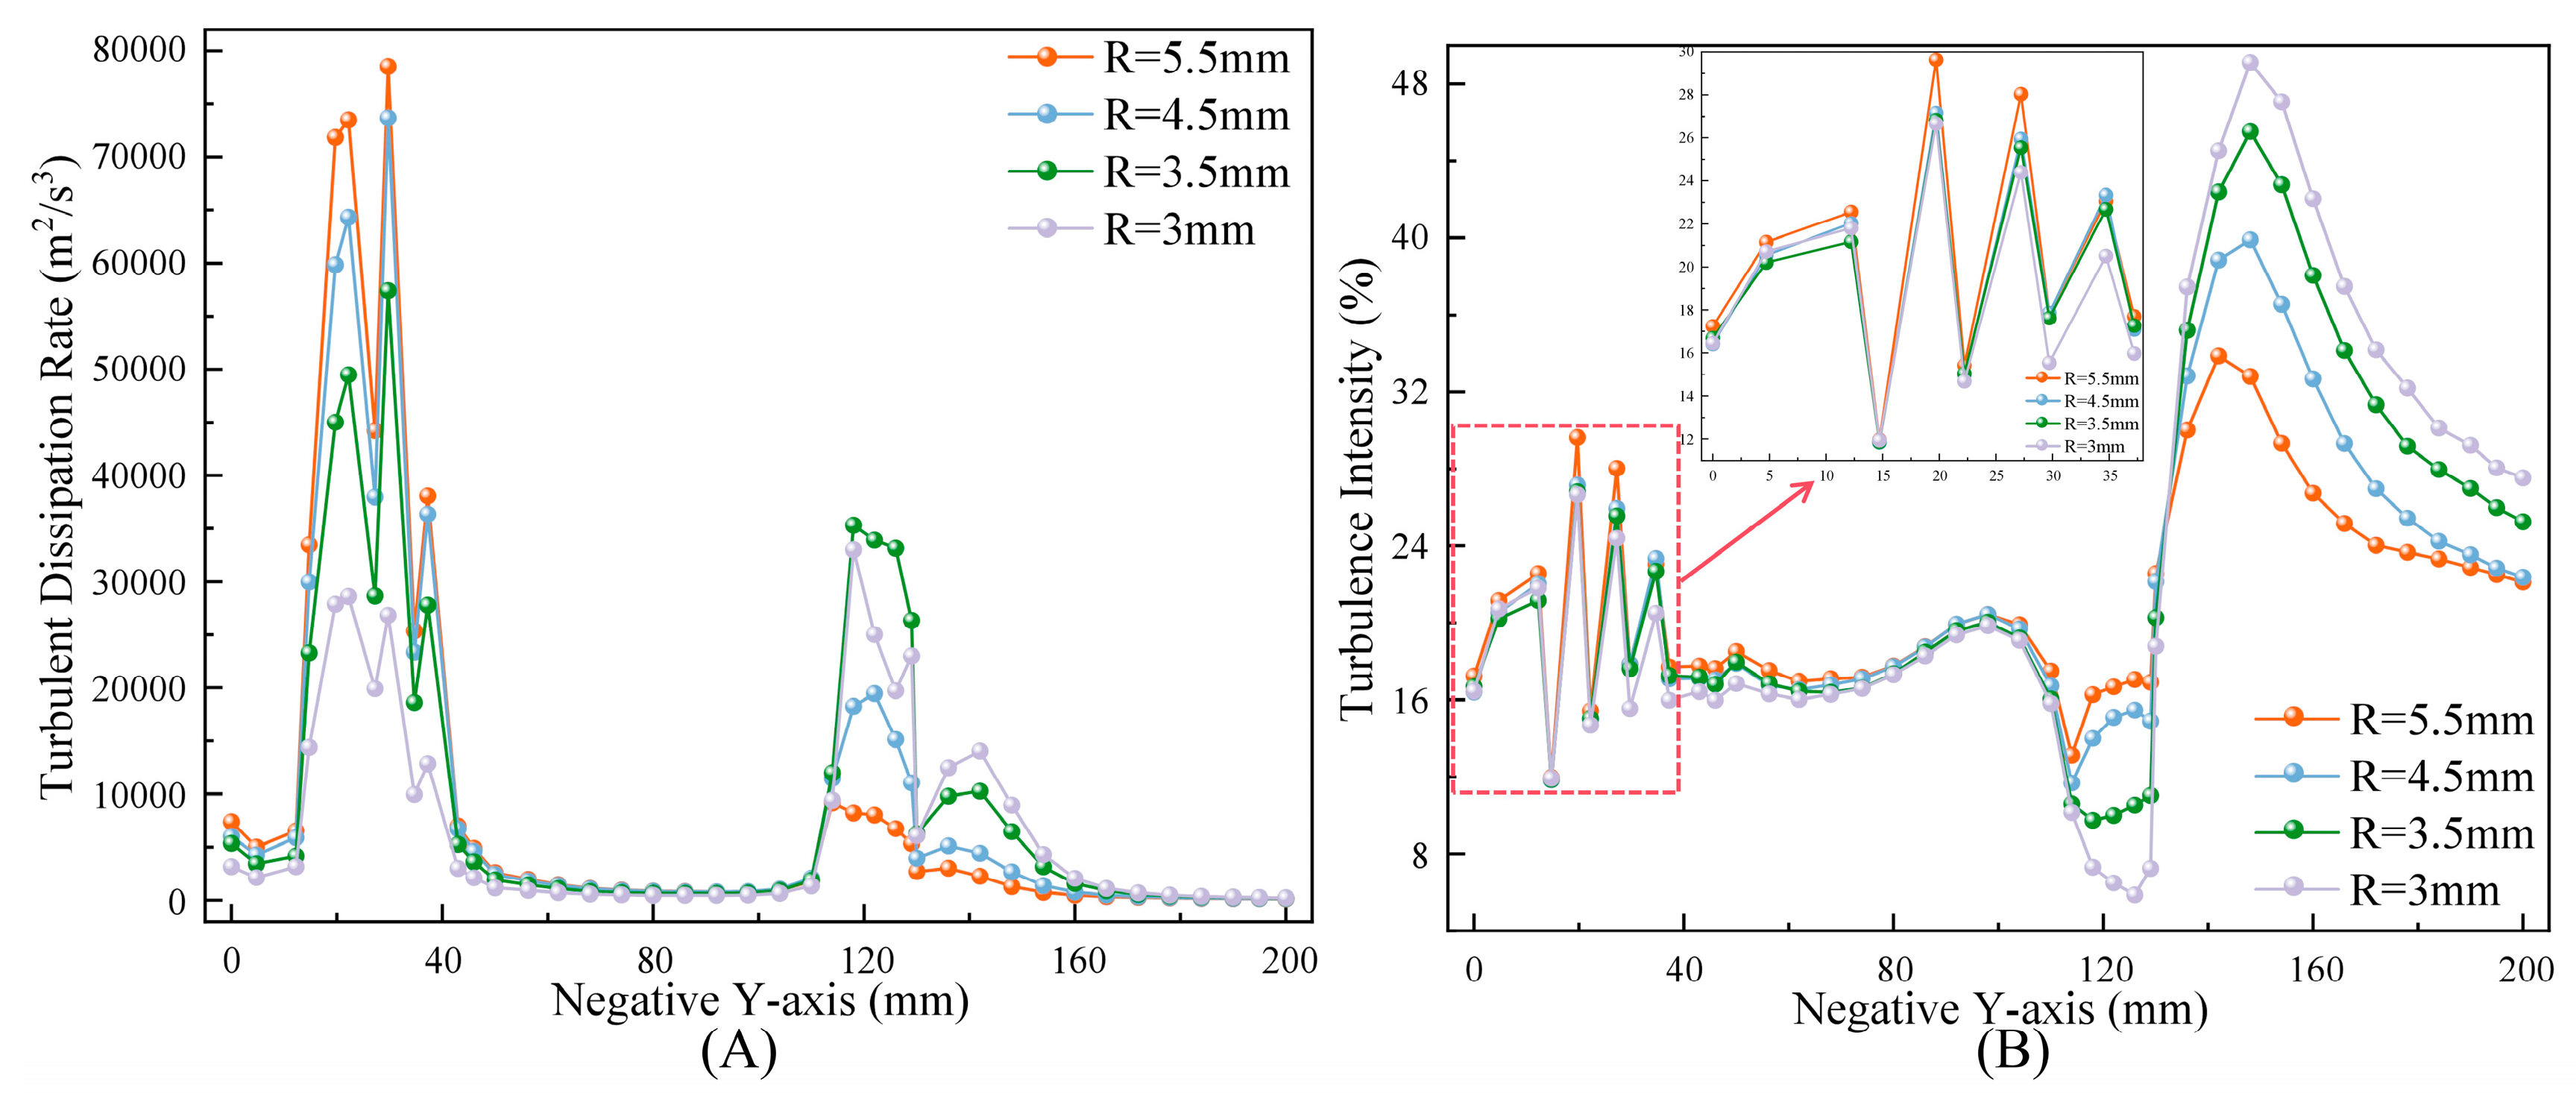
Figure 13: (A) Turbulent dissipation rate and (B) turbulence intensity along the negative Y direction for the single-stage perforated-plate configurations with different hole radii.
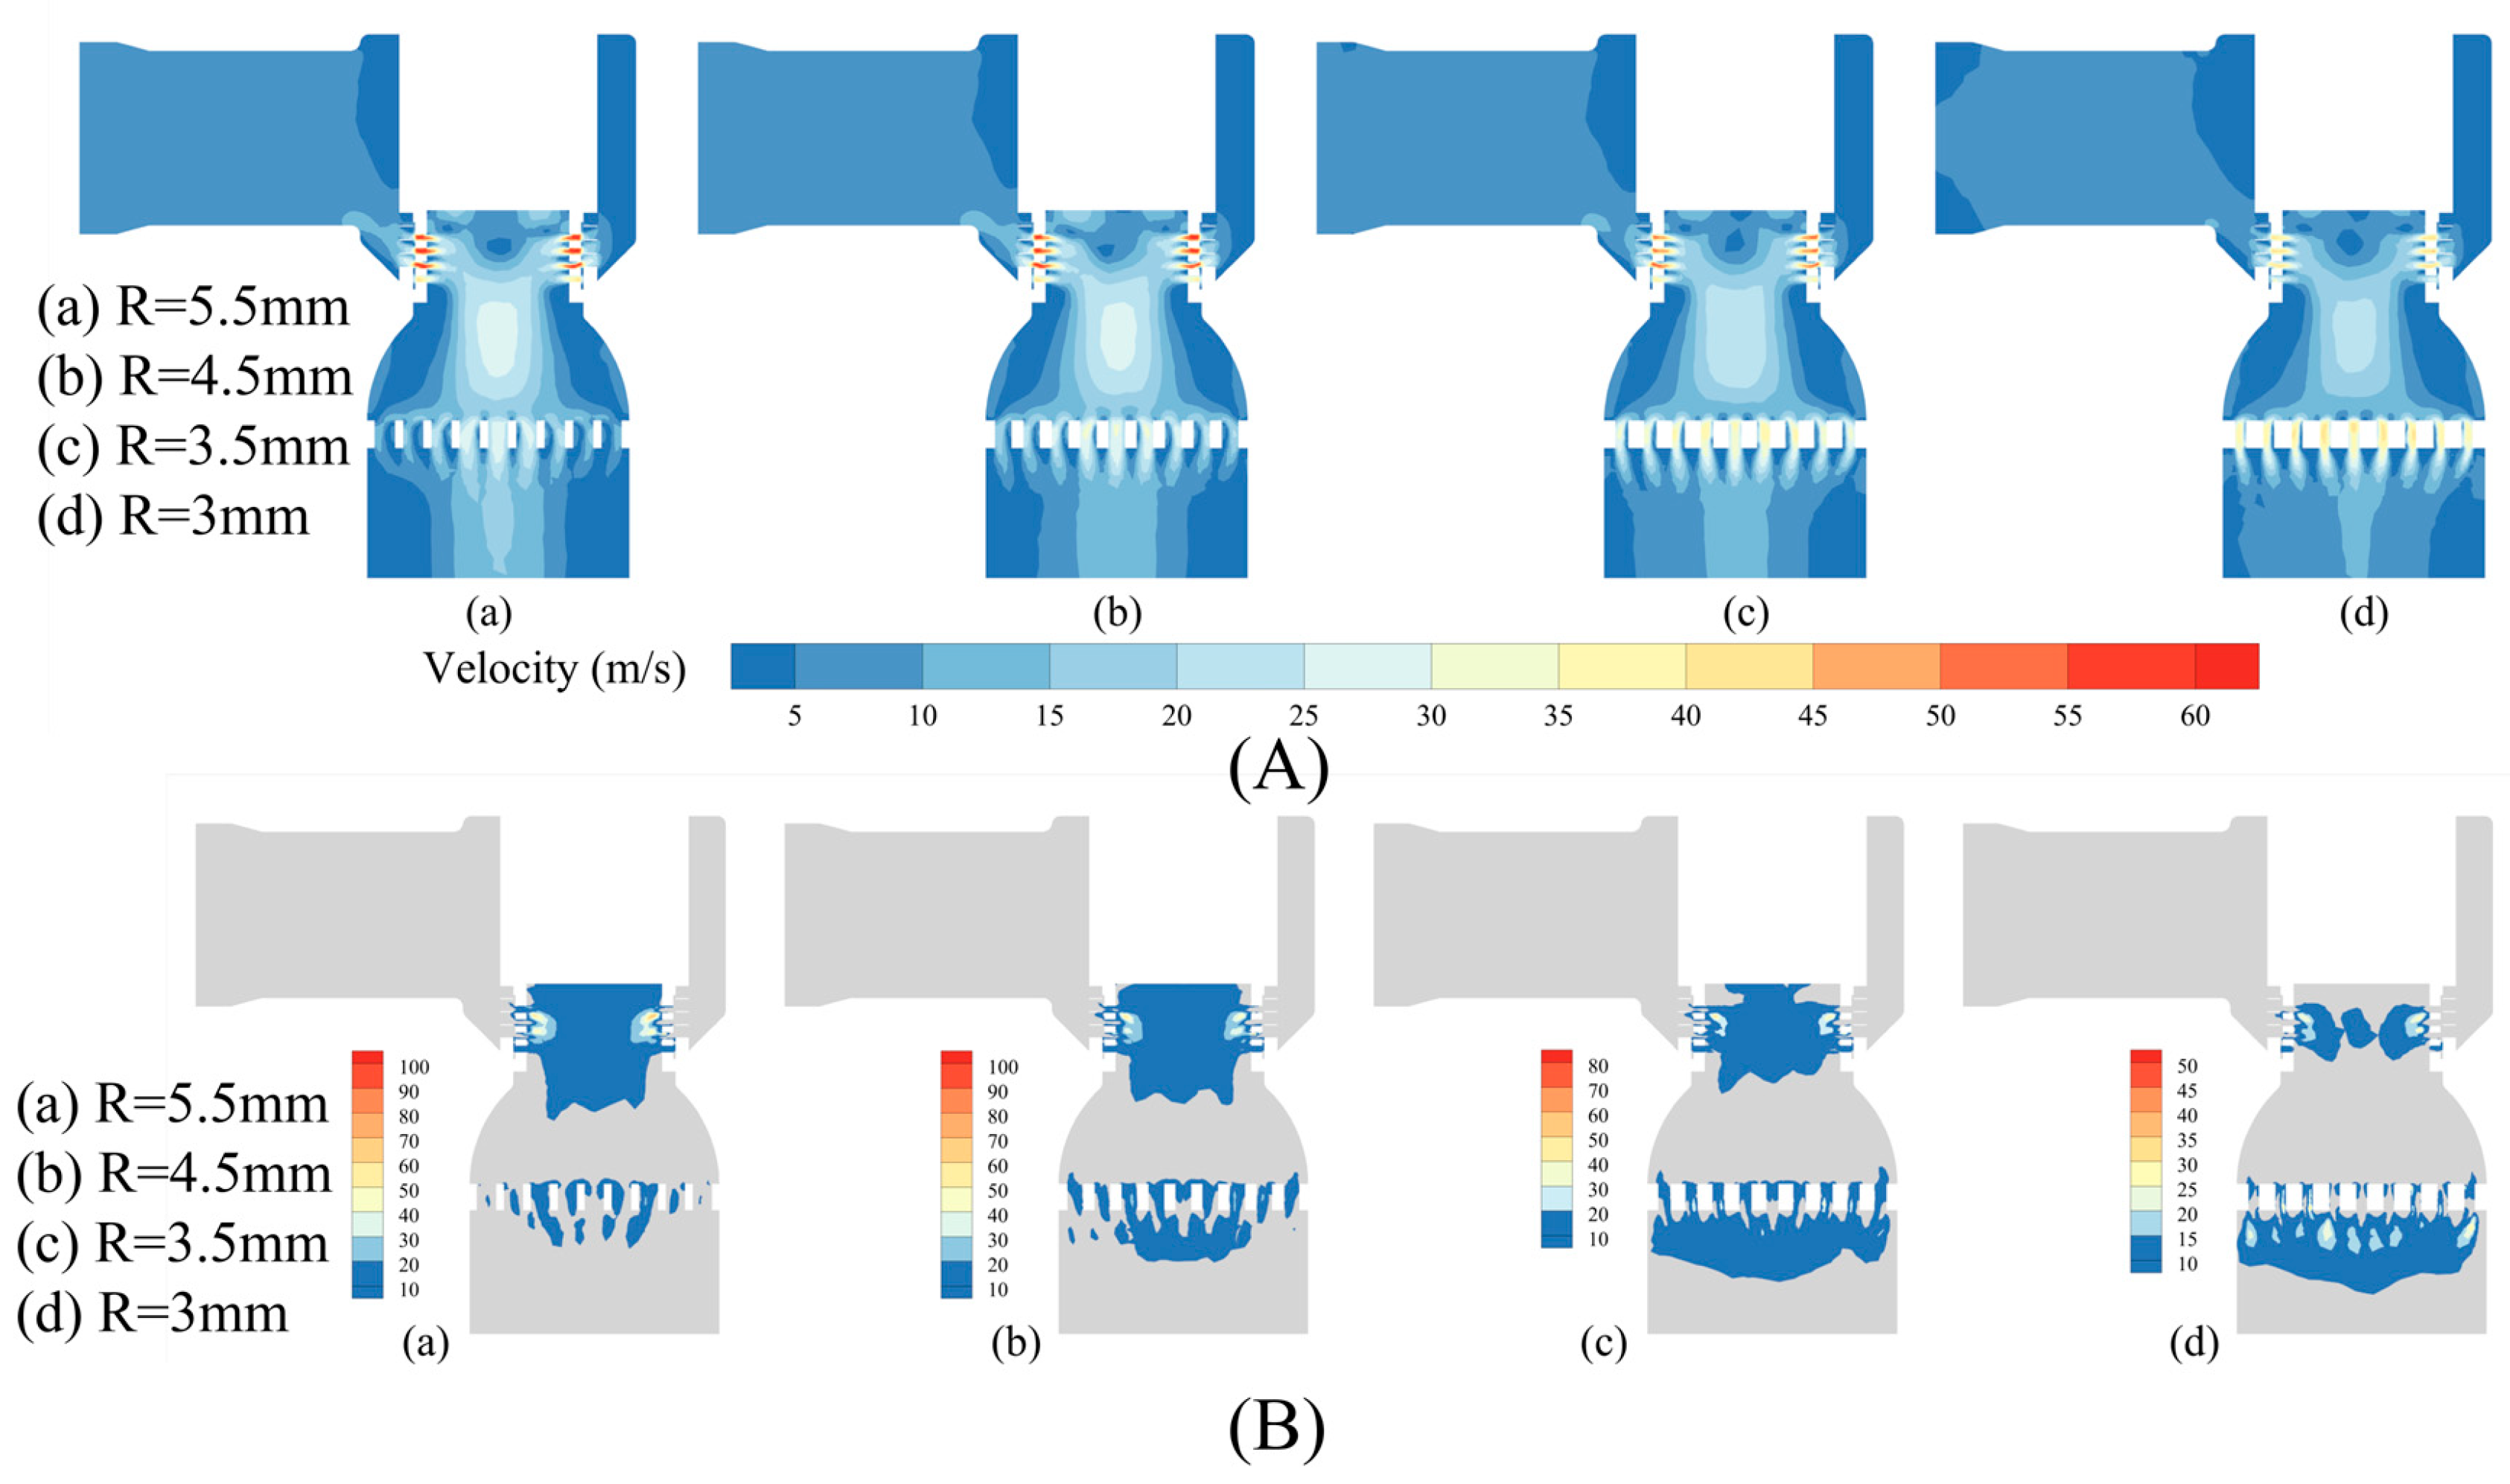
Figure 14: (A) Velocity contours and (B) high-TKE regions (k > 6 m2/s2) for the single-stage perforated-plate configurations with different hole radii: (a) R = 5.5 mm; (b) R = 4.5 mm; (c) R = 3.5 mm; and (d) R = 3.0 mm.
For all hole radii, the turbulence intensity exhibits multiple peaks in the sleeve near field, while the downstream intensity behind the plate increases markedly as the holes become smaller. For R = 3.0 mm, a local peak of approximately 48% occurs downstream of the plate, indicating stronger relative velocity fluctuations and greater non-uniformity among the smaller jets. The vorticity distribution and time-averaged vortical structures are shown in Fig. 15A,B, respectively. Vorticity also peaks near the sleeve and perforated-plate holes, but it includes both shear and rotational contributions and therefore cannot independently identify vortical structures. The Q criterion was applied to two representative cases, R = 5.5 and 3.0 mm, to distinguish vortical motion from pure shear. At R = 5.5 mm, the dominant vortical structures are concentrated downstream of the secondary sleeve and within the expansion-chamber recirculation zone. At R = 3.0 mm, the sleeve-side structures are restricted, whereas more pronounced annular and discrete structures form around and downstream of the perforated-plate holes. Thus, reducing the hole radius does not eliminate rotational motion; instead, the shear layers, recirculation, and vortical regions migrate from the sleeve to the plate.
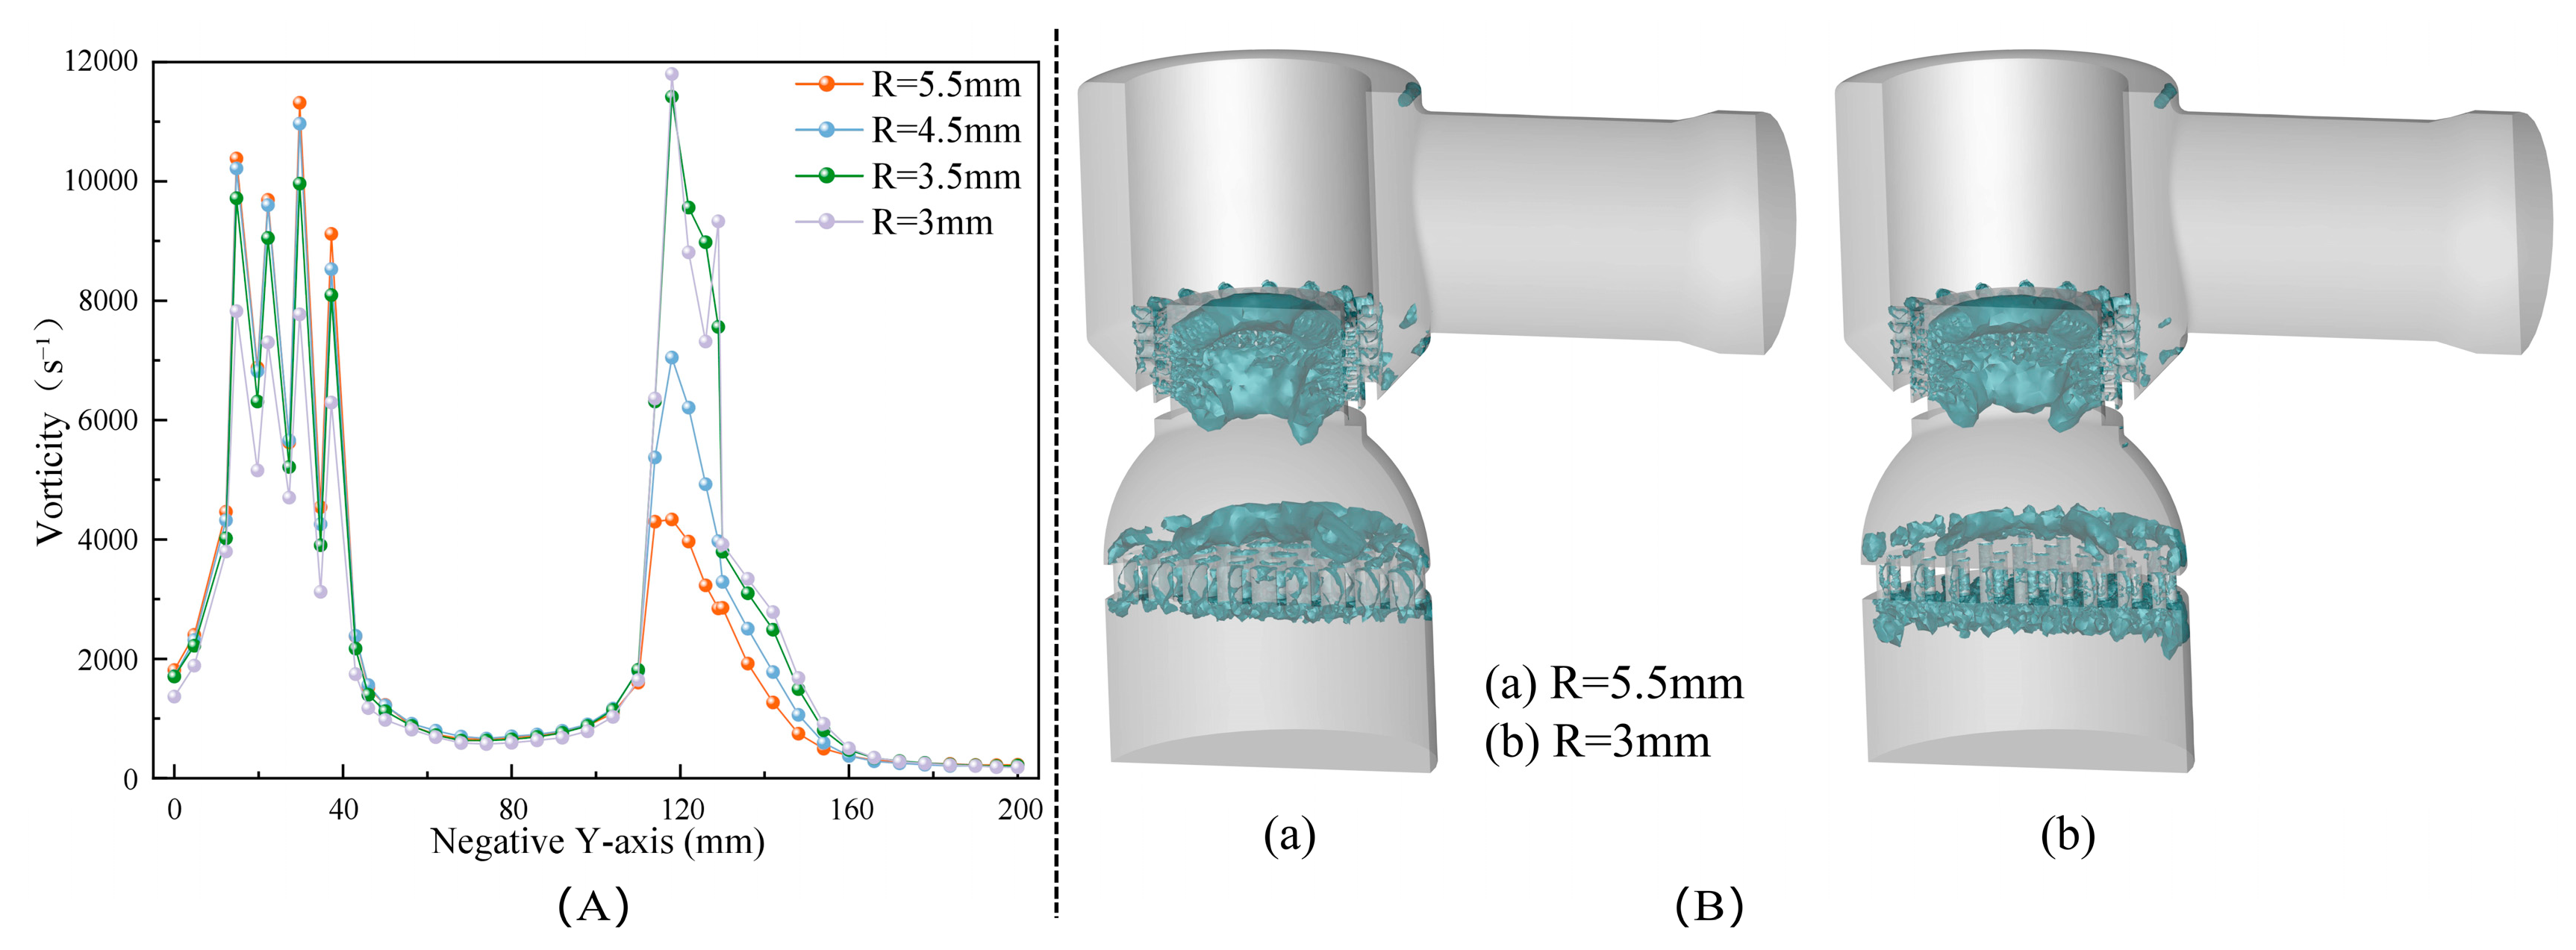
Figure 15: Rotational-flow characteristics of the single-stage perforated-plate configurations with different hole radii: (A) vorticity distribution along the negative Y direction; (B) time-averaged vortical structures identified using the Q criterion.
Taken together, the results show that the single perforated plate improves the flow conditions around the secondary sleeve through the following sequence: establishment of back pressure, weakening of the sleeve jets, transfer of the pressure drop to the plate, and strengthening of the plate jets and shear layers. Reducing the hole radius improves pressure recovery and reduces flow intensity around the secondary sleeve, but it also increases the pressure drop carried by the single plate and produces new high-velocity jets, strong shear layers, and recirculation in the plate wake. The single-stage configuration therefore relocates the region of intense flow rather than eliminating flow disturbance throughout the valve.
5.3 Cavitation Characteristics
Table 4 lists the downstream cavitation number and equivalent vapor volume for the single-stage configurations, while Fig. 16, Fig. 17 and Fig. 18 show the vapor distributions in the secondary-sleeve and perforated-plate regions. Reducing the hole radius first produces a marked improvement in the sleeve region. As R decreases from 5.5 to 3.0 mm, the regional mean vapor volume fraction in the secondary sleeve decreases from 25.530% to 0.051%. For R = 5.5 and 4.5 mm, vapor is concentrated at the sleeve holes and in the downstream low-pressure jet cores, forming a relatively continuous circumferential region. At R = 3.5 and 3.0 mm, the increased upstream pressure generated by the plate reduces the effective pressure drop across the sleeve and limits jet expansion, recirculation, and the low-pressure vortical regions. The sleeve vapor field consequently changes from a continuous sheet-like distribution to a small number of isolated patches.
Table 4: Steady cavitation metrics for single-stage perforated-plate configurations with different hole radii.
| Hole radius, R/mm | 5.5 | 4.5 | 3.5 | 3.0 |
|---|---|---|---|---|
| Downstream cavitation number, σd | 1.568 | 1.145 | 0.897 | 0.882 |
| Equivalent vapor volume, V/m3 | 8.456093 × 10⁻⁷ | 9.703167 × 10⁻⁷ | 3.491281 × 10⁻⁶ | 3.284079 × 10⁻⁶ |
The perforated-plate region exhibits the opposite trend. As R decreases from 5.5 to 3.0 mm, σd decreases from 1.568 to 0.882, indicating a progressively smaller pressure margin downstream of the plate. The regional mean vapor volume fraction increases from 0.351% to 12.445%, while the maximum values reach 0.960 and 0.975 for R = 3.5 and 3.0 mm, respectively. The equivalent vapor volume increases from 8.456 × 10⁻⁷ m3 at R = 5.5 mm to 3.491 × 10⁻⁶ m3 at R = 3.5 mm, a factor of approximately 4.13. At R = 3.0 mm, the value decreases slightly to 3.284 × 10⁻⁶ m3, 5.9% below that for R = 3.5 mm, but remains of the same order of magnitude. The smaller-hole cases therefore produce highly concentrated vapor within and immediately downstream of the holes, while the overall vapor volume no longer increases monotonically.
Cavitation migrates because the location carrying the principal pressure drop changes. The additional resistance of a large-hole plate is limited, so the secondary sleeve continues to carry a large portion of the pressure drop and the downstream static pressure readily approaches the saturation vapor pressure. Reducing the plate-hole radius raises the upstream pressure and improves sleeve-side pressure recovery, but it also increases the pressure drop across the single plate. Strong contraction and acceleration within the holes generate multiple high-velocity jets. Sudden expansion at the hole exits produces shear layers, separation, and local recirculation, while the vortical structures identified by the Q criterion delay momentum equalization and pressure recovery. A continuous band of vapor consequently develops within and downstream of the plate holes.
The single-stage perforated plate therefore has a dual effect on cavitation. On the one hand, it raises the downstream back pressure, reduces the pressure drop across the secondary sleeve, and mitigates sleeve cavitation. On the other hand, when the holes are too small, the pressure drop becomes concentrated across the single plate, causing σd to decrease and the regional mean vapor volume fraction and equivalent vapor volume to increase substantially. The R = 3.5 and 3.0 mm cases do not achieve overall cavitation mitigation; instead, the dominant vapor region migrates from the secondary sleeve to the plate. The sharp plate edges and downstream pressure-recovery zones may then become preferential locations for bubble collapse, with potential risks of local erosion, pressure pulsation, vibration, and noise. Because transient pressure loading, acoustics, and material response were not simulated, these risks cannot be quantified in the present study.
In summary, a single perforated plate redistributes both the pressure drop and the cavitation location but does not simultaneously mitigate cavitation in the sleeve and plate regions. Although the R = 3.5 and 3.0 mm cases markedly reduce continuous cavitation at the secondary sleeve, their σd values are lower than those of the larger-hole cases and their equivalent vapor volumes are substantially higher, indicating a reduced mean vaporization-pressure margin and an expanded vapor region downstream of the plate. The pressure drop carried by the single plate should therefore be divided between two throttling elements, with an inter-plate passage used to promote jet expansion, TKE dissipation, and pressure recovery and thereby reduce the low-pressure extent and mean vapor volume around a single plate.
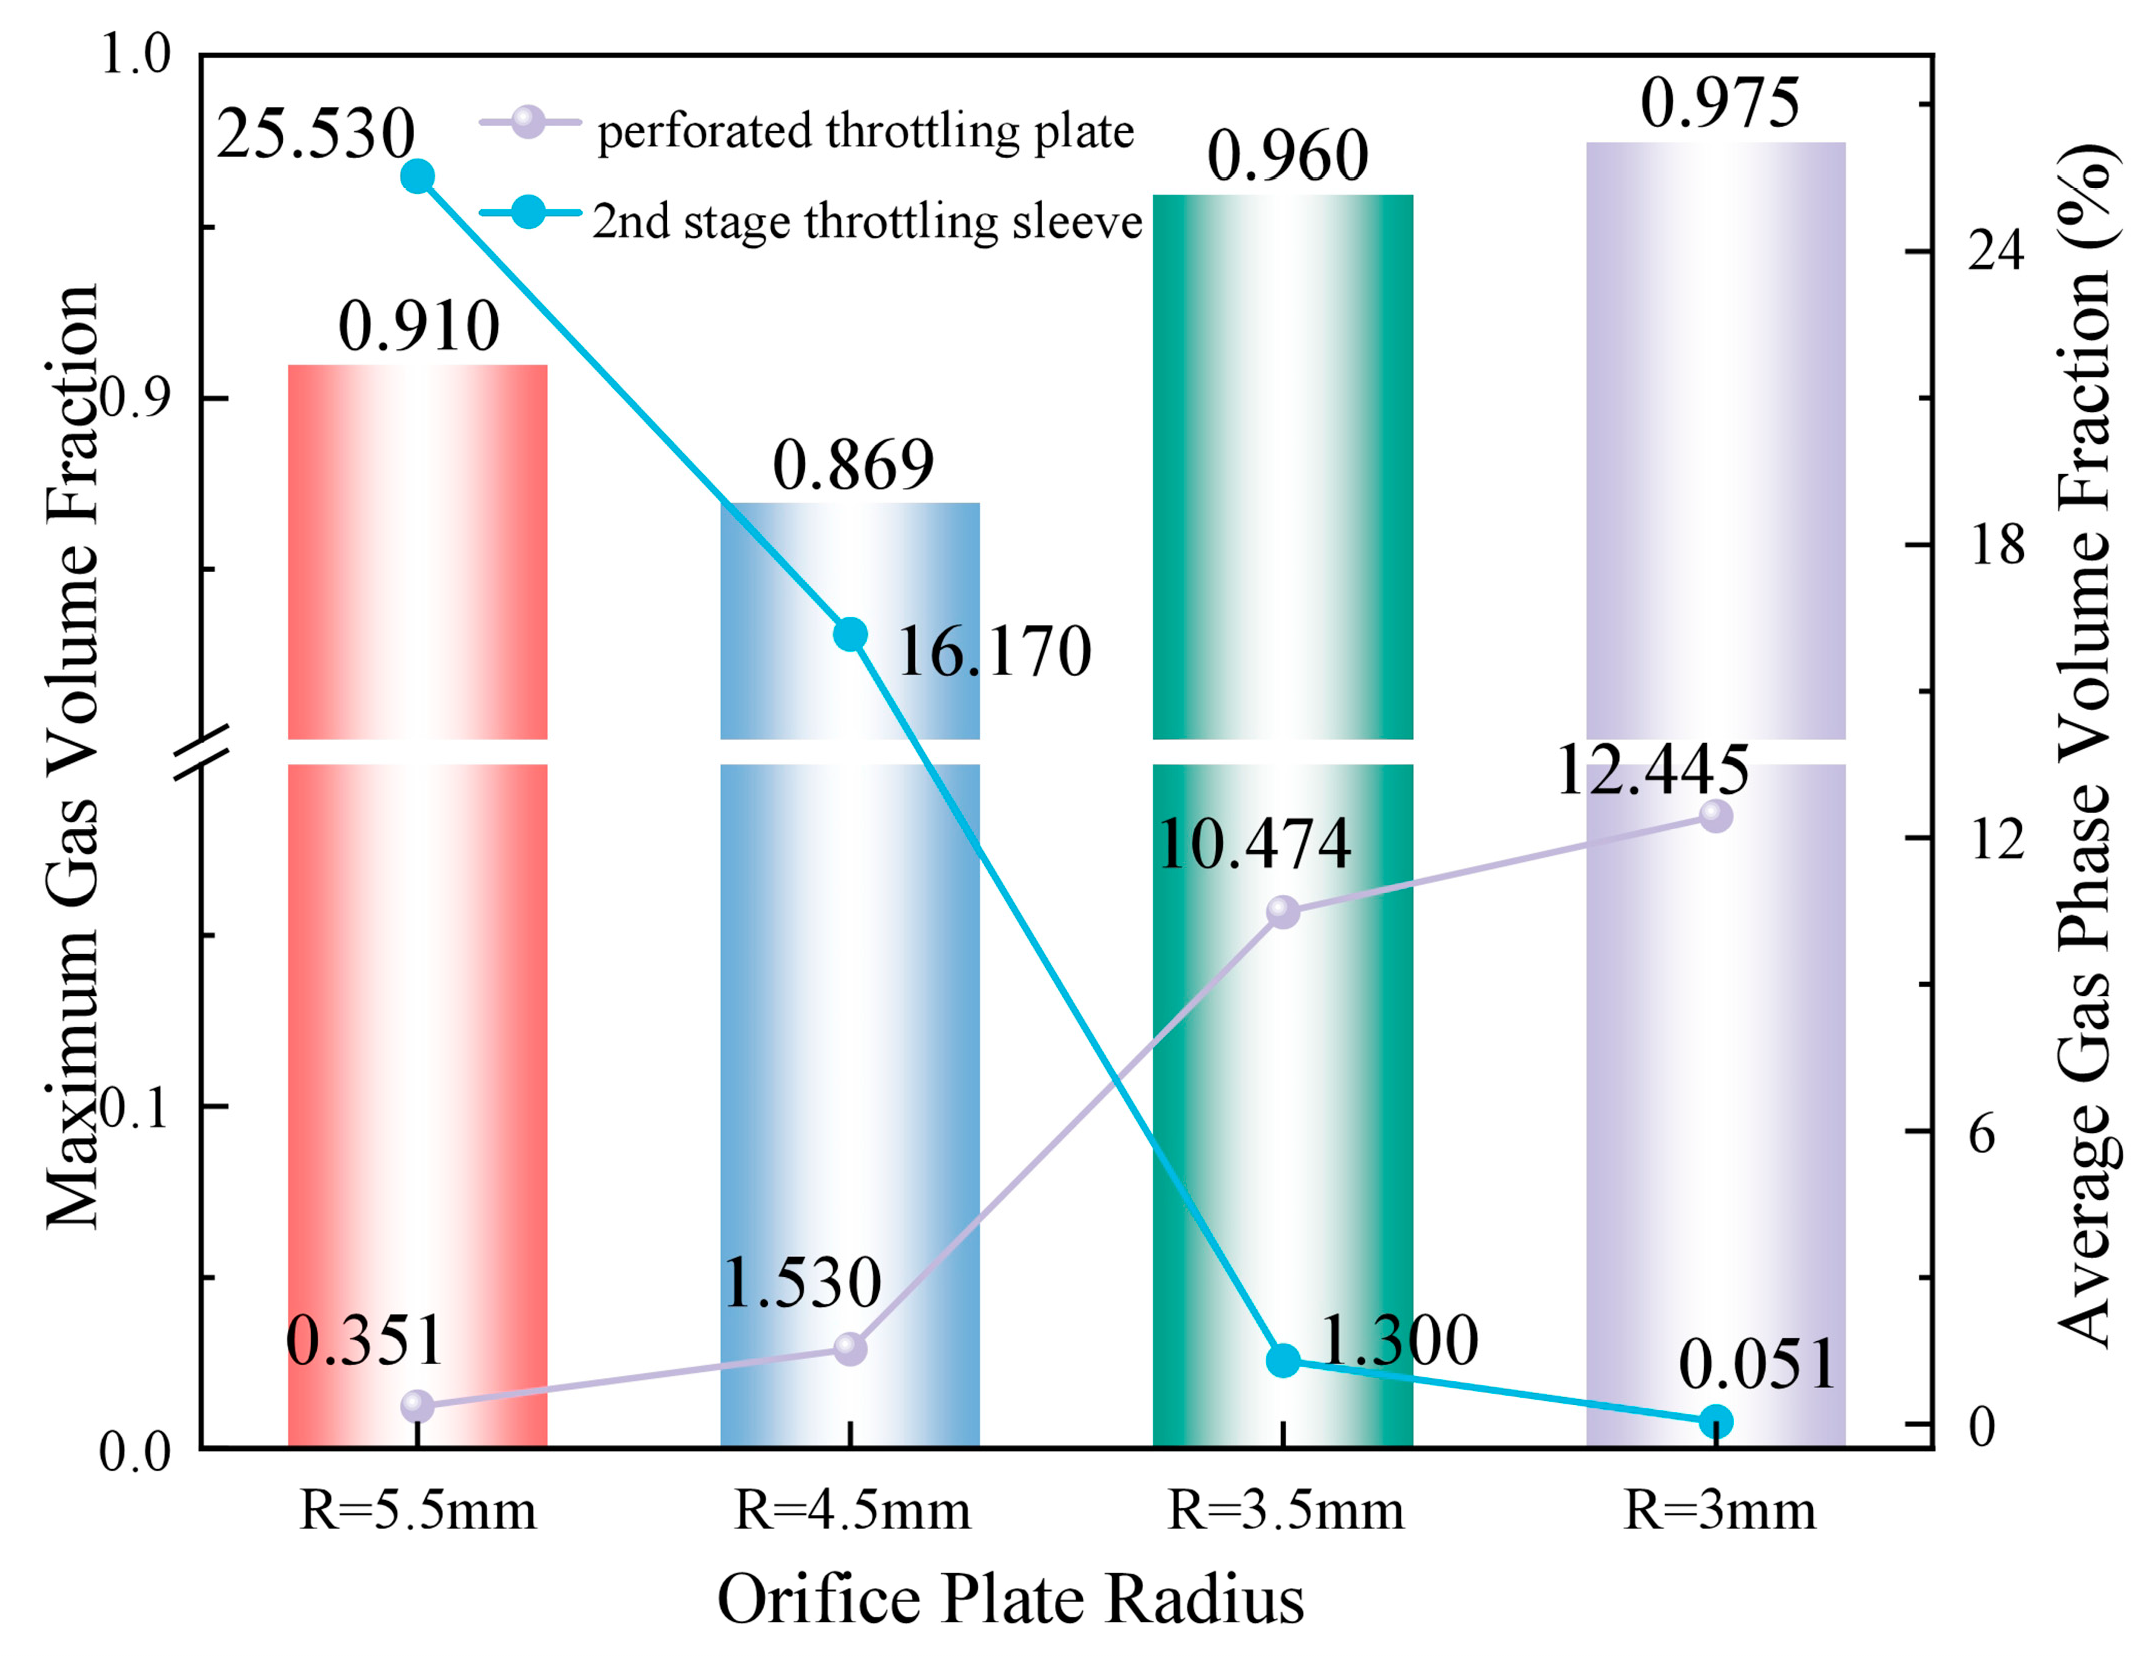
Figure 16: Maximum vapor volume fraction in the perforated-plate region and regional mean vapor volume fraction in the secondary-sleeve region for single-stage configurations with different hole radii.
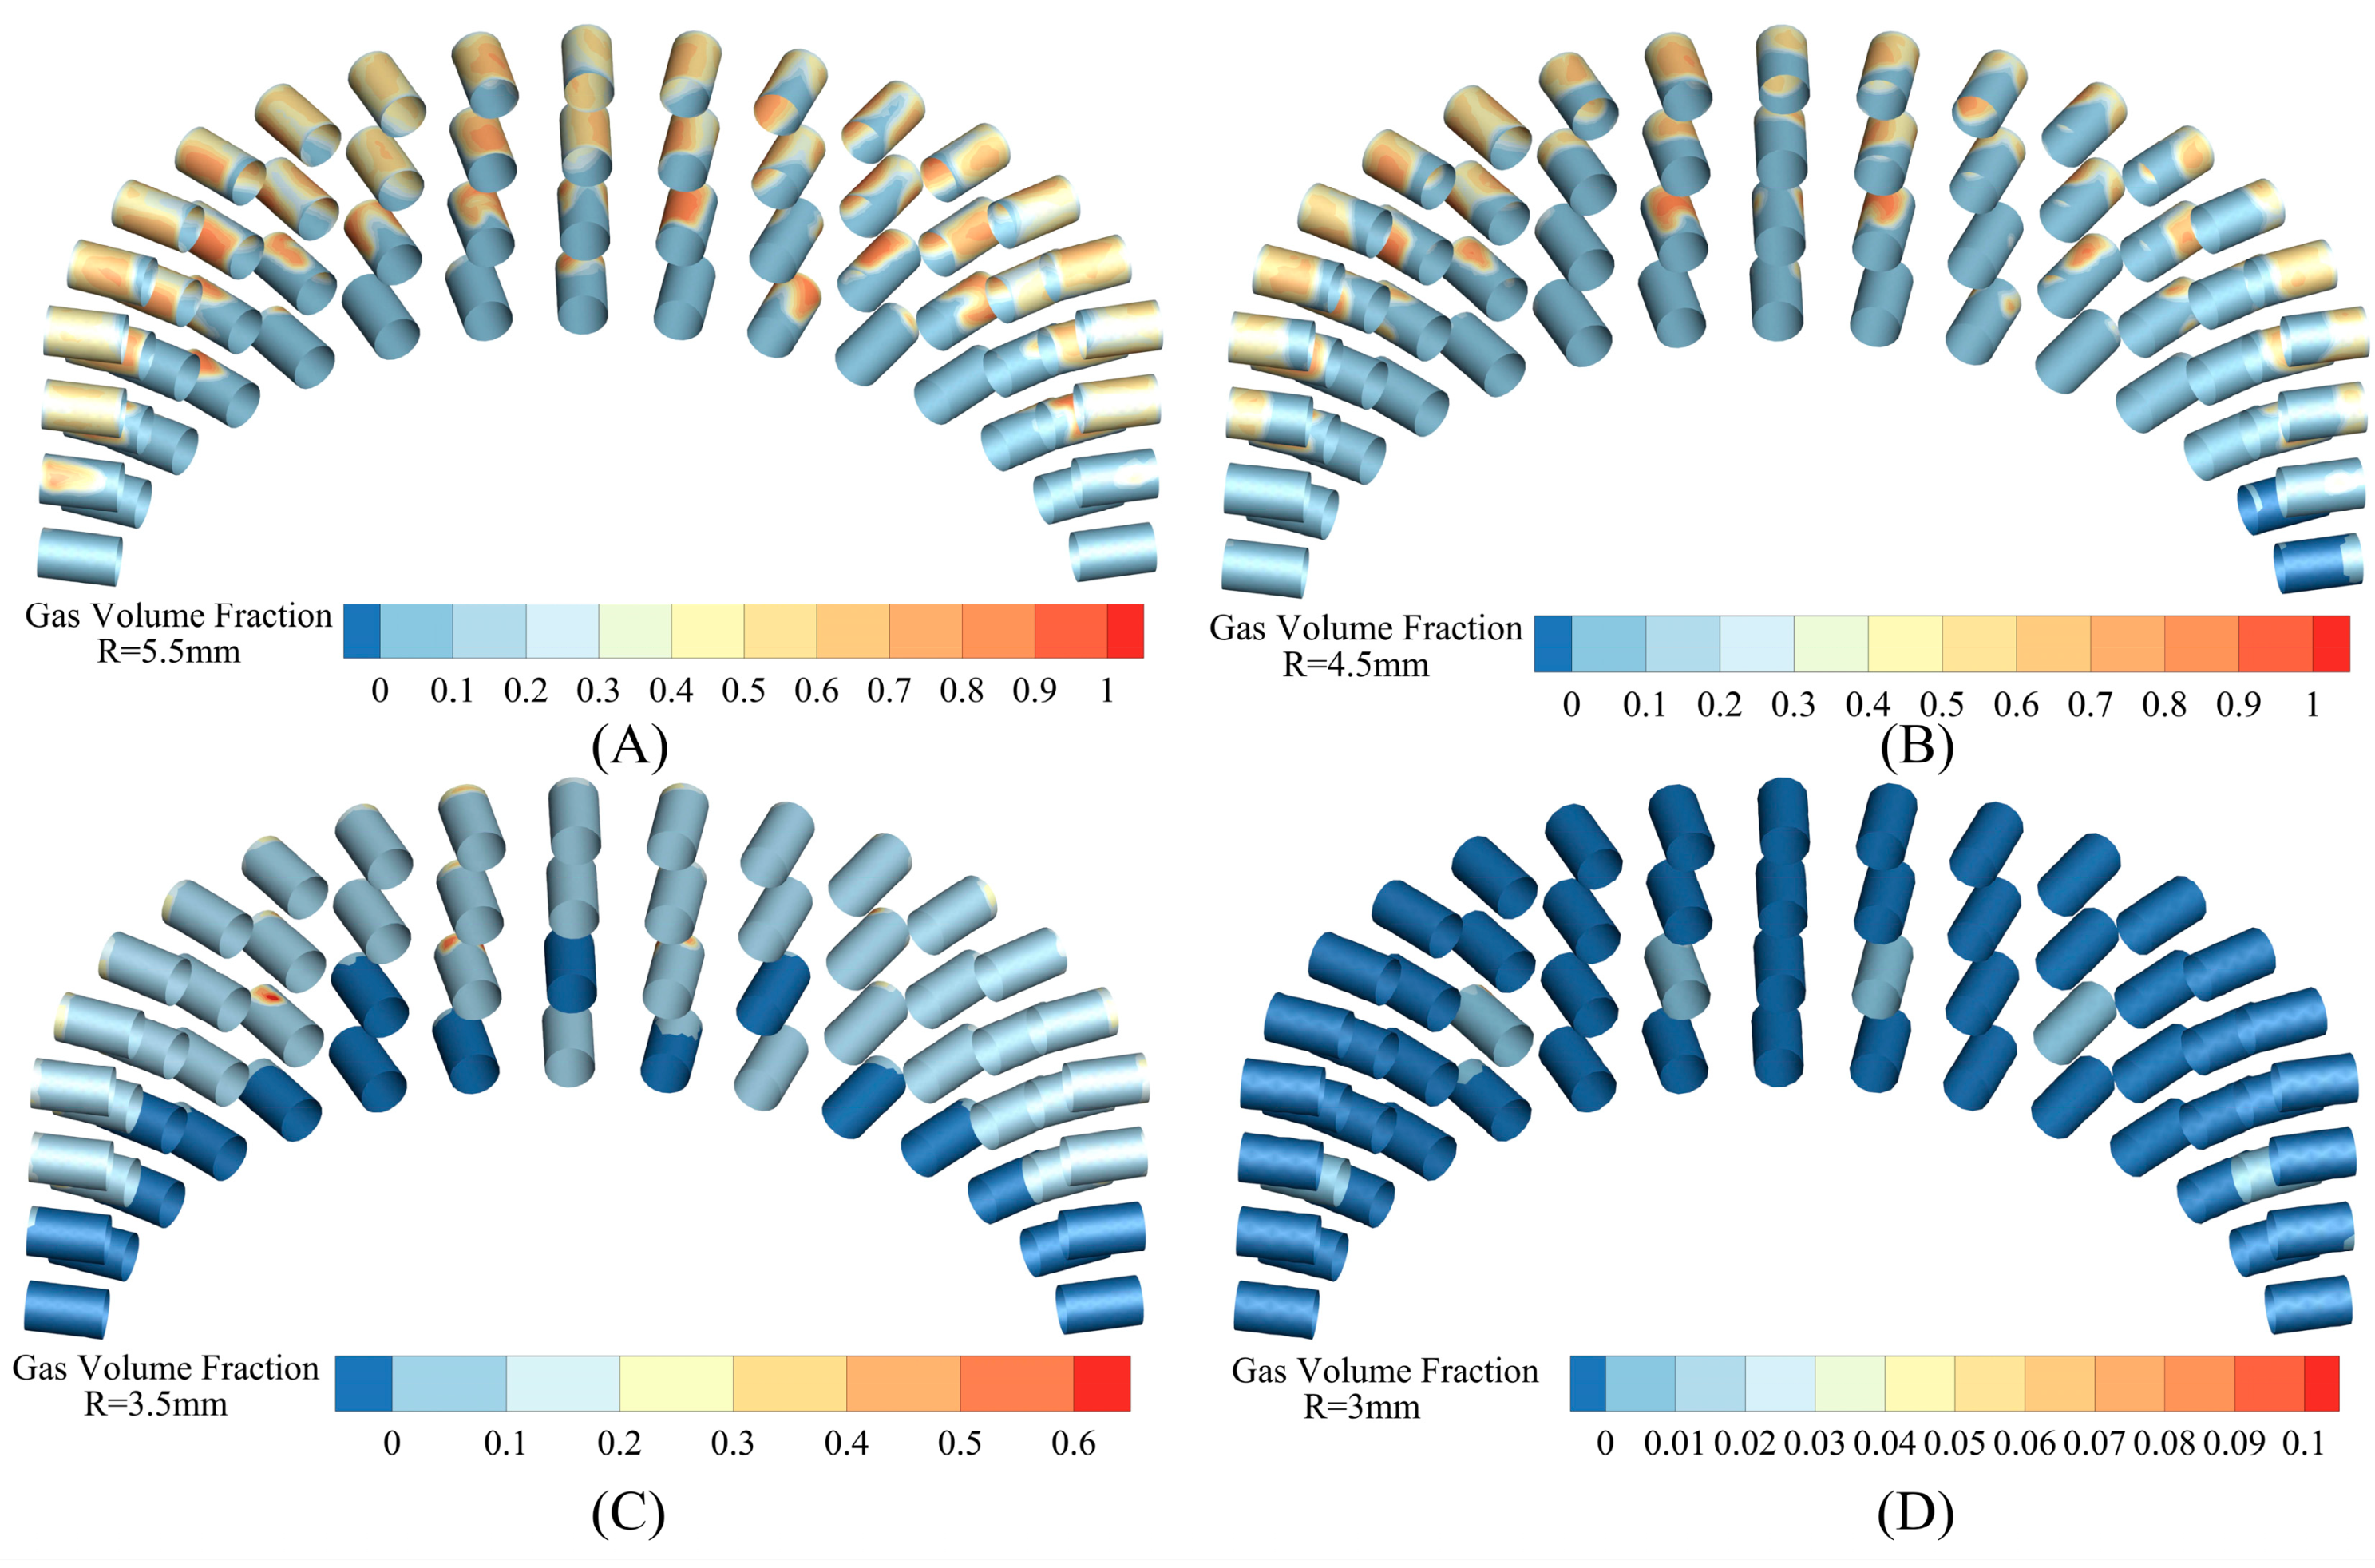
Figure 17: Vapor-volume-fraction distribution in the secondary-sleeve region for single-stage configurations with different hole radii: (A) R = 5.5 mm; (B) R = 4.5 mm; (C) R = 3.5 mm; (D) R = 3.0 mm.
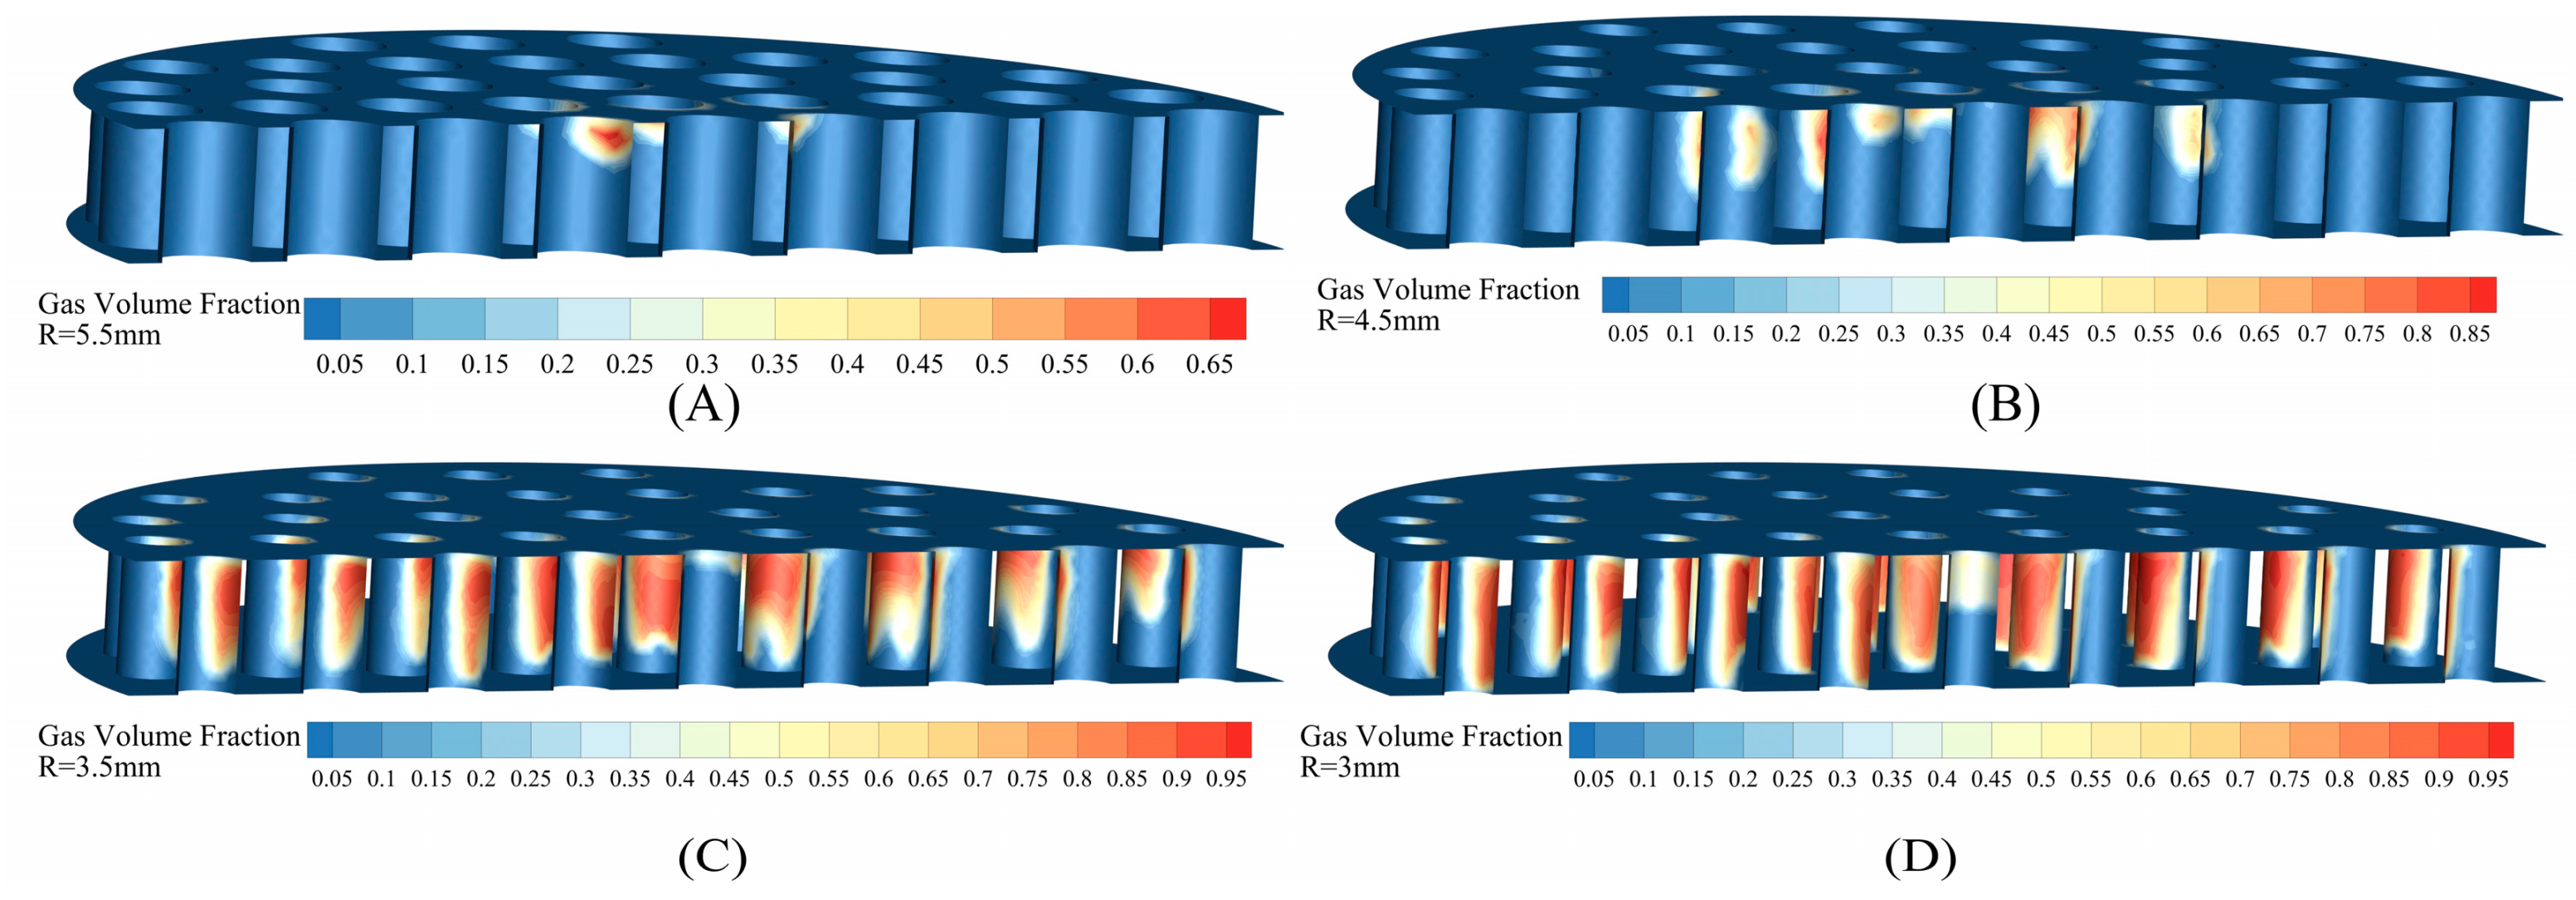
Figure 18: Vapor-volume-fraction distribution in the perforated-plate region for single-stage configurations with different hole radii: (A) R = 5.5 mm; (B) R = 4.5 mm; (C) R = 3.5 mm; (D) R = 3.0 mm.
6 Flow and Cavitation Characteristics of the Two-Stage Perforated-Plate Configuration
6.1 Inter-Plate Jet Conditioning and Energy-Dissipation Characteristics
To quantify jet conditioning and energy dissipation within the passage between the two plates, a series of cross sections were placed along the negative Y direction and the area-weighted average velocity and TKE were extracted. The outlet of the first perforated plate is located at Y = 129.215 mm. For inter-plate spacings S of 10, 15, and 20 mm, the outlets of the second plate are located at Y = 154.215, 159.215, and 164.215 mm, respectively.
The section-averaged velocity and TKE profiles are shown in Fig. 19A,B, respectively. After the flow leaves the first plate, the section-averaged velocity decreases rapidly from approximately 22–23 to approximately 5.1 m/s for all three spacings, corresponding to an attenuation of 77.0%–78.0%. The expansion downstream of the holes therefore effectively weakens the high-velocity jets. At S = 10 mm, TKE increases continuously from 1.370 m2/s2 to 5.014 m2/s2 immediately upstream of the second plate and shows no clear decay. The spacing is too short for the jets to expand sufficiently before entering the second throttling stage, and hydrodynamic coupling between the two plates remains strong. At S = 15 mm, TKE rises from 1.534 to a peak of 7.300 m2/s2 and then decreases to 6.097 m2/s2 before the second plate, corresponding to a post-peak attenuation of approximately 16.5%. This spacing provides sufficient distance for shear-layer mixing, transverse expansion, and initial energy dissipation. TKE at the second-plate outlet decreases further to 1.878 m2/s2, lower than the values for S = 10 and 20 mm. At S = 20 mm, the velocity upstream of the second plate decreases further to approximately 5.342 m/s, but the inter-plate TKE peak rises to 9.444 m2/s2, approximately 29.4% higher than that for S = 15 mm. The longer passage permits extended shear-layer development and interaction among adjacent jets, thereby increasing local turbulent activity.
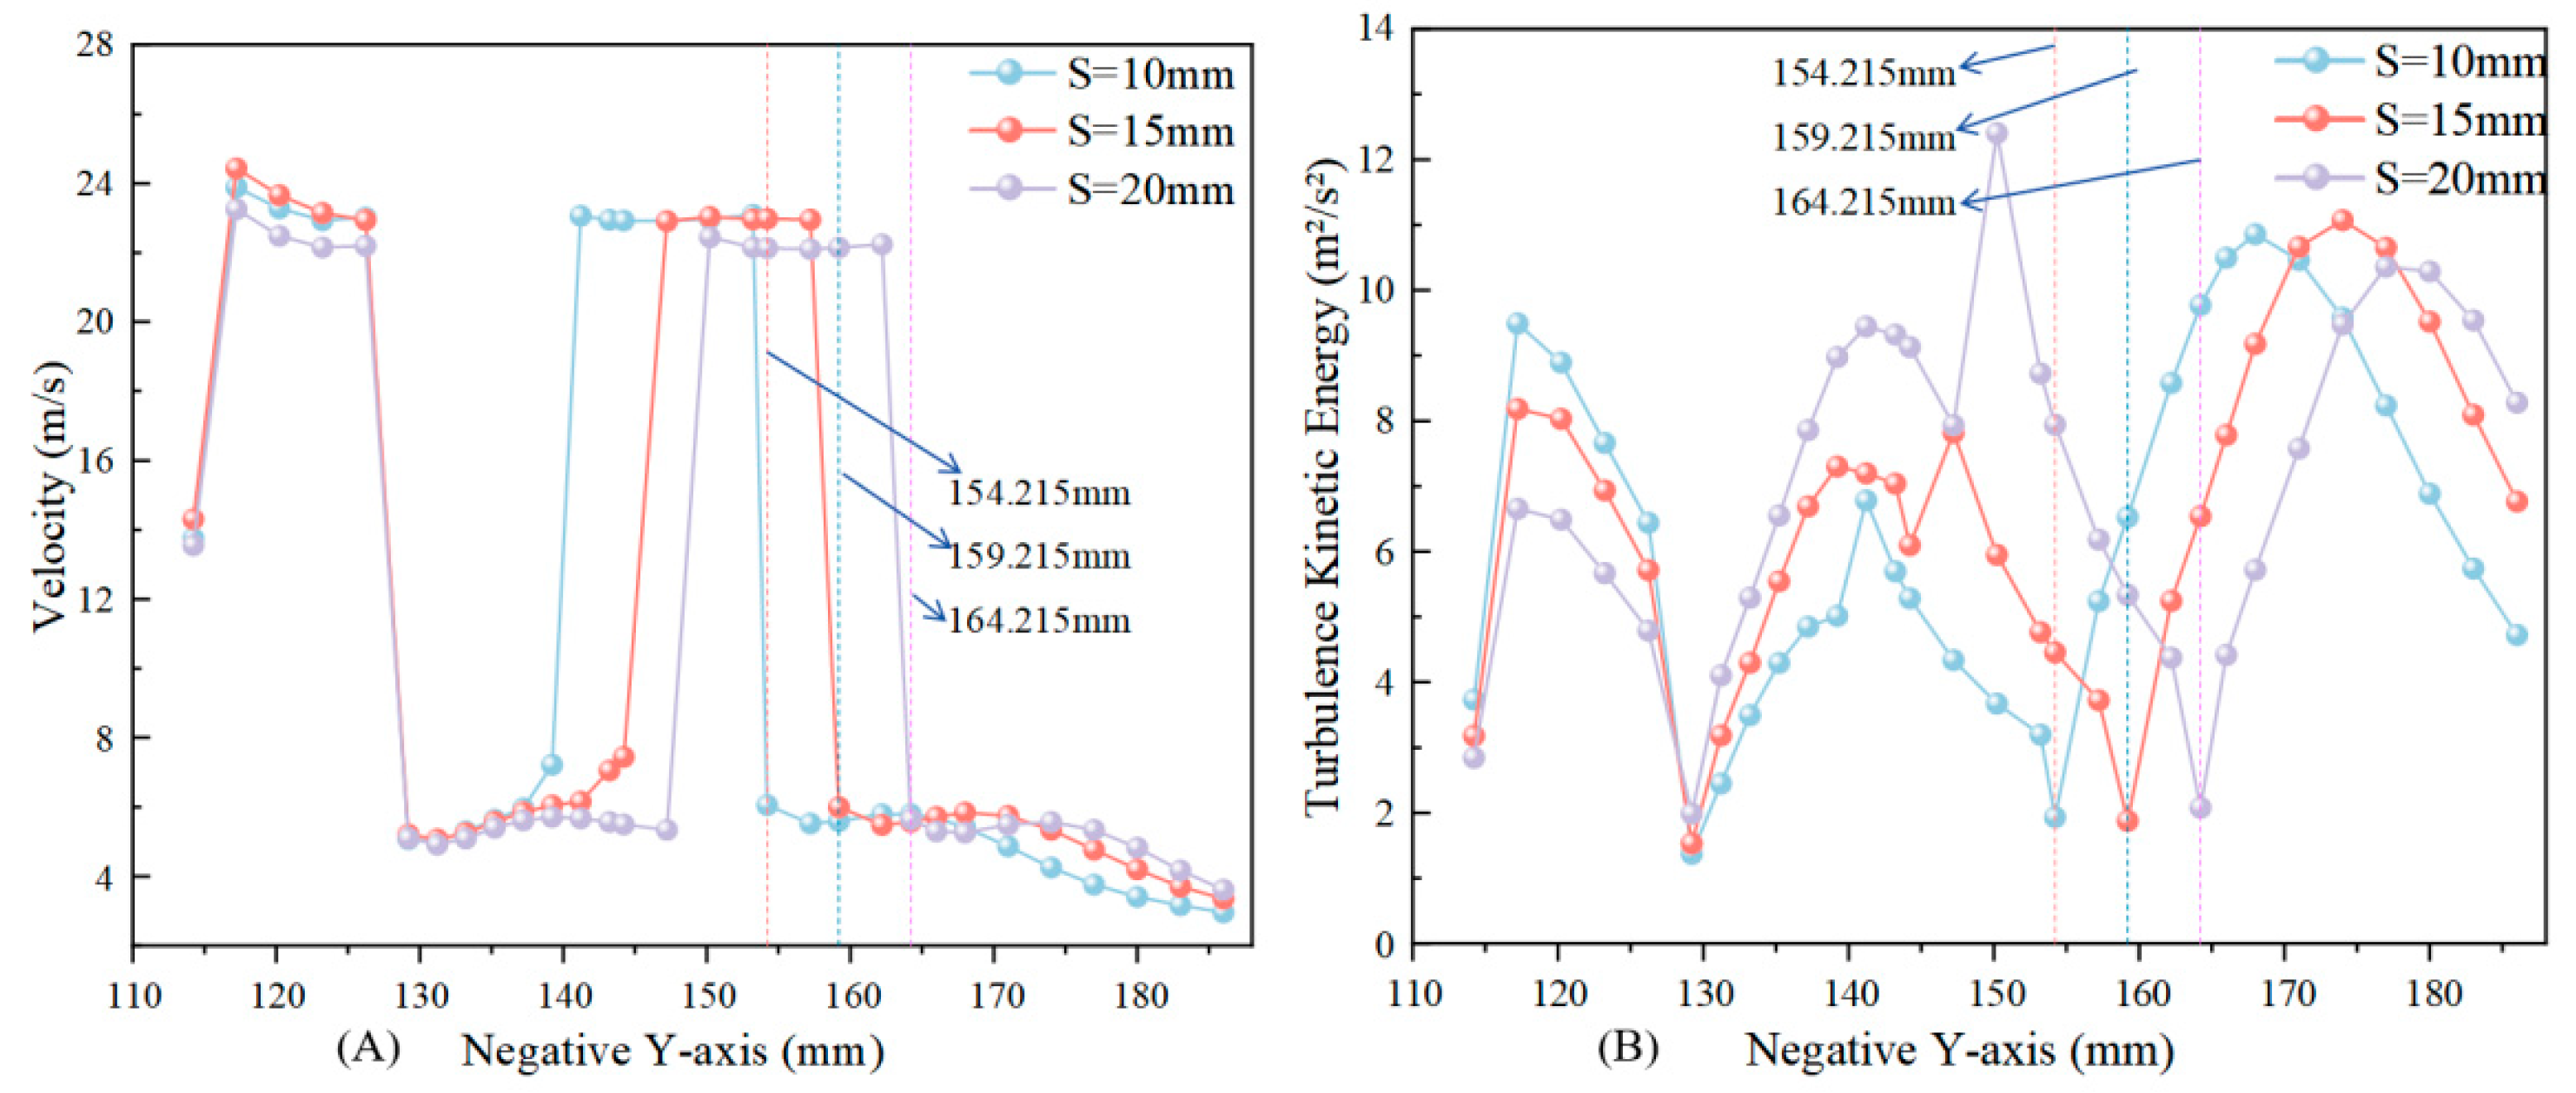
Figure 19: Area-weighted average parameters along the negative Y direction in the inter-plate passage at different spacings: (A) velocity; (B) TKE.
Previous studies have shown that excessively small spacing intensifies hydrodynamic interference between adjacent perforated plates, whereas an appropriate spacing promotes jet conditioning and flow uniformity [20,29]. Considering the section-averaged velocity, TKE evolution, and structural compactness, S = 15 mm provides the most reasonable balance among the three spacings examined. At this spacing, the inter-plate passage provides sufficient room for jet expansion, transverse momentum exchange, and initial TKE attenuation.
The pressure distributions in Fig. 20 show that the two-stage configuration redistributes the pressure drop that was previously concentrated across the secondary sleeve or a single plate among three throttling elements: the secondary sleeve, the first perforated plate, and the second perforated plate. A stepwise pressure-release process is thereby established along the flow direction. For R = 3.0 mm, the area-averaged pressures at Planes C, D, and E are 0.824, 0.771, and 0.286 MPa, respectively, all higher than the corresponding values of 0.540, 0.498, and 0.185 MPa for R = 3.5 mm. The higher downstream-sleeve and inter-plate pressure plateaus reduce the pressure drop carried by any single throttling location and improve downstream static-pressure recovery. The two-stage configuration therefore does more than simply add resistance; it spatially redistributes the release of pressure energy and maintains a larger vaporization-pressure margin downstream of the secondary sleeve, downstream of the first plate, and upstream of the second plate.
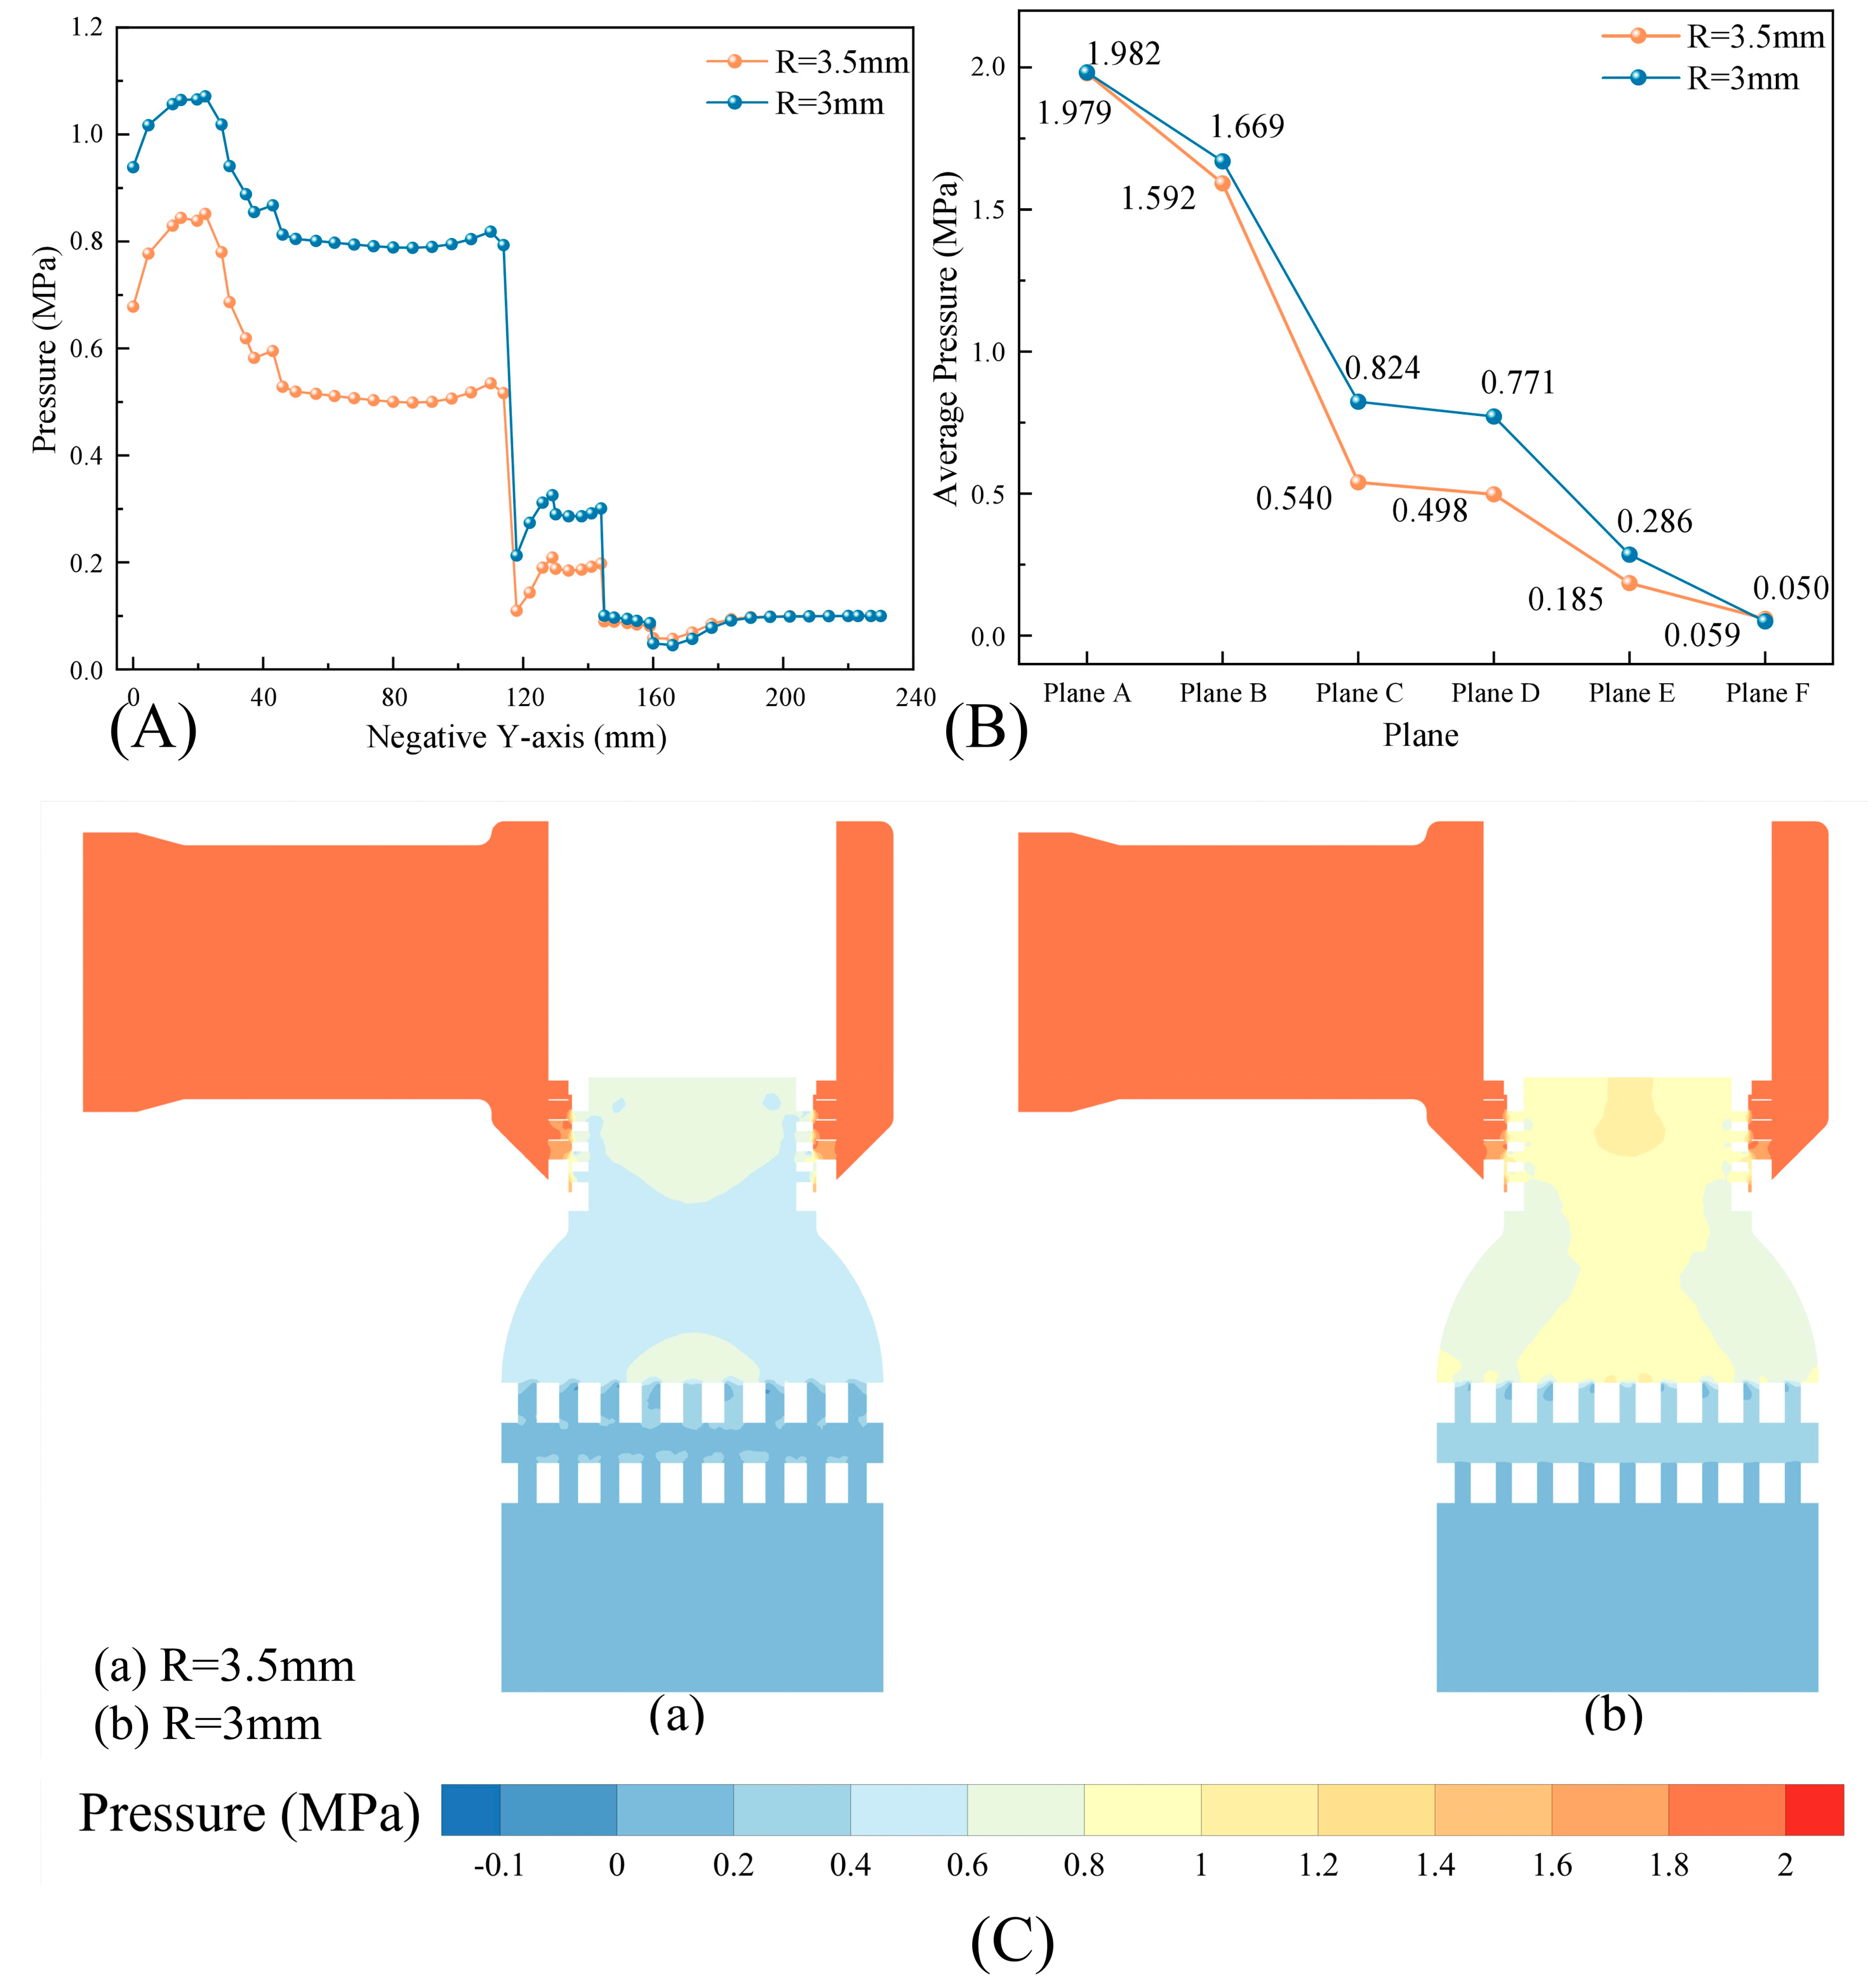
Figure 20: Pressure characteristics of the two-stage perforated-plate configurations with different hole radii: (A) static-pressure distribution along the negative Y direction; (B) area-weighted average static pressure at the characteristic planes; (C) static-pressure contours.
The velocity distributions in Fig. 21A illustrate jet generation, expansion, and attenuation under staged throttling. The flow accelerates as the available area contracts through the secondary-sleeve and plate holes, and the downstream jets decay through entrainment, transverse momentum exchange, and wall interaction after entering the expansion passages. The maximum velocities are 47.328 and 45.401 m/s for R = 3.5 and 3.0 mm, respectively, corresponding to a reduction of approximately 4.1% for the smaller holes. Although local acceleration remains strong near individual holes at R = 3.0 mm, the higher upstream pressure plateau and staged pressure reduction lower the global velocity peak and shorten the development length of each high-velocity jet.
The TKE profiles in Fig. 21B contain several local peaks associated with the shear layer downstream of the secondary sleeve, the first-plate outlet, and the second-plate outlet. This multi-peak distribution demonstrates that the two plates distribute turbulence production among several localized regions rather than concentrating it at a single throttling location. The maximum TKE is 39.121 m2/s2 for R = 3.0 mm, approximately 6.4% lower than the 41.810 m2/s2 obtained for R = 3.5 mm. Although smaller holes increase the velocity gradient near each individual outlet, jet subdivision and the reduced development scale lower the maximum turbulent fluctuation energy in the overall flow field.
Turbulence intensity and dissipation rate further distinguish local turbulence production from downstream decay. Fig. 21C shows a higher local turbulence intensity at and downstream of the second plate for R = 3.0 mm. This increase reflects both stronger transverse interaction among the small-scale jets and the rapid reduction in downstream mean velocity and therefore does not, by itself, demonstrate higher absolute turbulent energy. Fig. 21D shows that the highest dissipation rates are concentrated at the two plates and in their immediate wakes. Although R = 3.0 mm produces larger local dissipation peaks, they decay rapidly downstream. The smaller holes thus confine kinetic-energy conversion and dissipation to the plate near fields and prevent high-energy jets from persisting far downstream.
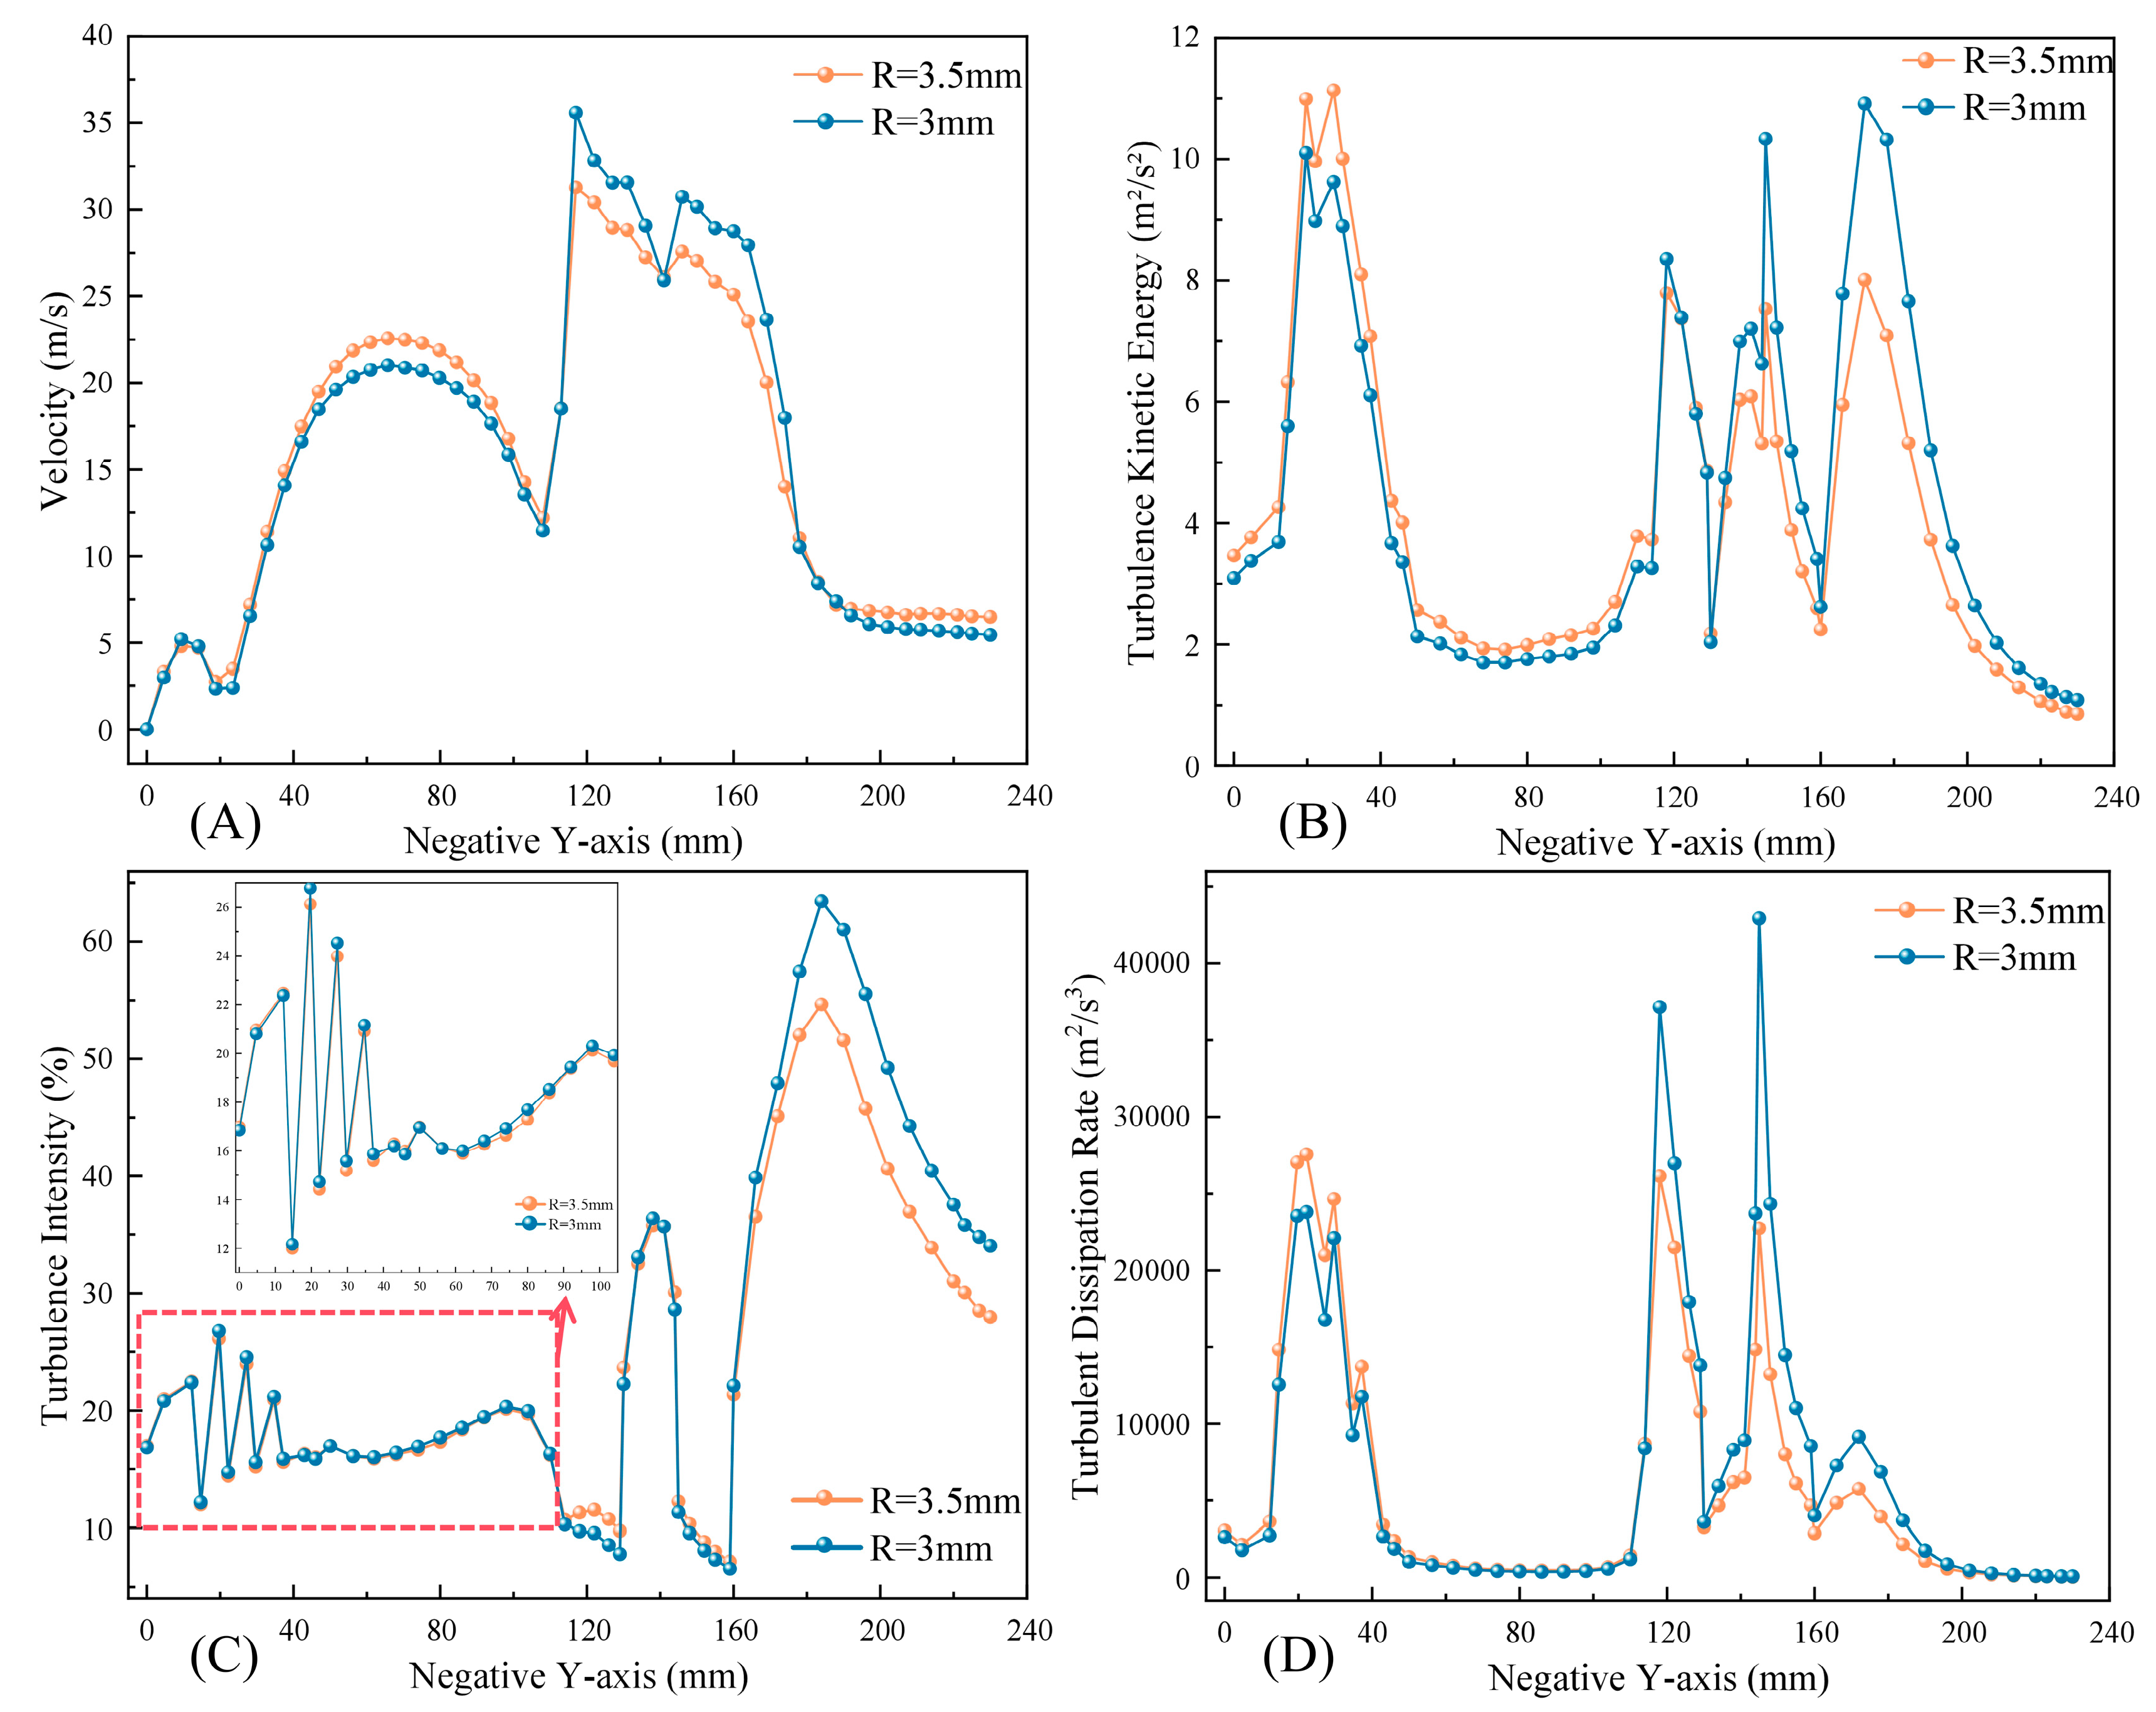
Figure 21: Parameters along the negative Y direction for two-stage perforated-plate configurations with different hole radii: (A) velocity; (B) TKE; (C) turbulence intensity; (D) turbulent dissipation rate.
Vorticity measures the combined intensity of local shear and rotation; a high value may arise from true rotational motion or simply from the strong shear at a hole edge. Fig. 22A shows that the principal vorticity peaks for both configurations occur near the secondary sleeve and the two perforated plates. The higher local peaks in the plate region for R = 3.0 mm indicate stronger contraction-jet shear as the holes become smaller. To distinguish shear layers from vortical structures, the same Q-criterion threshold was used in Fig. 22B. The principal vortical regions are concentrated around the holes, within the inter-plate passage, and in local recirculation zones; no large continuous structure extends from the secondary sleeve through the outlet passage. For R = 3.0 mm, the structures are more discretely distributed around individual holes, indicating that staged pressure reduction and inter-plate jet conditioning restrict their axial extension.
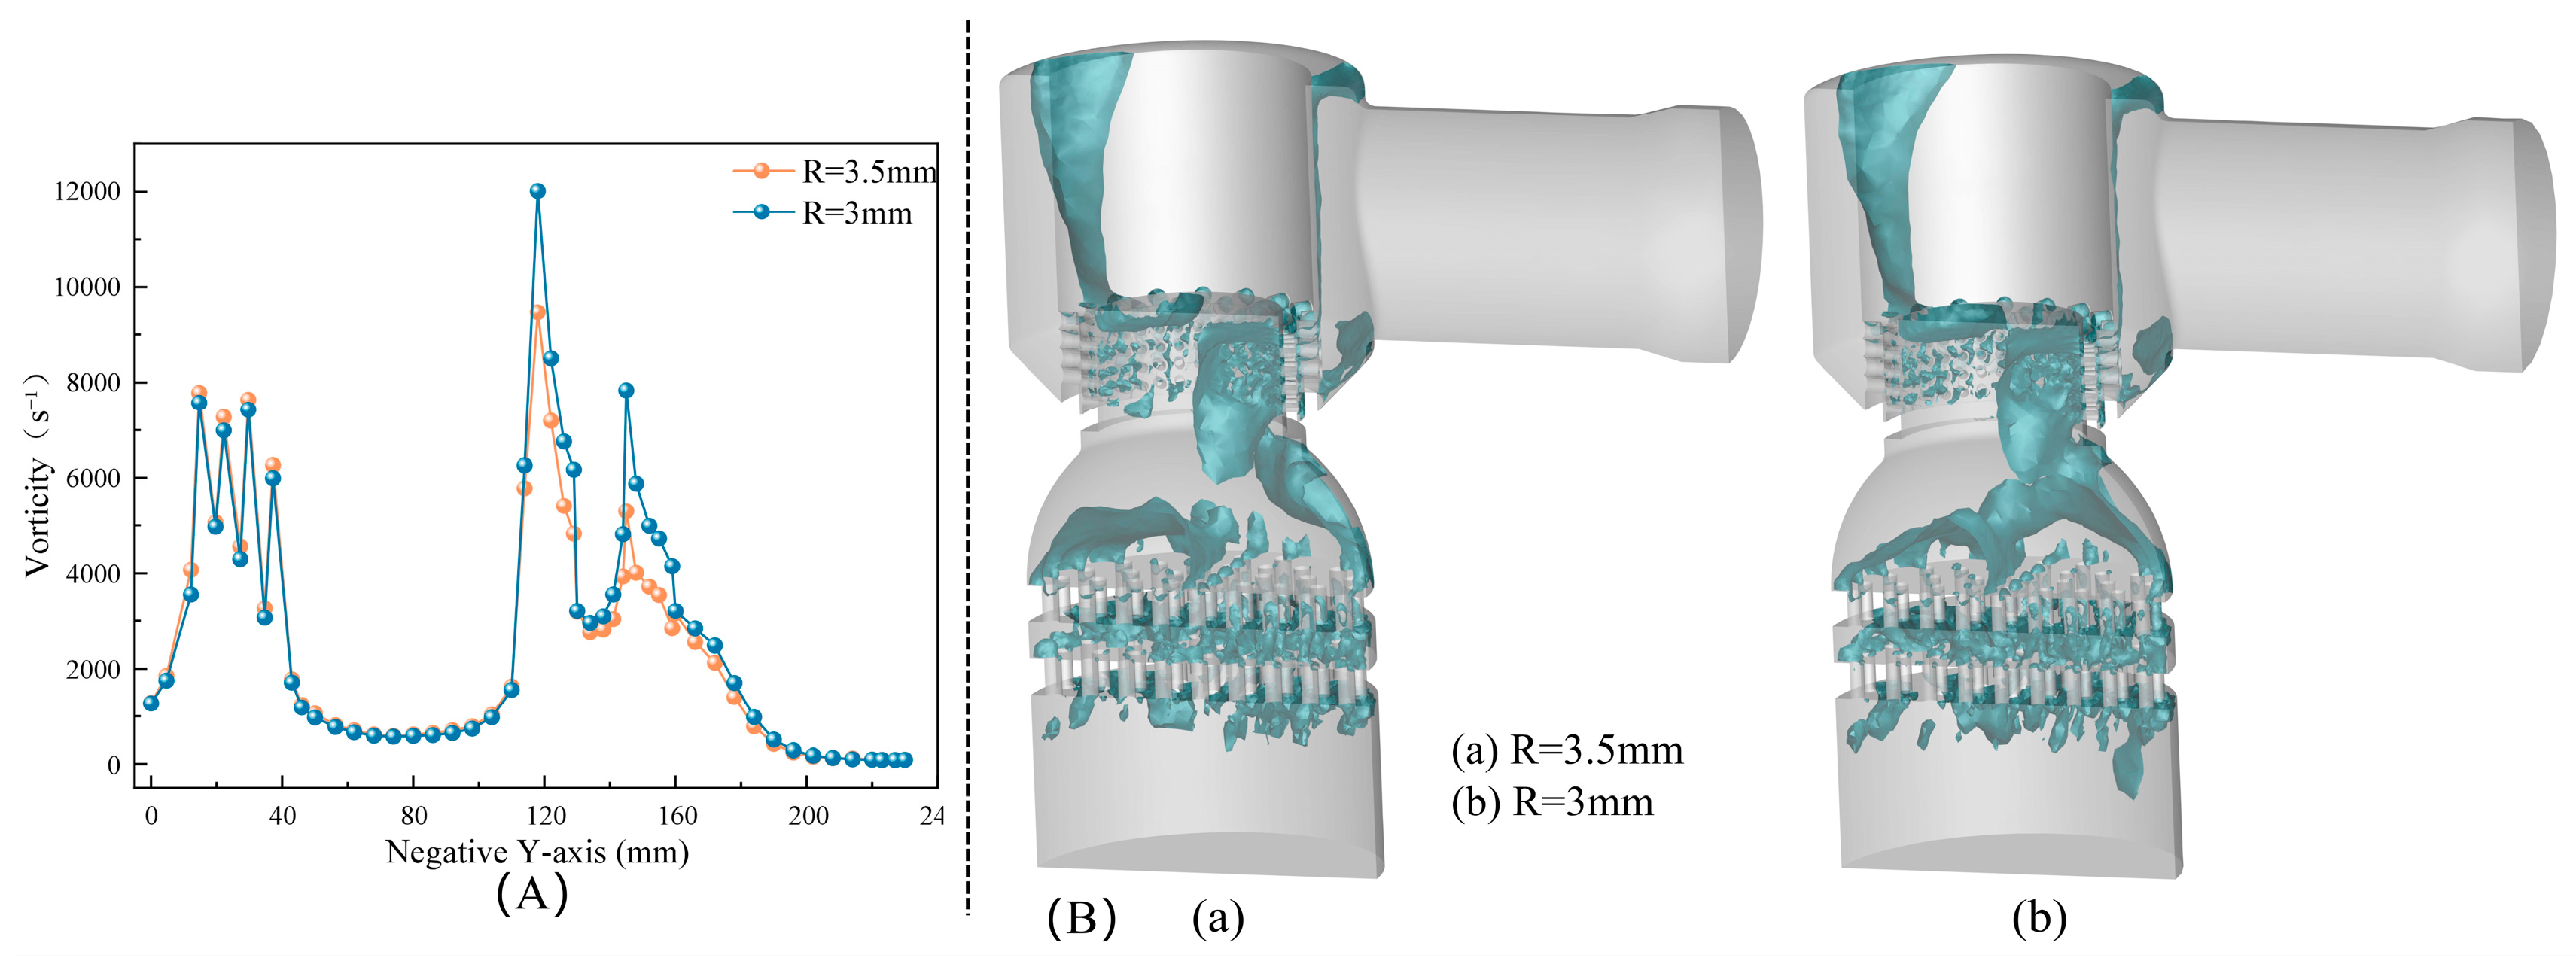
Figure 22: Rotational-flow characteristics of the two-stage perforated-plate configurations with different hole radii: (A) vorticity distribution along the negative Y direction; (B) time-averaged vortical structures identified using the Q criterion.
The velocity and TKE contours in Fig. 23A,B, respectively, further support this interpretation. For both radii, the high-velocity regions are divided among the sleeve holes and the two perforated plates. Downstream jets expand, mix, and equalize momentum within the inter-plate passage, while the high-TKE regions remain localized and patch-like rather than forming a continuous high-energy pathway from the secondary sleeve to the outlet. Although R = 3.0 mm produces stronger local dissipation and relative turbulence intensity near the plates, it also maintains a higher pressure plateau and lower global maxima of velocity and TKE. The intense shear is therefore confined primarily to the holes and their immediate wakes rather than developing into a large-scale persistent high-energy jet.
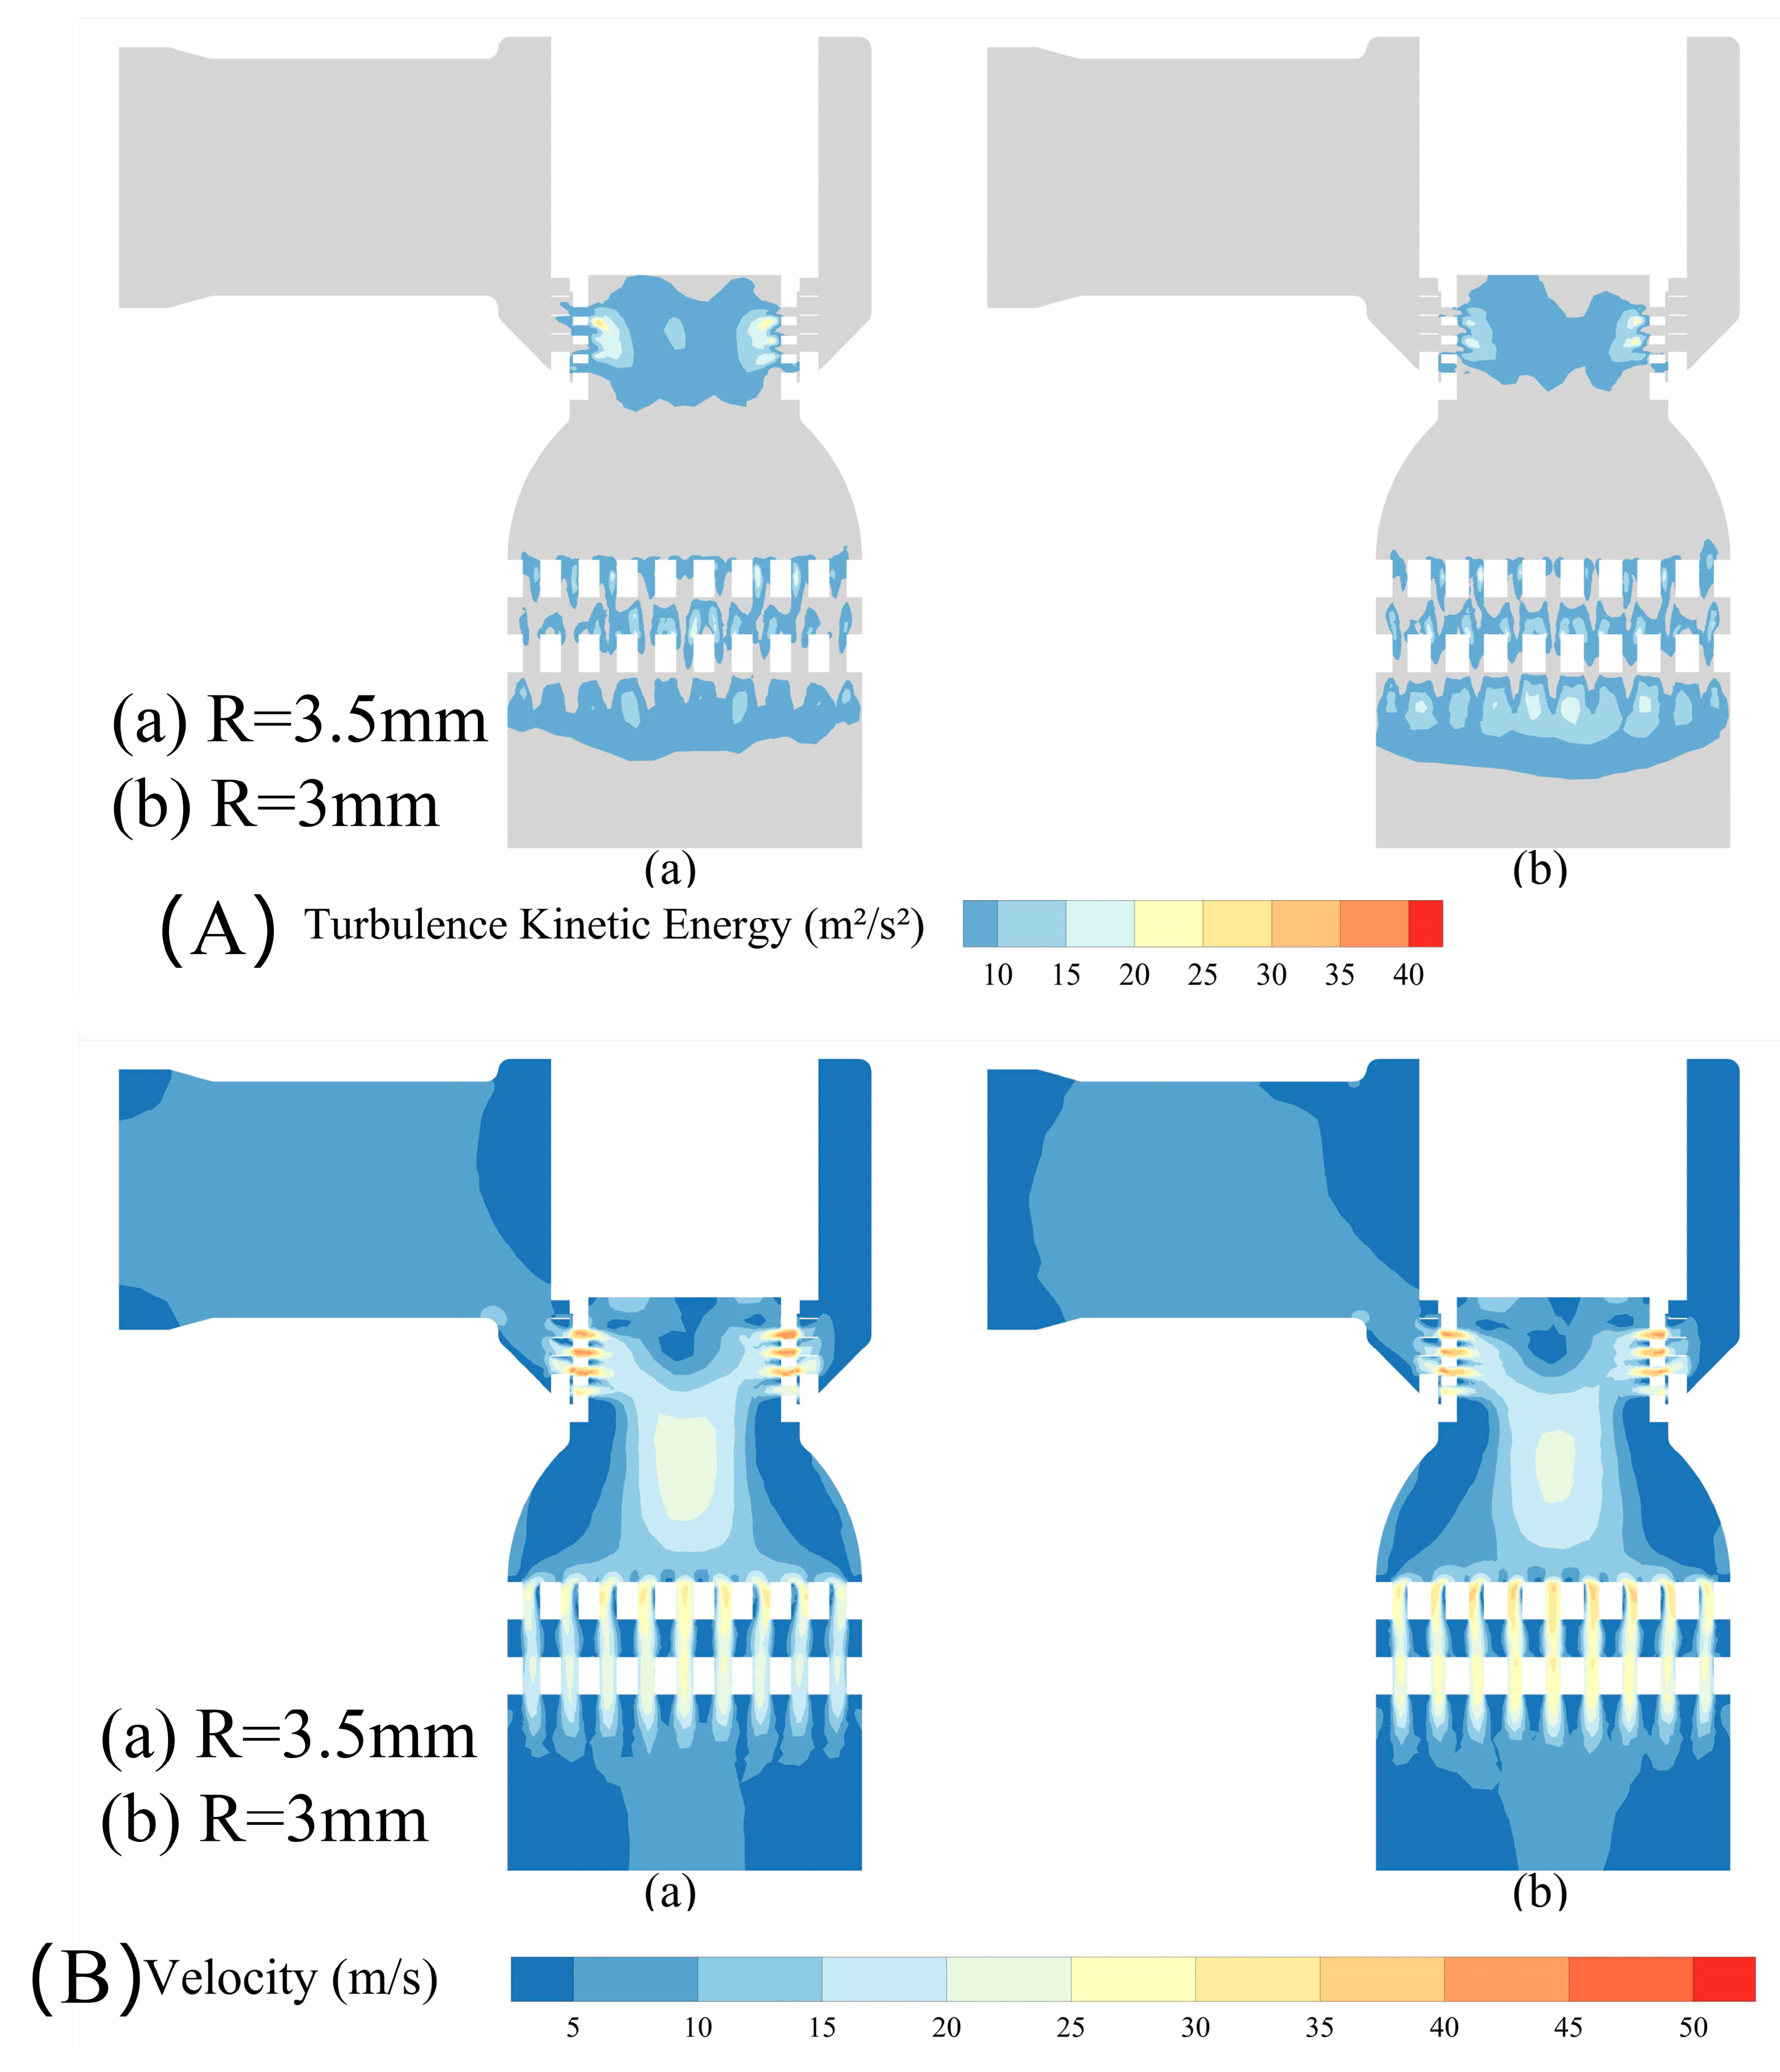
Figure 23: (A) Velocity and (B) TKE contours for two-stage perforated-plate configurations with different hole radii.
The flow-control mechanism of the two-stage perforated plates can be summarized as staged pressure reduction, jet subdivision, inter-plate expansion, localized dissipation, and pressure recovery. The configuration does not eliminate shear and rotational motion near the holes; rather, it reduces the loading on each stage and shortens the development lengths of continuous high-velocity jets and low-pressure vortical regions. Relative to R = 3.5 mm, the R = 3.0 mm configuration maintains higher pressures at the characteristic sections and lower global maxima of velocity and TKE, indicating a more distributed release of pressure energy and a smaller sustained low-pressure region. The corresponding maximum velocity, maximum TKE, and maximum vapor volume fraction are compared in Fig. 24.
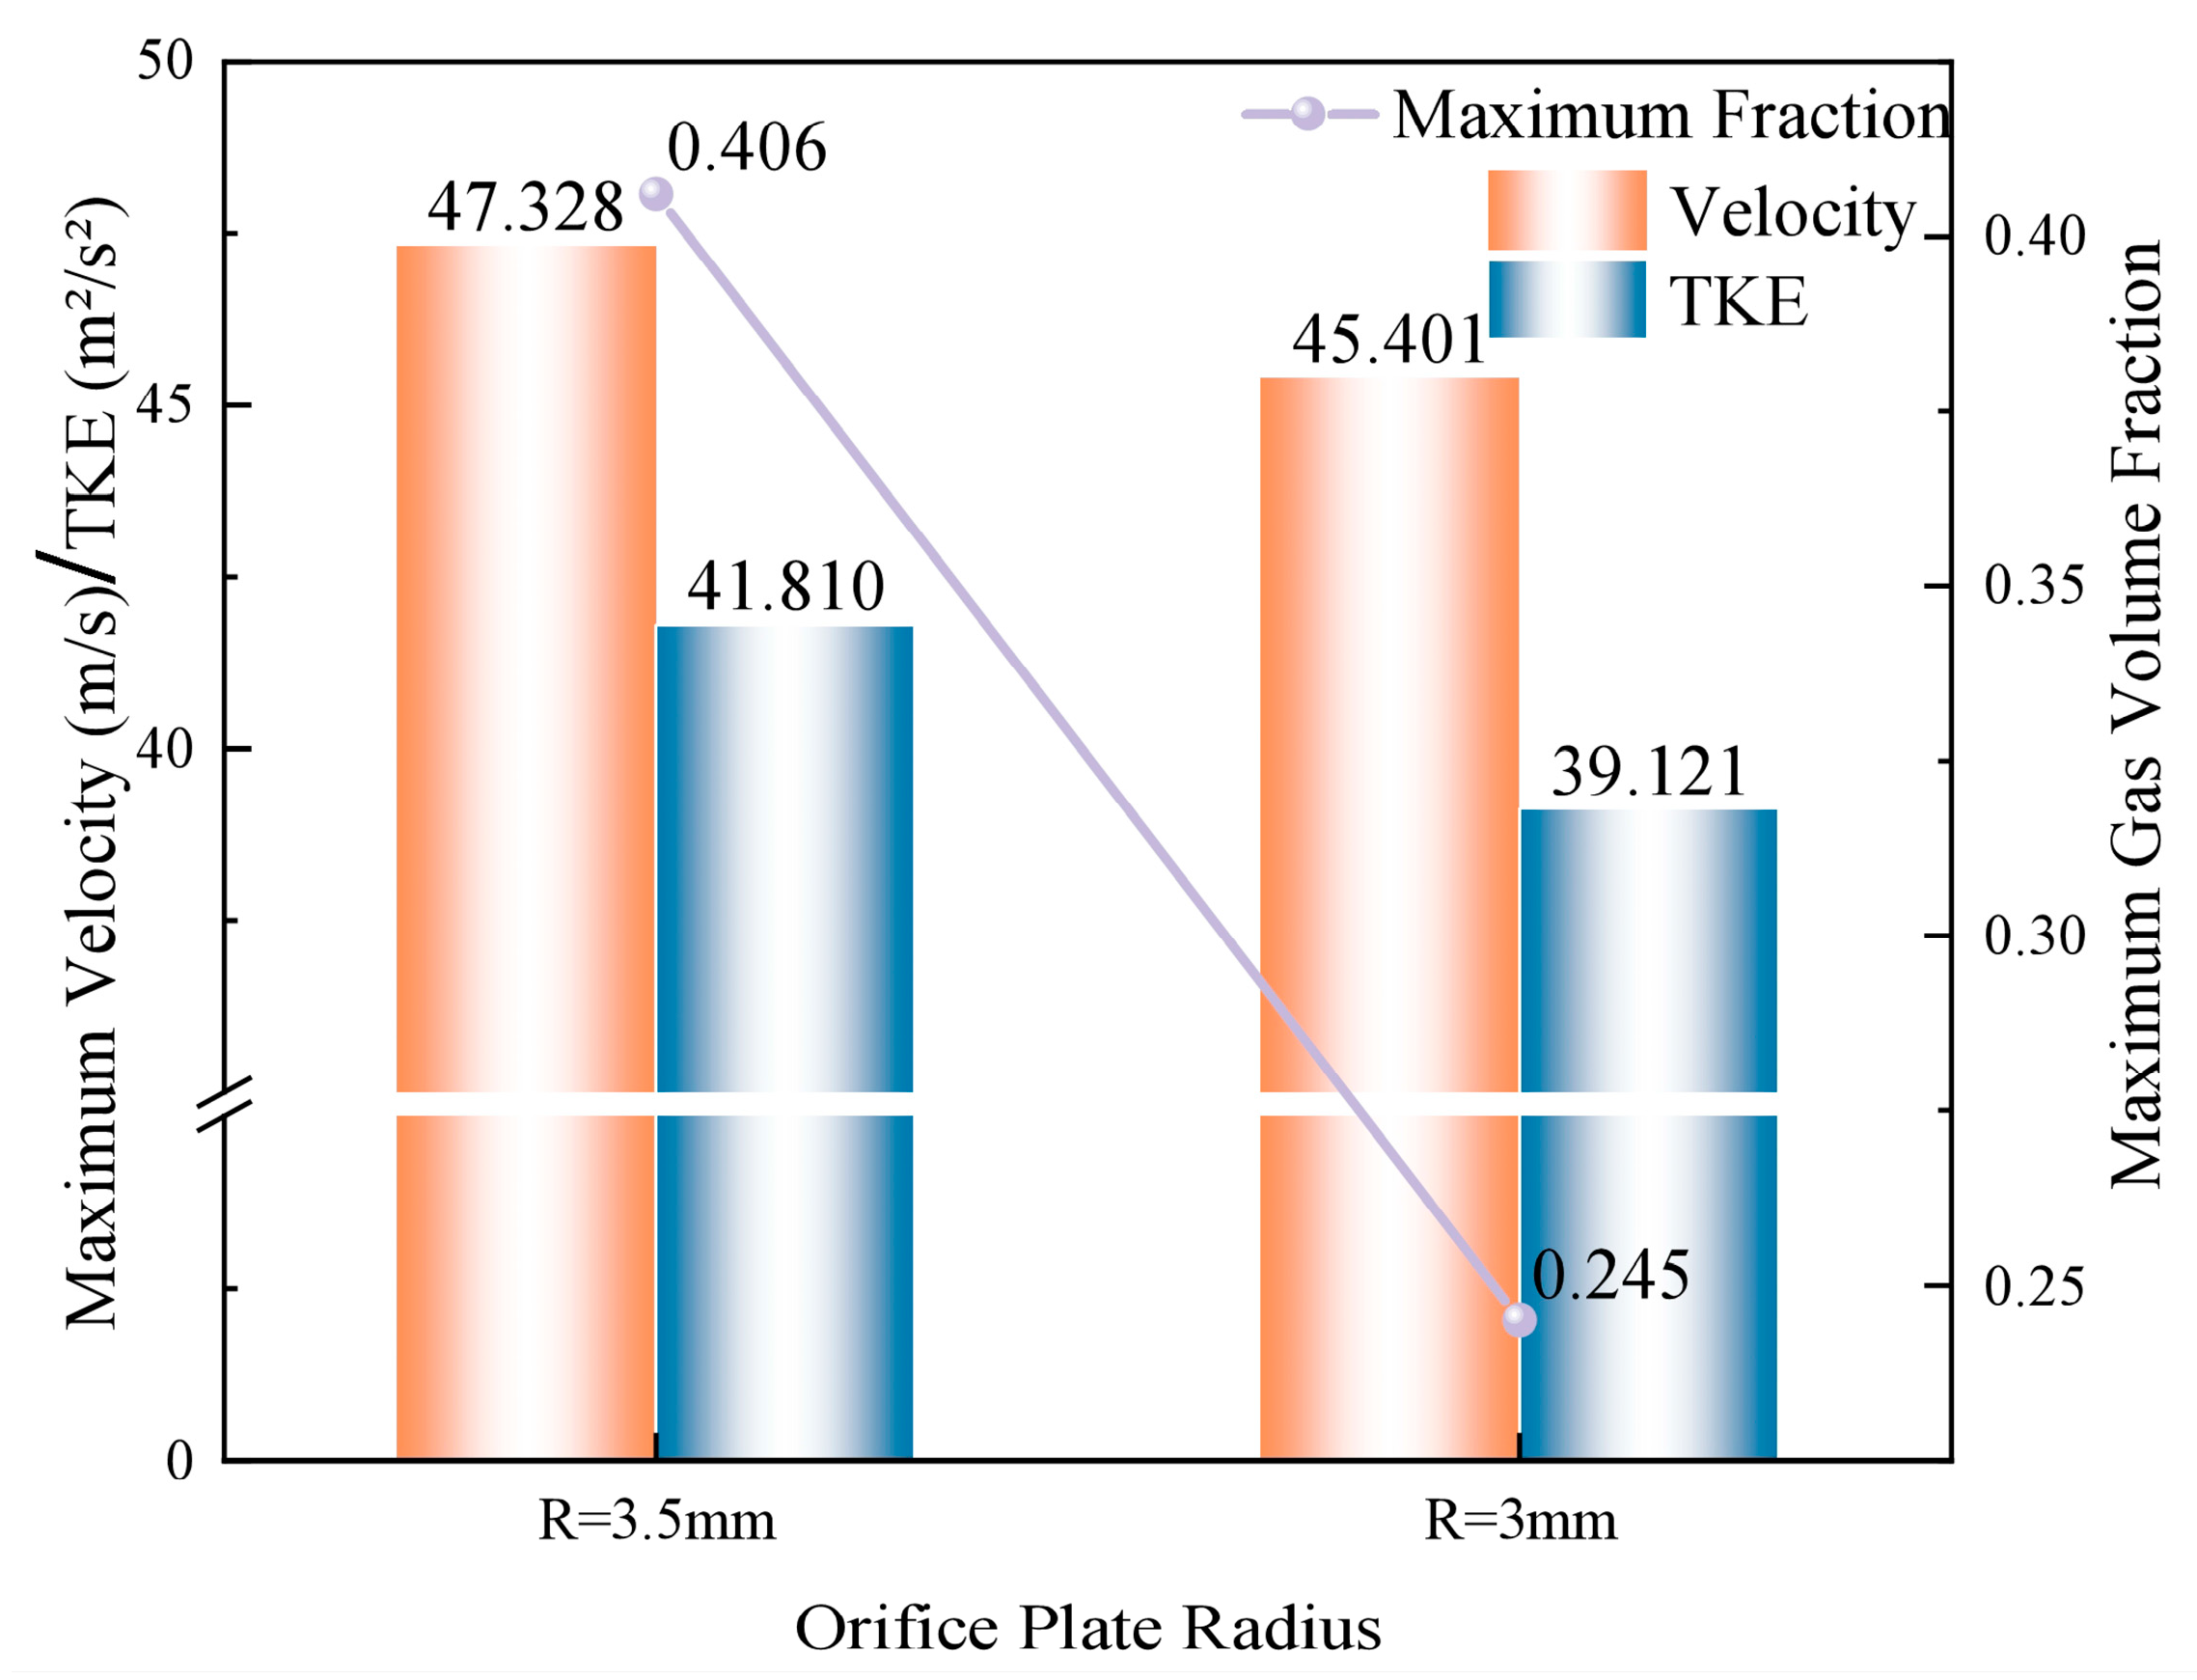
Figure 24: Maximum velocity, maximum TKE, and maximum vapor volume fraction for two-stage perforated-plate configurations with different hole radii.
6.3 Cavitation Characteristics
Fig. 25 shows that neither the R = 3.5 mm nor the R = 3.0 mm two-stage configuration develops a large continuous vapor region in the secondary sleeve, the two plates, or the inter-plate passage. Vapor appears mainly as small isolated patches at local hole edges or in the immediate wakes. In contrast to the continuous high-vapor bands extending downstream of the holes in the corresponding single-stage cases, the two-stage configuration markedly reduces both the connectivity and the axial extent of the vapor field. Staged pressure reduction therefore weakens the persistent low-pressure core associated with any single throttling location.
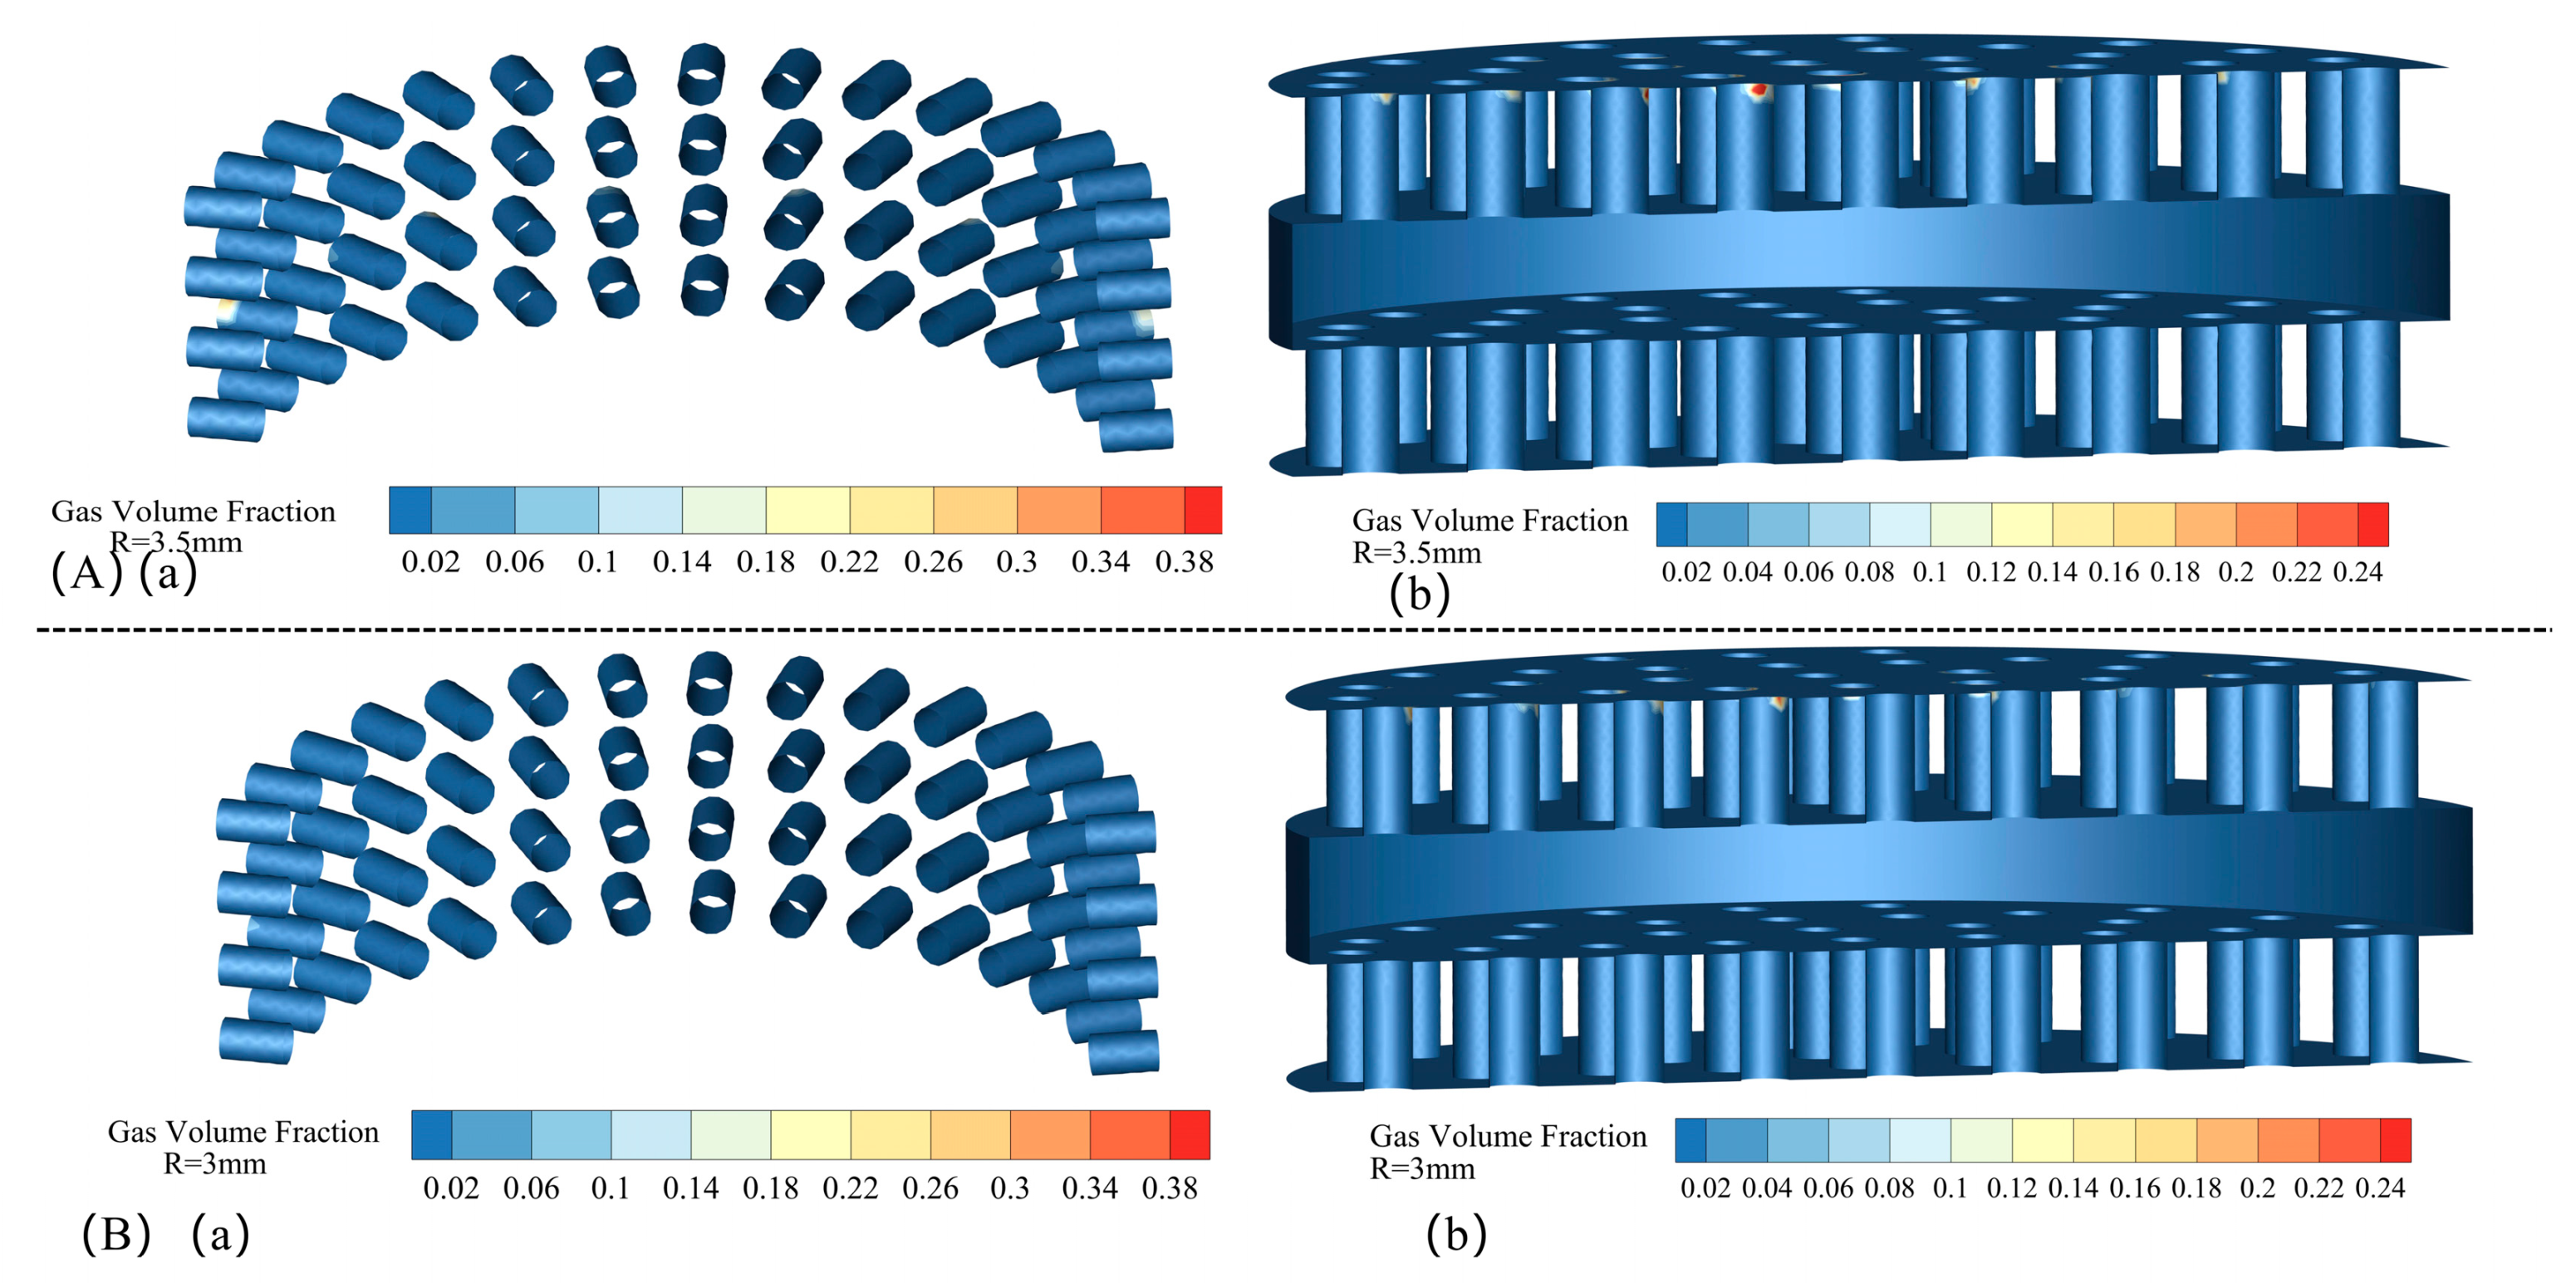
Figure 25: Vapor-volume-fraction distributions in the secondary-sleeve and perforated-plate regions of the two-stage configurations with different hole radii: (A) R = 3.5 mm: (a) secondary-sleeve region and (b) perforated-plate region; (B) R = 3.0 mm: (a) secondary-sleeve region and (b) perforated-plate region.
As listed in Table 5, σd downstream of the second plate is 1.325 for R = 3.5 mm and 1.204 for R = 3.0 mm. The slightly lower value for R = 3.0 mm indicates a smaller local mean vaporization-pressure margin at the second-plate holes. Nevertheless, the maximum vapor volume fraction decreases from 0.406 to 0.245 and equivalent vapor volume decreases from 1.129803 × 10⁻⁸ to 4.46002 × 10⁻⁹ m3, corresponding to reductions of approximately 39.7% and 60.5%, respectively. Thus, σd characterizes the mean vaporization-pressure margin at a specific throttling element, whereas the maximum vapor volume fraction and equivalent vapor volume describe the local peak and overall vapor scale. According to the steady maximum vapor volume fraction and equivalent vapor volume, the R = 3.0 mm case has the smaller time-averaged cavitation extent.
Table 5: Steady cavitation metrics for the two-stage perforated-plate configurations.
| Variable | R = 3.5 mm | R = 3.0 mm |
|---|---|---|
| Downstream cavitation number, σd | 1.325 | 1.204 |
| Equivalent vapor volume, V/m3 | 1.129803 × 10⁻⁸ | 4.46002 × 10⁻⁹ |
Relative to the single-stage configurations with the same hole radii, the two-stage design provides a substantially larger improvement. For the single-stage R = 3.5 and 3.0 mm cases, σd is 0.897 and 0.882, and equivalent vapor volume is 3.491281 × 10⁻⁶ and 3.284079 × 10⁻⁶ m3, respectively. With two plates, σd increases to 1.325 and 1.204, while equivalent vapor volume decreases by approximately 99.68% and 99.86%. The single-stage plate therefore primarily transfers cavitation from the secondary sleeve to the plate, whereas the two-stage configuration shares the local pressure drop and weakens the connected low-pressure jet core, greatly reducing the connectivity and overall volume of the time-averaged vapor field.
The cavitation-mitigation mechanism is consistent with the inter-plate flow adjustment described in Section 6.1. The multiple jets issuing from the first plate expand laterally, interact, and dissipate TKE within the 15 mm inter-plate passage, reducing flow non-uniformity upstream of the second plate. The second plate then carries the remaining pressure drop, preventing excessive loading of either stage. Although local dissipation peaks remain near the holes, the vortical structures identified by the Q criterion are confined to small regions and do not couple with a large-scale continuous low-pressure zone. The two-stage configuration therefore converts a concentrated release of pressure energy into a distributed multistage process and prevents a large continuous high-vapor region from forming in either the sleeve or plate regions.
Table 6 further illustrates the improvement in the selected flow and cavitation metrics produced by the two-stage configuration. Relative to the single-stage R = 3.0 mm case, the two-stage R = 3.0 mm case reduces the maximum velocity by approximately 5.1%, the maximum TKE by approximately 15.7%, and the maximum vapor volume fraction from 0.975 to 0.245, a reduction of approximately 74.9%. The much larger reduction in maximum vapor volume fraction than in maximum velocity indicates that the decrease in vapor extent is not governed solely by the velocity peak; staged pressure reduction, smaller jet scales, inter-plate energy dissipation, and reduced low-pressure connectivity also play important roles.
Table 6: Key flow and cavitation parameters for the investigated throttling configurations.
| Configuration | Maximum Velocity/(m/s) | Maximum TKE/(m2/s2) | Maximum Vapor Volume Fraction |
|---|---|---|---|
| No perforated plate, P_out = 0.1 MPa | 61.876 | 111.578 | 0.929 |
| Single-stage perforated plate, R = 3.5 mm | 56.141 | 75.529 | 0.960 |
| Single-stage perforated plate, R = 3.0 mm | 47.849 | 46.389 | 0.975 |
| Two-stage perforated plates, R = 3.5 mm | 47.328 | 41.810 | 0.406 |
| Two-stage perforated plates, R = 3.0 mm | 45.401 | 39.121 | 0.245 |
Among the two-stage configurations, R = 3.0 mm reduces the maximum velocity and maximum TKE by approximately 4.1% and 6.4%, respectively, relative to R = 3.5 mm, while reducing the maximum vapor volume fraction and equivalent vapor volume by approximately 39.0% and 60.5%. The smaller holes divide the total flow into finer jets and increase the ratio of jet-interface area to jet cross-sectional area, thereby strengthening transverse momentum exchange and facilitating expansion and dissipation in the inter-plate passage. The higher downstream-sleeve and inter-plate pressure plateaus also reduce the downstream low-pressure region. Although the R = 3.0 mm case exhibits locally higher turbulence intensity, dissipation rate, and vorticity near the holes, these high-value regions remain limited in extent and do not form a continuous vapor band. Based on the steady pressure, velocity, TKE, and vapor metrics used in this study, the R = 3.0 mm two-stage configuration therefore performs favorably. However, changing the hole radius also affects valve flow capacity. Because mass flow rate, flow coefficient, and other engineering constraints were not included in the comprehensive assessment, this configuration should not be described as globally optimal.
In summary, the two-stage perforated plates reconstruct the pressure-energy release path through increased sleeve back pressure, staged pressure reduction, inter-plate dissipation, and secondary throttling. In terms of the time-averaged vapor metrics, the continuous high-vapor region downstream of a single plate is transformed into localized discrete vapor patches, substantially reducing the connectivity and overall scale of the vapor field.
Steady RANS simulations were used to systematically investigate the flow and cavitation characteristics of an MSPRV for a nuclear feedwater system with no perforated plate, a single perforated plate, and two perforated plates. The inlet pressure was 2 MPa, the outlet pressure ranged from 0.8 to 0.1 MPa, and water at 25°C was used as the reference fluid. The evaluation included the downstream cavitation number, equivalent vapor volume, turbulence intensity, turbulent dissipation rate, and Q criterion. The principal conclusions are as follows.
- (1)The configuration without a perforated plate exhibits pronounced pressure-drop concentration and localized energy dissipation under high-pressure-drop conditions. Most of the pressure drop is carried by the secondary sleeve and its immediate downstream region, producing high-velocity jets, elevated TKE, and high vorticity, while the static pressure decreases rapidly and recovers insufficiently. As the outlet pressure decreases from 0.8 to 0.1 MPa, σd decreases from 7.861 to 1.088 and equivalent vapor volume increases from 5.323 × 10⁻¹⁰ to 1.070 × 10⁻⁶ m3. Cavitation accordingly evolves from isolated patches near the holes to a relatively extensive connected vapor region.
- (2)A single perforated plate raises the back pressure downstream of the secondary sleeve and reduces the pressure drop carried by the sleeve, thereby weakening the sleeve jets and sleeve cavitation. As the hole radius decreases, however, the pressure drop becomes concentrated across the single plate. At R = 3.0 mm, the plate carries approximately 62% of the local pressure drop, σd decreases to 0.882, equivalent vapor volume increases to 3.284 × 10⁻⁶ m3, and the maximum vapor volume fraction reaches 0.975, exceeding that of the no-plate case. The single-stage plate therefore migrates cavitation from the secondary sleeve to the plate rather than suppressing it throughout the valve. The sharp plate edges and downstream pressure-recovery regions may be susceptible to cavitation erosion, pressure pulsation, vibration, and noise; however, these risks cannot be quantified without transient pressure, acoustic, and material-response analyses.
- (3)The two-stage perforated plates distribute the total pressure drop among the secondary sleeve, first perforated plate, and second perforated plate. Jets leaving the first plate undergo lateral expansion, momentum exchange, and TKE dissipation in the inter-plate passage, reducing the velocity non-uniformity and jet momentum upstream of the second plate. The second plate then carries the remaining pressure drop, preventing the formation of a long continuous low-pressure core at any single throttling element. Among the investigated spacings of 10, 15, and 20 mm, the 15 mm configuration provides the most reasonable compromise among post-peak TKE attenuation, turbulence level downstream of the second plate, and structural compactness.
- (4)Among the two-stage configurations with equal hole radii, the R = 3.0 mm design performs favorably in terms of the steady mean pressure, velocity, TKE, and vapor metrics. Relative to the no-plate case at an outlet pressure of 0.1 MPa, the maximum velocity, maximum TKE, maximum vapor volume fraction, and equivalent vapor volume decrease by approximately 26.6%, 64.9%, 72.8%, and 99.6%, respectively. The improvement results primarily from increased sleeve back pressure, staged pressure reduction across the plates, attenuation of the inter-plate jets, and progressive recovery of the mean static pressure. This assessment does not include mass flow rate, flow coefficient, or other engineering constraints and therefore should not be interpreted as a global optimum. Within the present steady-state metrics, the two-stage configuration substantially reduces the connectivity of the sustained low-pressure region and the overall vapor scale and provides design guidance for MSPRVs in nuclear feedwater systems.
- (5)The present results were obtained using steady RANS with the standard k–ω turbulence model and the Zwart–Gerber–Belamri cavitation model and therefore represent mean flow and mean vapor distributions. Periodic cavity growth, shedding, collapse, and transient pressure impacts are not resolved. Full-valve quantitative experimental validation was not performed, and uncertainties associated with the turbulence model, empirical cavitation-model coefficients, and spatial discretization were not systematically quantified. Only equal-radius two-stage combinations and a limited range of inter-plate spacings were considered, and the isothermal properties do not represent all high-temperature nuclear feedwater conditions. Future work will employ higher-order spatial and temporal discretization in URANS, DES, or LES simulations and will incorporate mixed-radius combinations, flow capacity, temperature effects, cavitation erosion, FSI, and experimental measurements into a multi-objective assessment.
Acknowledgement:
Funding Statement: This research was funded by the National Natural Science Foundation of China (grant number 52505052), the Fundamental Research Funds for the Central Universities (grant number buctrc202339), and the Open Foundation of the State Key Laboratory of Fluid Power and Mechatronic Systems (A6265121).
Author Contributions: Xiuyang Fan: Conceptualization; Formal analysis; Writing—original draft. Fuqiang Chen: Conceptualization; Formal analysis; Supervision; Writing—review & editing. Haicang Wang: Data curation; Formal analysis. Jingjing Liu: Data curation; Investigation. All authors reviewed and approved the final version of the manuscript.
Availability of Data and Materials: The data that support the findings of this study are available from the corresponding author upon reasonable request.
Ethics Approval: This study does not involve human participants, animal experiments, or ethically sensitive research content, and thus no ethical approval is required.
Conflicts of Interest: Given his role as Guest Editor and Editorial Board Member of this journal, Fuqiang Chen had no involvement in the peer review of this article and had no access to information regarding its peer review. Full responsibility for the editorial process for this article was delegated to another journal editor. The authors declare no other conflicts of interest.
References
1. Bhowmik PK , Shamim JA , Sabharwall P . A review on the sizing and selection of control valves for thermal hydraulics for reactor system applications. Prog Nucl Energy. 2023; 164: 104887. doi:10.1016/j.pnucene.2023.104887. [Google Scholar] [CrossRef]
2. Cană P , Ripeanu RG , Diniță A , Tănase M , Portoacă AI , Pătîrnac I . A review of safety valves: standards, design, and technological advances in industry. Processes. 2025; 13( 1): 105. doi:10.3390/pr13010105. [Google Scholar] [CrossRef]
3. Li Q , Zhang S , Wang M , Zong C , Li X , Song X . Numerical and experimental analysis of cavitation characteristics in safety valves of the nuclear power second circuit using a modified cavitation model. Eng Appl Comput Fluid Mech. 2023; 17( 1): 2251546. doi:10.1080/19942060.2023.2251546. [Google Scholar] [CrossRef]
4. Liu B , Wang M , Guo S , Zhang C , Zhao J , Qin N , et al. Investigation of cavitation-induced failure mechanisms in charging flow control valves for nuclear power plants. Eng Fail Anal. 2026; 186: 110529. doi:10.1016/j.engfailanal.2026.110529. [Google Scholar] [CrossRef]
5. Hős CJ , Champneys AR , Paul K , McNeely M . Dynamic behaviour of direct spring loaded pressure relief valves: III valves in liquid service. J Loss Prev Process Ind. 2016; 43: 1– 9. doi:10.1016/j.jlp.2016.03.030. [Google Scholar] [CrossRef]
6. Gao G , Guo S , Li D . A review of cavitation erosion on pumps and valves in nuclear power plants. Materials. 2024; 17( 5): 1007. doi:10.3390/ma17051007. [Google Scholar] [CrossRef]
7. Brennen CE . Cavitation and bubble dynamics. New York, NY, USA: Oxford University Press; 1995. doi:10.1093/oso/9780195094091.001.0001. [Google Scholar] [CrossRef]
8. Franc JP , Michel JM . Fundamentals of cavitation. Dordrecht, The Netherlands: Springer; 2005. doi:10.1007/1-4020-2233-6. [Google Scholar] [CrossRef]
9. Xu X , Wang Y , Fang L , Wang Z , Li Y . Numerical study on cavity-vortex evolution in cavitation flow in nuclear control valves with different openings and structural parameters. Ann Nucl Energy. 2025; 211: 110880. doi:10.1016/j.anucene.2024.110880. [Google Scholar] [CrossRef]
10. Geng L , Escaler X . Assessment of RANS turbulence models and Zwart cavitation model empirical coefficients for the simulation of unsteady cloud cavitation. Eng Appl Comput Fluid Mech. 2020; 14( 1): 151– 67. doi:10.1080/19942060.2019.1694996. [Google Scholar] [CrossRef]
11. Singhal AK , Athavale MM , Li H , Jiang Y . Mathematical basis and validation of the full cavitation model. J Fluids Eng. 2002; 124( 3): 617– 24. doi:10.1115/1.1486223. [Google Scholar] [CrossRef]
12. Kunz RF , Boger DA , Stinebring DR , Chyczewski TS , Lindau JW , Gibeling HJ , et al. A preconditioned Navier–Stokes method for two-phase flows with application to cavitation prediction. Comput Fluids. 2000; 29( 8): 849– 75. doi:10.1016/S0045-7930(99)00039-0. [Google Scholar] [CrossRef]
13. Schnerr GH , Sauer J . Physical and numerical modeling of unsteady cavitation dynamics. In: Proceedings of the 4th International Conference on Multiphase Flow; 2001 May 27–Jun 1; New Orleans, LA, USA. [Google Scholar]
14. Zwart PJ , Gerber AG , Belamri T . A two-phase flow model for predicting cavitation dynamics. In: Proceedings of the 5th International Conference on Multiphase Flow (ICMF 2004); 2004 May 30–Jun 4; Yokohama, Japan. [Google Scholar]
15. Wilcox DC . Reassessment of the scale-determining equation for advanced turbulence models. AIAA J. 1988; 26( 11): 1299– 310. doi:10.2514/3.10041. [Google Scholar] [CrossRef]
16. Coutier-Delgosha O , Fortes-Patella R , Reboud JL . Evaluation of the turbulence model influence on the numerical simulations of unsteady cavitation. J Fluids Eng. 2003; 125( 1): 38– 45. doi:10.1115/1.1524584. [Google Scholar] [CrossRef]
17. Gnanaskandan A , Mahesh K . Large Eddy Simulation of the transition from sheet to cloud cavitation over a wedge. Int J Multiph Flow. 2016; 83: 86– 102. doi:10.1016/j.ijmultiphaseflow.2016.03.015. [Google Scholar] [CrossRef]
18. Spalart PR , Deck S , Shur ML , Squires KD , Strelets MK , Travin A . A new version of detached-eddy simulation, resistant to ambiguous grid densities. Theor Comput Fluid Dyn. 2006; 20( 3): 181– 95. doi:10.1007/s00162-006-0015-0. [Google Scholar] [CrossRef]
19. Viitanen V , Peltonen P , Nuutinen M , Hallander J , Siikonen T . Turbulent hydrofoil cavitation simulations: applications of RANS with eddy viscosity and interfacial turbulence damping and LES. J Mar Sci Eng. 2025; 13( 12): 2311. doi:10.3390/jmse13122311. [Google Scholar] [CrossRef]
20. Mali CR , Patwardhan AW , Pandey GK , Banerjee I , Vinod V . CFD study on the effect of various geometrical parameters of honeycomb type orifices on pressure drop and cavitation characteristics. Nucl Eng Des. 2020; 370: 110880. doi:10.1016/j.nucengdes.2020.110880. [Google Scholar] [CrossRef]
21. Li S , Deng G , Hu Y , Yu M , Ma T . Structural optimization of multistage depressurization sleeve of axial flow control valve based on Stacking integrated learning. Sci Rep. 2024; 14( 1): 7459. doi:10.1038/s41598-024-58178-5. [Google Scholar] [CrossRef]
22. Chang J , Ding Y , Xu H , Le X , Mao J , Xu Y , et al. Cavitation suppression in steam generator blowdown valves: multilayer cage design and synergistic pressure-reduction optimization. Flow Meas Instrum. 2026; 110: 103283. doi:10.1016/j.flowmeasinst.2026.103283. [Google Scholar] [CrossRef]
23. Liao BQ , He QZ , Wang J , Peng T , Chen XF , Li KH . Numerical simulation and structural improvement of cavitation characteristics of water droplet labyrinth control valve. Fluid Mach. 2021; 49( 2): 30– 89. (In Chinese). doi:10.3969/j.issn.1005-0329.2021.02.005. [Google Scholar] [CrossRef]
24. Sui F , Xu DT , Peng SD , Lu QF , Wang CL , Meng XR . Response surface structural optimization for regulating valve to suppress flow-field cavitation. Chin Hydraul Pneum. 2024; 48( 4): 133– 41. (In Chinese). doi:10.11832/j.issn.1000-4858.2024.04.018. [Google Scholar] [CrossRef]
25. Wu JY , Yue Y , Li JY , Jin ZJ , Qian JY . Circumferential design of throttling window of main feed water regulating valve and its influence on flow characteristics. Chin J Eng Des. 2022; 29( 1): 74– 81. (In Chinese). doi:10.3785/j.issn.1006-754X.2022.00.006. [Google Scholar] [CrossRef]
26. Celik IB , Ghia U , Roache PJ , Freitas CJ , Coleman H , Raad PE . Procedure for estimation and reporting of uncertainty due to discretization in CFD applications. J Fluids Eng. 2008; 130( 7): 780011. doi:10.1115/1.2960953. [Google Scholar] [CrossRef]
27. Romani S , Morgut M , Parussini L , Piller M . Uncertainty quantification and global sensitivity analysis of turbulence model closure coefficients for sheet cavity flow around a hydrofoil. Brodogradnja. 2025; 76( 1): 1– 16. doi:10.21278/brod76105. [Google Scholar] [CrossRef]
28. Medvitz RB , Kunz RF , Boger DA , Lindau JW , Yocum AM , Pauley LL . Performance analysis of cavitating flow in centrifugal pumps using multiphase CFD. J Fluids Eng. 2002; 124( 2): 377– 83. doi:10.1115/1.1457453. [Google Scholar] [CrossRef]
29. La Rosa DM , Rossi MMA , Ferrarese G , Malavasi S . On the pressure losses through multistage perforated plates. J Fluids Eng. 2021; 143( 6): 061205. doi:10.1115/1.4049937. [Google Scholar] [CrossRef]
30. Jin H , Zhang J , Liu X , Wang C . Study on flow-induced noise characteristics of multistage depressurization valve in the nuclear power plant. Nucl Eng Des. 2023; 407: 112282. doi:10.1016/j.nucengdes.2023.112282. [Google Scholar] [CrossRef]
31. Zong C , Li Q , Zheng F , Chen D , Li X , Song X . Fluid-structure coupling analysis of a pressure vessel-pipe-safety valve system with experimental and numerical methods. Int J Press Vessels Pip. 2022; 199: 104707. doi:10.1016/j.ijpvp.2022.104707. [Google Scholar] [CrossRef]
32. Zhao JJ , Meng LH , Zhang HT , Yu M , Lin Z , Zhang G . A review of prediction methods of cavitation erosion. Phys Fluids. 2025; 37( 11): 111301. doi:10.1063/5.0301878. [Google Scholar] [CrossRef]
33. Falsafi S , Blume M , Klaua T , Indrich M , Wloka J , Skoda R . Numerical simulation of cavitating flow in maritime high-pressure direct fuel injection nozzles and assessment of cavitation-erosion damage. Int J Engine Res. 2023; 24( 2): 393– 407. doi:10.1177/14680874211052138. [Google Scholar] [CrossRef]
34. Le AD , Phan Thanh H , Tran The H . Assessment of a homogeneous model for simulating a cavitating flow in water under a wide range of temperatures. J Fluids Eng. 2021; 143( 10): 101204. doi:10.1115/1.4051078. [Google Scholar] [CrossRef]
35. Dinh Le A . Study of thermodynamic effect on the mechanism of flashing flow under pressurized hot water by a homogeneous model. J Fluids Eng. 2022; 144: 011206. doi:10.1115/1.4051972. [Google Scholar] [CrossRef]
36. Qian JY , Hou CW , Mu J , Gao ZX , Jin ZJ . Valve core shapes analysis on flux through control valves in nuclear power plants. Nucl Eng Technol. 2020; 52( 10): 2173– 82. doi:10.1016/j.net.2020.03.008. [Google Scholar] [CrossRef]
Cite This Article
 Copyright © 2026 The Author(s). Published by Tech Science Press.
This work is licensed under a Creative Commons Attribution 4.0 International License , which permits unrestricted use, distribution, and reproduction in any medium, provided the original work is properly cited.
 Downloads
 Citation Tools
