
 Submit a Paper
 Propose a Special lssue
 Open Access
ARTICLE
Numerical Investigations on Effects of Physical Parameters on Single Bubble Generation from Capillary Needles in Newtonian Liquids
School of Mechanical Engineering and Rail Transit, Changzhou University, Changzhou, 213164, China
* Corresponding Author: Mingjun Pang. Email:
Frontiers in Heat and Mass Transfer 2023, 21, 337-366. https://doi.org/10.32604/fhmt.2023.044286
Received 26 July 2023; Accepted 18 September 2023; Issue published 30 November 2023
 View Full Text
 Download PDF
Abstract
The interphase mass, heat transfer efficiency, and flow resistance are strongly dependent on bubble size in gasliquid two-phase systems, so it is very important for engineering applications to effectively control bubble size. In this paper, the formation, growth, and detachment of single bubbles in Newtonian liquids based on capillary needles were studied in detail using a volume of fluid method. The authors investigated the effects of gas injection velocity, gravitational level, surface tension coefficient, needle radius, and liquid−phase properties (liquid viscosity and density) on the process of bubble generation, and the effects of the above factors on bubble shape, detachment diameter, and time were analyzed. The results show that an increase in gas injection rate, liquid-phase viscosity, needle radius, and surface tension coefficient can lead to an increase in bubble detachment diameter; however, an increase in liquid-phase density and gravitational level can lead to a decrease in bubble detachment diameter. It is found that the effect of the liquid−phase viscosity on bubble detachment diameter and time is slight, but the effect of gravitational level on detachment diameter and time is significant. Among all the forces, buoyancy, surface tension, and pressure are the most important ones that control the generation of bubbles.Keywords
Nomenclature
| A | Gravity level |
| C | Drag coefficient |
| D | Bubble detachment diameter |
| f | Phase function |
| F | Force |
| g | Acceleration of gravity |
| ks | Curvature of bubble interface |
| The unit normal vector | |
| Q | Gas flow |
| R | Radius of bubbles |
| r | Needle radius |
| Re | Reynolds number |
| t* | Normalized time |
| t | Bubble detachment time |
| u | Velocity vector |
| v | Gas injection velocity |
| V | Instantaneous volume of bubbles |
| Y | Axial centroid position of bubbles |
| ∇ | Hamiltonian operator |
| Greek Symbols | |
| δ | Dirac distribution function |
| μ | Viscosity |
| ρ | Density |
| σ | Surface tension coefficient |
| Subscripts | |
| AM | Added mass force |
| b | Bubble |
| B | Buoyancy force |
| CM | Centroid position |
| D | Viscous drag |
| det | Detachment time or diameter |
| g | Gas phase |
| l | Liquid phase |
| M | Gas momentum force |
| o | Orifice diameter |
| P | Pressure |
| S | Surface tension |
Gas−liquid two−phase systems can be frequently seen in industrial and medical processes such as aeration, fermentation, metallurgy, water treatment, blood oxygenators, bubbling towers, fluidized beds, and jet reactors [1–3]. Bubble size determines the rising velocity and residence time of a bubble in liquid and its wake flow. These aspects can further affect the performance of two−phase systems, such as their heat and mass transfer efficiencies and mixing and drag behaviors. Therefore, it is very significant to investigate deeply various physical parameters affecting the generation of bubbles to understand the physical mechanism of multiphase flows concerning interfacial phenomena and improve the performance of gas−liquid two−phase systems. To fully understand the influence of various factors on the formation of bubbles in Newtonian fluids, many investigations have been carried out till now. Kulkarni et al. [4] carried out a detailed review of early studies. Wang et al. [5] reviewed the regulation of bubble size in flotation. Suja et al. [6] provided a comprehensive discussion of the various single bubble/drop platforms and the associated experimental measurement protocols. Gardner et al. [7] reviewed bubble formation in magma. Recent typical investigations on bubble generation are reviewed as follows.
First, a number of numerical studies on the formation and detachment characteristics of bubbles have been conducted. Martín et al. [8] performed numerical calculations of shapes and detachment times of bubbles generated from a sieve plate, and a mathematical model describing the formation, breakage, and rising of a gas bubble generated in a submerged orifice was proposed. Quan et al. [9] numerically investigated the pinch-off of a gas bubble from a tiny nozzle immersed vertically in another quiescent viscous fluid due to buoyancy. Chakraborty et al. [10] numerically analyzed the dynamic problem of bubble formation from a submerged orifice in an immiscible Newtonian liquid under the condition of constant gas inflow. Ma et al. [11] numerically investigated the single bubble formation and dynamics in bubble columns with the volume of fluid (VOF) model. di Bari et al. [12] numerically simulated the growth of adiabatic gas bubbles from a submerged orifice with the finite volume method. Albadawi et al. [13,14] numerically investigated bubble growth and detachment at low Capillary and Bond numbers using Volume of Fluid and Level Set methods. Georgoulas et al. [15] numerically investigated the effect of fluid properties and gravity levels on quasi-static bubble growth and detachment from submerged orifices in isothermal liquid pools using VOF. Simmons et al. [16] simulated the formation of a single bubble from an orifice in a solid surface submerged in an incompressible and viscous Newtonian liquid. Hecht et al. [17] numerically studied the influence of wettability on the formation of a single air bubble at a submerged orifice. Ali et al. [18] performed numerical modeling for the characterization of CO2 bubble formation through submerged orifice in ionic liquids. Oshaghi et al. [19] performed a numerical investigation of bubble formation and detachment in shear-thinning liquids at low capillary and Bond numbers. Boubendir et al. [20] numerically investigated the surface tension role in bubble growth and detachment in a micro-tube. Smith et al. [21] numerically studied the role of surface tension on the growth of bubbles by rectified diffusion.
Second, many experimental studies under different conditions have also been carried out. Burton et al. [22] used a 100,000 frame-per-second video to analyze the pinch-off of nitrogen gas bubbles in fluids with a wide range of viscosity. Duhar et al. [23] experimentally investigated the quasistatic injection of air bubbles at the wall in a viscous shear flow by high-speed video pictures and image processing. Taghi Esfidani et al. [24] presented both theoretical and experimental studies on the size of a growing bubble in power-law non-Newtonian liquids. Hanafizadeh et al. [25] investigated experimentally the effect of orifice shape on the mechanism of bubble formation in gas–liquid two–phase flow with three different orifice geometries with the same cross-sectional areas. Sun et al. [26] investigated experimentally the effects of liquid temperature, aerosol, and gas–phase composition on bubble formation characteristics. Mohseni et al. [27] experimentally investigated bubble generation based on micro-orifices and needles with very fine orifice diameters in the range from 37 to 225 μm. Muilwijk et al. [28] performed an experimental investigation on the bubble formation from needles with and without liquid co-flow. Sattari et al. [29] conducted an experimental investigation of bubble formation on submerged micrometer−sized nozzles in polymer solutions. Mohseni et al. [30] experimentally studied the mechanism of bubble formation and detachment at orifices smaller than 1 mm in diameter. Li et al. [31] numerically and experimentally investigated the production of bubbles in flotation equipment using the jet microbubble generator. Muilwijk et al. [32] experimentally studied the formation of bubbles in the presence and absence of liquid co−flow with dual−tip optical fiber probes. They also performed experimental investigations of asymmetric bubble column configurations using bubble image velocimetry and dual−tip optical fiber probes [33]. Reuter et al. [34] studied the dynamics leading to the needle jet formation with high-speed imaging at five million frames per second under femtosecond illumination. Garivalis et al. [35] experimentally investigated the nucleation and growth of single bubbles at a heated surface immersed in an electric field at the microgravity level. Sheng et al. [36] experimentally investigated the mechanism and modeling of Taylor bubble generation in highly viscous fluids in a T-junction via the vertical squeezing route. Rajesh et al. [37] experimentally studied the pinch−off of bubbles in polymer solutions of different concentrations, showing that the bubble neck is tightly related to liquid−phase viscosity. Tanaka et al. [38] used the direct observation technique of quartz glass to study the process of bubble formation in the molten pool during laser cladding. Shi et al. [39] carried out an experiment on the effect of gas injection rate on bubble generation characteristics during coal floatation. Sarkar et al. [40] experimentally studied the dynamics of bubble formation (such as bubble detachment diameter and time) at the tip of top−submerged nozzles immersed in a quiescent liquid. Qiu et al. [41] quantitatively investigated how electrolyte solutions impact bubble departure diameters due to their physical properties and the electrode surface exposed to the electrochemical reactions based on experimental observation.
Again, some researchers performed the theoretical prediction of bubble formation. A force balance model for calculating bubble detachment diameter during flow boiling is derived by Manthey et al. [42]. It was concluded that the magnitude of the inclination angle is not important for the calculation of bubble detachment diameter. In short, although some studies on bubble generation have been conducted, accurate prediction models and perfect mechanism explanations of bubble formation are further needed to investigate and develop. Presently, most of the conclusions are achieved under specific conditions, and some results are contradictory, as pointed out by Jamialahmadi et al. [43]. To deeply understand the physical phenomenon of bubble formation, this paper investigates in detail the effects of physical parameters such as liquid density and viscosity, gas injection rate, gravitational level, surface tension coefficient, and needle radius on bubble shape and detachment characteristics.
2 Physical Problems and Governing Equations
To save computational costs, the computational region is simplified to a two−dimensional axisymmetric model, as shown in Fig. 1, where a single bubble is generated from the top of a capillary needle with a radius of ro. To eliminate the influence of the wall effect on bubble generation and to ensure the full growth of bubbles in the vertical direction, the size of L and H are set to 10 ro and 20 ro. To simulate the generation of a single bubble, the following assumptions are presented: (1) the gas flow rate in a capillary needle is low, and all the gas is used to generate bubbles; (2) the generation of bubbles occurs under a quasi−static condition; (3) the compressibility of gas is ignored; (4) the generated bubble is spherical and can be seen as a circle in the two−dimensional axisymmetric model.
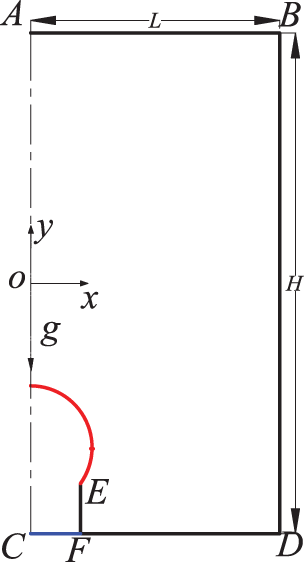
Figure 1: Geometric model
2.2 Design of Computational Cases
The present investigations show that bubble generation is mainly influenced by gas and liquid thermophysical parameters, gas injection velocity, and needle radius. Therefore, the effects of parameters such as liquid density (ρl), liquid viscosity (μl), surface tension coefficient (σ), gas injection velocity (vg), needle radius (ro), and gravitational level (a) are investigated here. To investigate the quantitative effects of the above parameters on bubble detachment characteristics (such as detachment time and volume), a set of data for these six parameters is selected (ρl = 1000 kg/m3, ρg = 1.225 kg/m3, σ = 0.065 N/m, μl = 0.001 Pa·s, μg = 1.7894 × 10⁻⁵ Pa·s, and a = 9.81 m/s2) as basic ones. Then, the other parameters remain constant, and changing one or two ones is to study their effects on bubble detachment characteristics. For example, the effect of liquid density (ρl = 500–2500 kg/m3) on bubble detachment characteristics is studied at ro = 0.1 and 1.0 mm at vg = 0.1 and 1.0 m/s, respectively. All computational conditions are shown in Table 1.

Presently, it is assumed that the flow is adiabatic and axisymmetric, the injection velocity of gas is uniform, and a two−phase flow is formed at the needle top. Both fluids are considered to be mutually impermeable and incompressible Newtonian ones. The continuity and momentum equations are presented by Eqs. (1) and (2).
where u is the velocity vector, m/s; p is the pressure, Pa; g is the acceleration of gravity, m/s2; ρ is the average density of the fluid, kg/m3; μ is the average viscosity of the fluid, Pa·s; t is the time, s; and ∇ is the Hamiltonian operator. FS is the volume force due to surface tension, N; and it is calculated by Eq. (3).
where σ is the surface tension coefficient, N/m; and δ is the Dirac distribution function. ks is the curvature of the bubble interface, and
The average density and viscosity of fluids are calculated by Eqs. (5) and (6).
In Eqs. (5) and (6), f denotes the phase function, which is defined by Eq. (7).
The VOF method is used to track the volume of fluids in each grid rather than the motion of fluid particles, and thus it has the advantages of simple implementation, low computational complexity, and high accuracy compared with other methods. For the VOF method, two kinds of fluids share a set of momentum equations, and the volume fraction of each fluid in each cell is tracked in the whole domain. The VOF method utilizes the volume ratio of fluids in each grid (i.e., f) to achieve the goal based on the fact that two or more fluids are not interpenetrating [11]. The transport equation of f is presented by Eq. (8).
Since f is not explicitly related to a specific front grid for the VOF method, an algorithm is needed to reconstruct the bubble interface. There are several methods to solve the volume functions of fluids, such as the donor−acceptor method, the flux line−segment model for advection and interface reconstruction method, the simple line interface calculation method, and the piecewise linear interface calculation method (PLIC) [44]. The PLIC method takes into account the transfer of fluids between adjacent interfaces in detail, and thus the reconstruction results are relatively accurate. Therefore, the PLIC method is applied to interface reconstruction here. For the PLIC method, the interface in each cell is approximated by a straight line defined by n · x + C = 0, where n and x are the outward unit vector normal to the interface and the position vector of a generic point on the line, respectively, and C is a constant [44].
For the present calculation, the velocity inlet is applied to the wall of CF, the no−slip wall is applied to the ones of EF, DF, and BD, the pressure outlet is applied to the wall of AB, and the line of AC is the symmetrical axis. Compared with the unstructured grid, the structured grid can be quickly generated, it is easy to fit the boundary of the calculation region, and it has the advantages of good grid quality, high calculation accuracy, and easy calculation convergence. Therefore, the structured grid is applied to the present computation. The coupling between pressure and velocity fields is achieved by the SIMPLE algorithm. The pressure and momentum terms are discretized using staggered pressure PRESTO and second−order windward schemes, respectively. Time steps are variable, the global Courant number is 0.25, and correspondingly the minimum time step is 10−5 s. Before the calculation starts, the initialization is performed so that the calculation domain is filled with stationary liquid, and the needle is filled with gas. Then, the two−phase flow calculation starts. The present computations are performed using ANSYS 18.0.
To analyze the process of bubble formation under different conditions, the normalized time t* is defined as follows:
where t and tdet are any point in time and the detachment time of bubbles during the formation process, respectively. Four dimensionless times of t* = 0.2, t* = 0.5 and 0.7, and t* = 1 are chosen to represent the early, middle, and late stages of bubble generation.
3.1.1 Validation on Results Independent of Grid Size
To check if the calculation results are independent of grid size, for the computational conditions of ro = 1 × 10⁻³ m, vg = 0.1 m/s, and the basic parameters, five grid systems are designed. They are Grid 1, Grid 2, Grid 3, Grid 4, and Grid 5, and the corresponding sizes are 0.1, 0.05, 0.033, 0.025, and 0.017 mm, respectively. The calculation results are shown in Fig. 2 and Table 2. It can be seen from Fig. 2 and Table 2 that the bubble interface becomes thinner and thinner, and the separation time of bubbles remains constant with a decrease in grid size. There is a deviation in the calculation results of Grids 1 and 2, while the results of Grids 3, 4, and 5 are basically the same. To reduce the calculation cost and obtain the accurate results, the maximum grid size is less than 0.033 mm for subsequent computations.
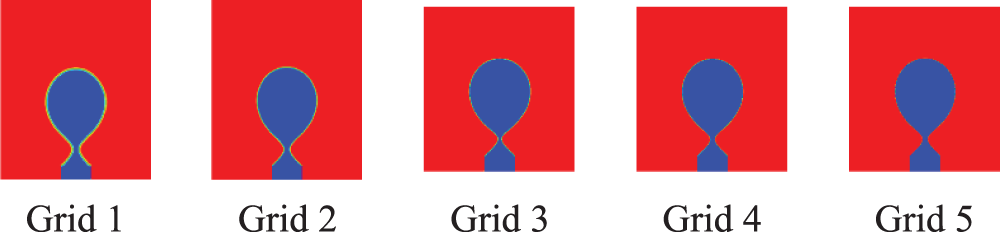
Figure 2: Bubble shapes at separation time for different grid sizes

3.1.2 Validation on Results Independent of Grid Size
To verify the accuracy of computational results, the experimental and numerical cases of Quan et al. [9] are selected as the validation ones. The definite parameters are ro = 1.35 × 10⁻³ m, ρl = 1000 kg/m3, ρg = 1.005 kg/m3, σ = 0.065 N/m, μl = 0.001 Pa·s, μg = 1.42 × 10⁻⁵ Pa·s, g = 9.81 m/s2, and vg = 0.005 m/s. The comparison of results is shown in Fig. 3. It can be seen from Fig. 3 that the present calculation result is basically consistent with that of reference [9]. Because the gas injection velocity is not specified in the reference, the numerical results are slightly different from those in the reference. This shows that the present computational method is credible.
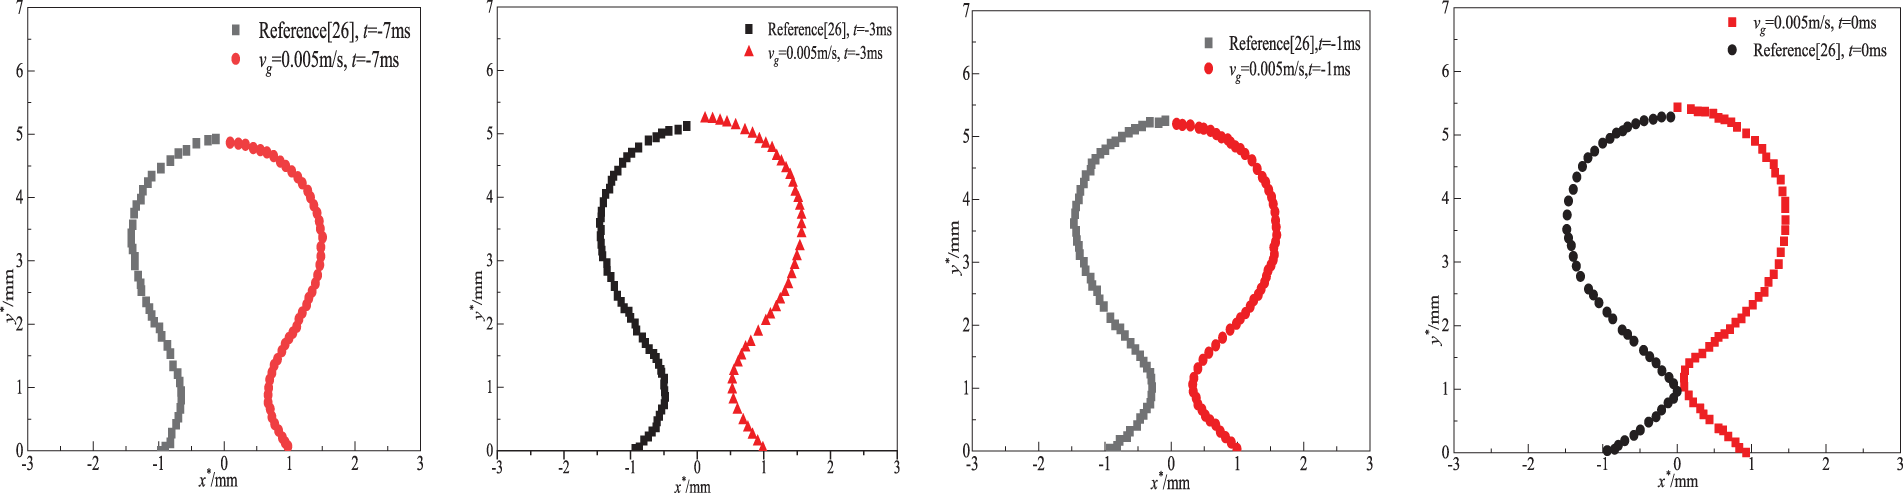
Figure 3: Bubble formation process (The left side is the results of reference [9])
3.2 Analysis of Bubble Generation Process Shape
Fig. 4 shows the formation process of a bubble for ro = 1 × 10⁻³ m, vg = 0.1 m/s, and the basic parameters. In Fig. 4, the red region represents the liquid phase, and the blue region represents the gas phase. It can be seen that the bubble volume increases rapidly with time. At the middle stage of bubble generation (i.e., t* = 0.5–0.7), the bubble is axially elongated due to buoyancy force and pressure. At the late stage of bubble generation (t* = 1), a neck appears at the bubble bottom. The diameter of the bubble neck decreases rapidly, leading to the separation of the bubble. The results of other cases will be compared with the present one to illustrate the influence of each factor on the bubble generation process.
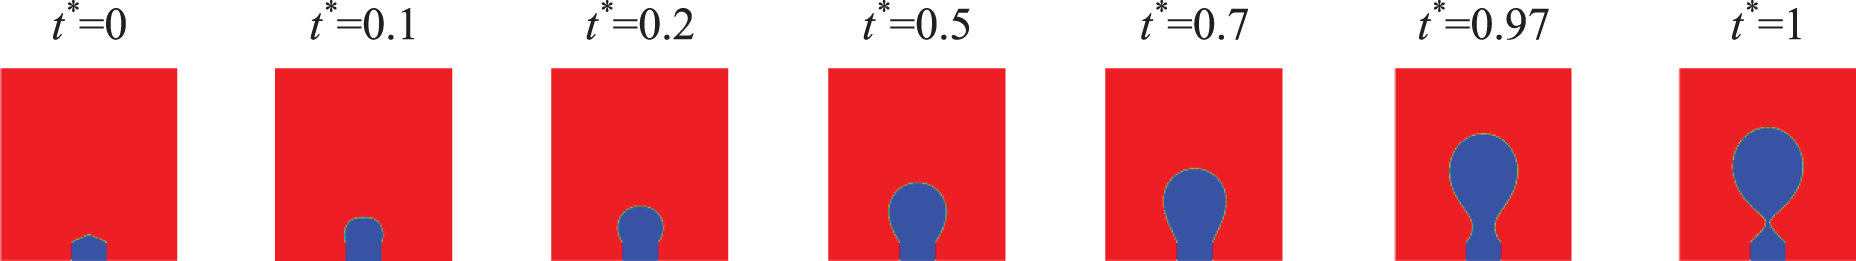
Figure 4: Variation of bubble shape with time for ro = 1 × 10⁻³ m, vg = 0.1 m/s and the basic parameters
Fig. 5 shows the effect of vg on bubble shape during the formation process for ro = 1 × 10⁻³ m and the basic parameters. It can be seen from Fig. 5 that with an increase in vg, the bubble shape deviates from the spherical one. The present phenomenon is consistent with that of reference [10]. This indicates that the assumption of spherical bubbles is not always correct. In addition, the bubble volume increases rapidly as vg increases at the same dimensionless time. The present results are similar to those of reference [4]. In the early stage of bubble generation (t* = 0.2), with an increase in vg, the lateral size of bubbles increases and exceeds the needle diameter. In the middle stage of bubble generation (t* = 0.5–0.7), with an increase in vg, the bubble bottom gradually becomes fan−shaped, the bubble top deviates from the hemisphere first and then it gradually returns to the hemisphere again, and the bubble gradually rises upwards. The larger the vg is, the greater the degree of bubble axial stretching is. At the later stage of bubble generation (t* = 1), the bubble neck appears, and it is obvious that the greater vg is, the greater the axial height of bubbles is.
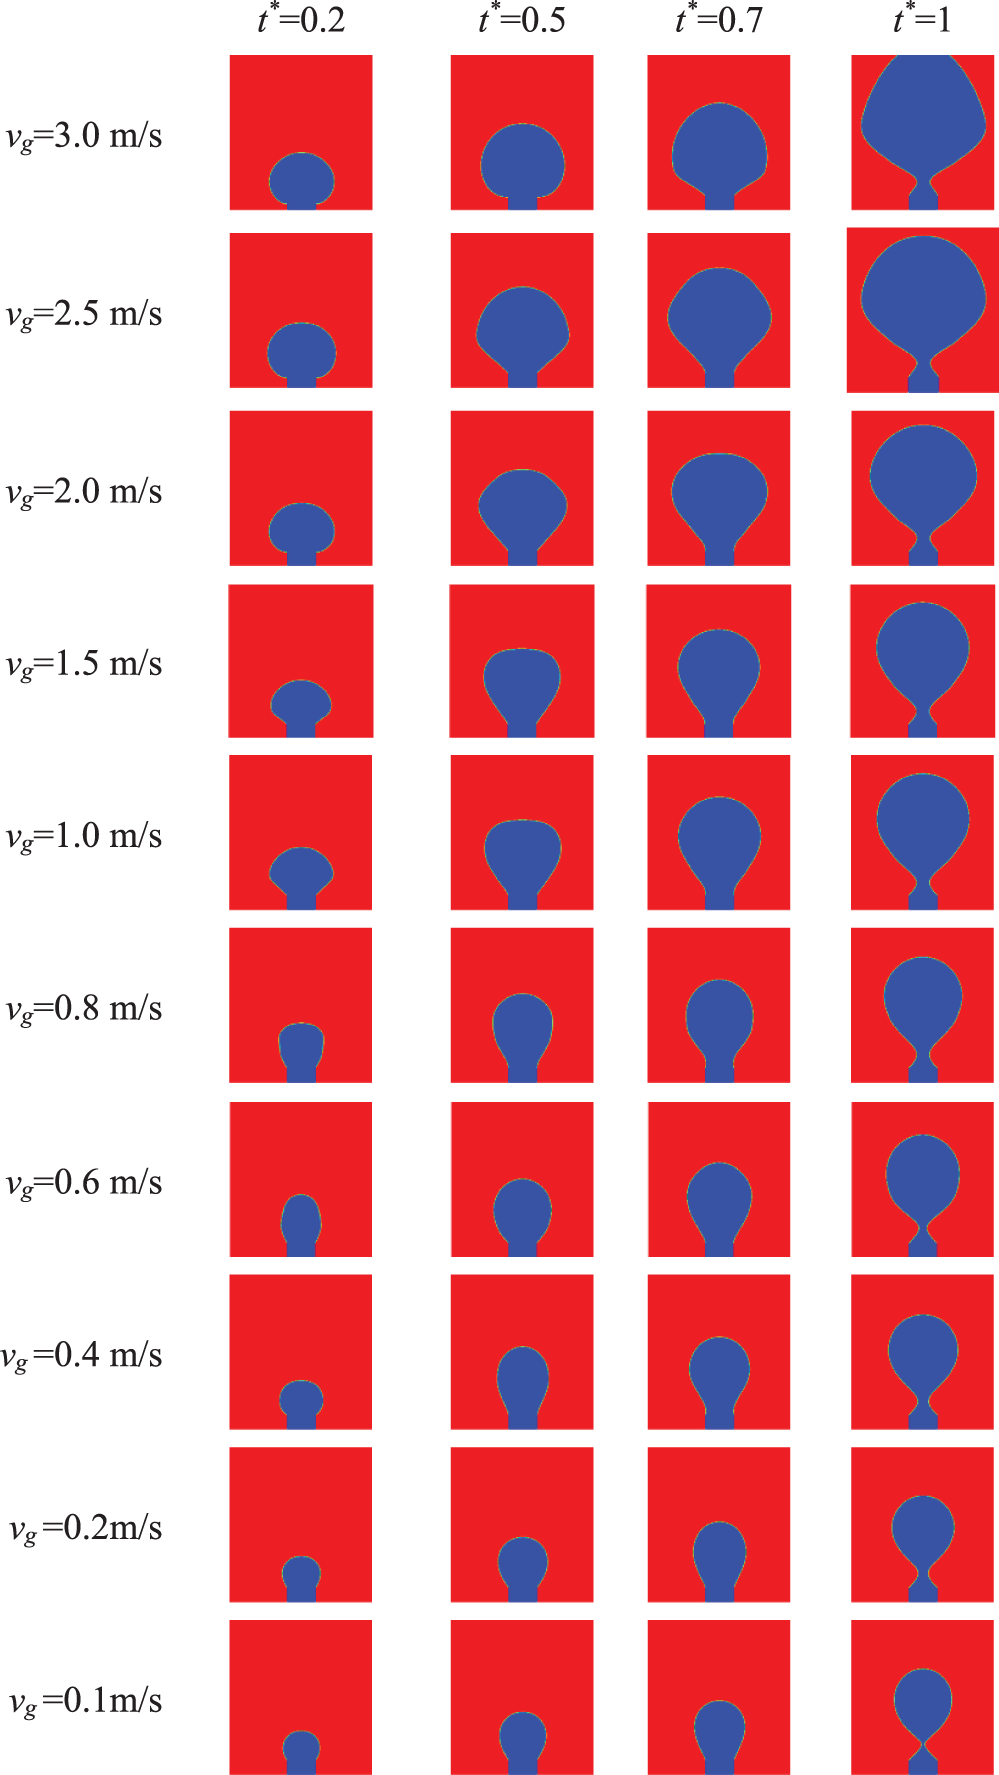
Figure 5: Variation of bubble shape with time for different vg (ro = 1 × 10⁻³ m and the basic parameters)
Fig. 6 shows the effect of a on bubble shape during the formation process for ro = 1 × 10⁻³ m, vg = 0.1 m/s, and the basic parameters. It can be seen from Fig. 6 that as a increases, bubble volume decreases at the same dimensionless time. This means that the greater a is, the shorter the time required for bubble detachment. Therefore, the bubble volume is smaller when other physical parameters are the same. It is obvious that the magnitude of a has an important effect on bubble generation, as pointed out by Georgoulas et al. [15].
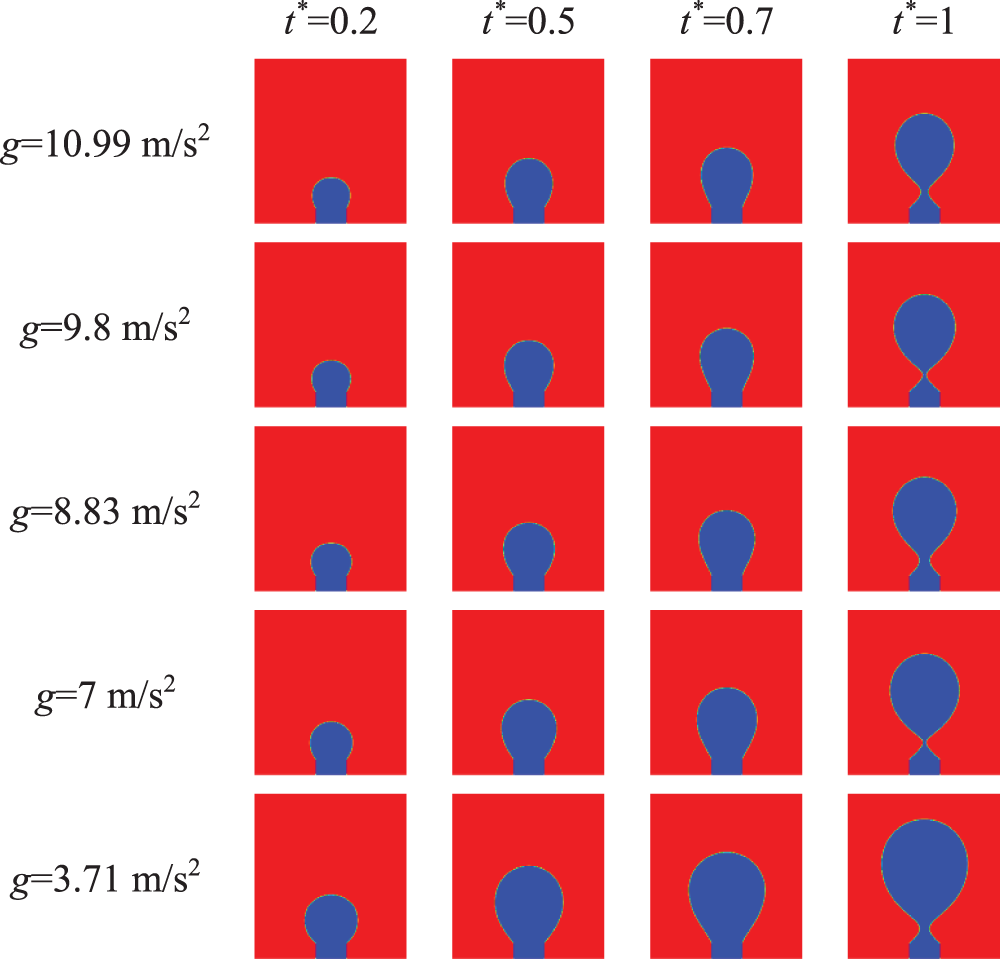
Figure 6: Variation of bubble shape with time under different a (ro = 1 × 10⁻³ m, vg = 0.1 m/s and the basic parameters)
3.2.3 Surface Tension Coefficient
Fig. 7 shows the effect of σ on bubble shape during the formation process for ro = 1 × 10⁻³ m, vg = 0.1 m/s, and the basic parameters. It can be seen from Fig. 7 that the smaller σ is, the greater the deformation of the bubble interface is, and the smaller the bubble volume at the same time is. This is because the force of the bubble attachment to the needle increases as σ (i.e., the surface tension) increases. Bubble detachment becomes difficult. Therefore, as σ increases, the bubble needs a larger volume to generate great buoyancy to promote it to detach from the needle.
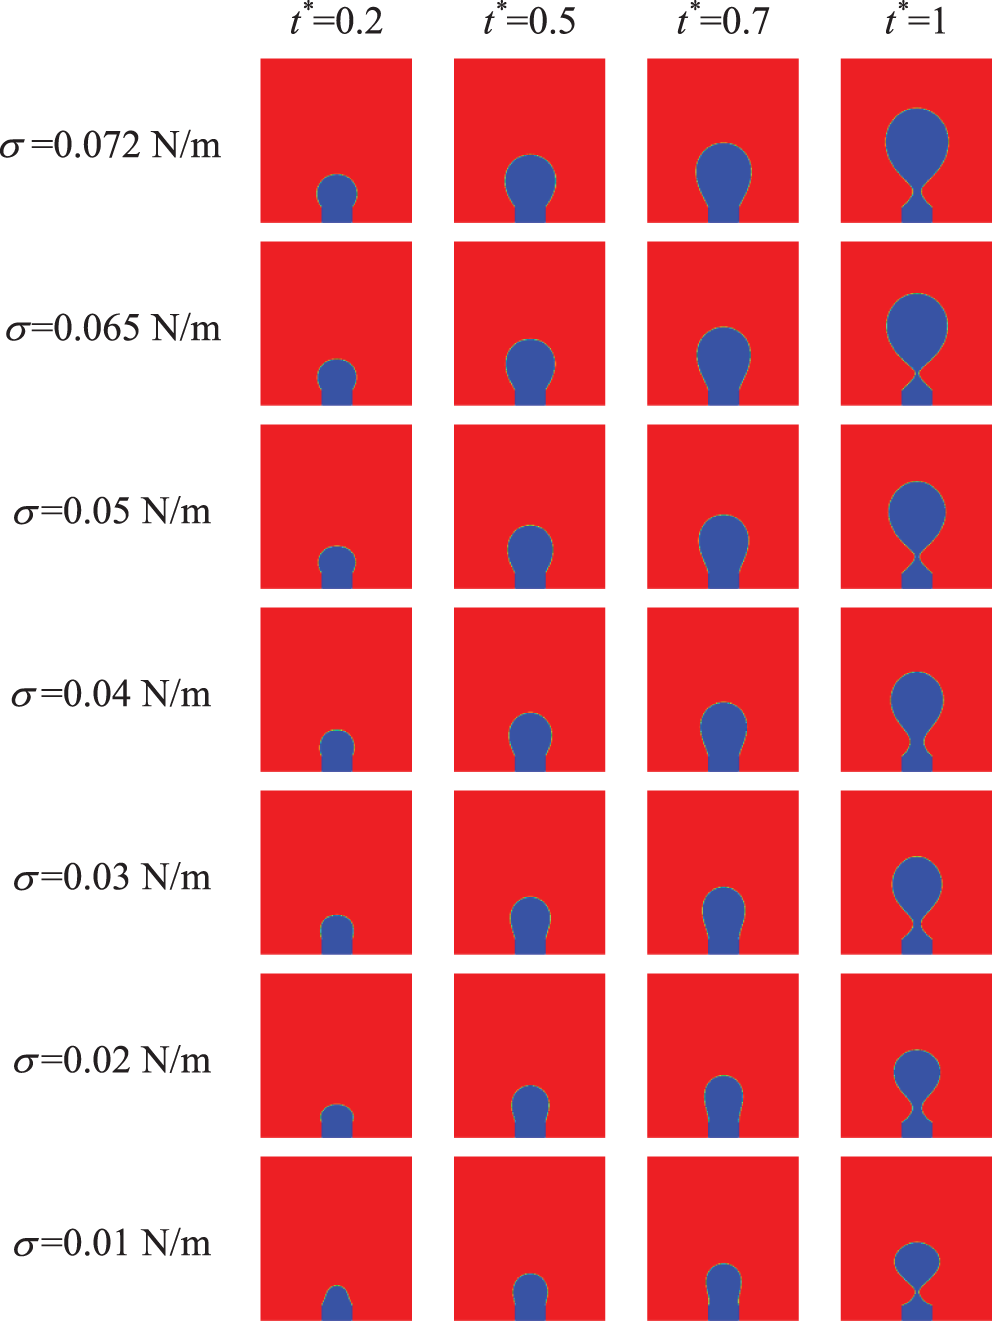
Figure 7: Variation of bubble shape with time for different σ (ro = 1 × 10⁻³ m, vg = 0.1 m/s and the basic parameters)
Fig. 8 shows the effect of μl on bubble shape during the formation process for ro = 1 × 10⁻³ m, vg = 0.1 m/s, and the basic parameters. As shown in Fig. 8, in the low viscosity range (0.001−0.01 Pa·s), the bubble volume at different moments is almost the same, and the bubble size is almost independent of μl. However, in the higher viscosity range (0.08−0.5 Pa·s), the bubble volume at different moments increases with an increase in μl. When μl is great, the bubble is subjected to a great viscous drag. The buoyancy force must be great enough to cause the bubble to detach from the needle. Therefore, the bubble volume becomes large in highly viscous liquids.
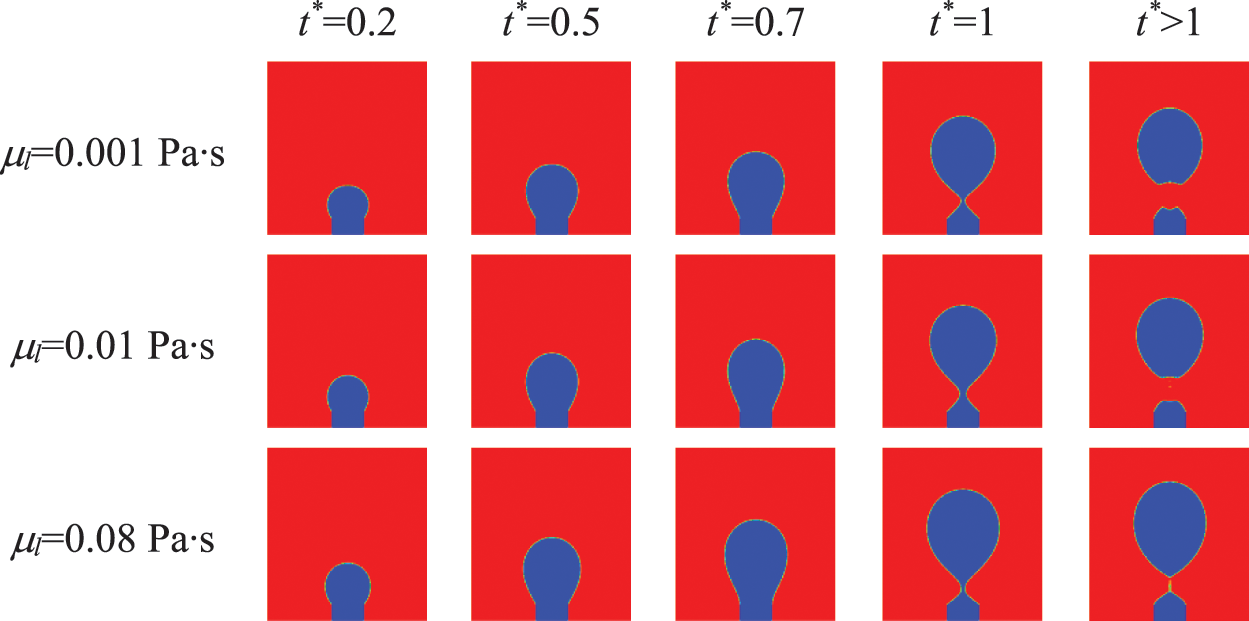
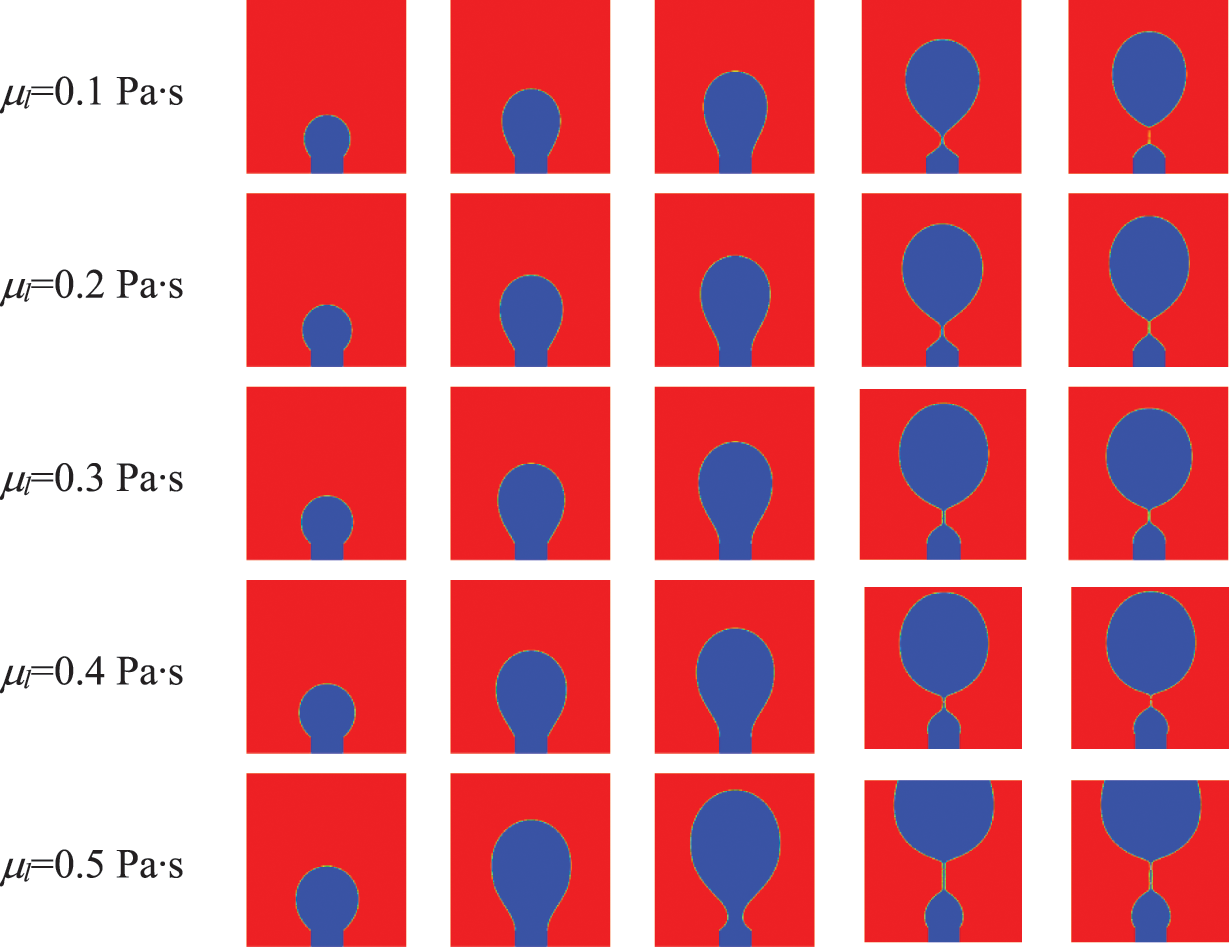
Figure 8: Variation of bubble shape with time for different μl (ro = 1 × 10⁻³ m, vg = 0.1 m/s and the basic parameters)
Burton et al. [22] classified the shape of bubble necks during the separation process into three types according to the magnitude of μl: (1) μl > 0.1 Pa·s, the bubble neck is cylindrical in shape with a constant parabolic axial curvature, and its profile is not self−similar. The neck diameter shrinks continuously until the bubble separates into two pieces with sharp ends. The results for μl = 0.2, 0.3, 0.4, and 0.5 Pa·s belong to this type. (2) At 0.01 < μl ≤ 0.1 Pa·s, the neck radius no longer decreases linearly with time, and the axial curvature of the neck parabola is no longer a constant. The thin line formed by the parabolic stretching continues for a very long time and breaks suddenly into dozens of small satellite bubbles. The results for μl = 0.08 and 0.1 Pa·s belong to this type. (3) At μl ≤ 0.01 Pa·s, the bubble neck becomes hyperbolic instead of parabolic in shape. The neck radius does not smoothly decrease to zero or a finite constant, and it suddenly breaks at the neck radius of 25 μm. The results for μl = 0.001 and 0.01 Pa·s belong to this type.
The effect of ρl on bubble shape during the formation process for ro = 1 × 10⁻³ m, vg = 0.1 m/s, and the basic parameters is shown in Fig. 9. It can be seen from Fig. 9 that a decrease in ρl also leads to an increase in the bubble volume at the same time. Namely, it leads to an increase in bubble separation volume. A decrease in ρl can lead to a decrease in the density difference between two phases. Therefore, a bubble must reach a large volume so that buoyancy becomes large enough to separate it from the needle rim, as reported in reference [15].
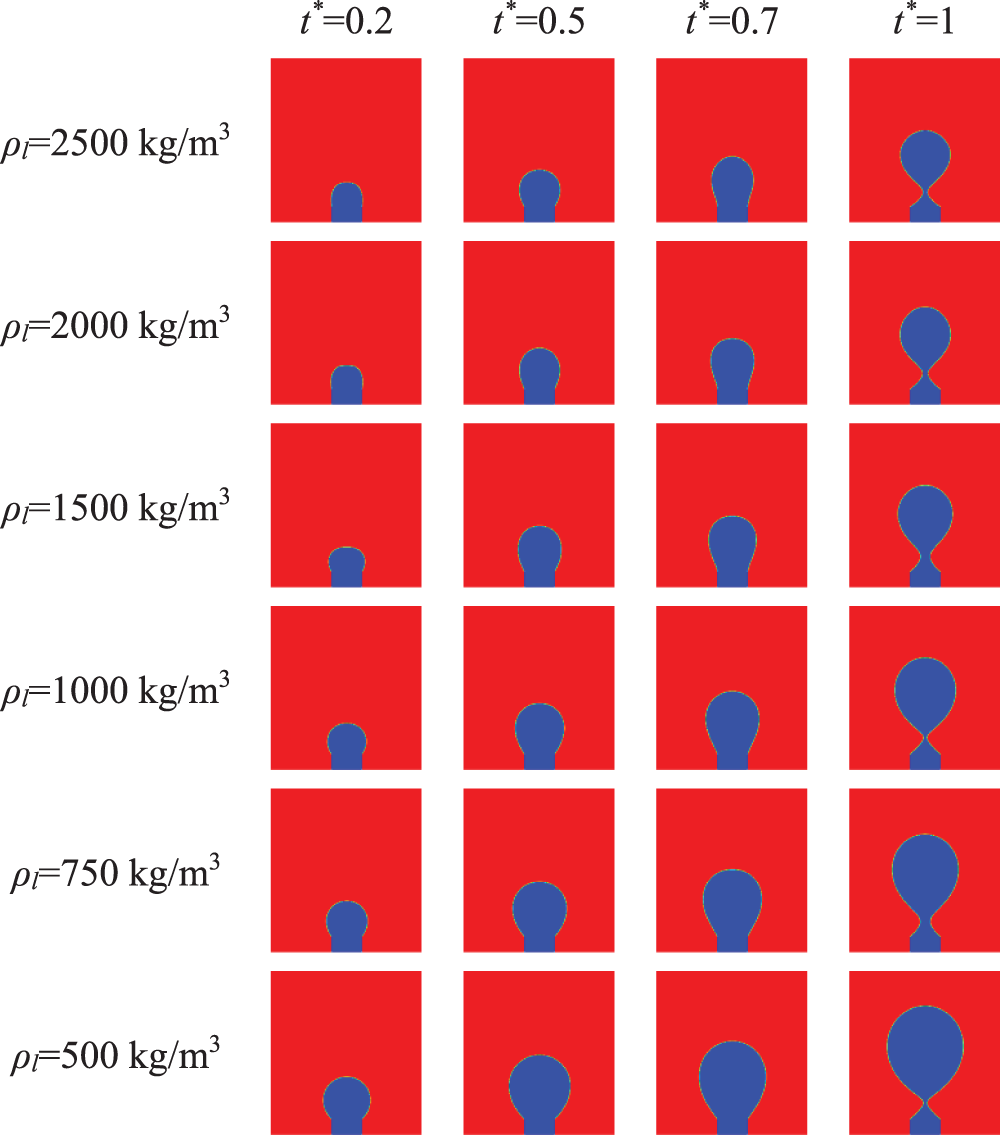
Figure 9: Variation of bubble shape with time for different ρl (ro = 1 × 10⁻³ m, vg = 0.1 m/s and the basic parameters)
Fig. 10 shows the effect of ro on bubble shape during the formation process for vg = 0.1 m/s and the basic parameters. It can be seen from Fig. 10 that the shape of bubbles from a small needle is closer to the spherical one. With an increase in ro, the bubble volume becomes large at the same time. During the early stage, the buoyancy force is very small. There is an approximate balance between surface tension and pressure force. The gas moment force is tiny during the whole process of bubble formation. At this time, the viscous drag and the added mass force are relatively important, so the bubble remains attached to the orifice until it has grown to a great size when the buoyancy force becomes very important, and the bubble is driven away from the orifice in the vertical direction. An increase in bubble growth time allows much more gas to flow into the bubble, thereby causing an increase in bubble size. Therefore, the needle with a large ro can generate a large bubble, as pointed out by reference [45].
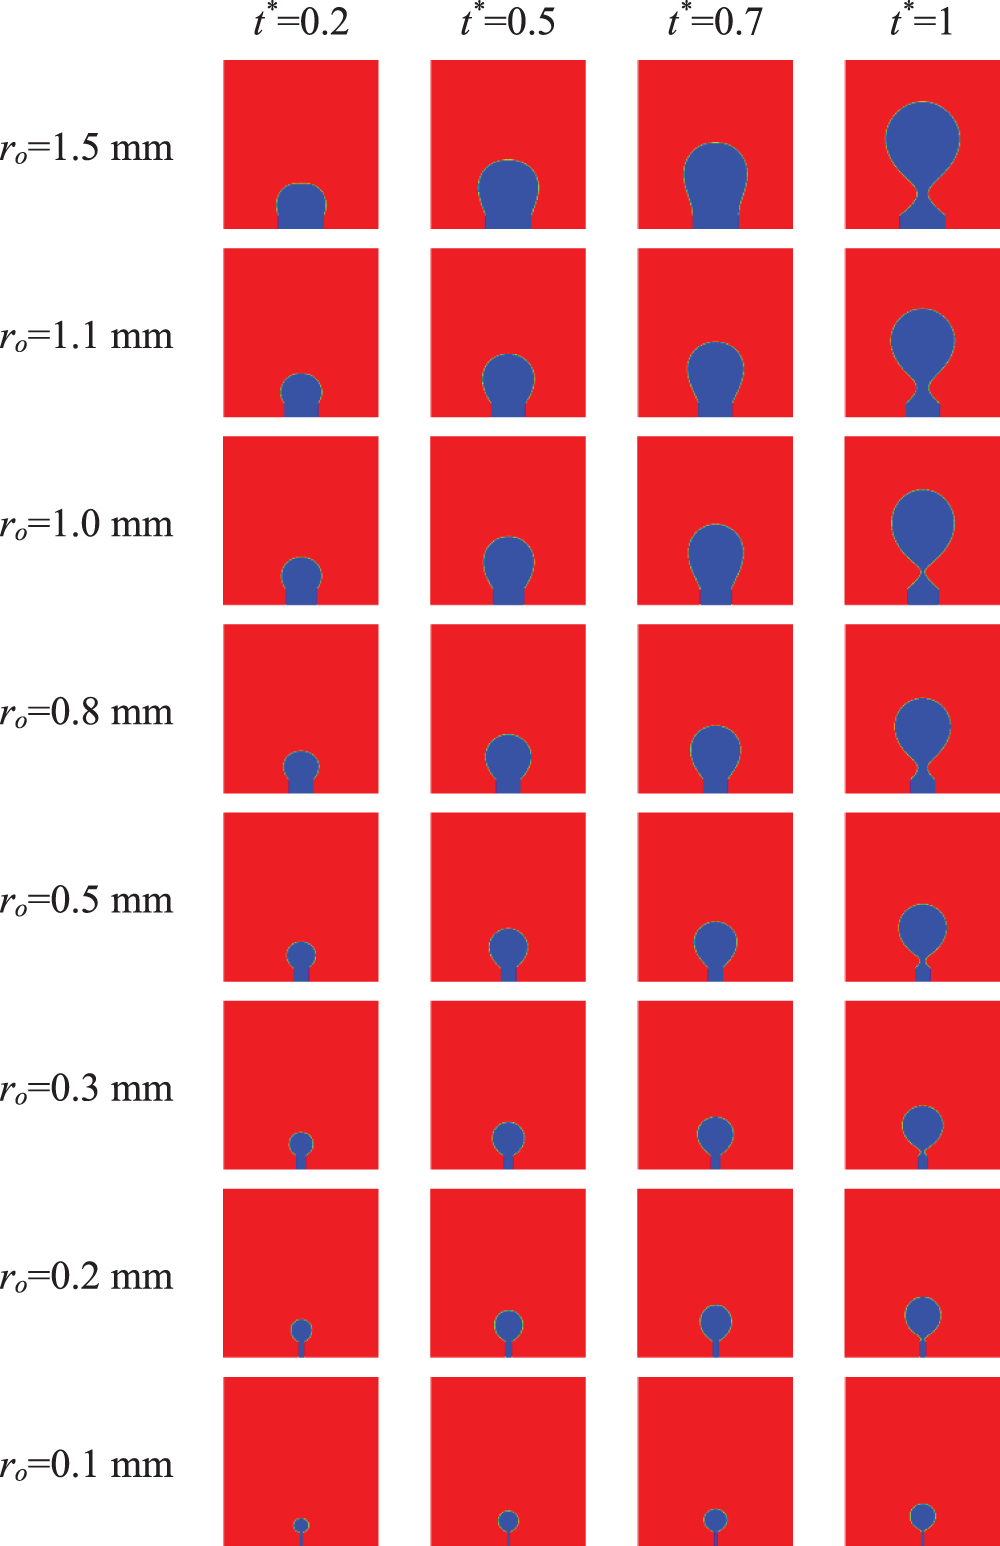
Figure 10: Variation of bubble shape with time for different ro (vg = 0.1 m/s and the basic parameters)
3.3 Analyses of Bubble Detachment Diameter and Time
It is very helpful for quantitatively understanding the influence of each factor on bubble generation to analyze bubble detachment diameter and time. The effects of vg, ro, a, σ, μl, and ρl on bubble detachment diameter and time are analyzed below in detail. Bubble detachment time (tdet) is defined as the time required from the start of gas entering into the needle to the formation and detachment of the first bubble from a needle. When vg is a constant, the gas injection rate can be written as Qg = πro2·vg according to reference [46]. It is assumed that a bubble is spherical, and the bubble detachment volume is approximately equal to Vdet = tdet·Qg. Therefore, the bubble detachment diameter is approximated as Ddet = 2 (3Vdet/4π)1/3.
3.3.1 Air Inlet Velocity and Needle Radius
As shown in Figs. 5 and 10, vg and ro have a significant effect on the bubble generation process. Fig. 11 shows the effect of vg and ro on Ddet and tdet. It can be seen from Fig. 11 that Ddet increases with an increase in vg and ro. For a constant vg, Ddet increases with an increase in ro. For a small vg, Ddet does not increase much with an increase in ro; however, for a great vg, Ddet increases greatly with an increase in ro. It is obvious that the increase of Ddet with an increase in ro is not the same for different vg. In the case of a constant ro, Ddet is small for a small ro, the increase of Ddet with an increase in vg is not obvious; however, the reverse applies for a great ro. It can be seen that the effects of vg and ro on Ddet are very complex.
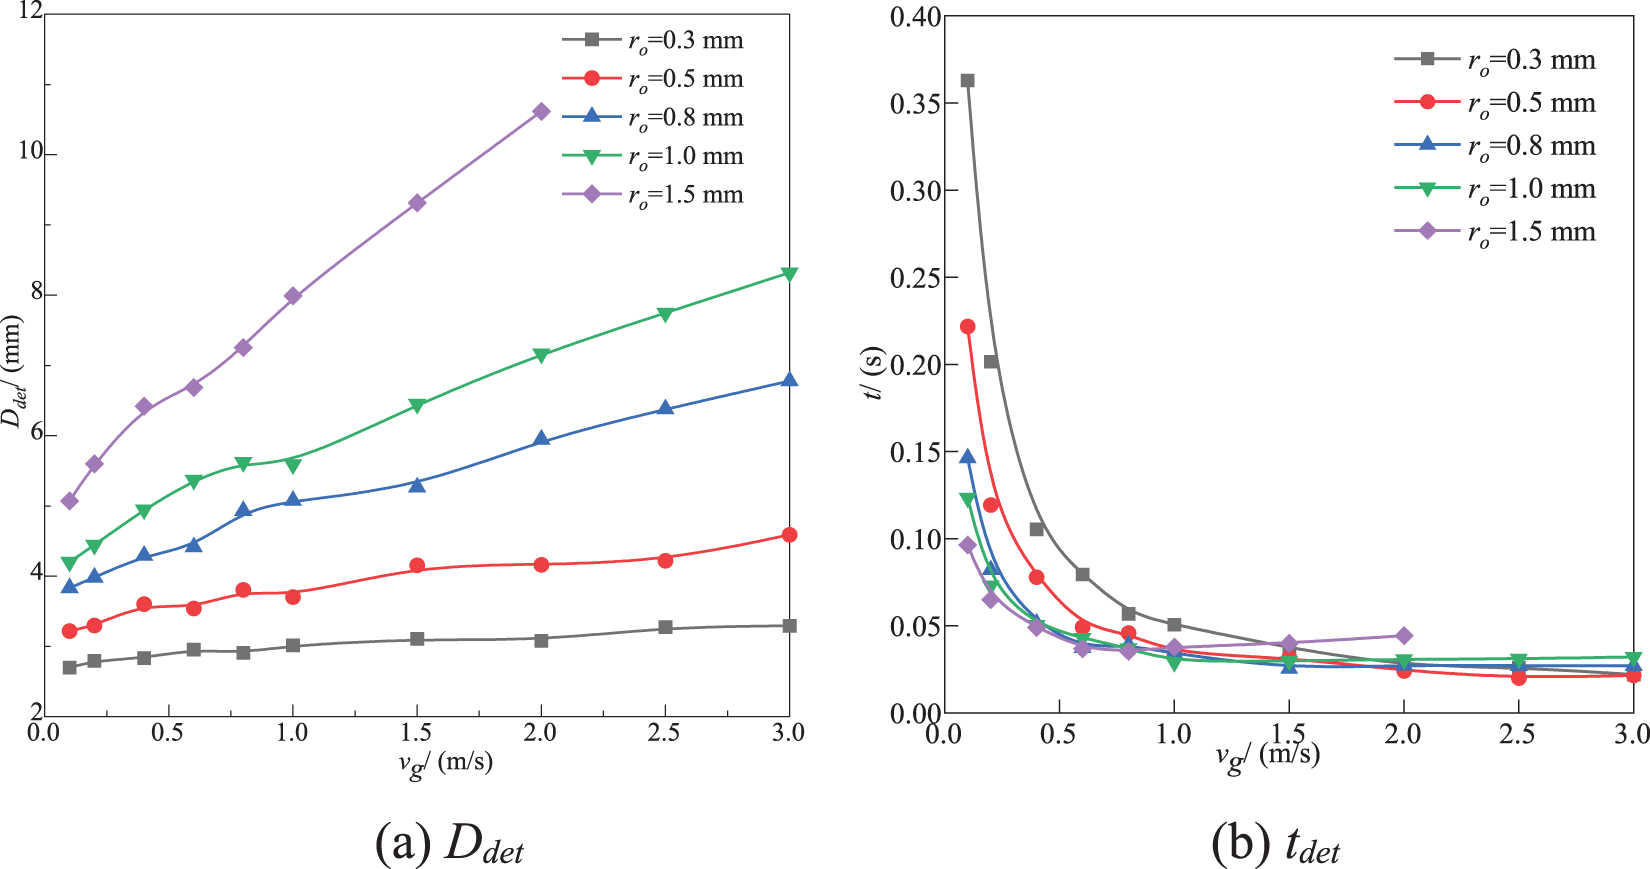
Figure 11: Variation of Ddet and tdet with vg for different ro
In fact, an increase in vg and ro leads to an increase in the flow rate of gas at the inlet. This means that the volume of gas entering the bubble increases at the same time, and thus Ddet increases. This is similar to the results of reference [43], but it is slightly different from the results of Oguz et al. [47]. Oguz et al. [47] pointed out that when the flow rate of gas injection is less than a threshold value, the effect of gas momentum is much smaller than that of surface tension and viscous forces, and the buoyancy force is mainly balanced by surface tension and viscous forces. Thus, Ddet is independent of the gas flow rate. However, for the present study, when ro (such as 0.3 mm) is small, and vg is less than the critical value (according to Qcr = π (16/3g2)1/6 (σro/ρl)5/6 [47], vg, cr = 2.6 m/s), Ddet is almost not affected by vg. When ro (such as 1 mm) is large, and vg is less than the critical value (vg, cr = 0.6 m/s), Ddet increases slightly with an increase in vg. When vg is greater than the critical value, Ddet increases significantly with an increase in vg. This is because Ddet is strongly dependent on ro, in addition to vg.
In addition, when ro is a constant, the larger vg is, the faster bubble generation velosity is, and the shorter tdet is. When vg is a constant, at a low vg, the larger ro is, the shorter tdet is. For a small ro, tdet decreases substantially with an increase in vg. However, for a large ro, tdet decreases slightly with an increase in vg. This is because when ro increases, the amount of gas entering the bubble increases at the same time. This leads to a rapid increase in buoyancy force. Therefore, the bubble detachment becomes quick. Fig. 11 also shows that when vg is low (vg < 1.0 m/s), tdet decreases substantially with an increase in vg; however, when vg is large, an increase in vg has almost no effect on tdet. This phenomenon is consistent with the results of Bhunia et al. [46] under low gravity and microgravity conditions.
Fig. 12 shows the effect of a on Ddet and tdet for ro = 1 × 10⁻³ m, vg = 0.1 m/s, and the basic parameters. As shown in Fig. 12, the trends of Ddet and tdet varying with a are basically similar. The higher a is, the smaller Ddet and tdet are. The relationship between Ddet (tdet) and a is not exactly linear, and a decrease in Ddet (tdet) with an increase in a is various. This is similar to the conclusion of reference [12].
Figure 12: Effect of a on Ddet and tdet
3.3.3 Surface Tension Coefficient
Fig. 13 shows the effect of σ on Ddet and tdet for the fixed ro and vg, and the basic parameters. It can be seen from Fig. 13a that for the same ro and vg, Ddet increases with an increase in σ. This is similar to the results of Ma et al. [11]. Ddet becomes large because an increase in σ inhibits bubble detachment. The period of bubble generation becomes long (however, the frequency decreases). In particular, for the condition of a low vg, Ddet increases relatively significantly with an increase in σ; however, for the conditions of a large ro and a high vg, Ddet varies slightly with an increase in σ. Jamialahmadi et al. [43] pointed out that bubble detachment volume is completely determined by the balance between buoyancy and surface tension at a low vg, so σ is very important at a small vg. However, as vg increases, the effect of σ becomes less important.
Figure 13: Effect of σ on Ddet and tdet
As shown in Fig. 13b, the effect of σ on tdet is related to ro and vg. When vg is high (vg = 2.0 m/s), tdet does not change much with an increase in σ for ro = 0.3 and 1 mm. When vg is small (vg = 0.1 m/s), tdet increases with an increase in σ. And for a small ro (= 0.3 mm), tdet increases greatly with an increase in σ; however, for a great ro (= 1.0 mm), tdet increases slightly with an increase in σ. In short, σ is small, meaning that the force hindering bubble detachment becomes smaller. Therefore, tdet is short.
The effect of μl on Ddet and tdet for the fixed ro and vg, and the basic parameters is shown in Fig. 14. It can be seen that Ddet increases as μl increases. For a large ro (= 1 mm) and a low vg (= 0.1 m/s), Ddet increases significantly with an increase in μl; however, for a small ro (= 0.3 mm) and a low vg (= 0.1 m/s), the change of Ddet with an increase in μl is not very obvious. Moreover, the increase of Ddet with an increase in vg is not significant in the range of μl = 0.001–0.1 Pa·s, and it is relatively obvious in the range of μl = 0.1–0.5 Pa·s. A similar phenomenon is reported in reference [43]. When μl is high, the viscous drag is more important. Therefore, bubble detachment volume is greatly influenced by μl. When vg is small, this effect is negligible.
Figure 14: Effect of μl on Ddet and tdet
When ro is different, the trend of tdet changing with an increase in μl is also different. When μl ≤ 0.3 Pa·s, tdet increases slowly with an increase in μl. When μl > 0.3 Pa·s, tdet increases quickly with an increase in μl except in the case of ro = 0.3 mm and vg = 0.1 m/s. For a small ro (= 0.3 mm) and a low vg (= 0.1 m/s), tdet increases dramatically first and then remains almost constant with an increase in μl. When ro and vg are small simultaneously, tdet will become very great.
Fig. 15 shows the effect of ρl on Ddet and tdet for the fixed ro and vg, and the basic parameters. It can be seen from Fig. 15a that Ddet basically decreases as an increase in ρl. For the conditions of a large ro (= 1.0 mm) and a large vg (= 1.0 m/s), Ddet decreases first and then remains almost constant as ρl increases. For the conditions of a large ro (= 1.0 mm) and a low vg (= 0.1 m/s), and a small ro (= 0.5 mm), Ddet decreases rapidly first and then slowly decreases with an increase in ρl. This verifies the results in Fig. 11.
Figure 15: Effect of ρl on Ddet and tdet
It can be seen from Fig. 15b that the effect of ρl on tdet is related to ro and vg. tdet basically decreases with an increase in ρl. For a large ro (= 1.0 mm) and a high vg (= 1.0 m/s), tdet is almost constant with an increase in ρl. For a small ro (= 0.5 mm) and a low vg (= 0.1 m/s), tdet decreases substantially with increasing ρl. For the cases with a large (or small) ro and a small (or large) vg, tdet decreases slightly with an increase in ρl. When ρl is small, tdet is tightly related to ro and vg; however, when ρl is large, tdet is slightly influenced by ro and vg.
3.3.6 Comparative Analysis of Results
To quantitatively understand the effect of each parameter on Ddet and tdet, the above results are comprehensively compared. It can be summarized as follows: (1) vg increases by 60 times when increasing vg from 0.05 to 3 m/s, which leads to an increase in Ddet by 2 times and a decrease in tdet by 6.9 times. (2) ro increases by 15 times when increasing ro from 0.1 to 1.5 mm, causing an increase in Ddet by 3 times and a decrease in tdet by 8.6 times. (3) a increases nearly by 3 times when increasing a from 3.71 to 10.99 m/s2, causing an increase in Ddet by 1.4 times and a decrease in tdet by 2.9 times. (4) σ increases by 7.2 times when increasing σ from 0.01 to 0.072 N/m, which leads to an increase in Ddet by 1.5 times and a decrease in tdet by 3.46 times. (5) μl increases by 500 times when increasing μl from 0.001 to 0.5 Pa·s, which leads to an increase in Ddet by 1.6 times and in tdet by 4.1 times. (6) ρl increases by 5 times when increasing ρl from 500 to 2500 kg/m3, causing an increase in Ddet by 1.5 times and in tdet by 3.7 times. It can be found from the above results that μl has the least effect on Ddet and tdet, and a has the greatest effect on Ddet and tdet. Georgoulas et al. [15] also pointed out that a, σ, and ρl have significant effects on the detachment characteristics of bubbles (especially tdet), while the effect of μl is small.
4 Analyses of Bubble Generation Mechanisms
4.1 Force Model of Bubble Generation
The forces in the vertical direction during the bubble generation process are shown in Fig. 16. These forces can be divided into two main types. One is the forces that drive bubbles to detach, i.e., buoyancy force (FB), pressure (FP), and gas momentum force (FM). The other is the forces that prevent bubbles from detaching, i.e., surface tension (FS), viscous drag (FD), and added mass force (FAM).
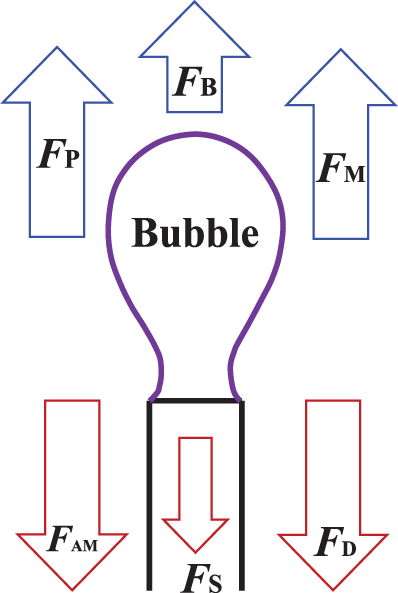
Figure 16: Forces in the vertical direction during bubble formation
The buoyancy force (FB) is caused by the density difference between gas and liquid phases, and it is calculated by Eq. (10) [48].
where Vb denotes the instantaneous volume of the bubble, Vb = πro2vgtdet; and tdet is bubble detachment time, s.
The pressure (FP) is caused by the pressure difference between inside and outside a bubble, and the pressure at the bubble apex can be calculated by Eq. (11) [46].
Here r is the instantaneous radius of the bubble, m.
The gas momentum force (FM) is generated by the momentum of gas passing through the needle, and it can be calculated by Eq. (12) [8].
The surface tension (FS) is related to the contact perimeter and the contact angle (θ) between the bubble and the needle, and it can be calculated by Eq. (13) [23].
The added mass force (FAM) is that during the bubble growth process, the accelerated motion of the bubble can drive the surrounding liquid to move together. It is the force that liquid prevents the change in the bubble interface. It can be calculated by Eq. (14) [49].
where YCM is the axial centroid position of bubbles, m.
The viscous drag (FD) before bubble separation is mainly determined by the growth rate of the center of mass in the vertical direction of the bubble and is calculated by Eq. (15) [50]:
where CD is the drag coefficient, and it is a function of Reynolds number (Re), calculated by Eq. (16) [51].
Here
4.2 Flow Field Analyses of Bubble Generation Process
The flow field around bubbles, especially near the gas−liquid interface, helps to understand the role of the liquid phase during the formation of bubbles. Fig. 17 shows the flow field during the bubble generation process for some typical cases. The black line represents the bubble interface, the white arrows indicate the flow direction of fluids, and the background color indicates the magnitude of the local velocity of fluids. When gas is injected into liquid, as the bubble grows, the bubble volume increases and occupies the space previously occupied by the liquid, and the flow mode of the liquid changes due to the growth of the bubble. Due to the effect of surface tension, the gas−liquid interface is close to a sphere in shape. When the gas with a certain velocity enters the bubble, a circulation flow forms. Under the viscous effect, the liquid around the bubbles forms a circular flow too, due to the flow at the interface. At the later stage of bubble formation, the motion of the bubble interface pushes the liquid−phase motion in axial and radial directions, respectively. The liquid phase near the bubble interface has two velocity components. The radial component of velocity acting on the bubble interface is larger, and the bubble neck forms under its action. The smaller axial component of velocity can elongate the bubble along the axial direction so that the bubble interface evolves from a concave shape to a convex one. When the bubble neck moves along the axial direction, the liquid phase accelerates flow toward the bubble neck due to the conservation of mass. This prompts the bubble to further shrink at the bubble neck, resulting in the separation of the bubble. During bubble separation, there is a large gas velocity in the bubble neck, which leads to a drastic increase in the effect of gas inertia [13].
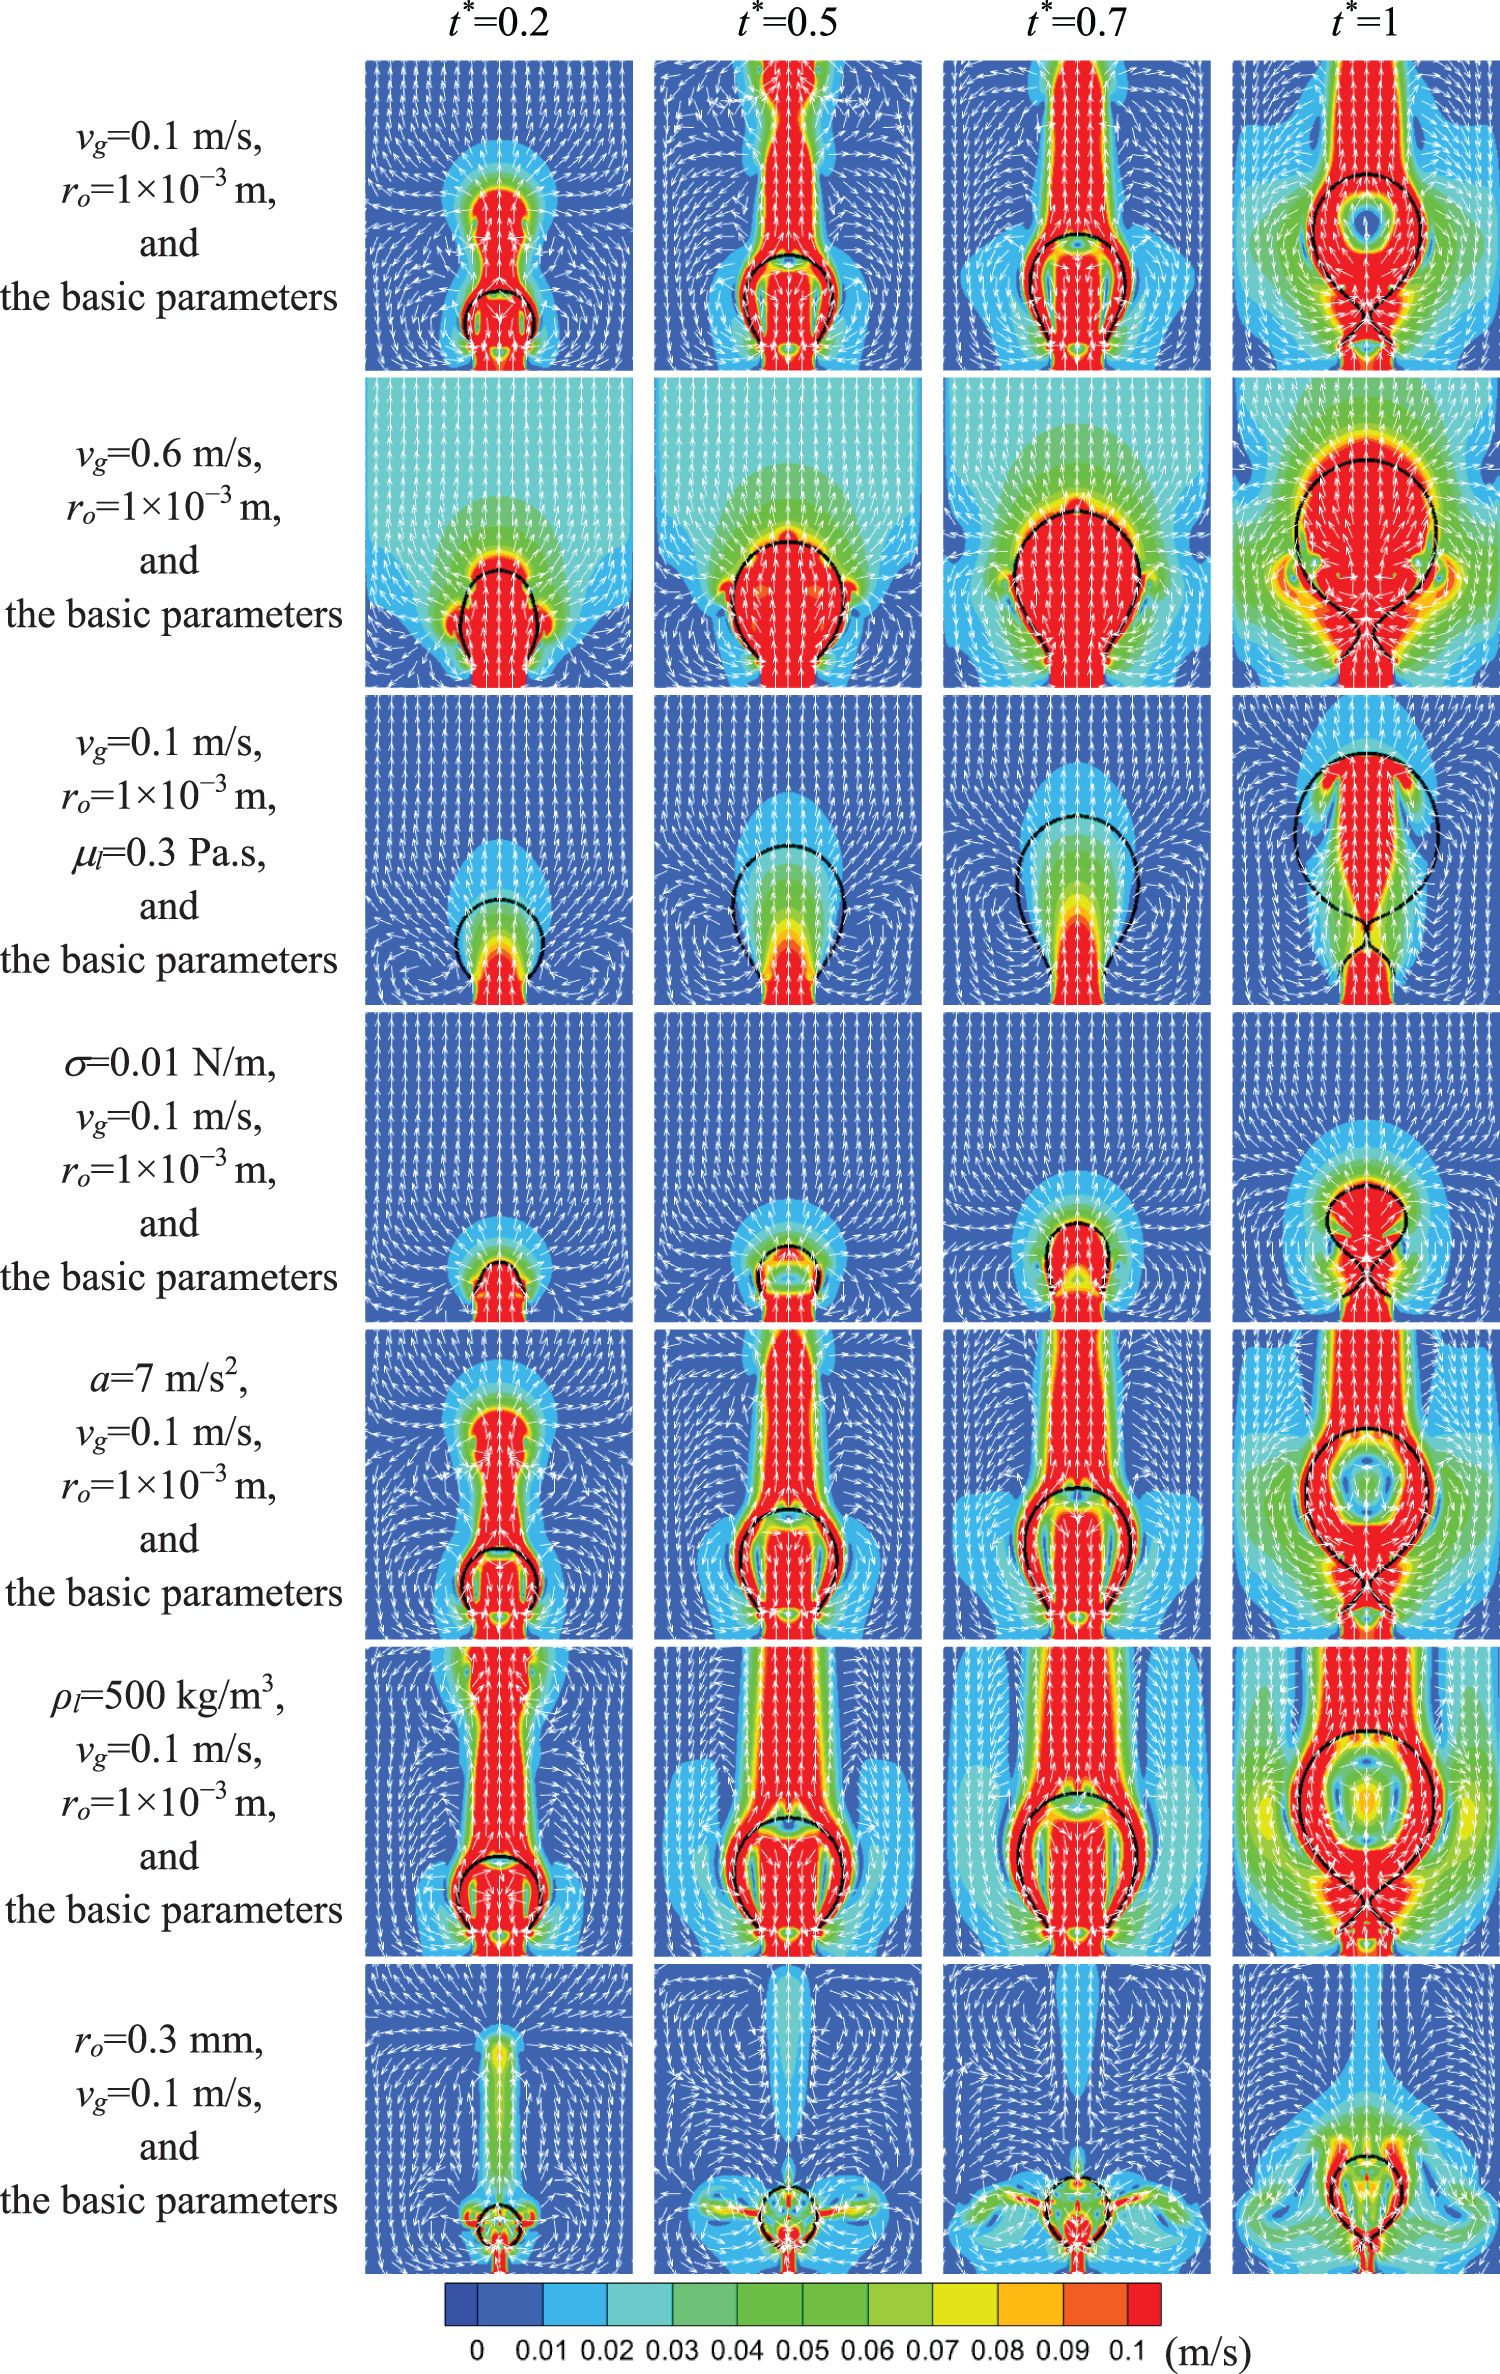
Figure 17: Flow field distribution during bubble generation process
As shown in Fig. 17, on the basis of the basic parameter, the influence of vg, μl, ρl, ro, a, and σ on the flow field is analyzed. Comparing the flow field of vg = 0.1 m/s with that of vg = 0.6 m/s, it is found that at vg = 0.6 m/s, the bubble growth simultaneously drives much more liquid around the bubble to move together due to the faster growth of the bubble (i.e., Ddet is great and tdet is small), so the magnitude of velocity of the fluids around the bubble is large. At vg = 0.1 m/s, the magnitude of liquid velocity is large only in a very narrow range at the top of the bubble. In addition, at vg = 0.6 m/s, the circulation on both sides of the bubble is stronger at the same time (i.e., the velocity magnitude in the circulation zone is relatively large). This is very helpful for the formation of a bubble neck. The bubble is more easily elongated along the axial direction due to the large gas injection volume per unit time (i.e., a large gas momentum). So, at vg = 0.6 m/s, Ddet is relatively large, while tdet is relatively short.
Comparing the flow field of μl = 0.001 with that of μl = 0.3 Pa·s, it is found that at μl = 0.3 Pa·s, the bubble growth is slower (i.e., tdet is longer and Ddet is larger) because of the higher viscosity of the liquid (i.e., the viscous drag is great), and the magnitude of liquid velocity around the bubble is smaller. At μl = 0.3 Pa·s, the circulation on both sides of the bubble weakens (i.e., the velocity magnitude in the circulation region becomes small) at the same time because of the higher viscosity of liquid. Thus, time is longer for the forces driving the separation of bubbles to increase enough to break the bubble neck. By comparing the flow fields of σ = 0.065 N/m with that of σ = 0.01 N/m, it is found that at σ = 0.01 N/m, tdet is short due to a decrease in σ, and thus the gas−liquid contact surface increases faster per unit time. Therefore, the influence range on liquid velocity around the bubble is small. Because tdet is small, the circulation on both sides of the bubble is close to the needle. This is very helpful to the generation of bubble neck.
As shown in Fig. 17, when a = 7 m/s2 is relatively small, there is a small increase in the region of higher liquid velocity around the bubble because the liquid becomes lighter in weight, and the liquid around the bubble is more susceptible to bubble growth. The increase in the high−speed region of liquid leads to stronger circulation on both sides of the bubble (the velocity magnitude in the circulation region is relatively larger). This promotes the formation of a bubble neck. And at a = 7 m/s2, tdet is relatively longer. Thus, the delayed detachment of the bubble leads to a larger Ddet. This in turn leads to a decrease in surface tension (i.e., a decrease in the force hindering bubble detachment), and finally, the bubble detaches from the needle rim. The effect of ρl on the flow field is similar to that of a, and thus the related analyses are not repeated here.
When ro = 0.3 mm is relatively small, the range of bubble growth affecting the surrounding liquid becomes narrow. This is caused by the fact that at the same vg and t, the gas inflow becomes small for a small ro. Thus, there is a decrease in bubble volume (i.e., a decrease in bubble interface) at the same time. Moreover, at ro = 0.3 mm, the bubble is closer to a sphere in shape, meaning that the bubble grows at roughly the same speed in any radial direction, so the bubble growth has a significant effect on the radial and axial velocities of the surrounding liquid.
4.3 Pressure Field Analysis of Bubble Generation Process
The pressure contours corresponding to Fig. 17 are shown in Fig. 18, where the black line represents the bubble interface and the background color indicates the magnitude of the gas−liquid phase pressure. As shown in Fig. 18, the pressure inside the bubble (equal to the sum of the pressure generated by the surface tension and the hydrostatic pressure of liquid) is different from that of the surrounding liquid phase pressure since the bubble diameter during the formation process changes. The pressure is not uniform because the velocities of fluids inside and outside the bubble are different. Inside the bubble, the further away from the needle is, the smaller the gas velocity is; thus the closer to the bubble top is, the higher the pressure is. The pressure inside the bubble at the pre−growth stage (t* = 0.2) is greater than that at the mid−growth stage (t* = 0.5, 0.7), According to Eq. (11), the pressure inside the bubble becomes small with an increase in bubble diameter when other parameters remain unchanged. In the early and middle stages of bubble formation (t* = 0.2, 0.5, and 0.7), the total difference in the pressure between the bubble and liquid phases is large. As the bubble grows (bubble diameter becomes large), the pressure difference between the inside and outside of the bubble gradually decreases. At the late stage of bubble formation (t* = 1), the gas−liquid pressure around the neck at the time of bubble detachment decreases. As mentioned in reference [14], when ρl/ρg > 6.2, the surface tension becomes very small and is negligible at the time of bubble detachment, and the bubble detachment is mainly caused by buoyancy. Gas flows through the bubble neck, and the gas velocity is very high. Then the pressure is low due to the Bernoulli effect (for an incompressible inviscid fluid at a steady flow, when the pressure is low, the velocity is high in the same streamline). The suction force generated by the local low pressure affects both the gas and the surrounding liquid. The surrounding liquids are sucked towards the bubble neck, which strengthens the compression on the bubble neck.
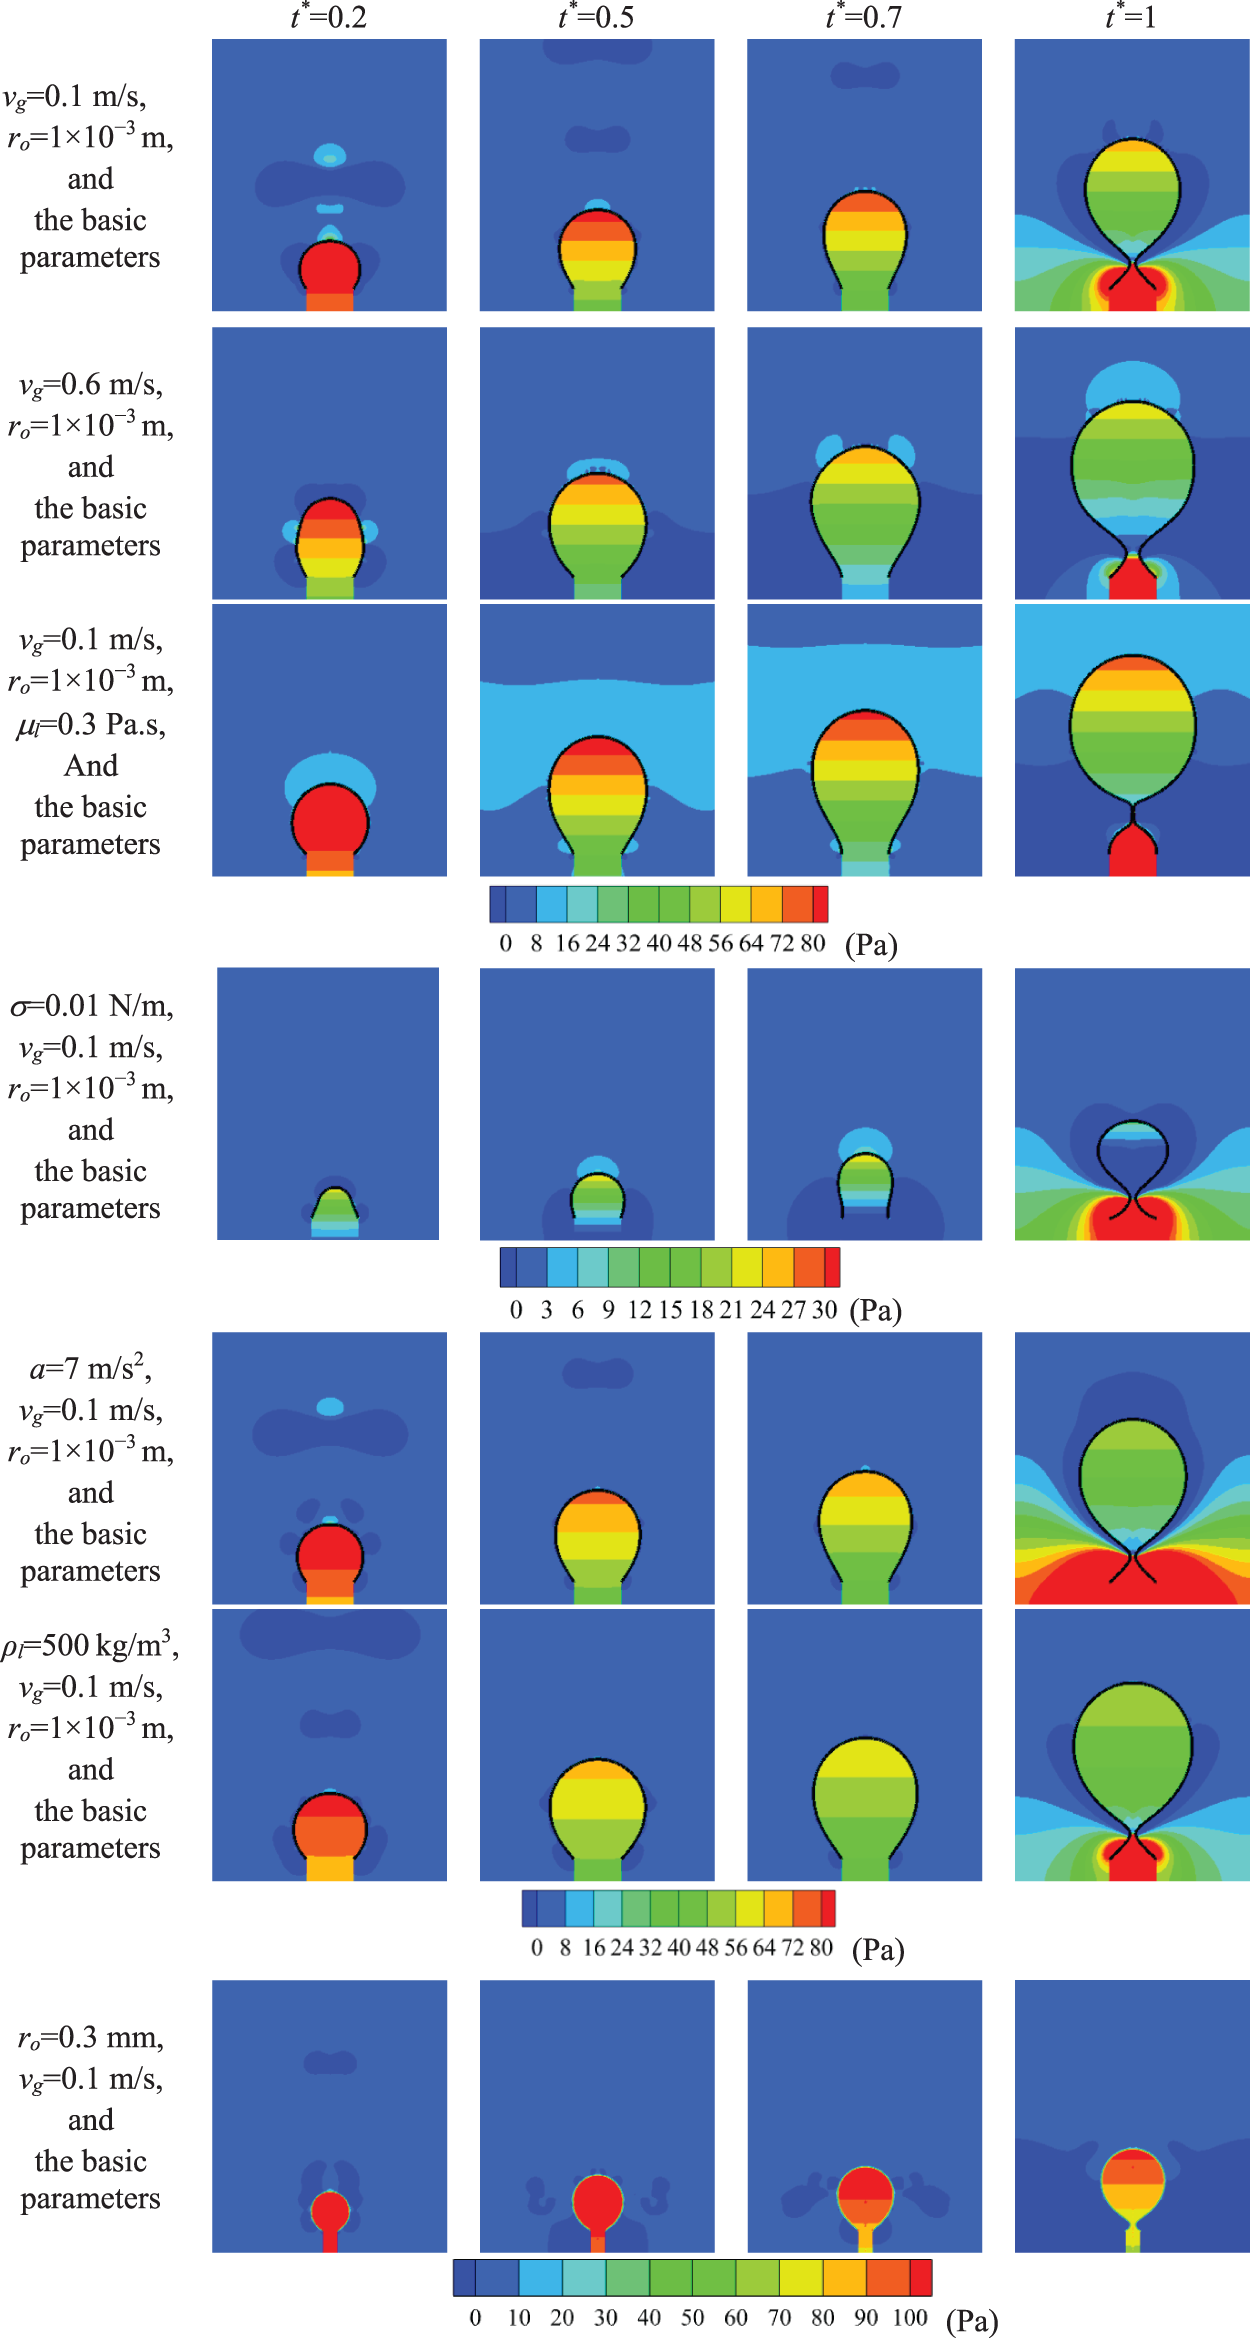
Figure 18: Pressure distribution during bubble generation process
As shown in Fig. 18, the bubble diameter is large at the same time at a large vg compared with a small vg, and therefore the pressure inside the bubble is relatively small. The pressure inside the bubble is relatively small at a large μl compared with a small μl. This is because a large μl leads to an increase in tdet, and the amount of gas entering the bubble is much more at a large μl. The pressure inside the bubble decreases significantly when σ decreases. This is consistent with Eq. (11). When a is relatively small, the pressure inside the bubble decreases. Since a decrease in a can lead to an increase in the bubble diameter at the same time. A decrease in ρl results in a decrease in the pressure inside the bubble. As shown in Fig. 15, tdet is almost independent of ρl at a small ro. When the amount of gas entering the bubble remains constant, and the bubble volume is relatively large, the pressure inside the bubble is low. A decrease in ro leads to the bubble radius is small. Therefore, the pressure inside the bubble increases substantially with an increase in ro.
4.4 Force Analyses of Bubble Generation Process
To understand the bubble formation dynamics and the effect of each factor on bubble generation, the evolution of forces with time during bubble generation is analyzed. Fig. 19 shows the evolution of each force with time for ro = 1 × 10⁻³ m, vg = 0.1 m/s, and the basic parameters, where the resultant force is not equal to zero because the bubble is growing. At the early stage of bubble growth, the gas momentum is weak, buoyancy is very small, and the dominant forces are Fp and Fs. Fp, dependent on the pressure difference between the inside and outside of the bubble, is the maximum at the beginning of bubble growth. At this stage, the bubble shape is hemispherical, and the bubble diameter is very small. As the bubble diameter increases, Fp decreases monotonically with time. Fs is also related to needle radius and bubble diameter, so it also decreases with time. FB is initially close to zero, and then it increases linearly as the bubble grows. The magnitude of FM remains constant because vg is uniform and relatively small. Thus, the growth rate of bubble volume is approximately constant. The viscous drag in low-viscosity liquids is negligible, so FD is small and does not vary much. At the early and middle stages of bubble growth, because the bubble adheres to the needle rim, the axial center of mass position of the bubble changes slightly, and the additional mass force of the bubble hardly changes. With the formation of the bubble neck in the late stage, the additional mass force increases with an increase in the position of the center of mass. The resultant force is negative at the early stage of bubble growth, i.e., the direction of force is downward, at which the bubble adheres to the needle rim. At the middle and late stages of bubble growth, the magnitude of the resultant force changes from negative to positive, and it increases. Correspondingly, the bubble grows and is elongated along the axial direction, and it moves away from the needle until detaching. The present results are similar to those of references [4,29].
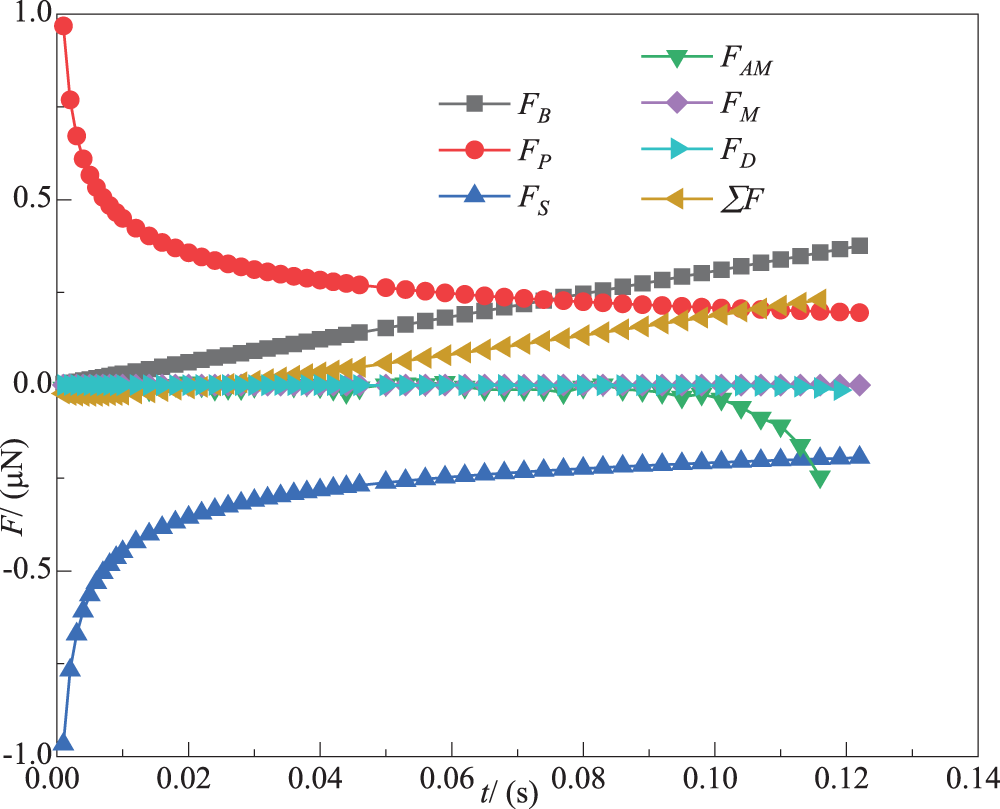
Figure 19: Variation of forces with time for ro = 1 × 10⁻³ m, vg = 0.1 m/s and the basic parameters
To understand deeply the effect of each factor on bubble generation, the effect of each factor on the main forces at the time of bubble separation is shown in Fig. 20. For the convenience of comparison, the absolute value of surface tension is adopted. It can be seen from Fig. 20a that the higher vg is, the greater FB is, and the smaller FS and Fp are. The trend of FS and Fp is similar. vg increases, and accordingly, the bubble volume (diameter) increases. As shown in Eqs. (10) and (11), FB becomes larger, but FP becomes smaller. Surface tension is the dominant force at low flow rates; however, it has the minimum effect at high flow rates [46]. Therefore, FS becomes smaller. As shown in Fig. 20b, with an increase in ρl, FB decreases but FS and Fp increase. Since an increase in ρl causes a corresponding increase in the density difference between the two phases, the bubble reaches a smaller volume. So, the buoyancy force decreases. As the effect of ρl on Ddet is shown in Section 3, with an increase in ρl, Ddet decreases. Therefore, FS and Fp increase. It can be seen from Fig. 20c that as σ increases, FB, FS and Fp increase. As σ increases, FS increases. The bubble volume is large enough (i.e., buoyancy is great enough) to promote it to detach from the needle, so FB increases. As shown in Eq. (11), Fp also increases. As shown in Fig. 20d, with an increase in μl, FB increases but FS and Fp decrease. This is because the greater the μl is, the greater the FD is. This leads to a corresponding increase in buoyancy according to the force equilibrium. And bubble detachment volume is large at a high μl, so FS and Fp decrease. It can be seen from Fig. 20e that FB is almost unaffected by a, and FS and Fp increase with an increase in a. This is because an increase in a leads to a decrease in Ddet (as shown in Fig. 12), FB changes insignificantly, while FS and Fp increase. As shown in Fig. 20f, an increase in ro causes an increase in FB, FS, and Fp. This is because surface tension is proportional to the orifice diameter [52]. The larger the needle size is, the greater the holding force is, and the bubble is attached to the orifice for a longer time. This causes a larger bubble volume (as shown in Fig. 11), and thus FB increases. As shown in Eq. (13), Fp increases. Fp is weak for smaller orifices; however, it becomes predominant for larger orifices. So, Fp increases.
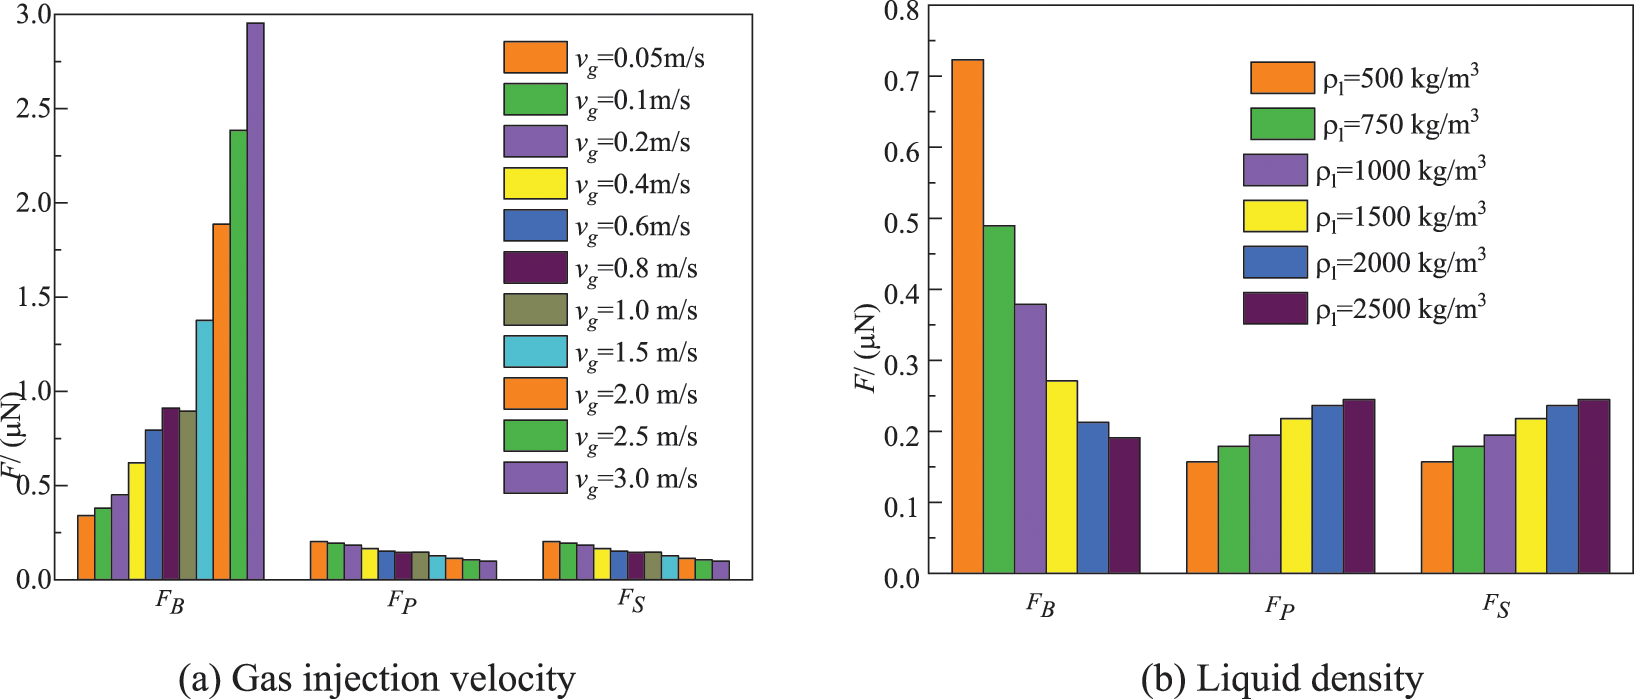
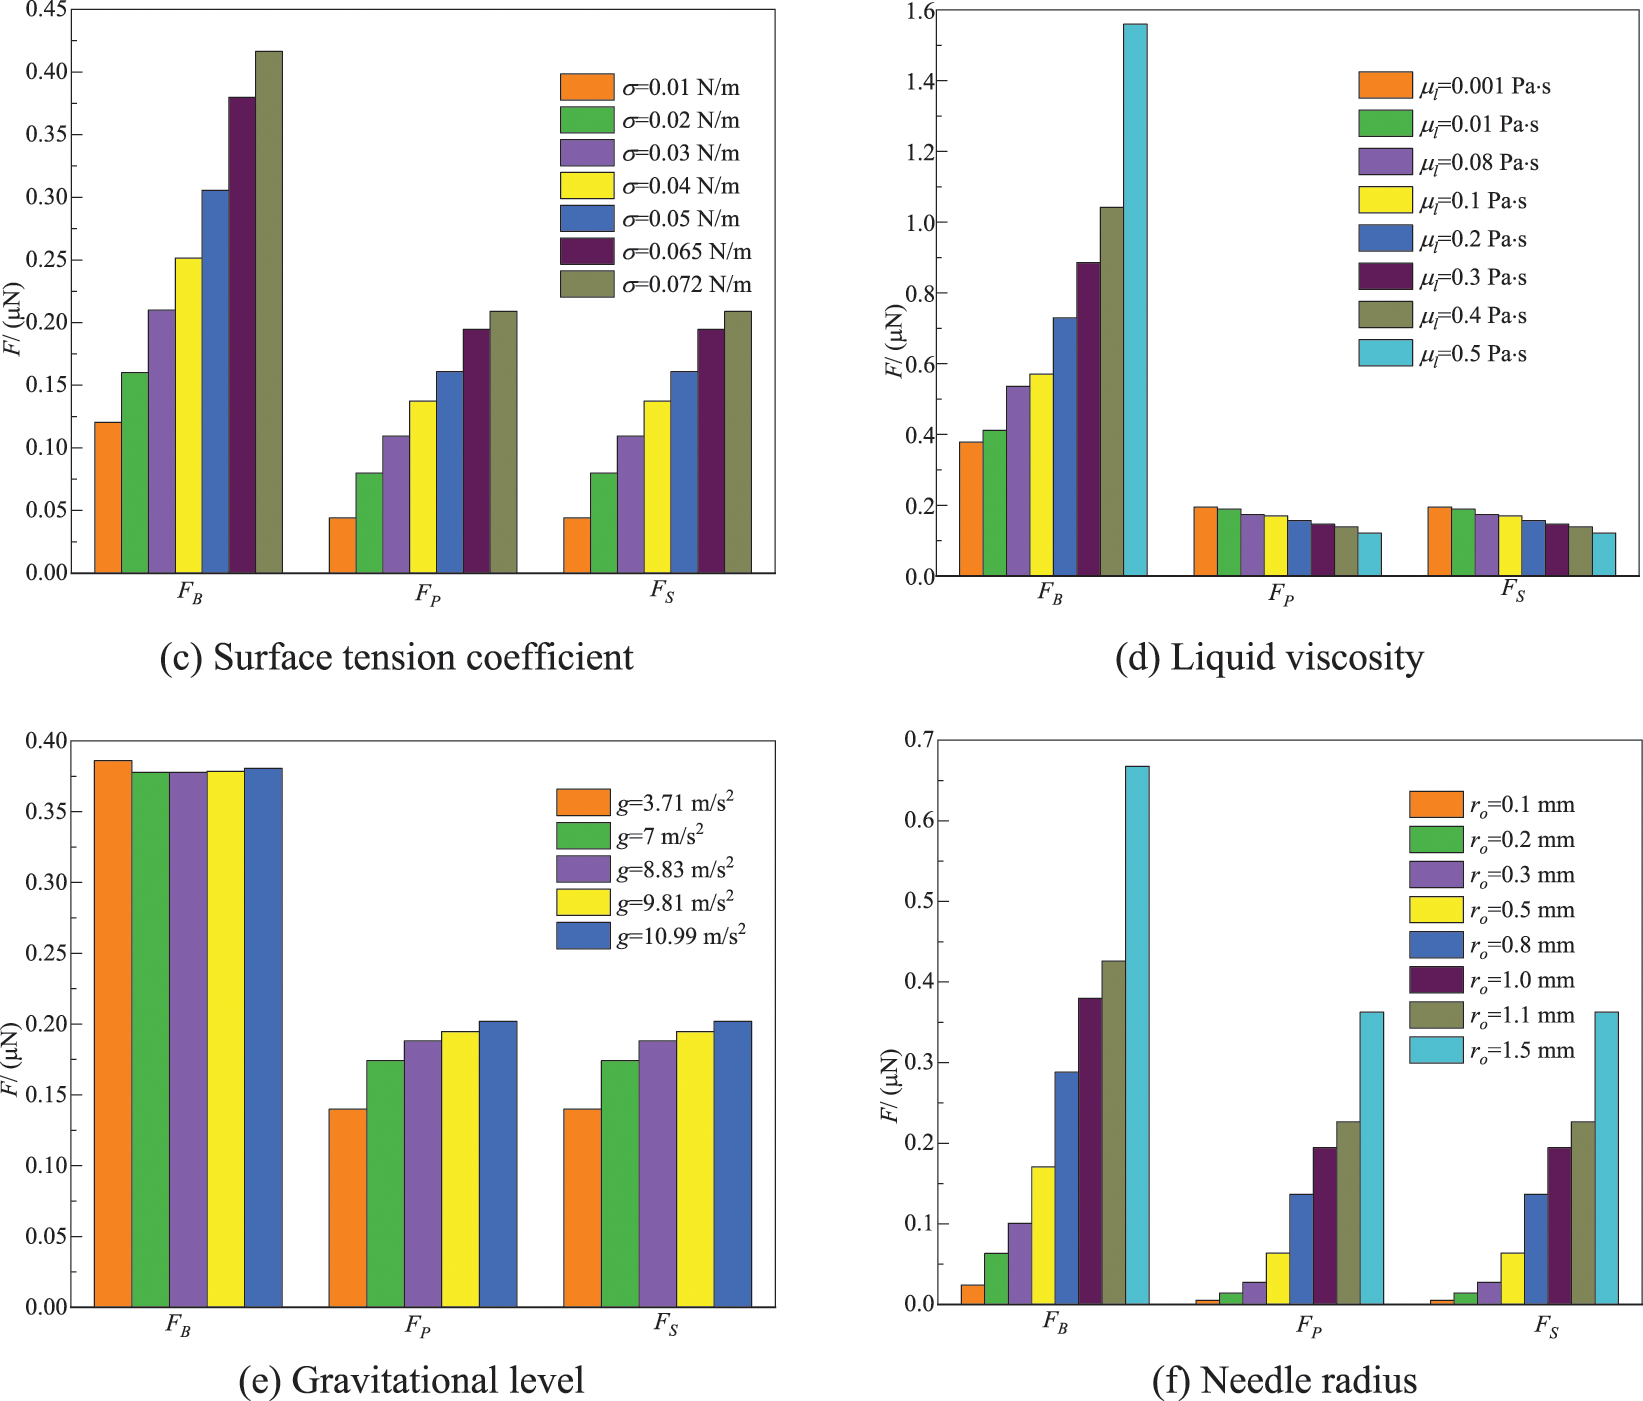
Figure 20: Analyses of forces on the bubble at the time of bubble separation
The effects of gas injection velocity, gravitational level, surface tension coefficient, liquid viscosity and density, and needle radius on bubble generation in Newtonian fluids are analyzed in detail using the VOF method, and the following conclusions can be obtained:
1. An increase in gas injection velocity, liquid phase viscosity, needle radius, and surface tension coefficient, and a decrease in liquid density and gravitational level generally leads to an increase in bubble detachment diameter. The effect of gas injection velocity on bubble shape is the greatest, and the effect of that on bubble detachment diameter can be neglected for a small needle radius. When both the needle radius and the gas inlet velocity are small, the effect of liquid viscosity on bubble detachment diameter is not obvious in the low viscosity range. When the gas injection velocity is large, the surface tension coefficient has almost no effect on bubble detachment diameter.
2. A decrease in needle radius, gravitational acceleration, and liquid density, as well as an increase in gas inlet velocity, surface tension coefficient, and liquid viscosity, generally leads to an increase in bubble detachment time. When the gas inlet velocity is large to a certain extent, the needle radius and the gas inlet velocity have almost no effect on the detachment time. When the needle radius and the gas inlet velocity are small, the detachment time does not vary with liquid viscosity. When the needle radius and the gas inlet velocity are large, the liquid density has almost no effect on the detachment time. By analyzing the flow and pressure fields, it is found that an increase in gas injection velocity, needle radius, and surface tension coefficient, and a decrease in liquid phase viscosity, liquid density, and gravitational level lead to strong circulation on both sides of the bubble. An increase in surface tension coefficient, liquid phase viscosity, liquid density, and gravitational level, and a decrease in gas injection velocity and needle radius increase the pressure inside the bubble.
3. In contrast, the effect of liquid−phase viscosity on bubble detachment diameter and time is the least, and the effect of gravity level on them is the greatest. Other factors have a smaller effect on the detachment diameter but a greater effect on the detachment time.
4. By analyzing the forces during the bubble generation process, it is found that the bubble generation is mainly influenced by buoyancy, pressure, and surface tension. An increase in gas injection velocity, surface tension coefficient, and needle radius, as well as a decrease in liquid density and viscosity, leads to an increase in buoyancy. An increase in liquid density, surface tension coefficient, gravity level, and needle radius, as well as a decrease in liquid viscosity, and gas injection speed, leads to an increase in surface tension. An increase in liquid density, gravity level, needle radius, and gas injection velocity leads to a decrease in pressure. An increase in surface tension coefficient and liquid viscosity leads to an increase in pressure.
Acknowledgement: Authors express their gratitude to reviewer’s comments.
Funding Statement: The authors received no specific funding for this study.
Author Contributions: The authors confirm their contribution to the paper as follows: study conception and design: Meng Jia, Mingjun Pang; data collection: Meng Jia; analysis and interpretation of results: Meng Jia, Mingjun Pang; draft manuscript preparation: Meng Jia. All authors reviewed the results and approved the final version of the manuscript.
Availability of Data and Materials: Not applicable.
Conflicts of Interest: The authors declare that they have no conflicts of interest to report regarding the present study.
References
1. Zhang, W., Wang, J., Su, Q., Li, B., Yu, K. et al. (2023). Polarization motion of bubbles in a non-uniform electric field. Chemical Engineering Journal, 455, 140767. [Google Scholar]
2. Sahasrabudhe, S. N., Chaudhari, S. S., Farkas, B. E. (2021). Experimental measurement of factors affecting dynamics of bubble growth from a submerged orifice: Applications to the frying process. Journal of Food Engineering, 251, 36–44. [Google Scholar]
3. Tamura, A., Katono, K. (2023). Investigation into hybridization of the two-fluid model and phase-field model for multi-scale two-phase flow simulations. Journal of Nuclear Engineering and Radiation Science, 9(3), 031404. [Google Scholar]
4. Kulkarni, A. A., Joshi, J. B. (2005). Bubble formation and bubble rise velocity in gas–liquid systems: A review. Industrial & Engineering Chemistry Research, 44(16), 5873–5931. [Google Scholar]
5. Wang, H., Yang, W., Yan, X., Wang, Y., Zhang, H. (2020). Regulation of bubble size in flotation: A review. Journal of Environmental Chemical Engineering, 8(5), 104070. [Google Scholar]
6. Suja, V. C., Rodríguez-Hakim, M., Tajuelo, J., Fuller, G. G. (2020). Single bubble and drop techniques for characterizing foams and emulsions. Advances in Colloid and Interface Science, 286, 102295. [Google Scholar]
7. Gardner, J. E., Wadsworth, F. B., Carley, T. L., Llewellin, E. W., Kusumaatmaja, H. (2023). Bubble formation in magma. Annual Review of Earth and Planetary Sciences, 51(1), 131–154. [Google Scholar]
8. Martín, M., Montes, F. J., Galán, M. A. (2006). Numerical calculation of shapes and detachment times of bubbles generated from a sieve plate. Chemical Engineering Science, 61(2), 363–369. [Google Scholar]
9. Quan, S., Hua, J. (2008). Numerical studies of bubble necking in viscous liquids. Physical Review E, 77(6), 066303. [Google Scholar]
10. Chakraborty, I., Biswas, G., Ghoshdastidar, P. S. (2011). Bubble generation in quiescent and co-flowing liquids. International Journal of Heat and Mass Transfer, 54(21–22), 4673–4688. [Google Scholar]
11. Ma, D., Liu, M., Zu, Y., Tang, C. (2012). Two-dimensional volume of fluid simulation studies on single bubble formation and dynamics in bubble columns. Chemical Engineering Science, 72, 61–77. [Google Scholar]
12. di Bari, S., Lakehal, D., Robinson, A. J. (2013). A numerical study of quasi-static gas injected bubble growth: Some aspects of gravity. International Journal of Heat and Mass Transfer, 64, 468–482. [Google Scholar]
13. Albadawi, A., Donoghue, D. B., Robinson, A. J. (2013). Influence of surface tension implementation in volume of fluid and coupled volume of fluid with level set methods for bubble growth and detachment. International Journal of Multiphase Flow, 53, 11–28. [Google Scholar]
14. Albadawi, A., Donoghue, D. B., Robinson, A. J. (2013). On the analysis of bubble growth and detachment at low capillary and bond numbers using volume of fluid and level set methods. Chemical Engineering Science, 90, 77–91. [Google Scholar]
15. Georgoulas, A., Koukouvinis, P., Gavaises, M., Marengo, M. (2015). Numerical investigation of quasi-static bubble growth and detachment from submerged orifices in isothermal liquid pools: The effect of varying fluid properties and gravity levels. International Journal of Multiphase Flow, 74, 59–78. [Google Scholar]
16. Simmons, J. A., Sprittles, J. E., Shikhmurzaev, Y. D. (2015). The formation of a bubble from a submerged orifice. European Journal of Mechanics-B/Fluids, 53, 24–36. [Google Scholar]
17. Hecht, K. J., Velagala, S., Easo, D. A., Saleem, M. A., Krause, U. (2019). Influence of wettability on bubble formation from submerged orifices. Industrial & Engineering Chemistry Research, 59(9), 4071–4078. [Google Scholar]
18. Ali, M. F., Yu, L., Chen, X., Yu, G., Abdeltawab, A. A. et al. (2019). Numerical modeling for characterization of CO2 bubble formation through submerged orifice in ionic liquids. Chemical Engineering Research and Design, 146, 104–116. [Google Scholar]
19. Oshaghi, M. R., Afshin, H., Firoozabadi, B. (2019). Investigation of bubble formation and its detachment in shear-thinning liquids at low capillary and Bond numbers. Theoretical and Computational Fluid Dynamics, 33, 463–480. [Google Scholar]
20. Boubendir, L., Chikh, S., Tadrist, L. (2020). On the surface tension role in bubble growth and detachment in a micro-tube. International Journal of Multiphase Flow, 124, 103196. [Google Scholar]
21. Smith, W. R., Wang, Q. X. (2023). The role of surface tension on the growth of bubbles by rectified diffusion. Ultrasonics Sonochemistry, 98, 106473. [Google Scholar] [PubMed]
22. Burton, J. C., Waldrep, R., Taborek, P. (2005). Scaling and instabilities in bubble pinch-off. Physical Review Letters, 94(18), 184502. [Google Scholar] [PubMed]
23. Duhar, G., Colin, C. (2006). Dynamics of bubble growth and detachment in a viscous shear flow. Physics of Fluids, 18(7), 077101. [Google Scholar]
24. Taghi Esfidani, M., Reza, Oshaghi, M., Firoozabadi, B., Afshin, H. et al. (2017). Modeling and experimental investigation of bubble formation in shear-thinning liquids. Journal of Fluids Engineering, 139(7), 071302. [Google Scholar]
25. Hanafizadeh, P., Sattari, A., Hosseini-Doost, S. E., Nouri, A. G., Ashjaee, M. (2018). Effect of orifice shape on bubble formation mechanism. Meccanica, 53, 2461–2483. [Google Scholar]
26. Sun, Q., Gu, H., Yu, X., Yin, W. (2019). Bubble formation characteristic of submerged single-hole orifice in aerosol suspension. Frontiers in Energy Research, 7, 92. [Google Scholar]
27. Mohseni, E., Herrmann-Heber, R., Reinecke, S. F., Hampel, U. (2019). Bubble generation by micro-orifices with application on activated sludge wastewater treatment. Chemical Engineering and Processing-Process Intensification, 143, 107511. [Google Scholar]
28. Muilwijk, C., van den Akker, H. E. A. (2019). Experimental investigation on the bubble formation from needles with and without liquid co-flow. Chemical Engineering Science, 202, 318–335. [Google Scholar]
29. Sattari, A., Hanafizadeh, P. (2019). Bubble formation on submerged micrometer-sized nozzles in polymer solutions: An experimental investigation. Colloids and Surfaces A: Physicochemical and Engineering Aspects, 564, 10–22. [Google Scholar]
30. Mohseni, E., Kalayathine, J. J., Reinecke, S. F., Hampel, U. (2020). Dynamics of bubble formation at micro-orifices under constant gas flow conditions. International Journal of Multiphase Flow, 132, 103407. [Google Scholar]
31. Li, X., Su, W., Liu, Y., Yan, X., Wang, L. et al. (2021). Comparison of bubble velocity, size, and holdup distribution between single-and double-air inlet in jet microbubble generator. Asia-Pacific Journal of Chemical Engineering, 16(2), e2611. [Google Scholar]
32. Muilwijk, C., van den Akker, H. E. A. (2021). The effect of liquid co-flow on gas fractions, bubble velocities and chord lengths in bubbly flows. Part I: Uniform gas sparging and liquid co-flow. International Journal of Multiphase Flow, 137, 103498. [Google Scholar]
33. Muilwijk, C., van den Akker, H. E. A. (2021). The effect of liquid co-flow on gas fractions, bubble velocities and chord lengths in bubbly flows. Part II: Asymmetric flow configurations. International Journal of Multiphase Flow, 138, 103562. [Google Scholar]
34. Reuter, F., Ohl, C. D. (2021). Supersonic needle-jet generation with single cavitation bubbles. Applied Physics Letters, 118(13), 012043. [Google Scholar]
35. Garivalis, A. I., di Marco, P. (2022). Isolated bubbles growing and detaching within an electric field in microgravity. Applied Thermal Engineering, 212, 118538. [Google Scholar]
36. Sheng, L., Chang, Y., Deng, J., Luo, G. (2022). Mechanism and modeling of Taylor bubble generation in viscous liquids via the vertical squeezing route. Chemical Engineering Science, 258, 117763. [Google Scholar]
37. Rajesh, S., Peddada, S. S., Thiévenaz, V., Sauret, A. (2022). Pinch-off of bubbles in a polymer solution. Journal of Non-Newtonian Fluid Mechanics, 310, 104921. [Google Scholar]
38. Tanaka, K., Yamaguchi, T. (2022). Direct observation of bubble generation processes inside a molten pool during laser cladding. Surface and Coatings Technology, 447, 128831. [Google Scholar]
39. Shi, Q., Zhu, H., Zhu, J., Wu, N., He, H. et al. (2022). Effect of gas injection rate on bubble generation characteristics and coal flotation. Fuel, 324, 124744. [Google Scholar]
40. Sarkar, S., Sen, N., Singh, K. K. (2023). Bubble formation at top-submerged nozzles immersed in a quiescent liquid. Progress in Nuclear Energy, 161, 104709. [Google Scholar]
41. Qiu, H., Obata, K., Yuan, Z., Nishimoto, T., Lee, Y. et al. (2023). Quantitative description of bubble formation in response to electrolyte engineering. Langmuir, 39(14), 4993–5001. [Google Scholar] [PubMed]
42. Manthey, J., Guesmi, M., Schab, R., Unz, S., Beckmann, M. (2023). A sensitivity analysis on the bubble departure diameter for bubble growth due to oxygen super-saturation in highly purified water. International Journal of Thermofluids, 18, 100327. [Google Scholar]
43. Jamialahmadi, M., Zehtaban, M. R., Müller-Steinhagen, H., Sarrafi, A., Smith, A. M. (2001). Study of bubble formation under constant flow conditions. Chemical Engineering Research and Design, 79(5), 523–532. [Google Scholar]
44. López, J., Hernández, J., Gómez, P., Faura, F. (2004). A volume of fluid method based on multidimensional advection and spline interface reconstruction. Journal of Computational Physics, 195(2), 718–742. [Google Scholar]
45. Kasimsetty, S. K. (2008). Theoretical modeling and correlational analysis of single bubble dynamics from submerged orifices in liquid pools, vol. 108. USA: University of Cincinnati. [Google Scholar]
46. Bhunia, A., Pais, S. C., Kamotani, Y., Kim, I. H. (1998). Bubble formation in a coflow configuration in normal and reduced gravity. AIChE Journal, 44(7), 1499–1509. [Google Scholar]
47. Oguz, H. N., Prosperetti, A. (1993). Dynamics of bubble growth and detachment from a needle. Journal of Fluid Mechanics, 257, 111–145. [Google Scholar]
48. Terasaka, K., Tsuge, H. (1993). Bubble formation under constant-flow conditions. Chemical Engineering Science, 48(19), 3417–3422. [Google Scholar]
49. Li, H. Z., Mouline, Y., Midoux, N. (2002). Modelling the bubble formation dynamics in non-Newtonian fluids. Chemical Engineering Science, 57(3), 339–346. [Google Scholar]
50. Zhang, L., Shoji, M. (2001). Aperiodic bubble formation from a submerged orifice. Chemical Engineering Science, 56(18), 5371–5381. [Google Scholar]
51. Nahra, H. K., Kamotani, Y. (2003). Prediction of bubble diameter at detachment from a wall orifice in liquid cross-flow under reduced and normal gravity conditions. Chemical Engineering Science, 58(1), 55–69. [Google Scholar]
52. Davidson, L., Amick, E. H. Jr (1956). Formation of gas bubbles at horizontal orifices. AIChE Journal, 2(3), 337–342. [Google Scholar]
Cite This Article
 Copyright © 2023 The Author(s). Published by Tech Science Press.
This work is licensed under a Creative Commons Attribution 4.0 International License , which permits unrestricted use, distribution, and reproduction in any medium, provided the original work is properly cited.
 Downloads
 Citation Tools