
 Submit a Paper
 Propose a Special lssue
 Open Access
ARTICLE

Numerical Study on Natural Circulation System under Various Cooling Mediums
1 CAS Key Laboratory of Mechanical Behavior and Design of Materials, Department of Thermal Science and Energy Engineering, University of Science and Technology of China, Hefei, 230027, China
2 Beijing Institute of Astronautical Systems Engineering, Beijing, 100076, China
* Corresponding Authors: Peng Hu. Email: ; Fei He. Email:
(This article belongs to the Special Issue: Fluid Flow, Heat and Mass Transfer within Novel Cooling Structures)
Frontiers in Heat and Mass Transfer 2025, 23(2), 397-420. https://doi.org/10.32604/fhmt.2025.062781
Received 27 December 2024; Accepted 07 February 2025; Issue published 25 April 2025
 View Full Text
 Download PDF
Abstract
Aiming at the global design issue of transpiration cooling thermal protection system, a self-driven circulation loop is proposed as the internal coolant flow passage for the transpiration cooling structure to achieve adaptive cooling. To enhance the universality of this internal cooling pipe design and facilitate its application, numerical studies are conducted on this system with four commonly used cooling mediums as coolant. Firstly, the accuracy of the numerical method is verified through an established experimental platform. Then, transient numerical simulations are performed on the flow states of different cooling mediums in the new self-circulation system. Based on the numerical result, the flow, phase change, and heat transfer characteristics of different cooling mediums are analyzed. Differences in fluid velocity and latent heat of phase change result in significant variation in heat exchange capacity among different cooling mediums, with the maximum difference reaching up to 3 times. Besides, faster circulation speed leads to greater heat transfer capacity, with a maximum of 7600 W/m2. Consequently, the operating mechanism and cooling laws of the natural circulation system is further investigated, providing a reference for the practical application of this system.Keywords
As the flight speed and cruise time of aircraft significantly increase, the thermal environment faced by critical components, especially the leading edge of aircraft, becomes increasingly harsh [1,2]. There is an urgent need to develop more efficient and lightweight active cooling technologies [3]. Transpiration cooling with porous materials as the basis material could achieve good cooling effects while consuming less coolant, making it extremely potential for application in high speed aircraft [4,5]. During the application of transpiration cooling, the uneven distribution of thermal loads across the hot-end components can result in localized areas experiencing either inadequate or excessive cooling [6]. This imbalance may subsequently lead to cooling failure in some regions or significant wastage of coolant in others [7,8]. To improve the steadiness of cooling system, it is necessary to design transpiration cooling application schemes tailored to specific structures [9]. Furthermore, to better integrate transpiration cooling into engineering applications, it is crucial to consider the internal cooling requirement of the aircraft, fully utilizing the heat sinks of the coolant and further reducing the weight of the cooling system [10,11]. Therefore, the heat transfer between the transpiration cooling structure and the substructure, as well as design schemes for the arrangement of internal coolant pipes should be considered [12–15] to achieve comprehensive thermal management.
The Natural Circulation System (NCS) capitalizes on the density variation between cooling mediums at the heat source and radiator to facilitate the circulation of single-phase or two-phase fluids within the system [16–20]. Given its requirement of no pumps or additional driving equipment, the NCS boasts a straightforward setup and finds applications across diverse domains, including nuclear reactor cooling, electronic cooling, and solar energy conversion [21–24]. The design and implementation of natural circulation loops hinge significantly on their startup characteristics and flow instability [25,26], garnering considerable attention. Furci et al. [27] introduced a simplified two-phase flow model to examine the transient thermal-hydraulic behavior of a loop. Li et al. [28], meanwhile, conducted numerical research on the combined impact of system oscillations on transient response traits using an enhanced RELAP5 code. Nevertheless, the transient response traits of circulation loops with varying structural setups and cooling mediums remain incompletely comprehended and necessitate further exploration.
A novel open natural circulation system, inspired by the design concept of a low-pressure open NCS, is introduced. It comprises solely an open reservoir and U-shaped piping. Unlike other open natural circulation systems, all piping in this system is enveloped by heat sources, albeit with varying heat flux along different segments, aligning more closely with the heat exposure patterns of aircraft internal structures. During operation, the heat flux difference results in density variation of fluid in different parts of the pipe, driving the fluid to circulate within the loop for cooling purposes. Simultaneously, the liquid coolant undergoes a phase change by absorbing heat and transforms into a gaseous state, and the gaseous coolant flows out from the pipe orifice to be supplied as a coolant for upper-layer transpiration cooling. Consequently, this design not only ensures the safe operation of components with lower temperature tolerance by cooling internal structure but also circumvents issues associated with direct transpiration cooling of liquid coolant in porous media. Additionally, it eliminates the need for driving equipment, reducing the additional load on the aircraft.
However, previous work only conducted qualitative experimental research on the new natural circulation system using liquid water as the coolant, lacking quantitative analysis of the flow state and heat transfer capacity. To enhance the universality of the system design and promote its application, multiple common coolants are selected to investigate the flow and heat transfer characteristics of the system. Firstly, an experimental platform was built to verify the accuracy of the numerical method. Then, Subsequently, a novel direct computational fluid dynamics simulation approach was developed by integrating a custom-coded program into commercial software. Finally, through the numerical simulations of the circulation loop transient performance, the startup characteristics and flow states of different cooling mediums were intuitively obtained. The circulation capacity and cooling effects of different coolants were comparatively analyzed, providing a reference for the design of internal flow passages for transpiration cooling.
The schematic representation of the natural circulation system is illustrated in Fig. 1. Additionally, the three-dimensional configuration is depicted in Fig. 2. This system primarily comprises a rectangular water tank, two open pipe orifices, and U-shaped piping. The two pipe orifices ensure the continuity of injected liquid coolant and the continuous delivery of steam. The water tank dimensions are L 500 × W 80 × H 100 mm3, directly connected to the atmospheric environment, allowing the system to operate under ambient pressure. The U-shaped piping has a circular cross-section with an internal diameter of Φ = 10 mm and a solid pipe wall (lightweight aluminum alloy) thickness of δ = 1 mm. The entire piping consists of five parts: two vertical pipes (l1, l5), a horizontal pipe (l3), and two elbow pipes (l2 l4), where the vertical pipe length is l1 = l5 = 544 mm, the horizontal pipe length is l3 = 312 mm, and the elbow pipe inner and outer diameters are r = 44 mm and R = 56 mm, respectively. The U-shaped piping is centrally installed at the bottom of the water tank. Four commonly selected liquid cooling mediums are selected: liquid water, ethanol, fuel oil, and R113.

Figure 1: Schematic diagram of the natural circulation system

Figure 2: Schematic diagram of the U-shaped loop
Due to the involvement of phase change in different cooling mediums, using a three-dimensional model for calculations would consume a significant amount of computational resource and time. Therefore, to quickly obtain the flow and heat transfer characteristics of the two-phase fluid within the loop, a two-dimensional model is adopted for transient calculations. Given the significant temperature gradient observed within the pipe, it is crucial to account for both heat and mass transfer in these regions. The entire phase change process is primarily computed using the Volume of Fluid (VOF) multiphase flow model, which could capture the distinct water/air interface in reservoirs and track the generation, flow, and evolution of bubbles in the circuit. Besides, the self-programmed code serving as auxiliary tools to enable mass and energy exchange between liquid and gaseous coolants during phase transitions. The equations used in the fluid domain are detailed as follows:
Conservation of mass [29]:
where the
Mass source term:
where the
Momentum conservation [29]:
where the
SST k-ω turbulence model [30] is used to solve the Reynolds stress term:
the specific definitions of each term in the Standard k-ω turbulence model are found in ANSYS Fluent documents [31].
Energy conservation [29]:
where the E represents the internal energy of the fluid, and
The equation used in the solid domain is mainly the energy equation as follows [32]:
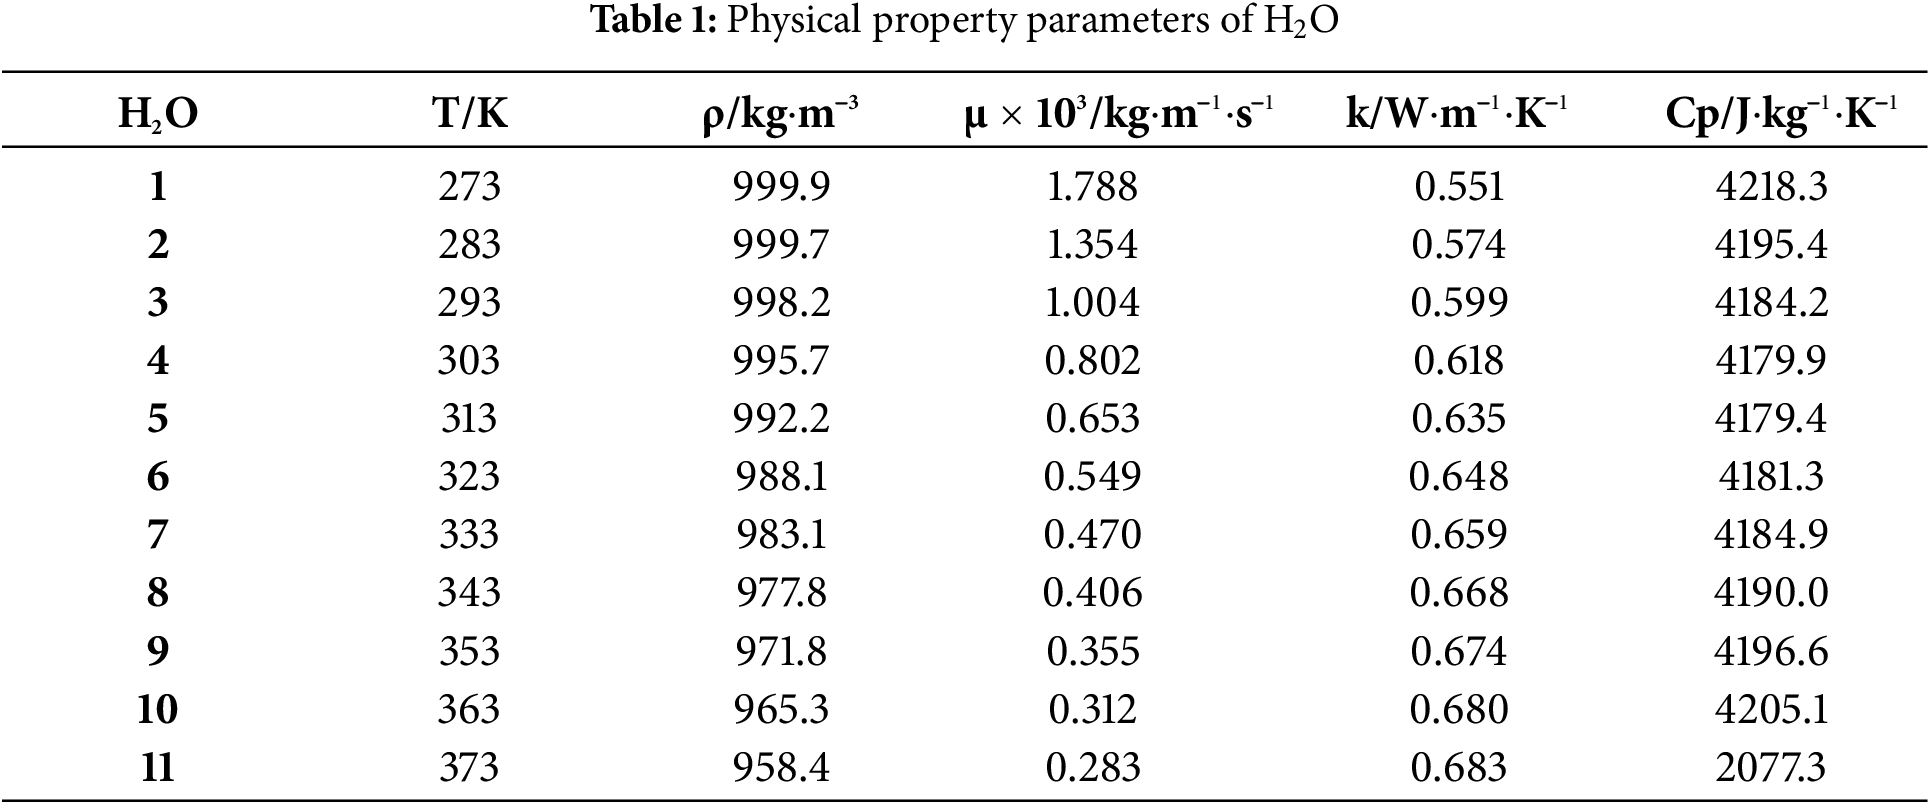
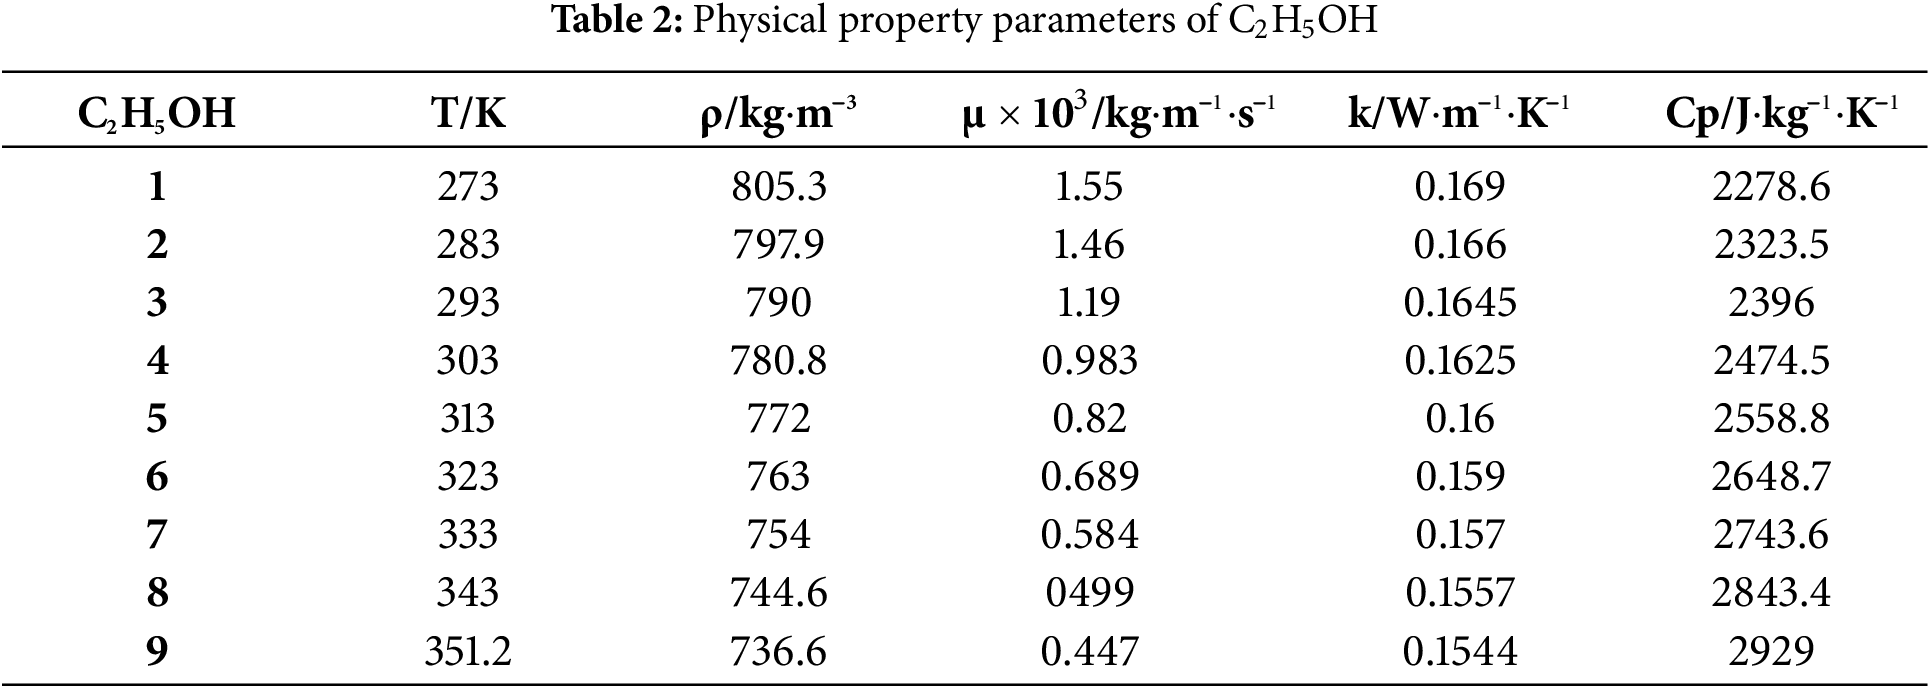
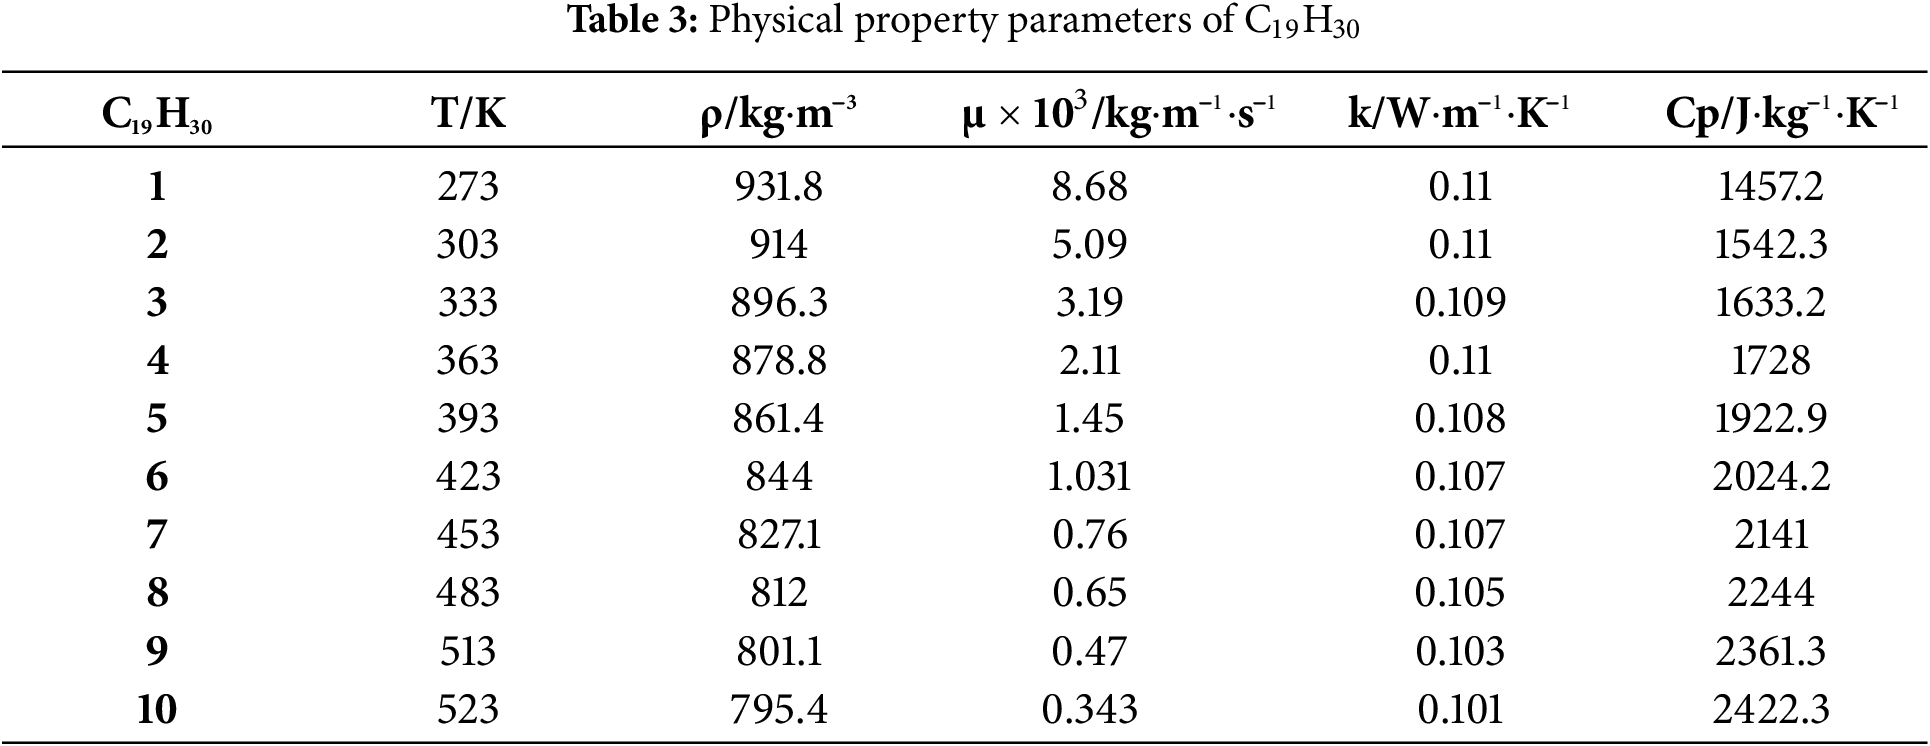
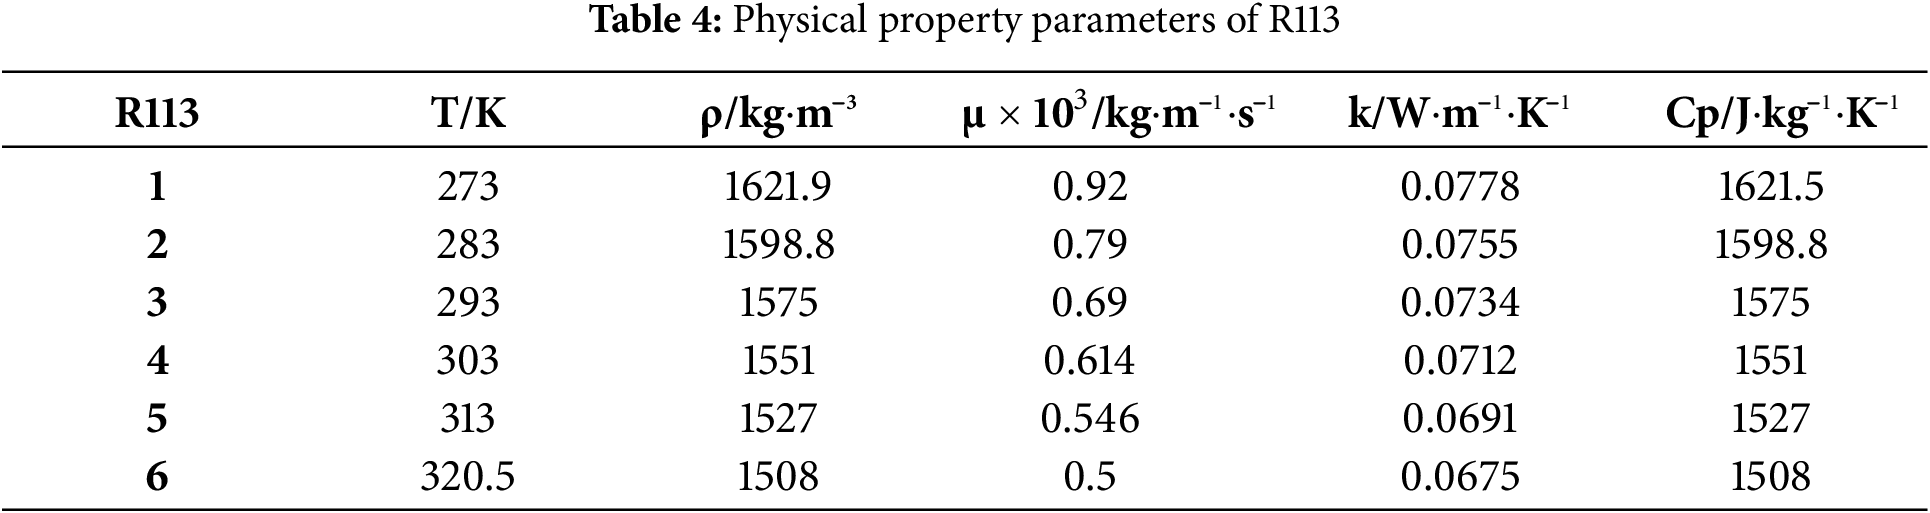
The NCS is driven by the density variation of fluid within different sections of the loop. Therefore, the changes in the physical properties of gas-liquid two-phase fluid, especially liquid fluid, cannot be ignored. Throughout the cooling process, the physical properties of liquid fluid do not vary significantly with pressure changes. Thus, the influence of temperature is mainly considered here. Within the temperature variation range of liquid fluid, enough temperature points are selected, and the density ρ, dynamic viscosity μ, thermal conductivity k, and specific heat capacity Cp of the liquid fluid at each temperature are calculated using piecewise linear fitting. The data source of physical properties for four mediums are obtained from the NIST, and their properties are shown in Tables 1–4.
3.3 Initial and Boundary Condition
Prior to heating and startup, the system maintains a static condition, featuring a cooling mediums level of h = 13 mm in the tank and an initial system temperature of Tsur. Given that the tank is directly exposed to the atmospheric environment, the upper surface of the tank is designated as a pressure outlet boundary with an outlet pressure of Pout = 1 atm. Upon heating and startup (t > 0 s), a constant heat flux (Q1, Q2) is employed for the external wall surface of the U-shaped piping.
3.4 Spatial and Temporal Step Sizes
Taking a two-dimensional model of a NCS as the focus of research, unstructured tetrahedral grides are generated for the model. Local grid refinement is implemented in areas near wall surfaces or at curved pipe sections where physical parameters undergo significant variations, as illustrated in Fig. 3a. To verify grid independence, calculations are conducted using three sets of grids with differing initial grid counts. Ensuring the accuracy of calculations is crucial. The height of the first grid layer is determined based on the constraint Y+ ≤ 1. There is a balance to be struck between grid size and computational efficiency: smaller grid distances can enhance the precision of the numerical solution but come at the cost of increased computational demands; larger grid distances may compromise precision but offer improved computational speed. Taking these considerations into account, the grid heights of the first layer adjacent to the wall are set at

Figure 3: (a) grid division and (b) grid independence verification
In transient VOF calculations, the Courant number plays a crucial role in determining both the precision and the computational efficiency of the results. It quantifies the relationship between the temporal step size and the spatial step size, defined as the product of fluid velocity (u) and temporal step size (
The study mainly focuses on numerical simulation, hence, the accuracy of the mathematical model and numerical calculation method need to be validated using experiment. Experimental methods and data from previous studies [33] were used for validation, and the experimental device is shown in the Fig. 4a. In the experiment, the model was heated using a heating plate, and the heating plate was split into two fully symmetrical sections, each individually linked to the control unit to guarantee independent heating capacity and temperature regulation for both plates. The transient temperature changes of the pipe wall were monitored and recorded using an infrared thermal imager. A 5.0 W continuous laser and a high-speed camera were employed to record flow of cooling mediums. With the operating condition of Tsur = 284 K and Q1 = Q2 = 10 kW/m2, the comparison of the trend of pipe wall temperature and the flow states at selected moments between experimental and numerical results is shown in Fig. 4. It can be observed that under the same operating condition, the calculated numerical results are in good agreement with the experimental results in terms of flow state change and temperature change, with a relative deviation of less than 3%. Therefore, it is concluded that the mathematical model and calculation method adopted in this chapter are effective.

Figure 4: (a) Experiment system and the trends of pipe wall temperature obtained by simulation and experiment [29], (b) The flow states at selected moments
4.1 Heat Transfer Deterioration Phenomena under Symmetrical Heat Flux Condition
To investigate the change in the flow state of different cooling mediums within the loop under constant heat flux condition on the pipe wall, transient numerical simulations are conducted under operating condition of Tsur = 300 K and Q1 = Q2 = 8 kW/m2. Based on previous research findings, the evolution of the flow state of liquid water within the loop under uniform heat flux condition could be divided into three stages: expansion stage, localized circulation stage, and phase change stage. Consistent with the flow state of water, when the heating duration is brief (t < 1 s), resulting in a minimal increase in wall temperature (
Fig. 5 displays the pressure, temperature, velocity, and phase distribution of four cooling mediums at t = 1 s. Among them, the R113 has the highest pressure within the pipe, exceeding 6000 Pa in the horizontal segment pipe, followed by the water, while the ethanol has the lowest pressure within the pipe, about 5000 Pa. This is related to the fluid’s density and heat absorption capacity. During the initial heating stage, the temperature rise of the fluid is small, resulting in insignificant changes in its density. Therefore, the greater density of the fluid, the higher the pressure observed in the horizontal segment of the pipeline. At this point, the liquid water is still in an expansion state. The three additional cooling media, ethanol, fuel oil, and R113 demonstrate increasing axial and radial temperature differences inside the pipe as a result of their rapid temperature increase and significant density variations with rising temperature. Gravity and buoyancy working together create a localized circulatory flow inside the vertical pipe, where fluid descends close to the center and ascends near the wall. This circulation initiates in the pipe’s midsection and gradually spreads towards both the orifice and the elbow over time. As a result, the turbulence intensity in the fluid flow surrounding the orifice is increased. The specific heat capacity of R113 is less than half that of water and thus experiences the fastest temperature rise, combined with low fluid viscosity, resulting in the highest local circulation speed. The fuel oil does not form a circulation in the elbow and the bottom horizontal pipe due to its greater flow resistance, for its viscosity is 5–8 times higher than other cooling mediums at low temperatures. Additionally, the elbow increases the turbulence level of the fluid within the pipe, resulting in irregular flow. During this stage, the flow velocities of the four cooling mediums are very slow, ranging from 1 × 10⁻⁴ to 1 × 10⁻⁶ m/s, with the maximum velocity occurring near the vertical pipe orifice. In summary, due to differences in temperature rise rates and viscosities among different cooling mediums, the time cycles for the evolution of their flow states exhibit slight differences.
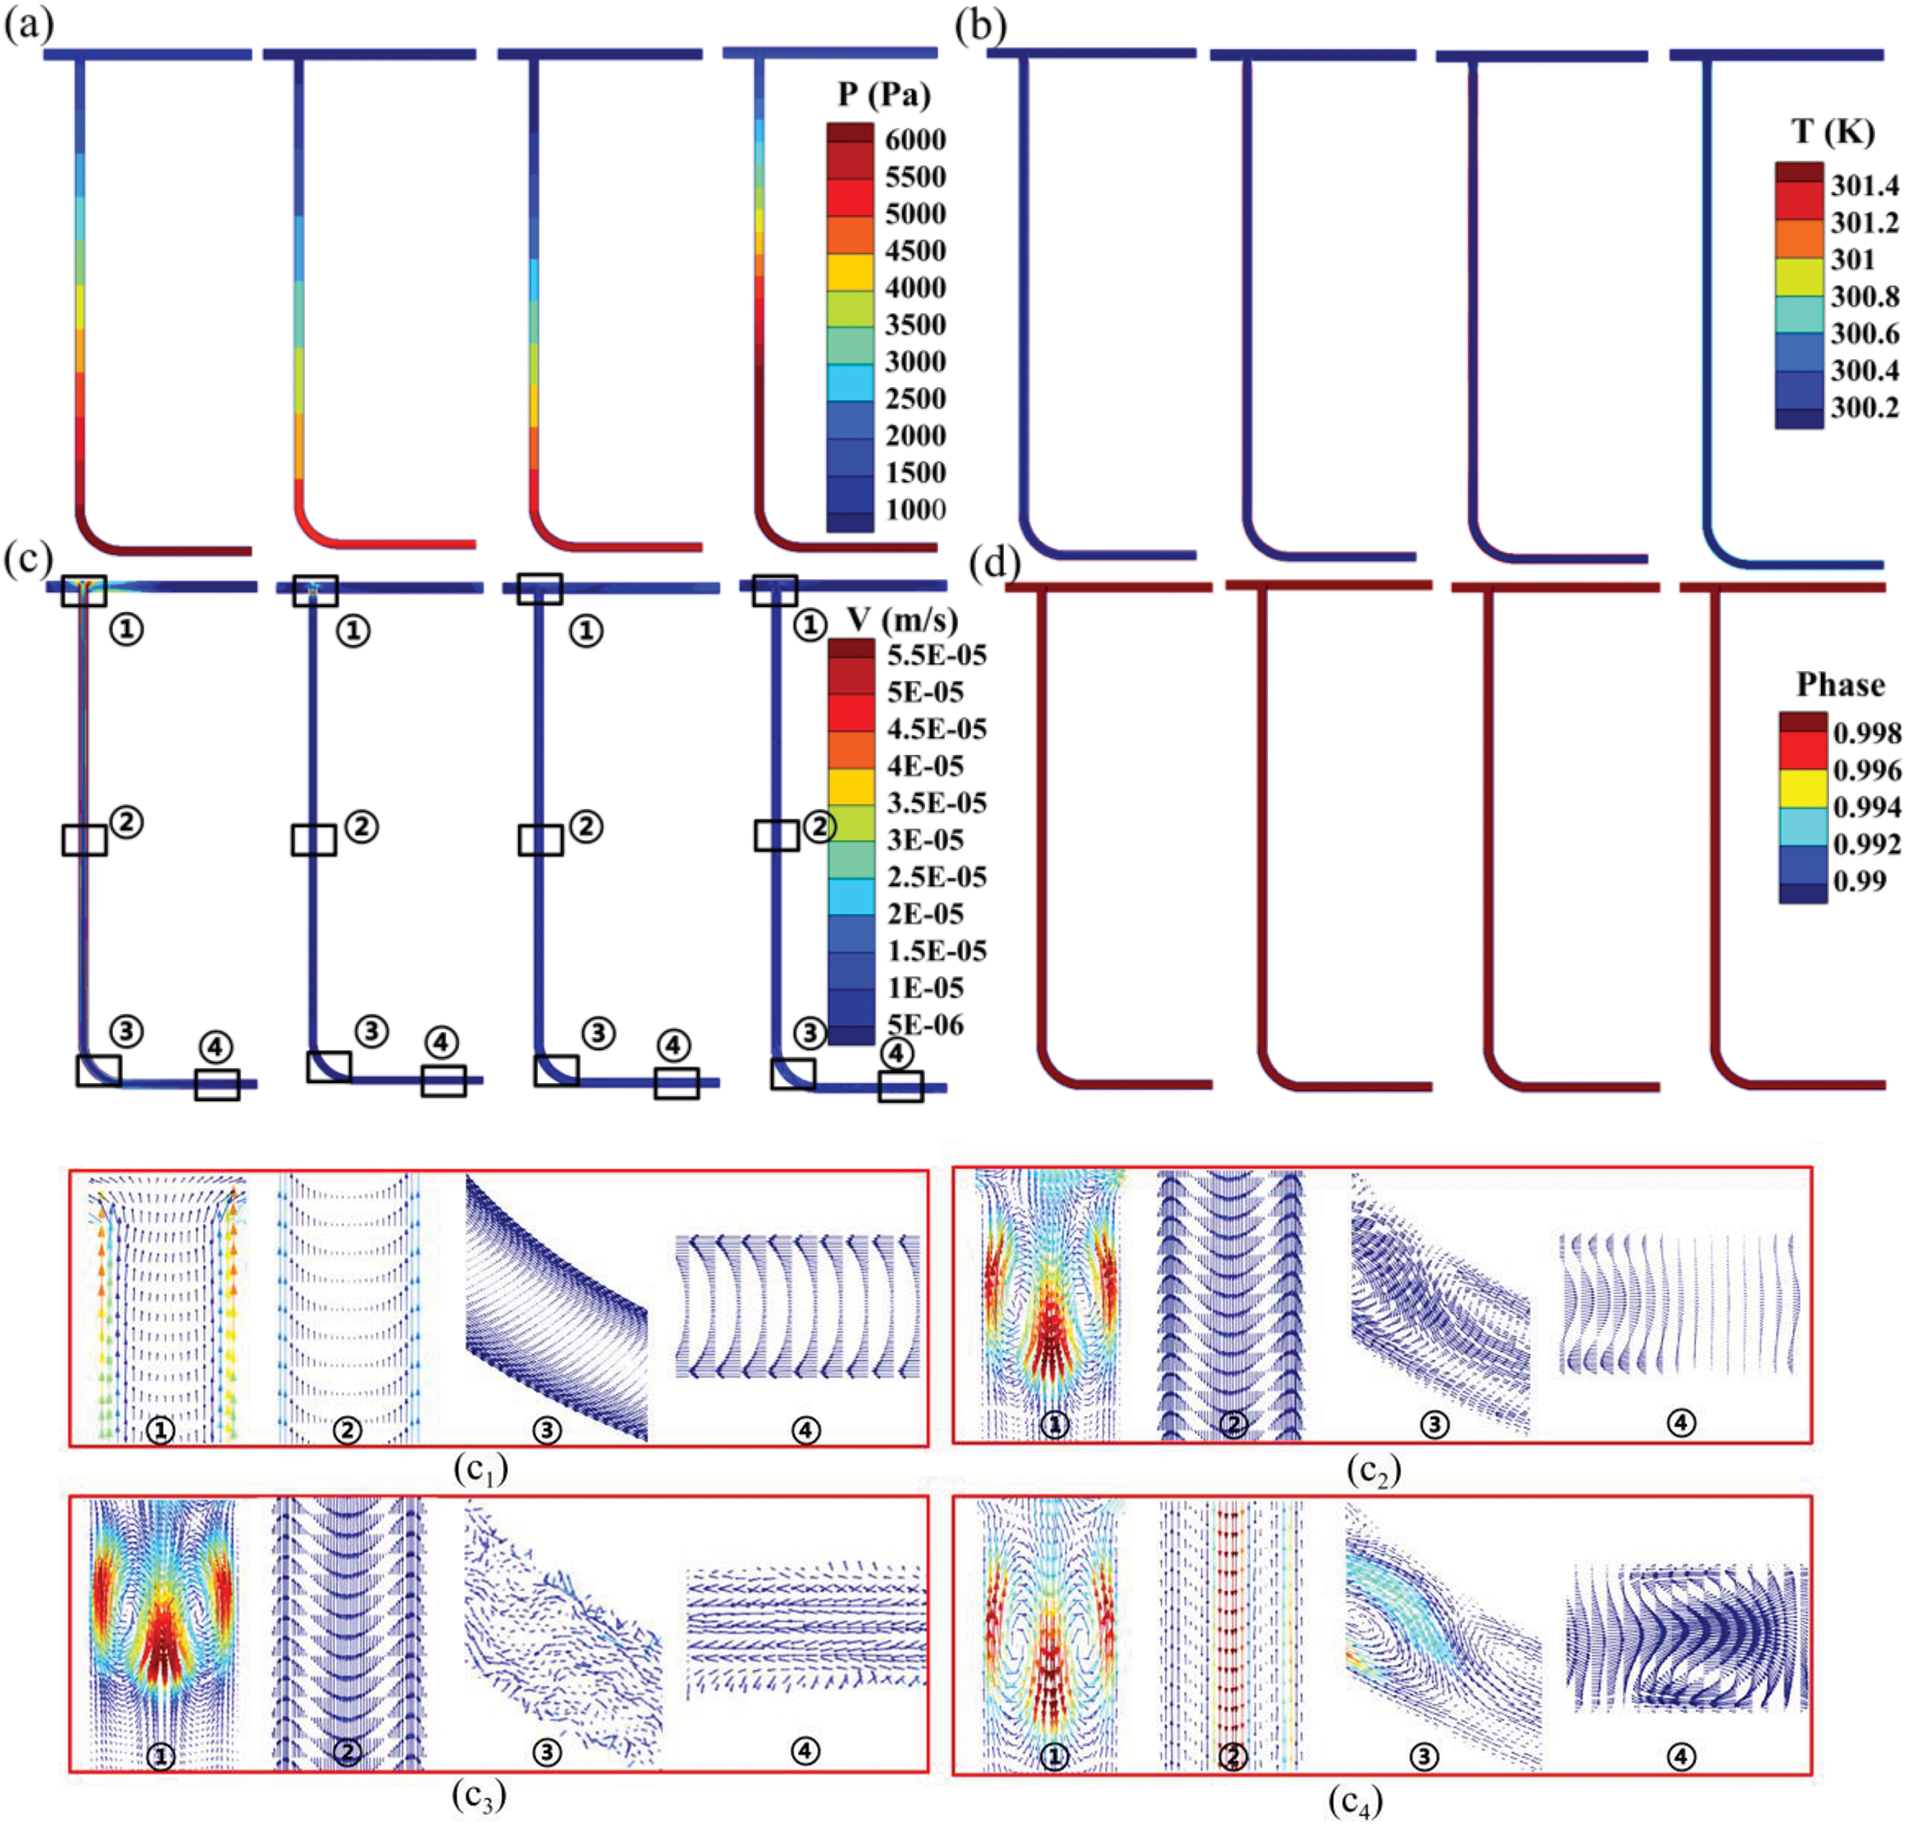
Figure 5: t = 1 s (a) pressure, (b) temperature, (c) velocity and (d) phase distribution of four cooling mediums (water (C1), ethanol (C2), fuel oil (C3) and R113 (C4) from left to right)
As the temperature of the solid wall further increases, Fig. 6 depicts the velocity streamline diagrams and the flow law of four cooling mediums within the pipes at t = 10 s, respectively. Fig. 7 displays the heat flux distribution on the pipe wall at the same time. At t = 10 s, the pressure distributions of the four cooling mediums undergo minimal changes, and the temperature increase is also insignificant. At this point, it can be observed that liquid water has entered a localized circulation state. Liquid water has high thermal conductivity, and its flow speed is accelerated with the occurrence of localized circulation, so it exhibits strong heat exchange capability with the wall. Consequently, the wall heat transfer rate reaches up to 6100 W/m2. Ethanol flows rapidly at the pipe orifice and remains in a localized circulation state. This is because as the fluid temperature within the pipe rises, the fluid exits the orifice and exchanges with fluid in the reservoir. However, within the vertical pipe, the flow velocity is lower, and most of the fluid flows in the opposite direction, resulting in an overall wall heat flux that is only 1/3 of that of liquid water. The fuel oil experiences a rapid temperature rise because of the smaller specific heat capacity. Due to its high viscosity and significant flow resistance, the buoyancy force generated is insufficient to overcome the shear force in the boundary layer. Therefore, it exhibits irregular flow within the pipe. Furthermore, the fuel oil has low thermal conductivity and low overall flow velocity, with the overall flow velocity below 0.001 m/s except at the elbow. Consequently, the heat exchange capacity between the fuel oil and the solid wall is relatively weak, showing a wall heat transfer rate of 2800 W/m2. The R113 has rapid temperature increase and low viscosity, experiencing low flow resistance and showing an overall flow velocity less than 0.0025 m/s. Moreover, the thermal conductivity of the R113 is only about 1/10 of that of liquid water. Therefore, there exists localized circulation with greater turbulence intensity within the pipe, enhancing its heat exchange capacity. The overall wall heat transfer rate reaches 4300 W/m2. In summary, during the initial heating stage, the viscosity and thermal conductivity of the fluid affect the duration of localized circulation, which in turn increases the flow velocity and enhances the heat exchange between the cooling medium and the solid wall.
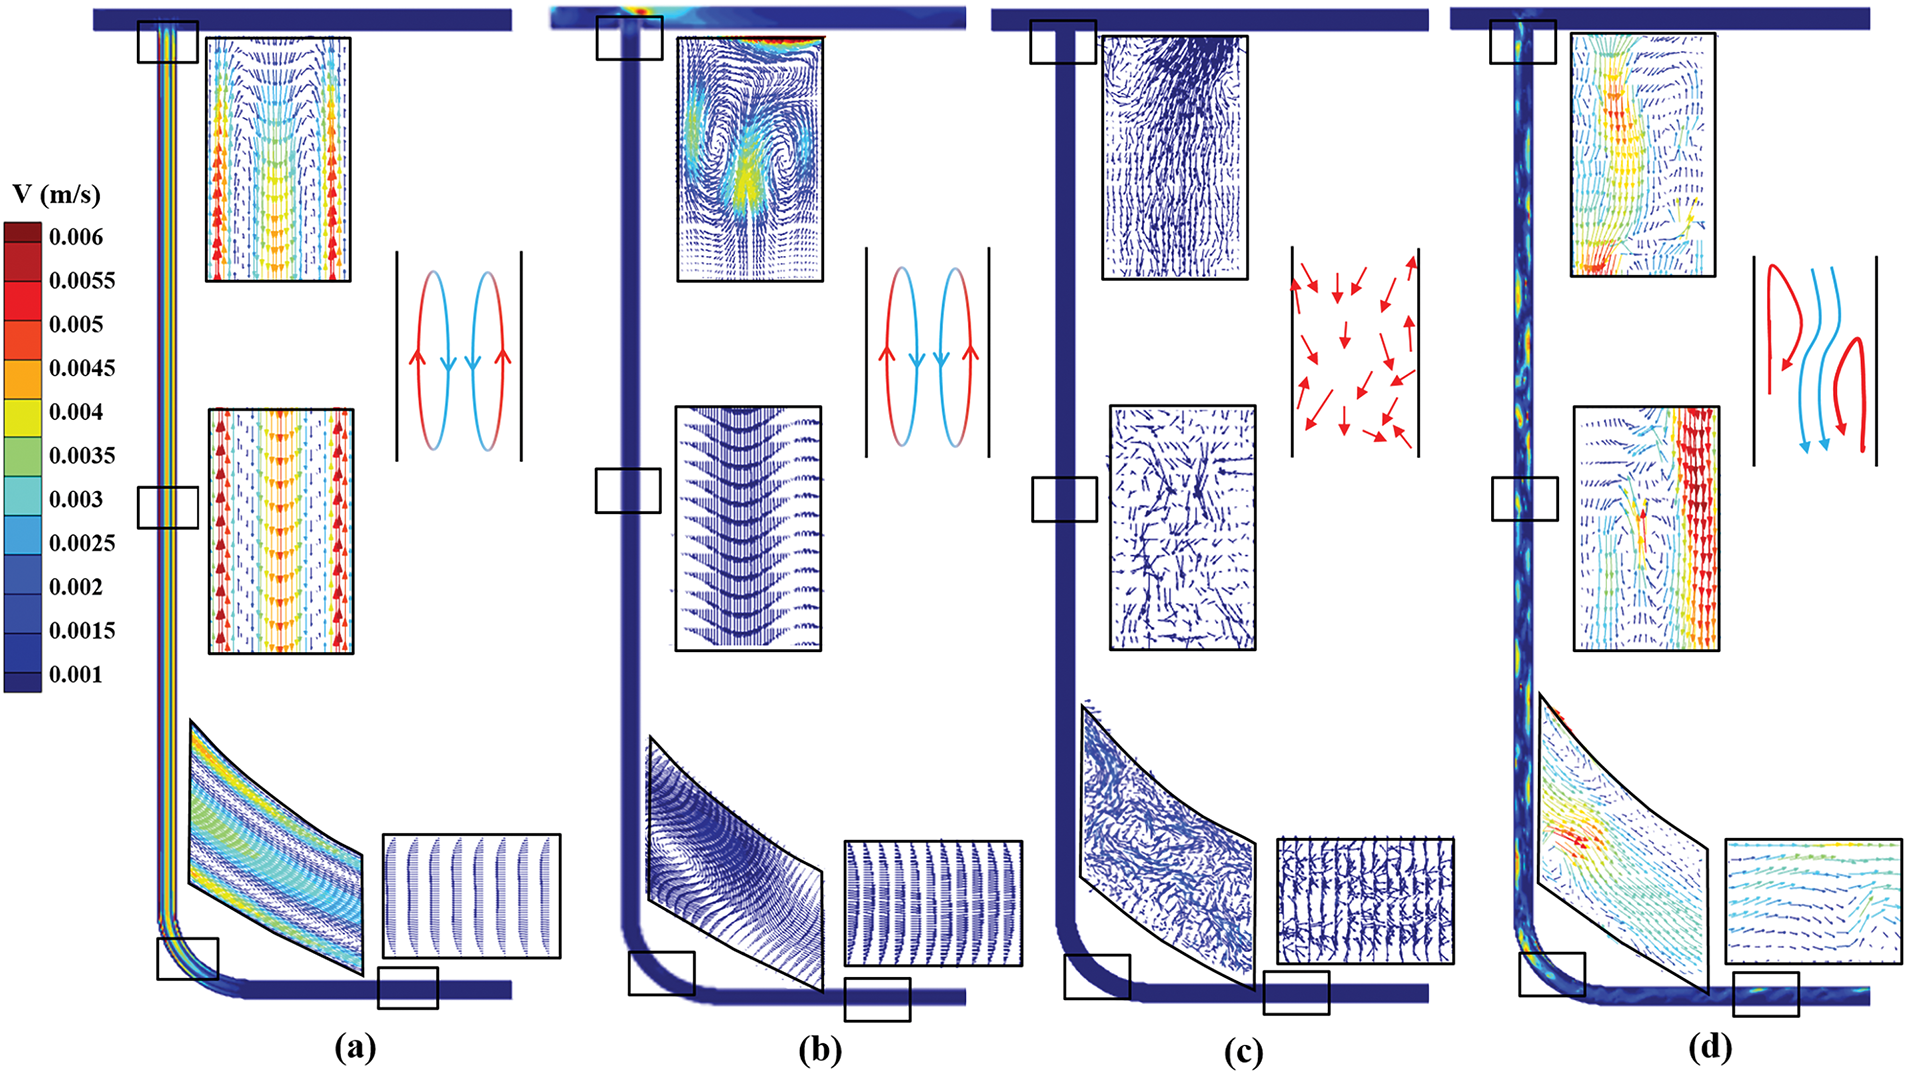
Figure 6: t = 10 s velocity distribution of four cooling mediums (a) water, (b) ethanol, (c) fuel oil and (d) R113

Figure 7: t = 10 s heat flux distribution on the right pipe wall of the four cooling mediums
Fig. 8 presents the pressure, temperature, velocity, and phase distribution of four fluids within pipes at t = 60 s. As the fluid temperature further increases, the pressure of all four cooling mediums decreases, with the maximum drop reaching 1000 Pa. R113 experiences the fastest temperature rise and reaches the highest temperature, approximately 320 K. Liquid water, due to its high specific heat capacity, experiences the slowest temperature rise and remains the lowest in temperature. Additionally, Fig. 8b displays the temperature distribution, all four cooling mediums exhibit lower temperatures in part of the fluid at the elbow, which caused by higher turbulence dissipation at these locations. During this stage, due to its slow temperature rise, liquid water continues to flow in localized circulation within the pipe, and its flow velocity is relatively fast due to the presence of temperature difference. R113 has a relatively low phase transition temperature and a rapid temperature rise and enters the initial phase transition stage, generating tiny bubbles. This further reduces the fluid’s density and viscosity, resulting in the fastest flow velocity, with a center velocity exceeding 0.01 m/s. As the bubbles rise, the fluid flows uniformly towards the pipe orifice. Ethanol, the specific heat is half that of water, and the thermal conductivity is more than twice that of water, resulting in fast temperature rise and small temperature difference. Hence, the density difference formed by the temperature difference is not enough to drive the local circulation. Additionally, the fluid density further decreases upon heating because of its lower pressure within the pipe. At the moment depicted in Fig. 8c, the inflow of the cooling medium from the reservoir results in the fluid within the vertical pipe flowing in the opposite direction. In the next moment, as the fluid within the pipe expands, the overall flow within the vertical pipe shifts towards the pipe orifice, exhibiting irregular overall flow. The fuel oil has high viscosity, and thus remains in an extremely irregular flow state, with high turbulence intensity and relatively fast flow velocity at the elbow pipe. As the heating time progresses, the velocities of all four cooling mediums increase, and the maximum velocity reaches 1 × 10⁻² m/s. In summary, as temperature rises, the thermophysical properties of cooling mediums have a significant impact on the changes in fluid flow states.
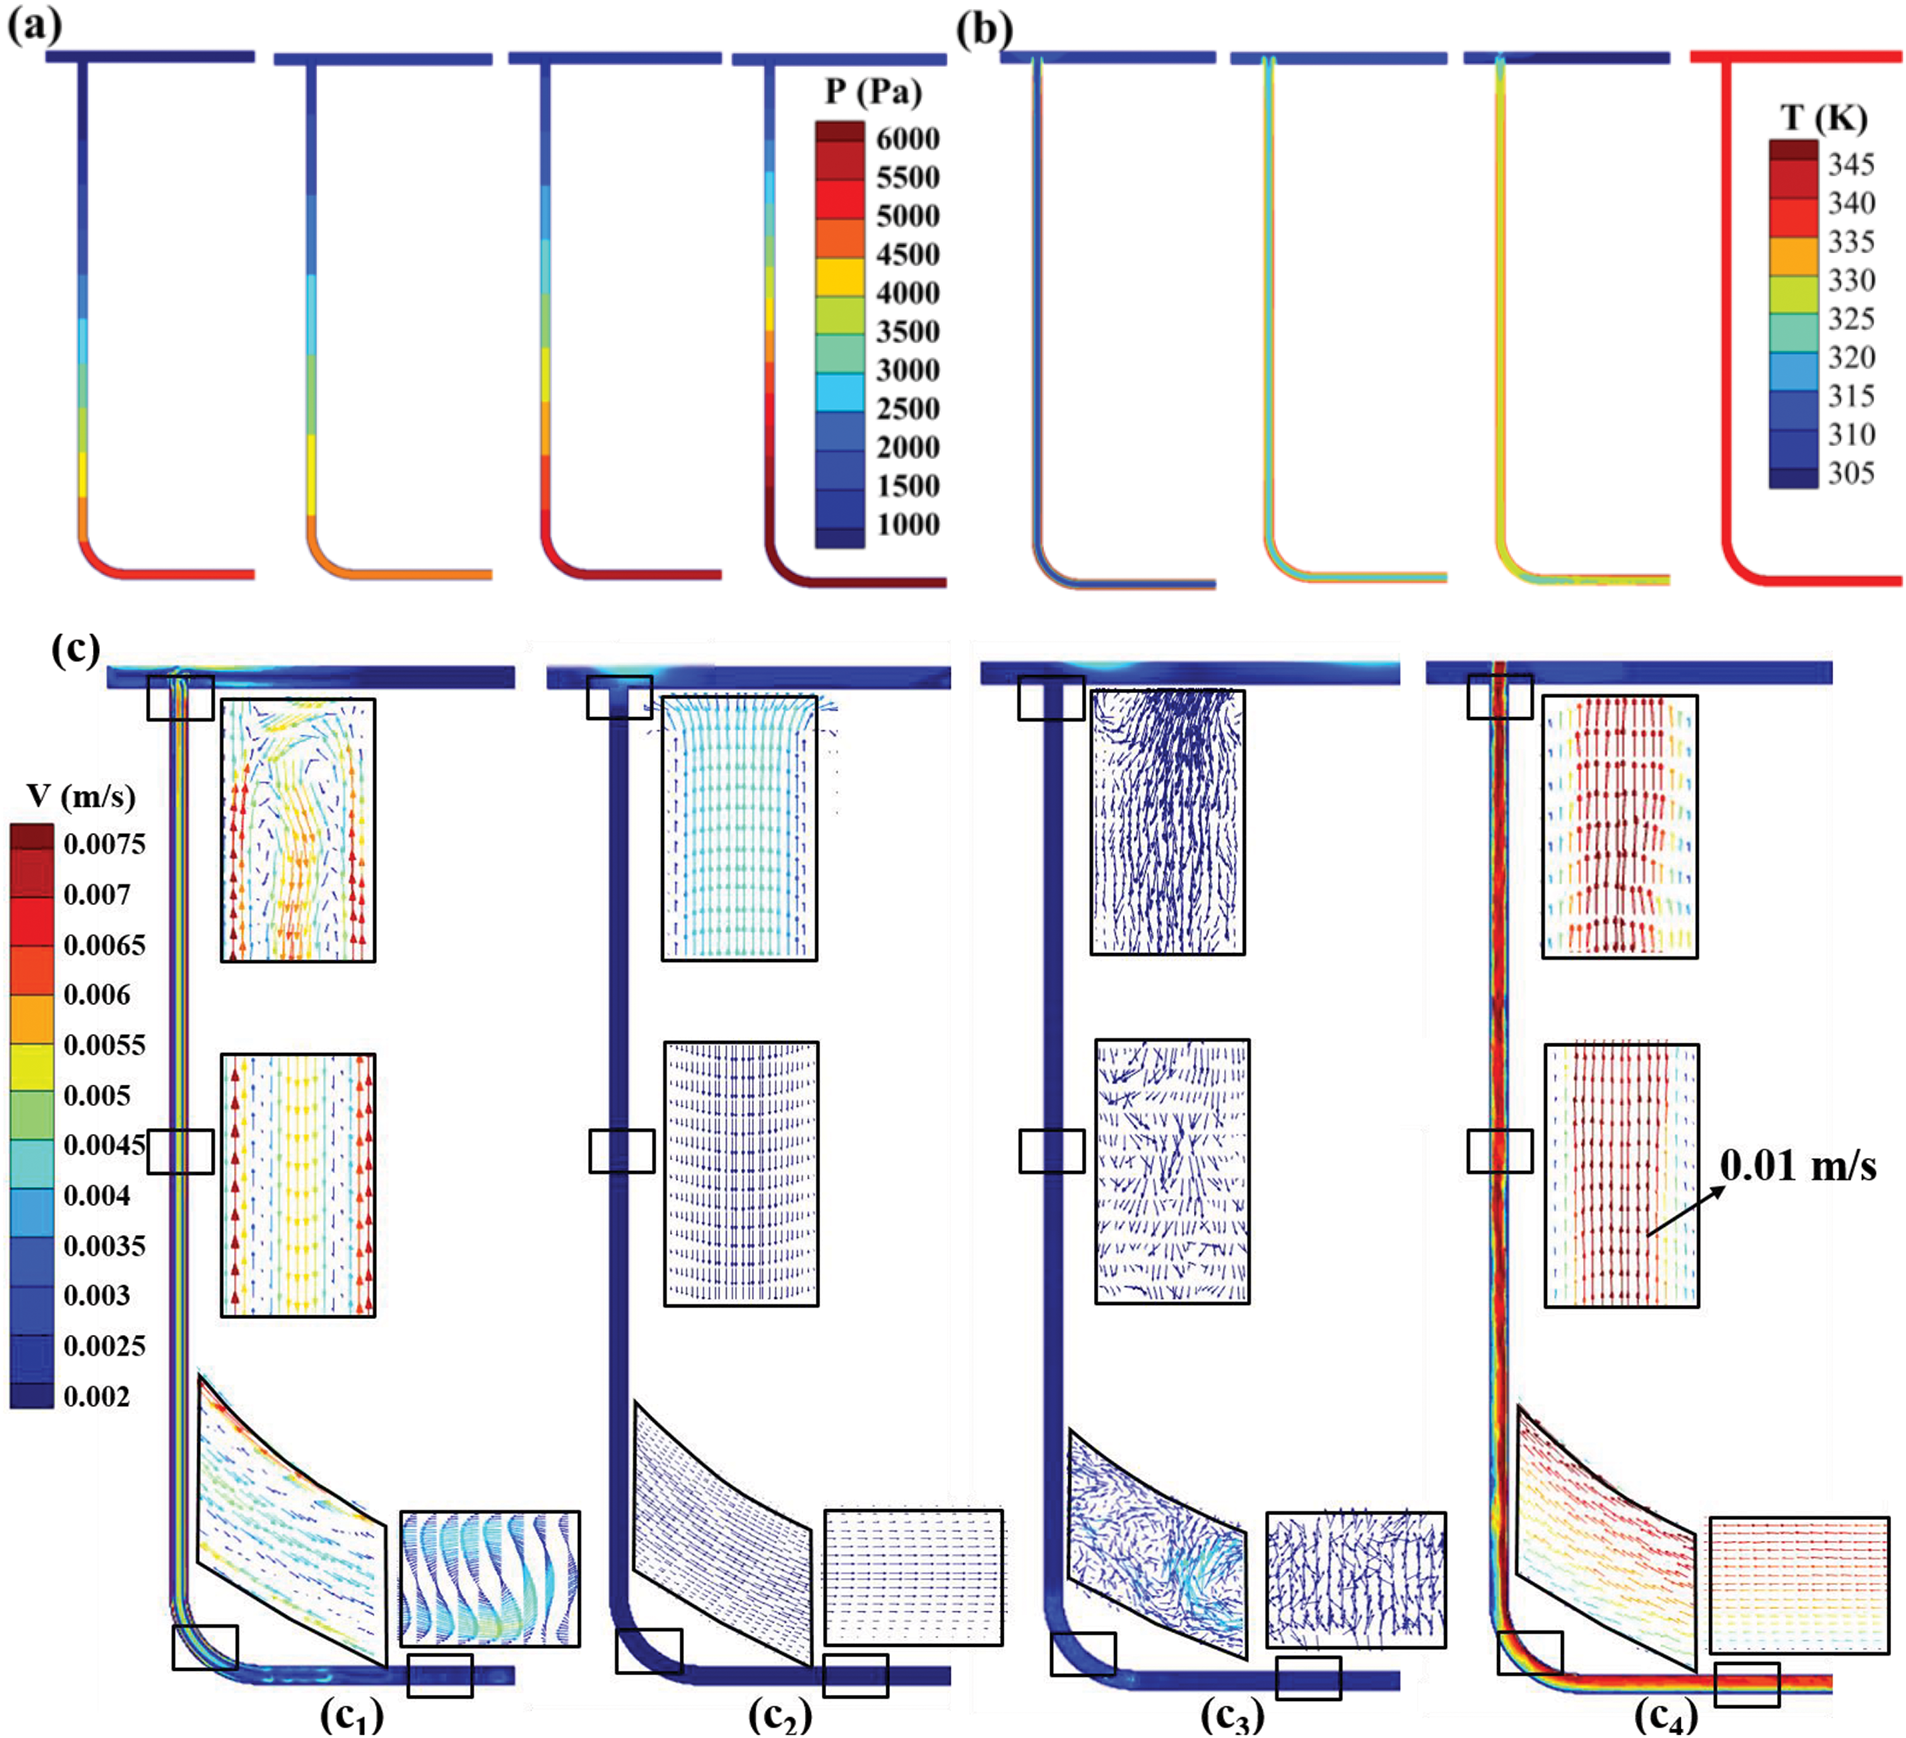
Figure 8: t = 60 s (a) pressure, (b) temperature and (c) velocity of four cooling mediums (water (C1), ethanol (C2), fuel (C3) and R113 (C4) from left to right)
Due to the differences in phase change temperatures and temperature rise rates among the four cooling mediums, the time required for each to reach its phase change state is different. The latent heat of phase change and the specific time points of phase change are shown in Table 5. Once the four liquid cooling media reach their respective phase change temperatures, small bubbles initially emerge in the center of the vertical pipe, slowly expanding and coalescing as time passes. These bubbles then swiftly ascend and exit through the pipe orifice due to buoyancy. Fig. 9 illustrates the pressure, temperature, velocity, and phase distribution of the fluids within the pipe 30 s after each of the four cooling media undergoes phase change. The presence of an elbow in the pipe results in complex flow patterns and high turbulence intensity within the horizontal pipe segment. Consequently, despite the upper wall of the horizontal pipe experiencing the quickest temperature increase, bubbles first become apparent in the middle of the vertical pipe because of the relatively lower turbulence levels present. Furthermore, during the liquid-to-gas phase transition, the fluid undergoes rapid expansion, leading to a significant increase in flow velocity, which can exceed 10−1 m/s. Observing the velocity vector diagrams at different locations within the pipes of the four cooling mediums reveals that the velocity changes are relatively drastic at the locations where bubbles form, indicating that the fluid motion intensifies due to the phase change of the liquid. The fuel oil has a higher phase change temperature and undergoes the most intense phase change, resulting in a significant reduction in viscosity, and the local fluid velocity of fuel oil reaches as high as 1 m/s. Ethanol has lower density and viscosity, and hence has the second-fastest flow rate after fuel oil, which local fluid velocity reaches to 0.4 m/s. R113 has lowest phase change temperature and highest fluid density, leading to the slowest flow rate, about 0.2 m/s. In summary, the intensity of the phase change is closely related to the fluid’s phase change temperature. The higher the phase change temperature, the greater the flow velocity and the more intense the heat transfer. Moreover, in the two-phase state, the viscosity of the liquid fluid has a minor impact on the flow velocity.
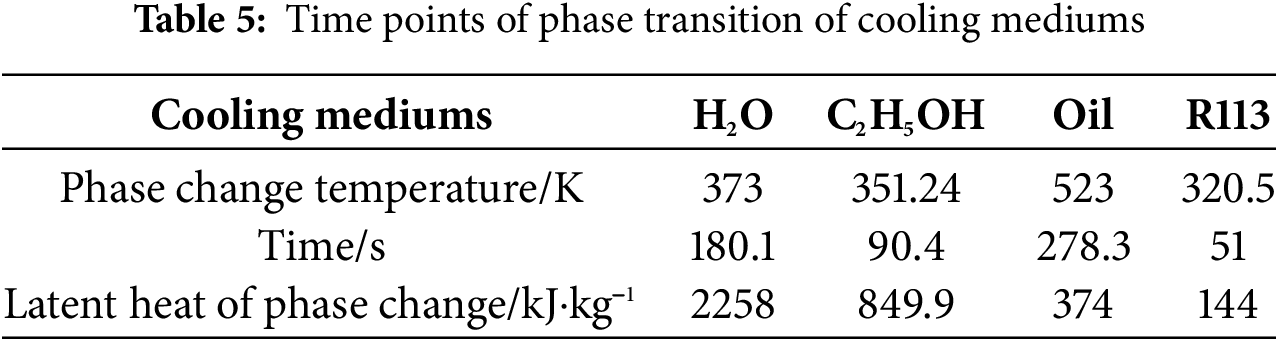
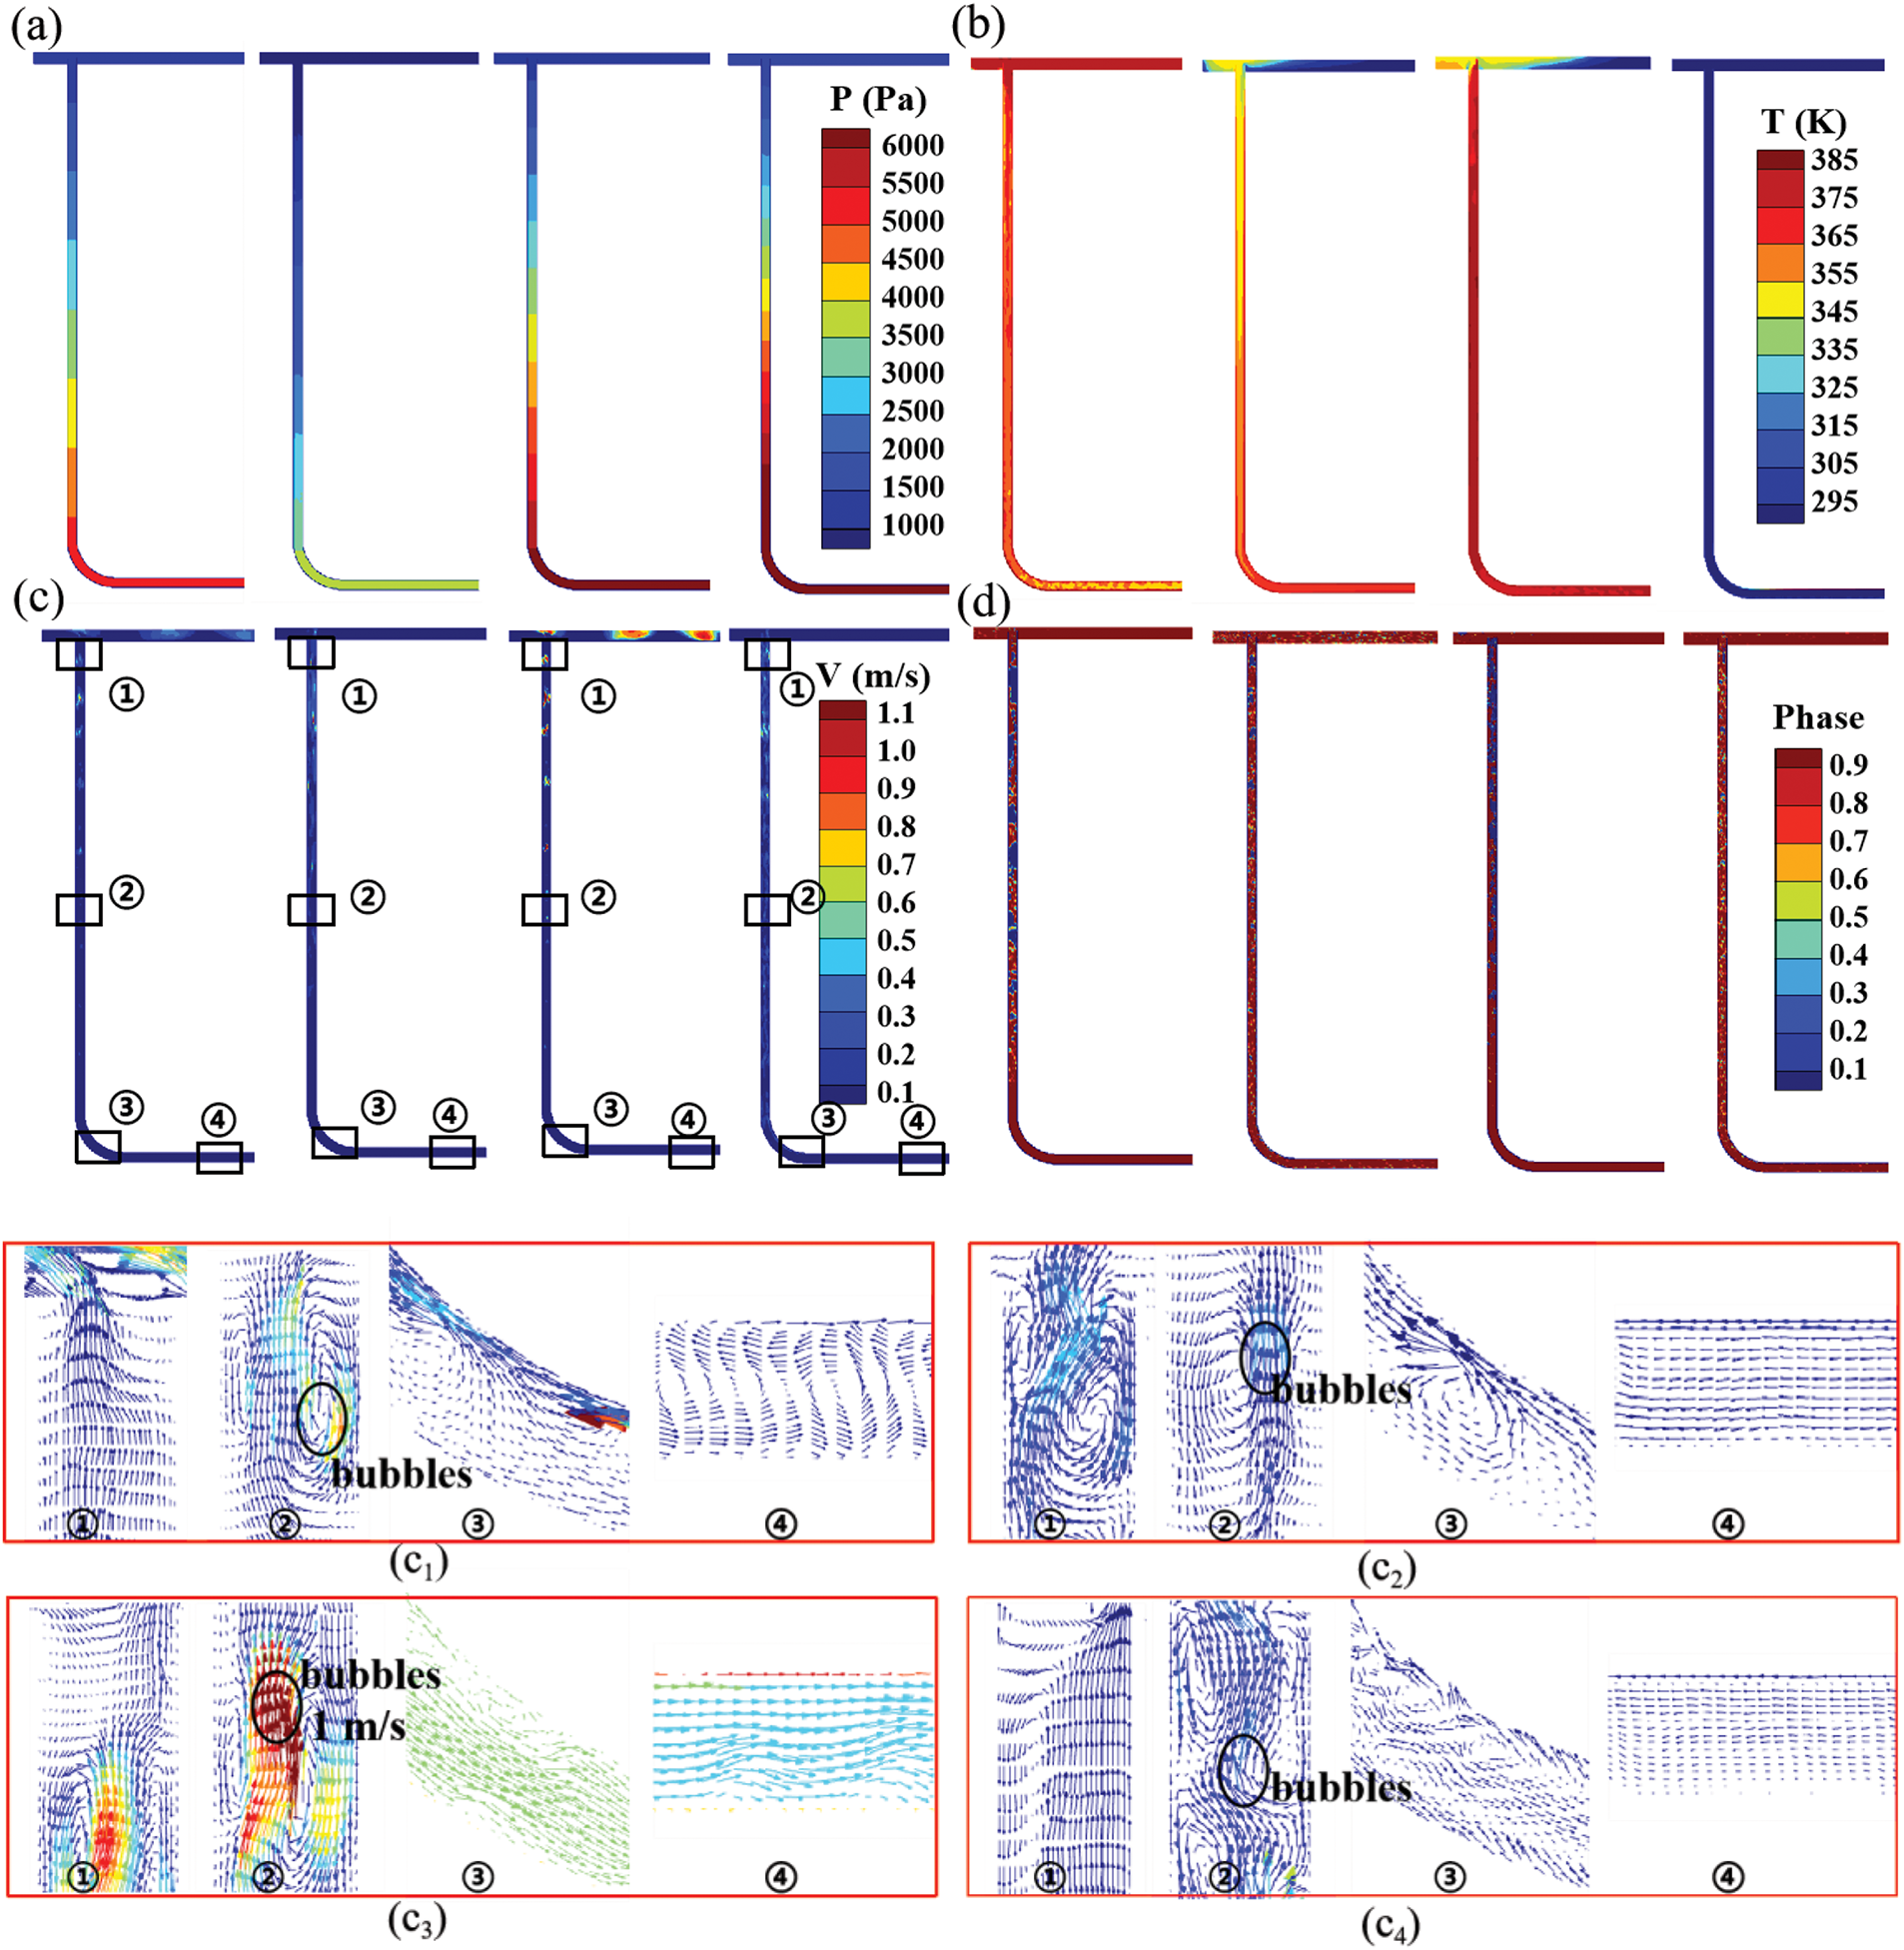
Figure 9: (a) pressure, (b) temperature, (c) velocity and (d) phase distribution of four fluid cooling mediums (water (C1), ethanol (C2), fuel oil (C3) and R113 (C4) from left to right) 30 s after phase transformation
To investigate the heat transfer between the fluid inside the pipe and the solid wall at this point, Fig. 10 presents the distribution of fluid-solid heat transfer and volume fraction of liquid cooling mediums in the right side of vertical pipe. When the liquid cooling medium volume fraction ranges from 0 to 1, the liquid cooling medium undergoes a phase change during this period, releasing substantial latent heat of phase change and enhancing heat exchange with the solid wall. Hence, the maximum wall heat transfer rate for water, ethanol, fuel oil and R113 can reach approximately 11, 12.5, 30, and 10 kW/m2, respectively. The magnitude of wall heat transfer is related to the fluid’s temperature, velocity, and latent heat of phase change. Fuel oil has the highest phase change temperature and the fastest flow velocity. Although the phase change latent heat of fuel oil is only 374 kJ/kg, its wall heat transfer rate is still the highest. Ethanol has the second-fastest flow velocity and the second-highest heat transfer rate about 7500 W/m2, but due to the significantly lower phase change temperature, its wall heat transfer rate is far behind fuel oil. This indicates that flow velocity is one of the main factors influencing heat transfer rate. R113 has the slowest flow velocity and extremely low latent heat of phase change, resulting in the lowest wall heat transfer rate. Although the latent heat of phase change of liquid water is 10 times that of fuel oil, its wall heat transfer rate is not prominent among the four cooling mediums due to differences in phase change temperature and flow velocity. When the liquid cooling medium volume fraction drops to 0 and the wall is completely occupied by the vapor region, the fluid-solid heat transfer rate drops sharply. At this point, the external heat absorbed by the solid wall (Q) will be much greater than the heat absorbed and carried away by the internal cooling medium from the solid wall. This results in a rapid increase in the local wall temperature, leading to localized overheating. Moreover, due to the pipe orifice’s connection to the reservoir, the fluid temperature, enhanced by bubble expansion, is greater than the wall temperature at the orifice. Consequently, the heat transfer rate between the fluid and the solid near the outlet (−0.1 < Y < 0 m) drops drastically to a negative value, signifying a shift in heat transfer direction from the fluid to the solid. However, due to the small difference in specific heat capacity between the other three liquid cooling mediums and the quartz glass pipe wall, the temperature difference between the fluid and the solid wall during heating is not significant, and therefore no obvious heat transfer deterioration occurs at the pipe orifice. In summary, the influence of fluid velocity on the heat transfer rate between the fluid and the solid wall is greater than that of the fluid’s latent heat of phase change, and by reasonably regulating the thermophysical properties of the fluid, some instances of heat transfer deterioration can be avoided.

Figure 10: Distribution of heat flux on the inner wall of the vertical pipe and liquid volume fraction 30 s after phase change: (a) water, (b) ethanol, (c) fuel oil, and (d) R113
4.2 Circulation Flow Phenomena under Asymmetric Heat Flux Condition
To address the issues of heat transfer deterioration and localized temperature rise caused by bubble blockage under uniform heat flux condition, an investigation is conducted on asymmetric heat flux condition, i.e., enhancing the heat flux on the right-side l2 pipe wall. Transient calculations are performed under the condition of Tsur = 300 K, Q1 = 8 kW/m2, and Q2 = 8.01 kW/m2. Fig. 11 illustrates the wall heat flux on the right-side pipe wall of four cooling mediums after 10 s of heating. The figure reveals that the relative strength of heat transfer among the four cooling mediums remains unchanged. However, the difference of heat flux between the pipes on both sides causes a density difference in the fluid, which subsequently forms a pressure difference, increasing the fluid flow velocity. Consequently, the heat transfer rate of all four cooling mediums at this point is greater than that when the heat flux is uniform on both sides of the pipe, with a maximum increase of 1100 W/m2. Fig. 12 depicts the velocity vector diagrams of the four cooling mediums within the vertical pipe at 30 s of heating. Due to the pressure difference between the pipes on both sides, the heat exchange between hot cooling medium within the pipe and the cold cooling medium in the reservoir is enhanced. Therefore, the temperature of cooling mediums within the pipe rises slowly. Liquid water and R113 exhibit varying degrees of localized circulation. The R113 has low viscosity and significant density change with temperature, and hence experiences violent localized circulation within the pipe, with faster flow velocity and higher wall heat transfer rate up to 3000 W/m2. Ethanol has rapid temperature rise rate, low density, and significant density change with the increase of temperature, and thus the pressure difference arising from density difference can overcome its own gravity, forming a counterclockwise overall circulation. The fuel oil has fast temperature rise rate and high viscosity, and thus does not exhibit localized circulation. The fluid within pipes on both sides expands towards pipe orifice, and flow velocity in the right pipe is twice as fast as that in the left. However, due to the small difference in heat flux between the pipes on both sides, the pressure difference is insufficient to overcome the force of gravity, preventing the formation of an overall circulation within the pipe. In summary, different fluid requires different heat flux differences to drive overall circulation due to their distinct densities and magnitude of the density change with the increase of temperature.
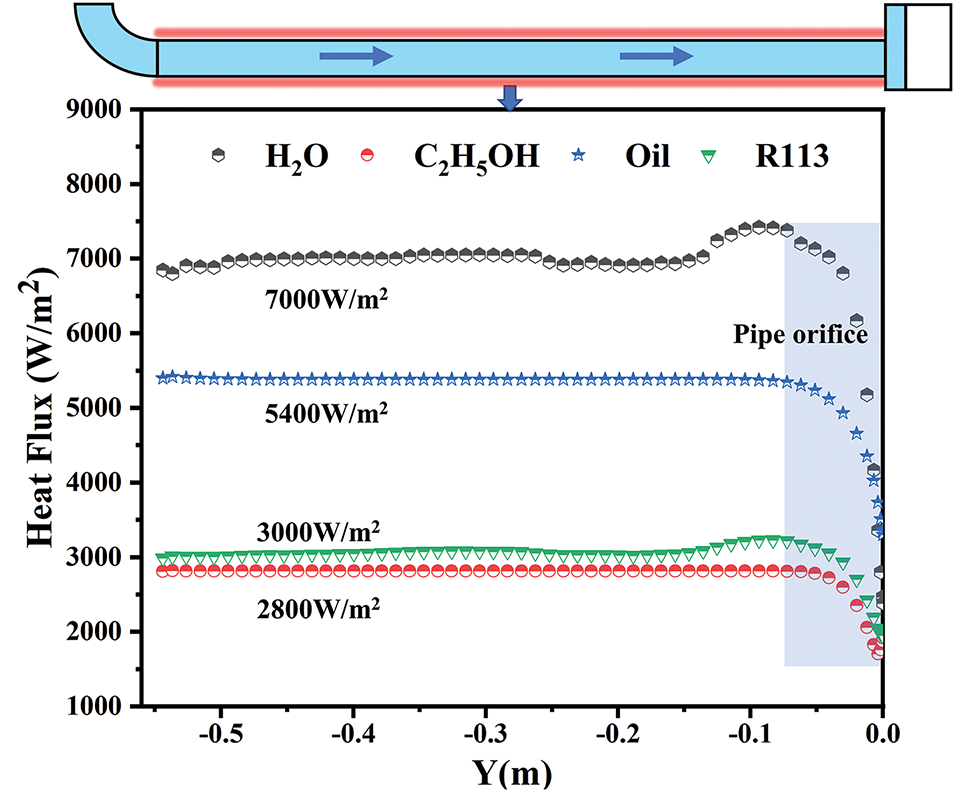
Figure 11: t = 10 s heat flow distribution on the wall of four kinds of cooling mediums

Figure 12: t = 30 s velocity vector diagrams of four cooling mediums (a) water, (b) ethanol, (c) fuel oil and (d) R113
When the fluids are heated to the phase change temperature, the distributions of fluid-solid heat transfer and liquid volume fraction on the inner wall of the right vertical pipe of the four cooling mediums are shown in Fig. 13. Due to the presence of a heat flux difference and an increase in heat flux, the times for liquid water, ethanol, fuel oil, and R113 to reach their phase change points advance to 160, 79, 235, and 39 s, respectively. Meanwhile, the existence of the heat flux difference enhances the flow velocities of all four cooling mediums, resulting in higher heat transfer rates during the phase change state compared to uniform heat flux condition. Hence, the maximum wall heat transfer rate for water, ethanol, fuel oil, and R113 can reach 12, 17, 31, and 13 kW/m2, respectively. Furthermore, the phase changes of the four cooling mediums become more intense, with a relative decrease in the liquid volume fraction and a narrowing of the heat flux fluctuation range. Additionally, the heat exchange between the fluid in the reservoir and the fluid at the pipe orifice increases due to the pressure difference, mitigating the heat transfer deterioration at the pipe orifice. Therefore, even though the magnitude of the heat flux difference is insufficient to drive an overall circulation of the fluid, it can still enhance fluid-solid heat transfer and reduce the phenomenon of heat transfer deterioration.
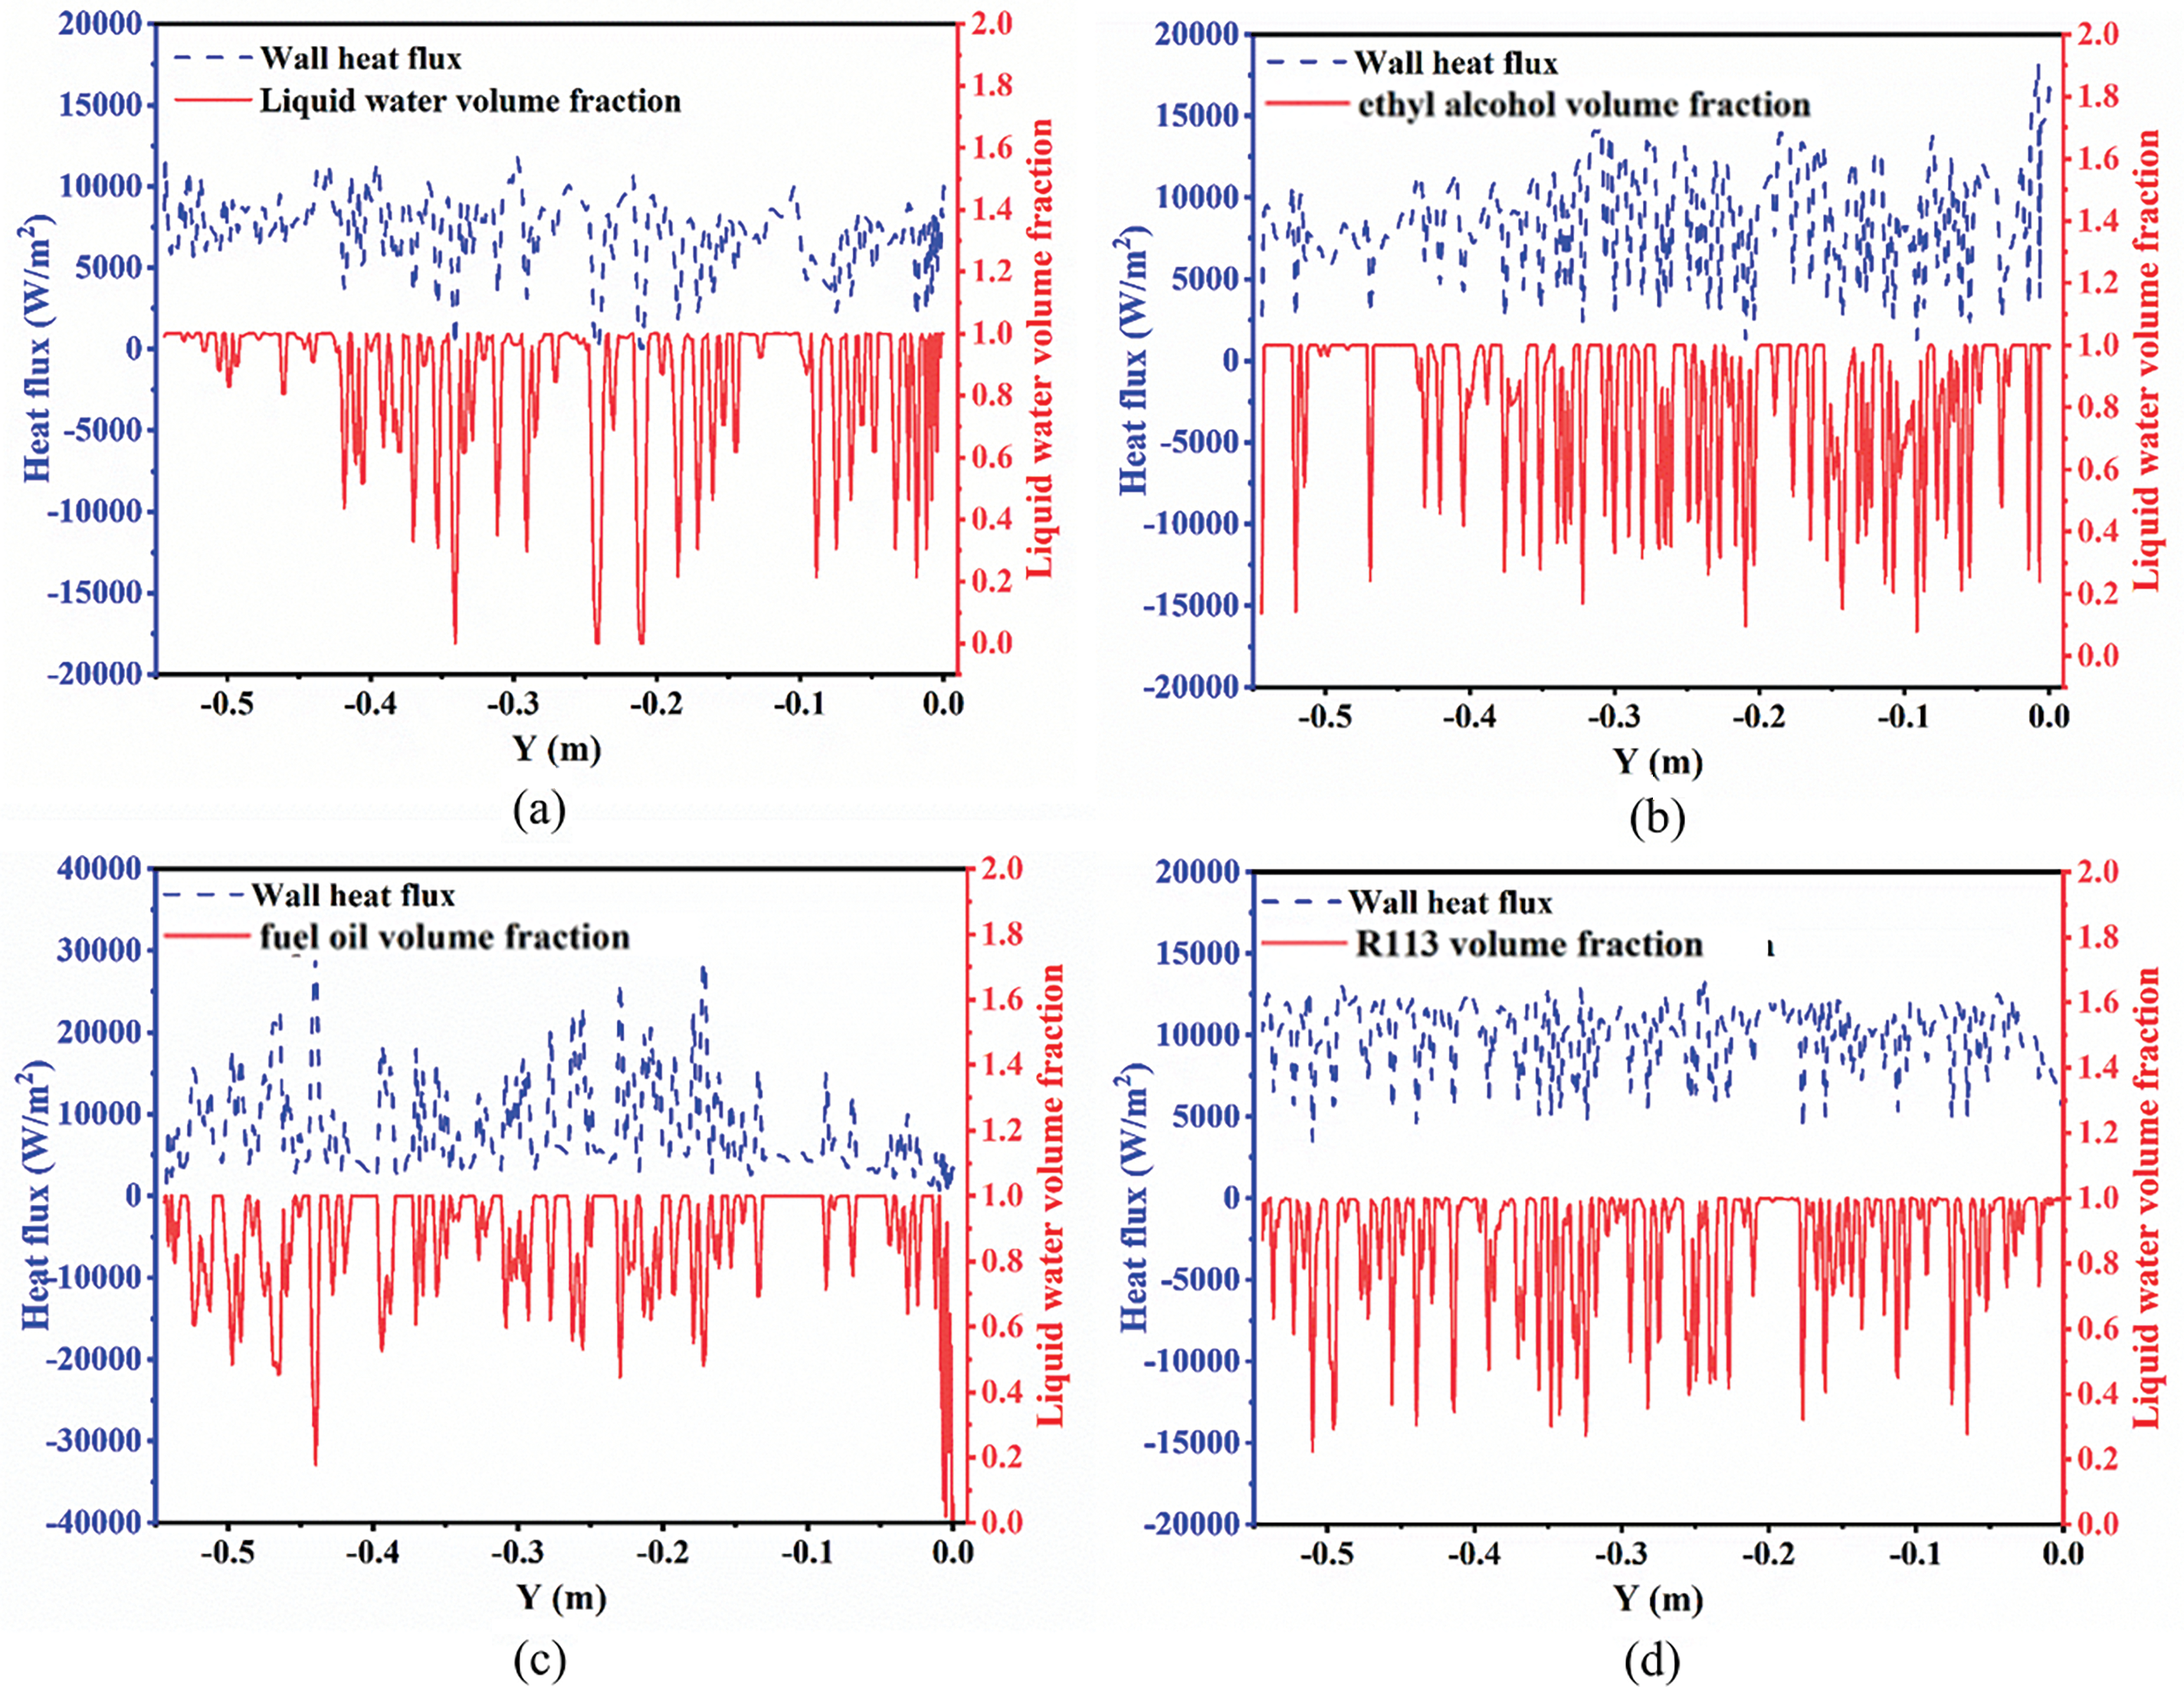
Figure 13: Distribution of heat flux density on the inner wall of the vertical pipe and liquid volume fraction 30 s after phase change: (a) water, (b) ethanol, (c) fuel oil, and (d) R113
To facilitate the directional circulation of the cooling medium solely through the pressure differential on both sides, a heat flux disparity of 100 W/m2 arises between the fluids in the pipes on both sides. Throughout the heating process, the evolution of the four cooling mediums can be categorized into three phases: liquid expansion, localized flow, and comprehensive circulation. Before any phase transition occurs in the fluid, the temperature divergence of fluids in the vertical pipes on either side steadily escalates with the duration of heating. Impelled by this pressure differential, the cooling medium establishes a comprehensive counterclockwise flow within the loop, transitioning into the comprehensive circulation phase, as depicted in Fig. 14. During this phase, the temperature and density contrast, axial velocity of the fluids in the vertical pipes on both sides attain their peak values, with the axial flow velocity surging to approximately 1.1 m/s. The density contrast (
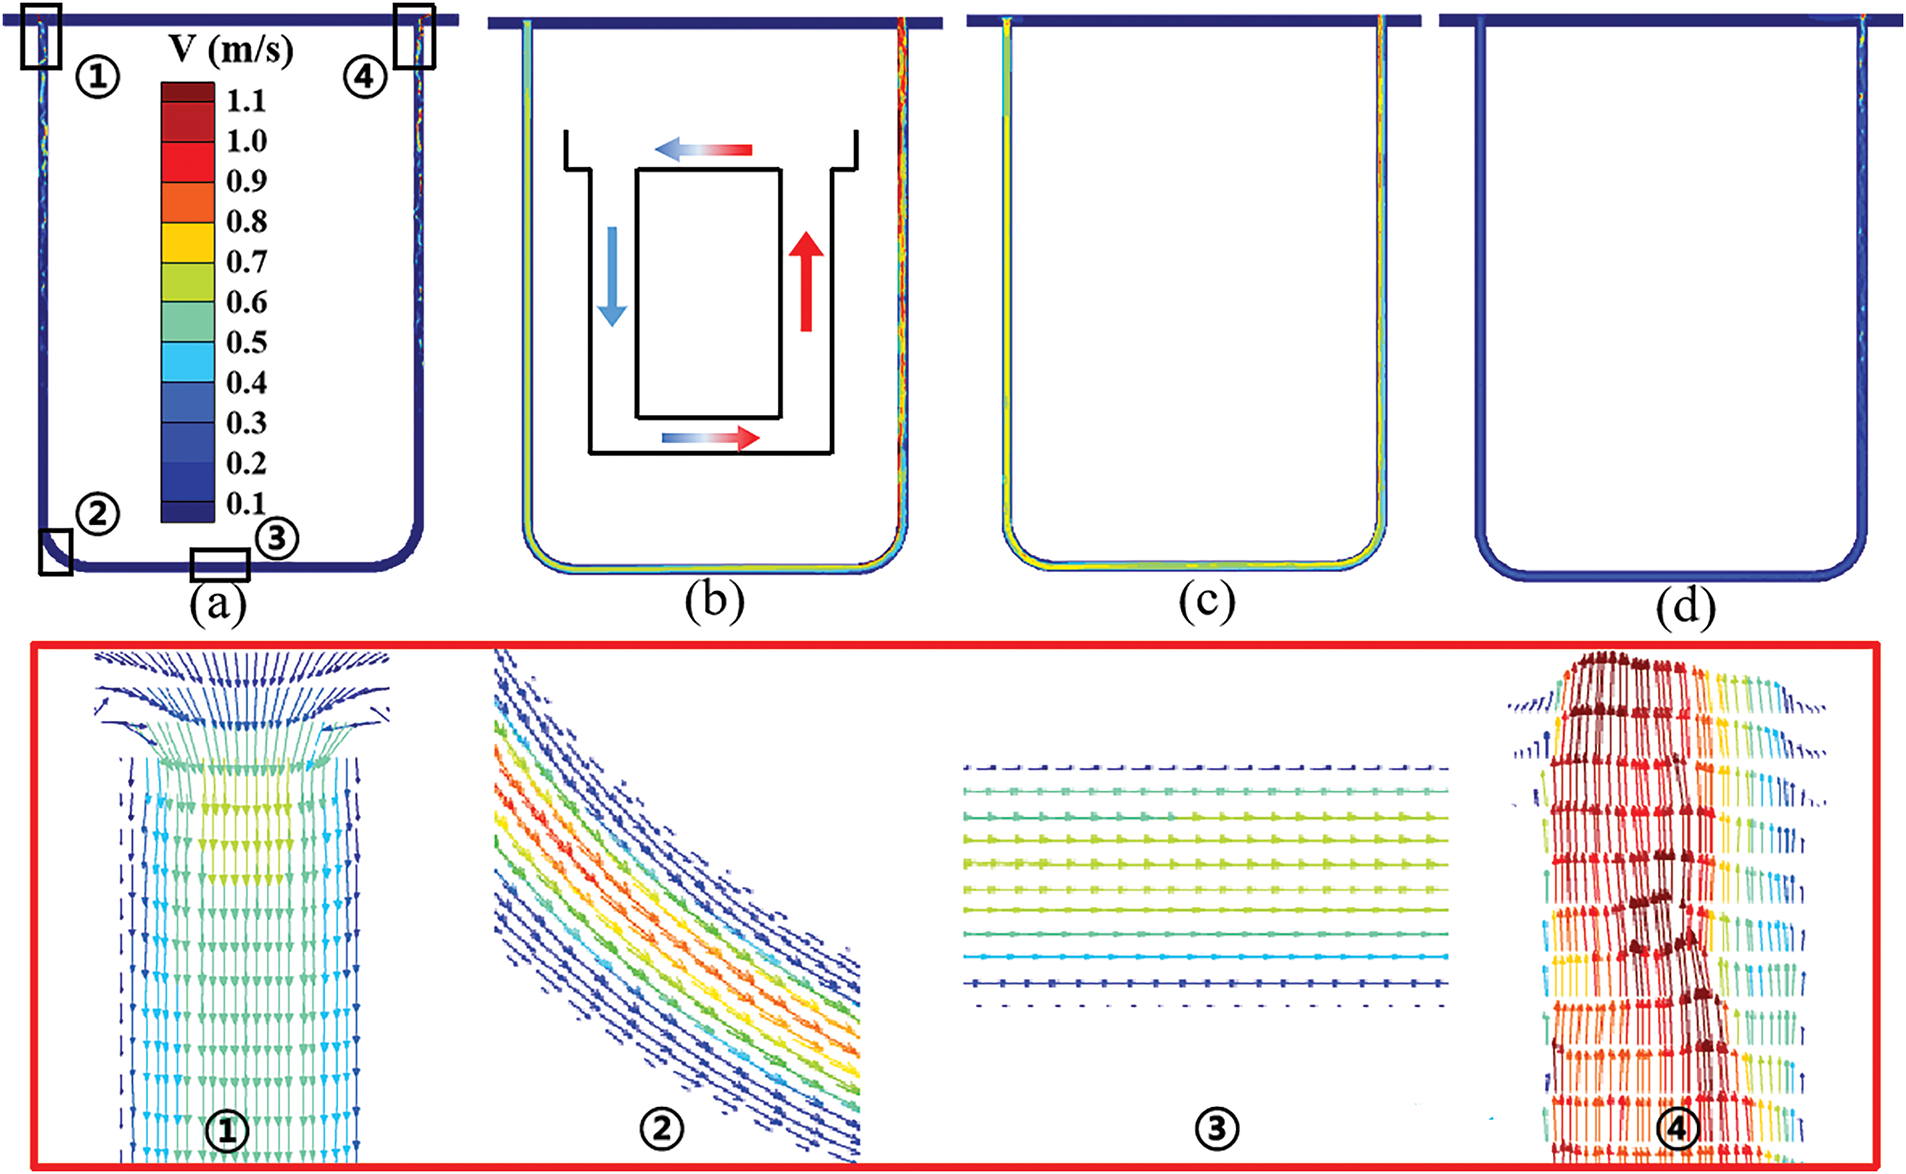
Figure 14: Velocity vector diagrams of four cooling mediums (a) water, (b) ethanol, (c) fuel oil, and (d) R113
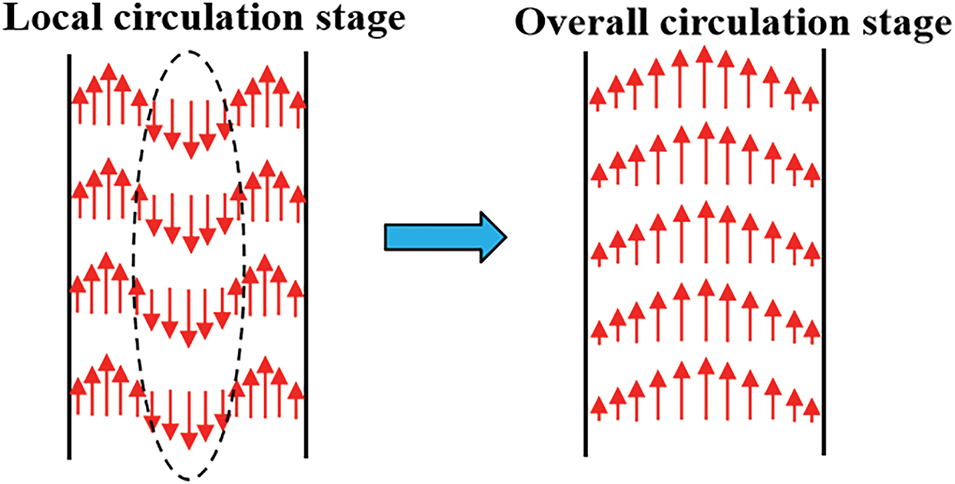
Figure 15: Schematic diagram of the fluid flow direction transition in the right pipe
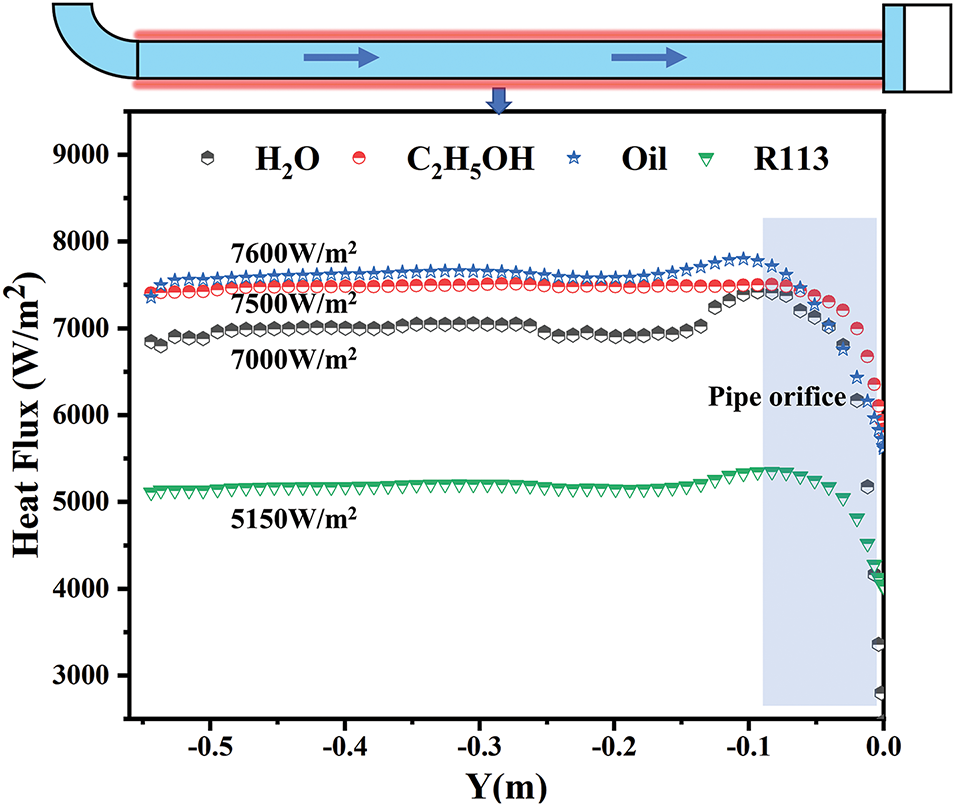
Figure 16: t2 = 60 s heat flow distribution on the wall of the four cooling mediums
To investigate the heat transfer efficiency of the fluid during the phase change circulation phase, additional heat is applied to the system. As the pipe wall’s temperature approaches the fluid’s boiling point, the cooling mediums undergo phase change at high-temperature regions while simultaneously flowing with the circulation, resulting in no significant bubble formation. However, thereafter, Tmax does not show a significant increase. After reaching the phase change point 30 s of four cooling mediums, the heat flux on the right pipe wall surface is as illustrated in Fig. 17. Due to the high phase change temperature and long heating duration results in a large pressure difference and rapid flow rate, the wall heat flux of the fuel oil remains the highest, with an average of 15,000 W/m2. Furthermore, the emergence of multiple tiny bubbles close to the exit of the right vertical pipe swiftly increases the density disparity (
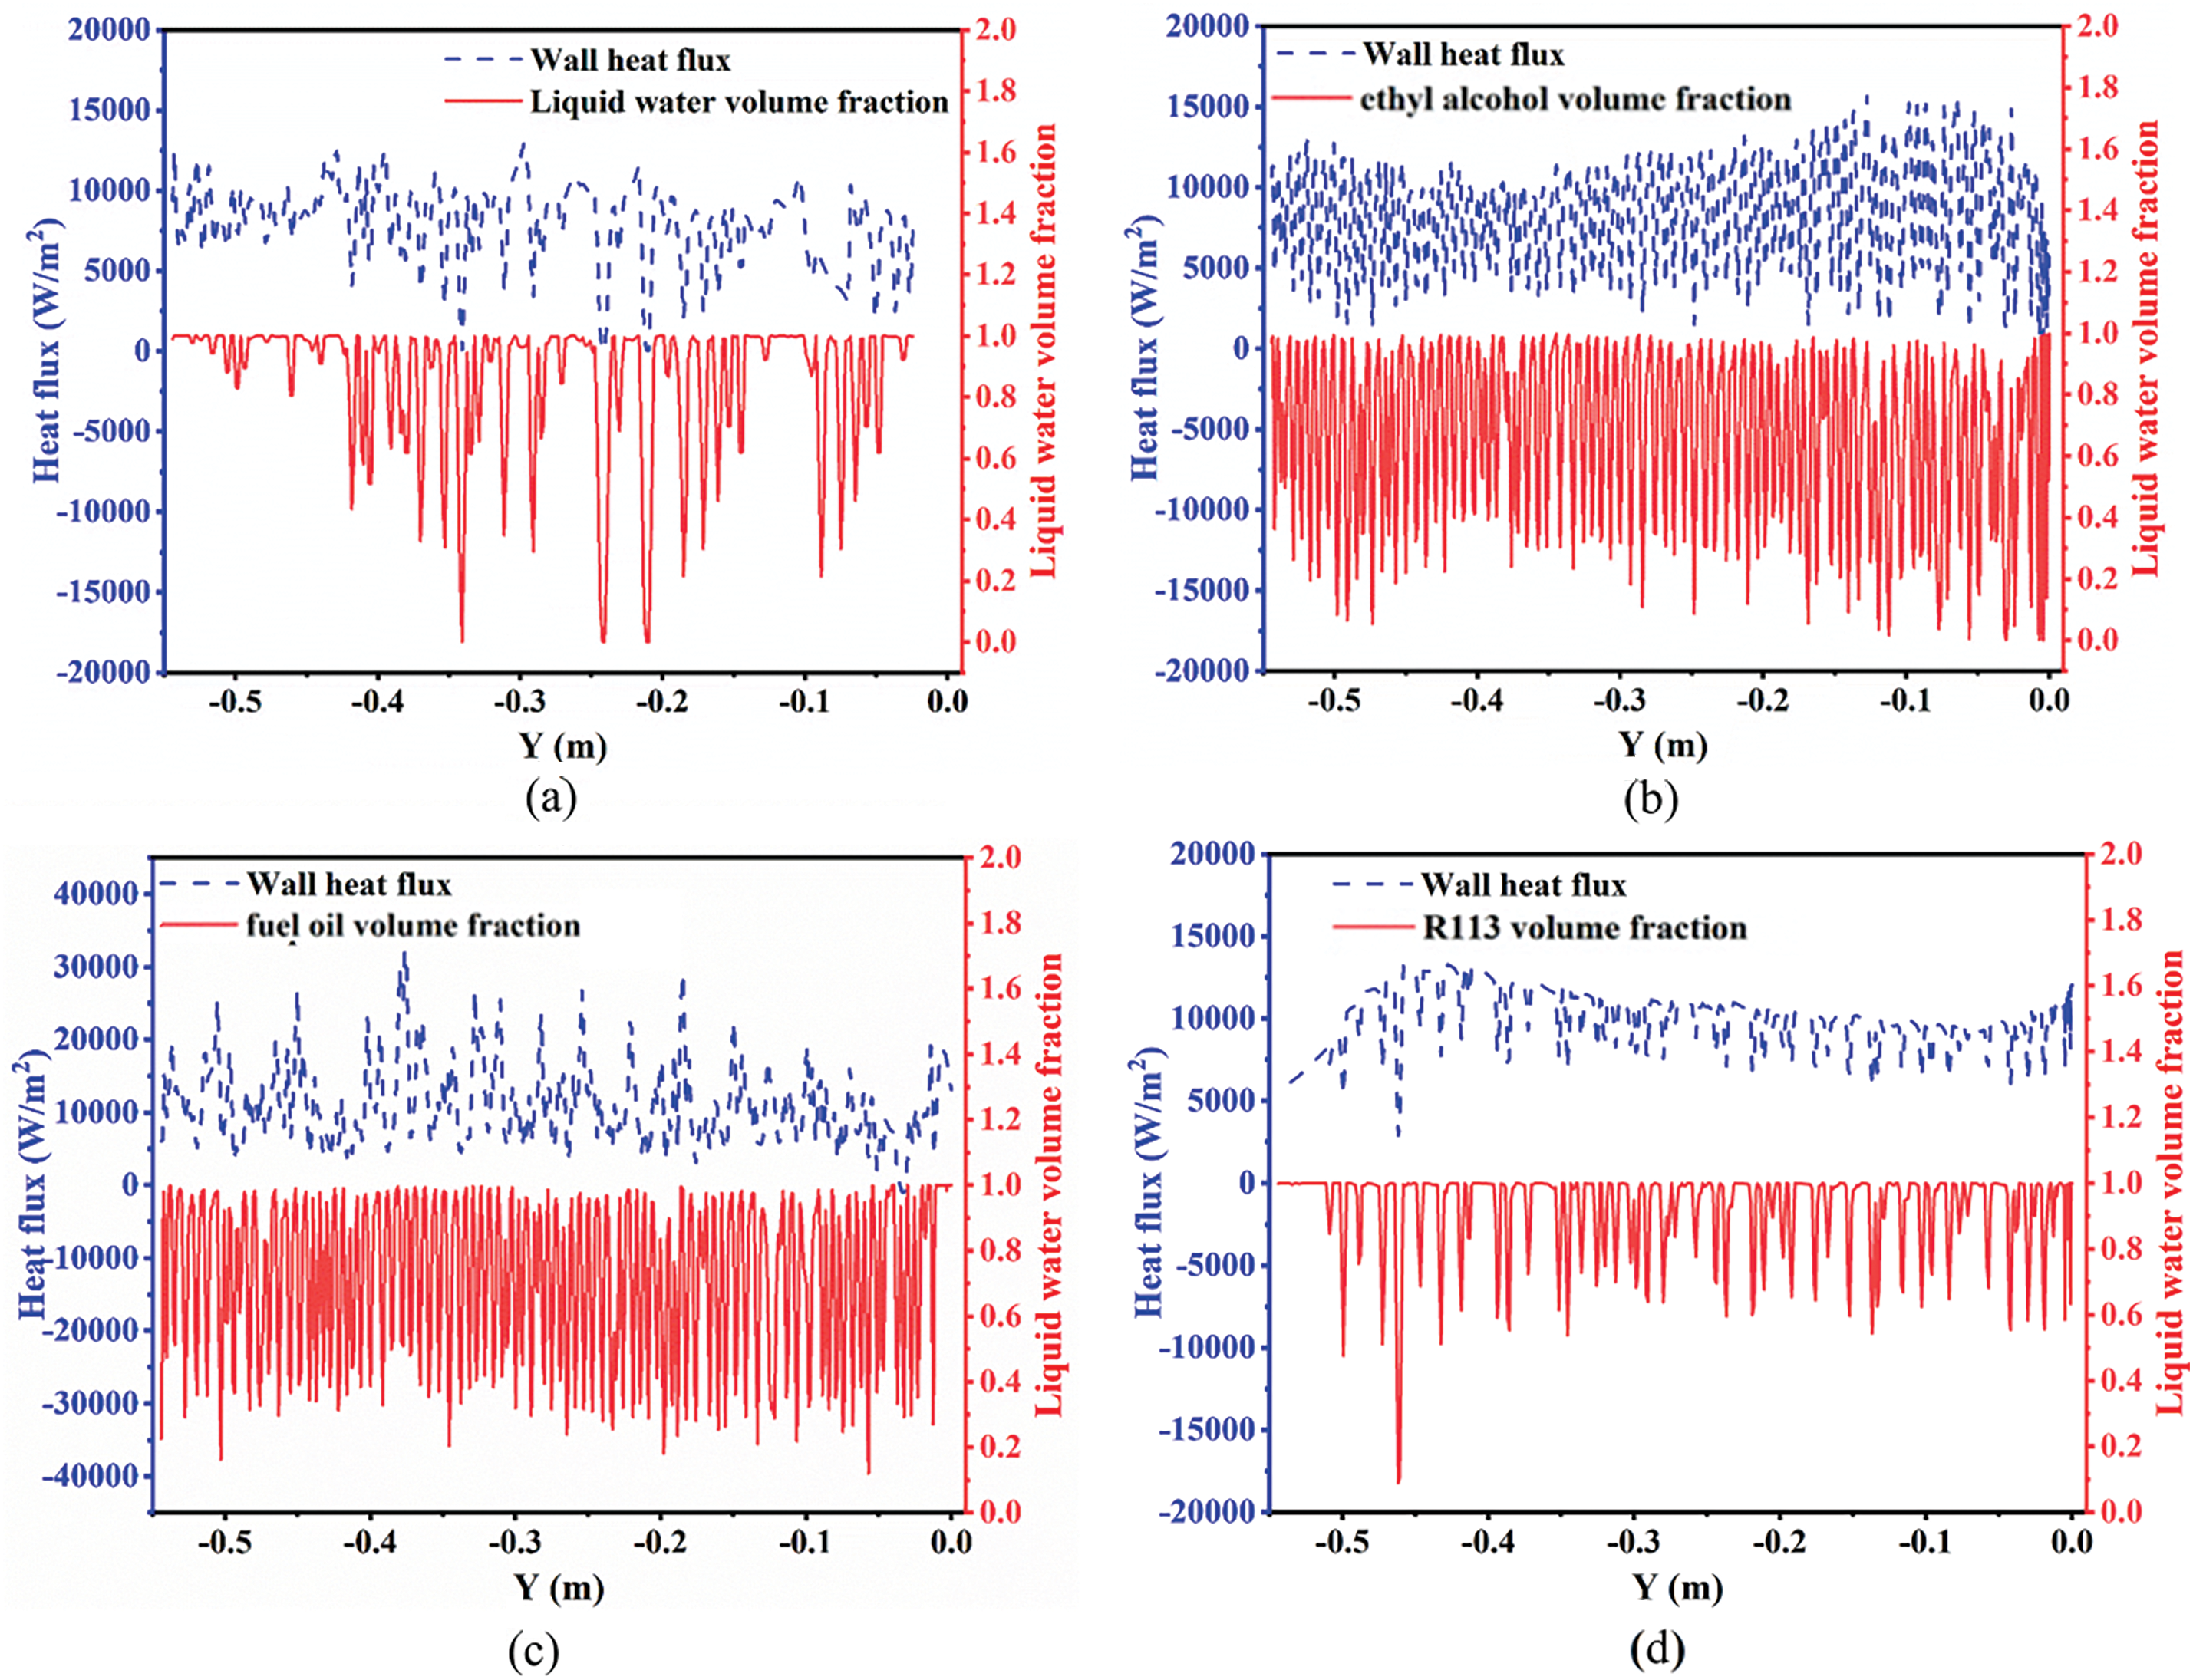
Figure 17: Distribution of heat flux on the inner wall of the vertical pipe and liquid volume fraction 30 s after phase change: (a) water, (b) ethanol, (c) fuel oil, and (d) R113
The innovative open natural circulation system functions as the internal cooling pathway for transpiration cooling. It harnesses variations in heat flux across different sections of the piping to propel the cooling medium through the loop, facilitating the release of steam in the process. Four commonly used cooling mediums: liquid water, ethanol, fuel oil, and R113 are selected to look for physics-based laws. Through numerical simulation of natural circulation flow state within the loop, the flow, phase change, and heat transfer characteristics of different cooling mediums, as well as the influence of fluid thermal properties on the fluid flow state are analyzed. The main conclusions are as follows:
(1) When the walls of the U-shaped pipe are subjected to uniform heat flux, the fluid state of other cooling mediums is consistent with that of liquid water, which can also be sequentially categorized three stages: cooling medium expansion, localized circulation, and phase change. However, due to differences in temperature rise rates and fluid viscosity, the time required for different cooling media to experience these fluid states is different.
(2) As heating time increases, the time difference between different cooling mediums to reach phase transition state is more than 5 times, leading to different fluid flow velocities. Differences in fluid velocity and latent heat of phase change result in significant variations in heat exchange capacity among different cooling mediums, with the maximum difference reaching up to 3 times. Furthermore, under phase change conditions, the influence of fluid velocity on heat exchange capacity is much greater than that of latent heat of phase change and fluid property. Additionally, heat transfer deterioration at the pipe orifice can be mitigated by appropriately adjusting the properties of the cooling medium.
(3) Boosting the heat flux on the pipe wall’s right side prompts the fluid to flow counterclockwise within the loop. However, the threshold for heat flux disparity necessary between the pipe’s two sides to commence full circulation varies across cooling mediums, influenced by the fluid density and the change of density with temperature increase. A heat flux difference of 100 W/m2 suffices to induce overall circulation in all four cooling mediums. Faster circulation speed leads to greater heat transfer capacity, with a maximum of 7600 W/m2.
In conclusion, this study further elucidates the operation mechanism and physics-based cooling laws of the natural circulation system, providing valuable insights for its practical applications. Subsequent work can combine the natural circulation system with the upper transpiration cooling structure, designing a coupled transpiration cooling thermal protection system incorporating self-driven cooling pipes for comprehensive heat transfer analysis.
Acknowledgement: The authors acknowledge the numerical calculations in this paper have been done on Hefei Advanced Computing Center. Besides, we would like to thank Dr. Yi Jin and Dr. Anfeng Shi at Experimental Center of Engineering and Material Sciences, USTC for their assistance with thermal imaging and high-speed flow analysis.
Funding Statement: This research was funded by Fei He, National Natural Science Foundation of China (contract no. 52376154), Anhui Provincial Natural Science Foundation (contract no. 2308085J21).
Author Contributions: The authors confirm contribution to the paper as follows: Conceptualization, Yumei Lv, Fei He; methodology, Yumei Lv; software, Wei Dai; validation, Shupeng Xie, Wei Dai; formal analysis, Wei Dai; investigation, Yumei Lv; resources, Fei He, Peng Hu; writing—original draft preparation, Yumei Lv; writing—review and editing, Fei He, Peng Hu; visualization, Peng Hu; supervision, Peng Hu; project administration, Fei He; funding acquisition, Fei He. All authors reviewed the results and approved the final version of the manuscript.
Availability of Data and Materials: The authors confirm that the data supporting the findings of this study are available within the article.
Ethics Approval: Not applicable.
Conflicts of Interest: The authors declare no conflicts of interest to report regarding the present study.
References
1. Zhang S, Li X, Zuo J, Qin J, Cheng K, Feng Y, et al. Research progress on active thermal protection for hypersonic vehicles. Prog Aerosp Sci. 2020;119(6):100646. doi:10.1016/j.paerosci.2020.100646. [Google Scholar] [CrossRef]
2. Cheng K, Xu J, Dang C, Qin J, Jing W. Performance evaluation of fuel indirect cooling based thermal management system using liquid metal for hydrocarbon-fueled scramjet. Energy. 2022;260(2):125068. doi:10.1016/j.energy.2022.125068. [Google Scholar] [CrossRef]
3. Dang C, Cheng K, Xu J, Fan J, Qin J, Liu G. Performance analysis of a thermal management system based on hydrocarbon-fuel regenerative cooling technology for scramjets. Energy. 2023;285(2):128720. doi:10.1016/j.energy.2023.128720. [Google Scholar] [CrossRef]
4. Huang G, Min Z, Yang L, Jiang PX, Chyu M. Transpiration cooling for additive manufactured porous plates with partition walls. Int J Heat Mass Transf. 2018;124(5):1076–87. doi:10.1016/j.ijheatmasstransfer.2018.03.110. [Google Scholar] [CrossRef]
5. Lv J, Xu H, Zhu M, Dai Y, Liu H, Li Z. The performance and model of porous materials in the indirect evaporative cooling system: a review. J Build Eng. 2021;41(11):102741. doi:10.1016/j.jobe.2021.102741. [Google Scholar] [CrossRef]
6. Wu N, Wang J, He F, Dong G, Tang L. An experimental investigation on transpiration cooling of a nose cone model with a gradient porosity layout. Exp Therm Fluid Sci. 2019;106(4):194–201. doi:10.1016/j.expthermflusci.2019.05.002. [Google Scholar] [CrossRef]
7. Gou JJ, Chang Y, Yan ZW, Chen B, Gong CL. The design of thermal management system for hypersonic launch vehicles based on active cooling networks. Appl Therm Eng. 2019;159(3–9):113938. doi:10.1016/j.applthermaleng.2019.113938. [Google Scholar] [CrossRef]
8. Huang G, Liao Z, Xu R, Zhu Y, Jiang PX. Self-pumping transpiration cooling with a protective porous armor. Appl Therm Eng. 2020;164(8–9):114485. doi:10.1016/j.applthermaleng.2019.114485. [Google Scholar] [CrossRef]
9. Xu RN, Li XY, Liao ZY, Hu HW, Zhu YH, Jiang PX. Research progress in transpiration cooling with phase change. J Tsinghua Univ Sci Technol. 2021;61(12):1341–52. [Google Scholar]
10. Chapman JW, Hasseeb H, Schnulo S. Thermal management system design for electrified aircraft propulsion concepts. In: 2020 AIAA/IEEE Electric Aircraft Technologies Symposium (EATS); 2020 Aug 26–28; New Orleans, LA, USA: IEEE; 2020. p. 1–23. [Google Scholar]
11. Chapman JW, Schnulo SL, Nitzsche MP. Development of a thermal management system for electrified aircraft. In: AIAA Scitech 2020 Forum; 2020; Orlando, FL, USA: AIAA. doi:10.2514/6.2020-0545. [Google Scholar] [CrossRef]
12. Kilic M. A numerical analysis of transpiration cooling as an air cooling mechanism. Heat Mass Transf. 2018;54(12):3647–62. doi:10.1007/s00231-018-2391-6. [Google Scholar] [CrossRef]
13. Munk DJ, Selzer M, Seiler H, Ortelt M, Vio GA. Analysis of a transpiration cooled LOX/CH4 rocket thrust chamber. Int J Heat Mass Transf. 2022;182(6):121986. doi:10.1016/j.ijheatmasstransfer.2021.121986. [Google Scholar] [CrossRef]
14. Hinse M, Yildiz K, Richer P, Jodoin B, Bourmand M, Yun S, et al. Numerical and experimental studies of transpiration cooling film effectiveness over porous materials. J Thermophys Heat Transf. 2022;36(4):803–17. doi:10.2514/1.T6510. [Google Scholar] [CrossRef]
15. Bai X, Yi Y, Liu C, Zhang W, Nakayama A. A simple conjugate analysis and its comparison with experiment for heat transfer problems associated with hot gas flows in a partially transpiration-cooled channel. Int J Heat Mass Transf. 2021;165(1):120729. doi:10.1016/j.ijheatmasstransfer.2020.120729. [Google Scholar] [CrossRef]
16. Japikse D. Advances in thermosyphon technology. Adv Heat Transf. 1973;9:1–111. doi:10.1016/S0065-2717(08)70061-3. [Google Scholar] [CrossRef]
17. Mousavian SK, Misale M, D’Auria F, Salehi MA. Transient and stability analysis in single-phase natural circulation. Ann Nucl Energy. 2004;31(10):1177–98. doi:10.1016/j.anucene.2004.01.005. [Google Scholar] [CrossRef]
18. Bhattacharyya S, Basu DN, Das PK. Two-phase natural circulation loops: a review of the recent advances. Heat Transf Eng. 2012;33(4–5):461–82. doi:10.1080/01457632.2012.614155. [Google Scholar] [CrossRef]
19. Kim N, Kim H, Eoh J, Kim MH, Jo H. Thermal-hydraulic design of natural circulation integrated steam generator using design map. Appl Therm Eng. 2021;197(3):117389. doi:10.1016/j.applthermaleng.2021.117389. [Google Scholar] [CrossRef]
20. Vijayan PK, Nayak AK, Kumar N. Single-phase, two-phase and supercritical natural circulation systems. Woodhead Publishing; 2019. [Google Scholar]
21. Ahmed NM, Gao P, Bello S. Natural circulation systems in nuclear reactors: advantages and challenges. IOP Conf Ser: Earth Environ Sci. 2020;467(1):012077. doi:10.1088/1755-1315/467/1/012077. [Google Scholar] [CrossRef]
22. Rumpunen A. Suitability of a thermosyphon heat exchanger for cooling of power electronic components [master's thesis]. Espoo, Finland: Aalto University; 2015. [Google Scholar]
23. Bažant ZP, Ohtsubo H. Geothermal heat extraction by water circulation through a large crack in dry hot rock mass. Num Anal Meth Geomechanics. 1978;2(4):317–27. doi:10.1002/nag.1610020403. [Google Scholar] [CrossRef]
24. Shen X, Li N, Lu J, Yongga A. Heating performance of solar building integrated wall under natural circulation. Energies. 2020;13(23):6288. doi:10.3390/en13236288. [Google Scholar] [CrossRef]
25. Hou X, Sun Z, Fan G, Wang L. Experimental and analytical investigation on the flow characteristics in an open natural circulation system. Appl Therm Eng. 2017;124(1):673–87. doi:10.1016/j.applthermaleng.2017.05.201. [Google Scholar] [CrossRef]
26. Luo Q, Zhou Y, Huang Y, Huang J, Hu W, Yuan Y. Multi-region oscillation characteristics and hazard of supercritical carbon dioxide in parallel channels natural circulation system. Energy. 2023;267:126587. doi:10.1016/j.energy.2022.126587. [Google Scholar] [CrossRef]
27. Furci H, Baudouy B. Modeling of thermohydraulic transients in a boiling helium natural circulation loop. Cryogenics. 2016;80(1):265–73. doi:10.1016/j.cryogenics.2016.01.005. [Google Scholar] [CrossRef]
28. Li Y, He C, Qiu J, Tan S, Hou X, Li L, et al. Numerical study on transient response characteristics of natural circulation in coupled loops under ocean condition. Prog Nucl Energy. 2020;124(4):103248. doi:10.1016/j.pnucene.2020.103248. [Google Scholar] [CrossRef]
29. Mulbah C, Kang C, Mao N, Zhang W, Shaikh AR, Teng S. A review of VOF methods for simulating bubble dynamics. Prog Nucl Energy. 2022;154:104478. doi:10.1016/j.pnucene.2022.104478. [Google Scholar] [CrossRef]
30. Hu P, Li Y, Han Y, Cai SCS, Xu X. Numerical simulations of the mean wind speeds and turbulence intensities over simplified gorges using the SST k-ω turbulence model. Eng Appl Comput Fluid Mech. 2016;10(1):359–72. doi:10.1080/19942060.2016.1169947. [Google Scholar] [CrossRef]
31. Fluent A. Ansys fluent theory guide. Vol. 15317. USA: Ansys Inc.; 2011. p. 724–46. [Google Scholar]
32. Ruelle D. A mechanical model for Fourier’s law of heat conduction. Commun Math Phys. 2012;311(3):755–68. doi:10.1007/s00220-011-1304-z. [Google Scholar] [CrossRef]
33. Lv Y, Wu W, Ma Y, Luan Y, He F, Wang J. Investigation on flow and heat transfer of fluid in self-driven circulation system for transpiration cooling. Int J Heat Mass Transf. 2024;218(12):124775. doi:10.1016/j.ijheatmasstransfer.2023.124775. [Google Scholar] [CrossRef]
Cite This Article
 Copyright © 2025 The Author(s). Published by Tech Science Press.
This work is licensed under a Creative Commons Attribution 4.0 International License , which permits unrestricted use, distribution, and reproduction in any medium, provided the original work is properly cited.
 Downloads
 Citation Tools