
 Submit a Paper
 Propose a Special lssue
 Open Access
ARTICLE

Enhancement of Thermal Performance of Counter Flow Double Pipe Heat Exchanger by Inserting Wavy-Edged Tape
1 Mechanical Engineering Department, University of Babylon, Babylon, 51002, Iraq
2 Mechanical Engineering Department, University of Wasit, Wasit, 52001, Iraq
* Corresponding Author: Zainab Mahdi Saleh. Email:
(This article belongs to the Special Issue: Computational and Numerical Advances in Heat Transfer: Models and Methods II)
Frontiers in Heat and Mass Transfer 2025, 23(2), 615-650. https://doi.org/10.32604/fhmt.2025.063404
Received 14 January 2025; Accepted 10 March 2025; Issue published 25 April 2025
 View Full Text
 Download PDF
Abstract
This study involved numerical simulations of a double tube heat exchanger using the ANSYS FLUENT program version 22. The study aims to examine methods for minimizing pressure loss and consequently enhancing the thermal performance index (TPI) of a heat exchanger fitted with wavy edge tape that is a heat recovery system (the hot air in simulation instead of t heat from the exhaust gases of the brick factory furnaces and return it to warm the heavy fuel oil by substituting the electrical heater with a heat exchanger to recuperate waste heat from the flue gases, so elevating the temperature of Heavy fuel oil (HFO) to inject from the roof nozzles of combustion chamber of the furnace furthermore reducing cost (by finding the optimal design of wavy edge tape)) and energy consumption. Air was selected as the hot gas in the inner pipe instead of furnace exhaust gases due to their similar thermal characteristics. A numerical analysis was conducted to create a novel wavy edge tape with varying widths (50% Di, 75% Di, and 95% Di), lengths (1000, 1200, 1400) mm, amplitudes (5, 10, 15) mm, and periods of wavy length (5, 10, 15) mm. The flow rate of the outer pipe fluid (oil) ranges from (0.06 to 0.1) kg/s, while the velocity of the hot fluid (air) varies from (1 to 27) m/s, Reair (6957 to 187,837). The entrance temperature of the hot fluid can be either (200, 225, and 250)°C. The study finds that wavy edge tape tubes are more effective than smooth tubes in terms of oil outlet temperature; results revealed that an increase in the oil mass flow rate leads to a decrease in the oil outlet temperature and an increase in the heat transfer rate, at the air temperature 250°C. Additionally, the results indicate that increasing the width, length, and amplitude also leads to an increase in the oil outlet temperature of (94–94.12)°C, the pressure drop of (568.3) Pa, and the Nusselt number (65.7–66.5) respectively on the oil side. Finally, the heat exchanger’s best thermal performance index was found by investigating temperature contour at amplitude (A = 5), period (p = 15), width (w = 75% Di), and length (L = 1200 mm). The values for these parameters are, in order (1.02, 1.025, 1.02, and 1.0077).Keywords
Nomenclature
| WET | Wavy edge tape |
| T | Temperature °C |
| p | Period wavy length mm |
| A | Amplitude mm |
| TPI | Thermal performance index |
| Re | Reynold number |
| HE | Heat exchanger |
| m° | Mas flow rate kg/s |
| △p | Pressure drop Pa |
| Q | Heat Transfer rate W |
| HFO | Heavy fuel oil |
Improving heat transmission in various heat exchangers can result in enhanced performance and, consequently, reduce the cost and size of the system. Heat transfer augmentation techniques are extensively utilized in various engineering applications, such as heat recovery processes, shell-and-tube heat transfer exchangers, air conditioning and refrigeration systems, the nuclear energy industry, chemical reactors, high-power laser systems, and chemical process plants. The strategies employed to improve heat dissipation can be classified into three main categories: active, passive, and compound methodologies [1]. Various techniques are used to enhance and improve the heat transfer, such as insert devices, including wire coil [2], helical coil [3], conical coil [4], helical fins [5], shell and helical tube [6–8] and twisted tape inserts [9] studied tubes in heat exchangers commonly utilize twisted-tape inserts to improve heat transfer effectively. The Computational Fluid Dynamics (CFD) method can provide valuable insights into the flow characteristics of interior flows that are challenging to observe using conventional experimental procedures [10].
Many designs, including triangular (V) and square-cut twisted tape inserts, have improved heat transmission and performance in heat exchangers with varying width ratios and a working fluid. Results indicate that VTT and STT enhance heat transfer, friction factor, and thermal performance, exhibiting higher efficiency than TT and plain tubes [11,12]. Conversely, extended surfaces improve heat transmission in heat exchangers. Certain researchers employ a k-renormalized group turbulence model to investigate a tube with a backward louvered strip insert with differing pitches. The additional louvered strip induced fluid flow disruption, leading to increased turbulence. The tube, including a louvered strip enhanced Nusselt numbers and the friction factor by 7.59, 6.51, and 5.77 times relative to the plain tube [13].
Others examined the effects of pitch-length louvered strip inserts on heat transfer and friction factor attributes in a concentric pipe heat exchanger. The findings indicated that louvered strip inserts produced elevated heat transfer rates and enhanced Nusselt number, friction factor, and heat transfer coefficient ratio as pitch length diminished. Incorporating louvered strip inserts led to increased heat transfer coefficient ratios [14]. Kumar et al. [15] investigated the impact of shell and coil side volume flow rates on heat transfer coefficient, effectiveness, pressure drop, and exergy loss in shell and helical coil heat exchangers under steady-state conditions. Results showed that increasing both flow rates increased the overall heat transfer coefficient. Safaa et al. [16] numerically analyzed a shell and helical tube heat exchanger to reduce fuel consumption in industrial furnaces. The hot gas was air, and the helical tube was constructed with various coil pitches and curvature ratios. The oil outlet temperature dropped with an increased oil mass flow rate. The study found that helical tube lengthening decreased heat transfer, oil outlet temperature effectiveness, and pressure drop. Also, the impact of helical fins on the performance of a double pipe heat exchange in a brick factory was investigated. The heat exchanger was used to recover heat from exhaust gases to preheat heavy fuel oil. The results showed that increasing the Reynolds number increased the heat transfer rate, oil outlet temperature, overall heat transfer coefficient, and effectiveness of the heat exchanger. Applying double pipes e with helical fins could reduce viscosity, reduce the electric power required, and save 1.69 MW annually for one factory [17]. Nakhchi et al. [18] simulated 3D flow properties of Cu-water Nanofluids using cribriform conical rings in a heat exchanger tube, revealing a 278.2% improvement in heat transfer with 4 holes. Alnasur et al. [19] performed a numerical analysis on an innovative twisted tape design, especially one featuring a wavy edge, aimed at enhancing heat transmission and reducing pressure in a vertical two-phase pipe. The findings indicate that incorporating the modified twisted tape markedly enhances turbulent vortex flow and augments heat transmission. Guled et al. [20] explored laminar flow of boundary layer on a porous surface shrinking exponentially under varying magnetic fields, suction/injection, radiation, velocity slip, and thermal slips. The dimensionless nonlinear differential equations are solved using the homotopic analysis method, revealing excellent agreement with the literature. The study also graphically presents parameters’ impacts on velocity and temperature values, revealing increased skin friction and heat transfer rate.
Most vortex makers don’t need any power to work, which makes them a good way to improve the temperature performance coefficient in industrial places. But they have a problem: they significantly lower the pressure [21]. Various research has been conducted to attain an optimal design and maximize heat transfer efficiency [22,23]. Sivakumar et al. [24] conducted an experimental study to investigate how heat transfer in a circular tube could be improved using twisted tape inserts with varying twist ratios. The heat exchanger was modeled using Ansys Fluent in their analysis. The CFD solver approach was utilized to implement the twisted tube meshing. A three-dimensional CFD interface with double precision was used to conduct a numerical study of segregated solver techniques. An investigation was conducted to determine the friction factor and heat transfer value in laminar flow within a circular pipe with twisted tape. The findings demonstrated that the heat transmission improvement ranged from 7% to 10% for the pipe equipped with twisted-tape inserts compared to the pipe without such inserts. Moreover, the Nusselt number exhibited an increase in direct proportion to the increase in the Reynolds number. Axio et al. developed a wavy-tape insert prototype for pipe heat transfer augmentation. The insert is fitted in the center of a straight pipe; full-scale simulations indicate a maximum total heat transfer amplification ratio of 1.82. The wavy-tape insert generates pairs of vortices, enhancing pipe heat transfer performance. It also outperforms hollow pipes in terms of heat absorption rate and overall performance in the laminar flow regime [25].
Mashoofi et al. examined axially twisted tapes’ impact on increasing the heat exchanger’s thermal rate. The heat transmission in a single phase was simulated using the Computational Fluid Dynamics (CFD) approach. This study employed a turbulence model of the RNG k–ε type, constant heat flux, and physical parameters. The effect of gravity on the results was shown to be insignificant. The SIMPLE technique was utilized to assess the connection between pressure and velocity. The turbulence, energy, and momentum parameters were computed using the 2nd upwind scheme. Their findings demonstrated that using axially twisted tapes resulted in a loss of 2.17%–10.5% in heat exchanger performance and a fall of 8.5%–44.2% in friction factor [26]. Kamel et al. examined the performance of a double pipe heat exchanger with full-length tight-fit twisted tape. Various twist ratios were used to increase the transmission of heat. The optimal design was obtained using SOLIDWORKS PREMIUM 2016 software. The results showed a maximum enhancement of 26.6%, 106.1%, and 91.7% in heat transfer rate, Nusselt number, and convection heat transfer coefficient compared to plain tubes. Applying the heat exchanger with twisted tape could reduce viscosity, reduce pumping power, and save 200,656 Mw annually by recovering heat from furnace exhaust gases [27]. Hong et al. discovered that incorporating numerous twisted tapes into sinusoidal rib tubes (SRT) led to a notable enhancement in heat dissipation, increasing it from 27.4% to 39.5%. However, this improvement came at the cost of higher friction loss, which rose from 49.4% to 74.7%. These findings show that SRT could be a viable option for heat exchangers [28]. Suvanjan et al. experimentally investigated the heat transfer properties of turbulent flow through a circular tube with short- and full-length wavy-tape inserts. Air was employed for Reynolds numbers ranging from 6000 to 20,000, utilizing various wave, tape thickness, and diameter ratio combinations. Research revealed that using wavy-tape inserts significantly increased heat transmission, surpassing smooth tubes by up to 67%. The heat transmission for full-length wavy tape was roughly 25% greater than for short-length wavy tape, using nearly the same pumping force. Nevertheless, the power required to pump full-length tape was 26% greater than that needed for short-length tape [29]. Saleh et al. numerically investigated a double-pipe heat exchanger with twisted tape using Navier-Stokes, energy, and turbulence equations. ANSYS Fluent 22 was used to analyze the impact of perforated wavy edge tape, hole diameter, and twisting ratio on heat transfer and pressure drop at different Reynolds numbers. The inner tube uses hot air to improve turbulence and heat transfer, while the outer tube uses cold oil for improved flow. Results showed significant improvements in oil outlet temperature, with the Nusselt number increasing with Reynolds numbers and twist ratios. The optimal configurations of PWETT with Tr = 2 and WET with a 30 mm hole diameter provided the best thermal performance index [30]. Rico et al. evaluated the thermal efficiency of heat device systems by analyzing various TT configurations, providing valuable insights into system performance [31].
Singh et al. investigated the augmentation of heat transmission in a heat exchanger utilizing elliptical and circular inserted twisted tapes. The study specifically examined geometric characteristics such as height ratio and Reynolds numbers. The highest thermal performance factor (TPF) was obtained when the height ratio was 0.45, and the Reynolds number (Re) was 3000, resulting in a TPF value of 2.43 [32]. Dagdevir et al. investigated the effects of perforated TT tabulators on enhancing the heat transfer rate (HT rate). They discovered that the highest thermal efficiency was achieved using a pressure ratio of 0.25, η values of 1.42, 1.17, and 1.05, and volumetric ratios of 0:100, 20:80, and 40:60 [33]. Wang et al. studied the flow and heat transfer of turbulence tubes (TT) using silica-water Nano fluids. TT increased heat exchanger efficiency by 74.80% and 55.97% in round and triangular tubes [34]. Al-Kayiem et al.’s study on heat transfer and fluid flow in pipes with twisted tape inserts and Nano fluid found that quintuple twisted tape inserts improved heat transfer, with Nusselt numbers reaching 110.8% and 100.0%, respectively. The technique is recommended for heat exchanger applications [35]. Singh et al.’s study on V-shaped twisted tape inserts revealed that swirl flow increased the heat transfer rate by 84% compared to plain tubes, providing a comprehensive understanding of heat transport characteristics [36]. Bucak et al.’s study on turbulence’s impact on heat transfer in pipes revealed that the highest dimpled and compressed protruded TT achieved optimal thermal performance factor values [37]. Nalavade et al. assessed the effects of heat transfer and friction factor features on nonconductive TT inserts in turbulent flow circumstances. The study covered a range of Reynolds numbers from 6000 to 22,000. The researchers found that the best improvement efficiency, reaching 2.18, was achieved at a Reynolds number of 7000 and a pitch ratio of 1.63 [38].
Most brick factories in Iraq utilize a uniform furnace design, including nozzles on the roof for fuel injection into the furnace. Storage tanks for heavy fuel oil are linked to an oil pump that feeds the fuel to the nozzles. Heavy fuel oil’s lowest flash point temperature is 90°C, while the maximum pour point is around 40°C [39]. The purpose of heating oil is to decrease its high viscosity and achieve effective fuel atomization from the nozzles to improve combustion efficiency. Two heating apparatuses exist within the factory: a diesel burner that directly heats the tank using the hot gases produced by the burner and an electric heater located on the discharge pipe, as seen in Fig. 1. The objective of this study is to substitute the electrical heater with a heat exchanger to recuperate waste heat from the flue gases, so elevating the temperature of HFO from 40°C to over 90°C.

Figure 1: Process flow diagram of the brick factory [39]
The literature analysis provided above demonstrates that several passive strategies were investigated to enhance the thermal efficiency of heat exchangers. However, few attempts have been made to statistically analyze the thermal efficiency of heat exchangers with wavy edge twisted inserts. The authors offer a computational fluid dynamics (CFD) simulation to explore the influence of the Traditional TT insert on the thermal performance of heat exchangers. The WET design encompasses the following concepts: (1) Wavy edges create turbulence along the tube wall, disrupting the thermal boundary layer. (2) Various widths of WET within the tube, (3) Various lengths of WET within the tube. (4) Various amplitude of WET within the tube. (5) Various periods of WET within the tube. To assess the thermal performance index of a heat exchanger, focus on the effect of the length, width, amplitude, and periods of the wavy edge tape on heat transfer rate, oil outlet temperature, Nu, and pressure drop. This research analyzes the influence of an innovative wavy edge tape that uses CFD simulations on the thermal performance of heat exchangers. The operating fluid in the 6957–187,837 range of the Reynolds was air-heavy fuel oil.
The motivation for this research is to comprehensively examine the novel configuration of the strip and its interaction with heat exchangers to enhance convective heat transfer by modifying the geometry of twisted ribbons and selecting the optimal design to reduce pressure drop while maximizing heat transfer for heating heavy fuel oil in a double pipe heat exchanger equipped with twisted tape and study the effect of wavy edge tape on heat transfer rate, oil outlet temperature, Nu, and pressure drop, thus addressing the substantial energy consumption issue faced by the brick factories in Waist city by using the energy wasted through the air outside of the chimney and reducing pollution and gas emissions. It addresses the deficiency in pertinent theoretical research and provides scholars with a suitable framework for the necessary scenarios.
2.1 Description of a Double Pipe Heat Exchanger and Wavy Edge Tape Insert
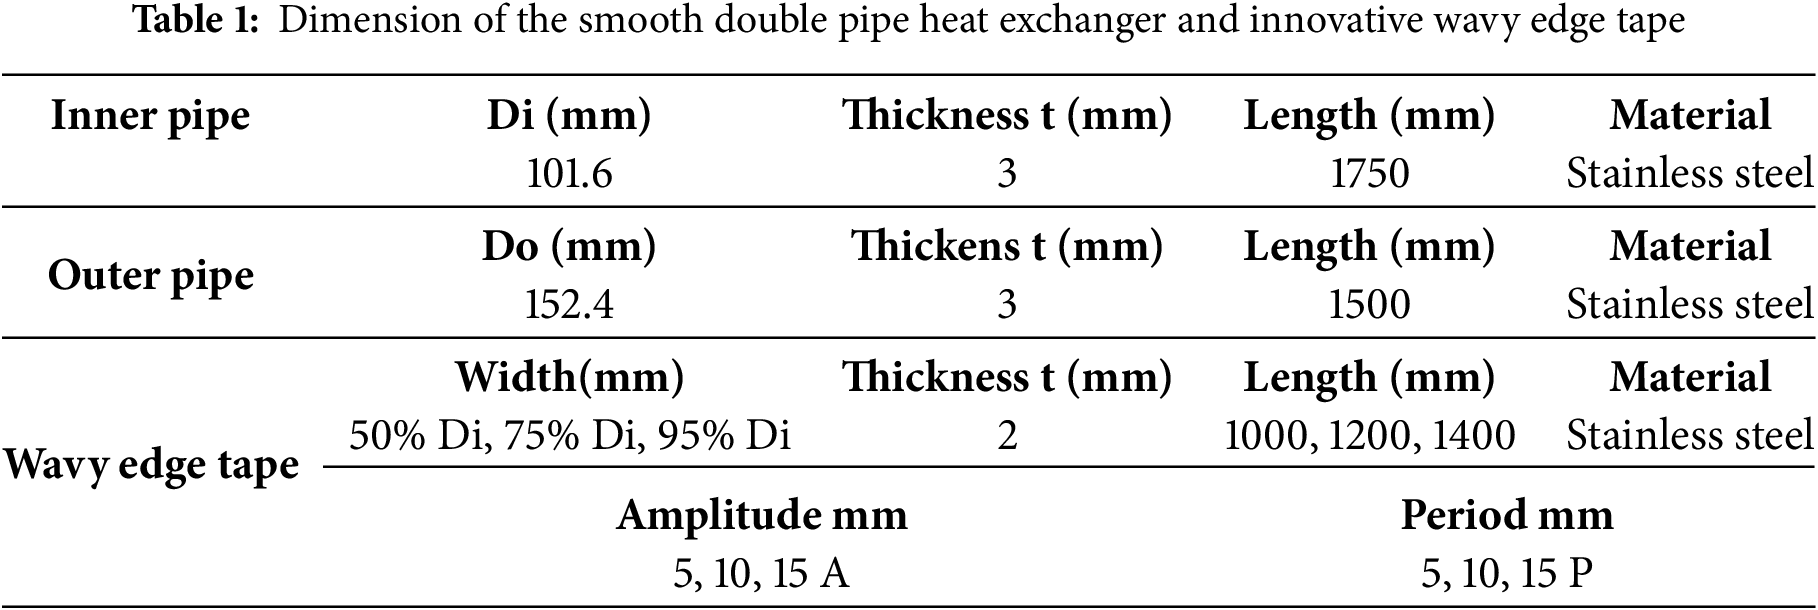
The geometry and dimension of the smooth double pipe heat exchanger and the diagram of our innovative Wavy edge tape insert in the inner tube are displayed in Fig. 2. The wavy edge tape insert is precisely positioned at the center of the straight pipe, as depicted. The pipe has a diameter of (101.6) mm and a length of (1500) mm. The plain sections are specifically designed to offer convenience during tape placement. The tape edge waviness exhibits a sinusoidal pattern with varying amplitudes and periods. The tape has a different width, length, amplitude, and period, as shown in Table 1, and a thickness of 2 mm. The tape is presumed to remain firm and does not experience deformation or vibration.
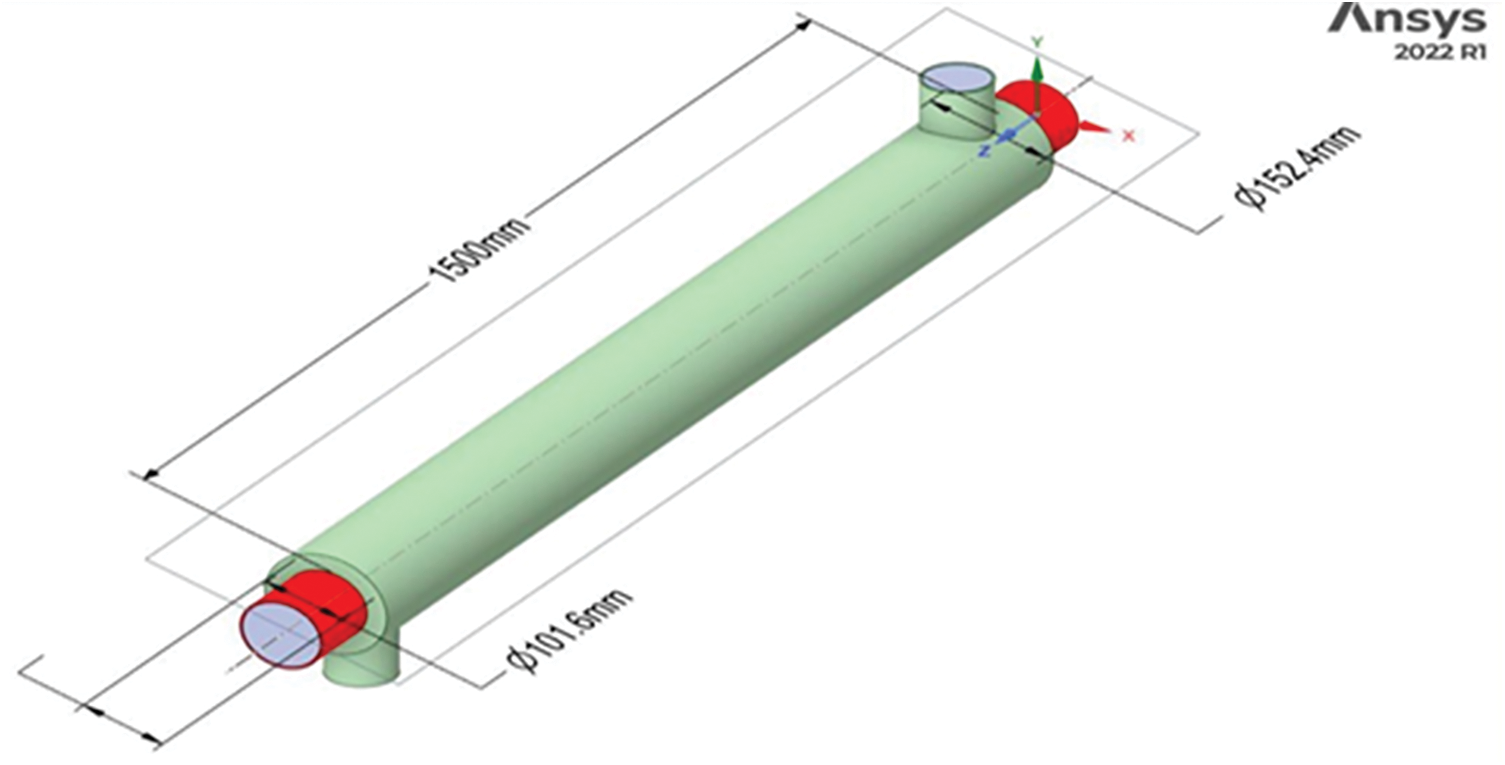

Figure 2: Geometry of the smooth double pipe heat exchanger and innovative wavy edge tape
2.2 CFD Modeling and Simulation
The solution domain of a horizontal double tube with WET inserts exhibits a unique tape using SOLIDWORKS; a 3-D solution domain was created for CFD analysis, as shown in Fig. 2. WET implants are simulated using ANSYS 22. The wavy edge tape consists of Stainless-steel strips that are 2 mm thick (t) and various widths (w). During the simulation run, the tape was put in the tube with (Full and short-length-wavy edges). The WET has been inserted into the test portion of the steel tube. The dimensions of double pipe HE are listed in Table 1 for numerical analysis. The current computational study utilized complete WET within a cylindrical tube to generate a swirling flow. The main objective was to obtain a higher oil outlet temperature and optimal thermal performance index TPI. The Reynolds number test fluid range has involved 6957–187,837 of air. The k–ε turbulence model was chosen for this study due to its robustness, efficiency, and accuracy in predicting turbulent flows in industrial heat exchangers. It is effective for high Reynolds number flows and near-wall regions but has limitations in the near-wall areas. The k−ω model provides better accuracy in boundary layer regions but is sensitive to free-stream conditions. The SST model offers better accuracy but is less practical for large-scale simulations. Future studies could explore advanced models to refine predictions. By utilizing the energy equation and the viscous k-epsilon models from Fluent, it is possible to enhance the accuracy of turbulent flows, which are represented as (Reynolds-Averaged Navier-Stokes (RANS) Models) and rapidly depleting flows by employing two equations for the turbulent kinetic energy. To verify the precision of the solution, the mesh of the current study was analyzed by modifying specific parameters and conducting repeated simulations, as indicated in Tables 2 and 3 and Figs. 3 and 4.
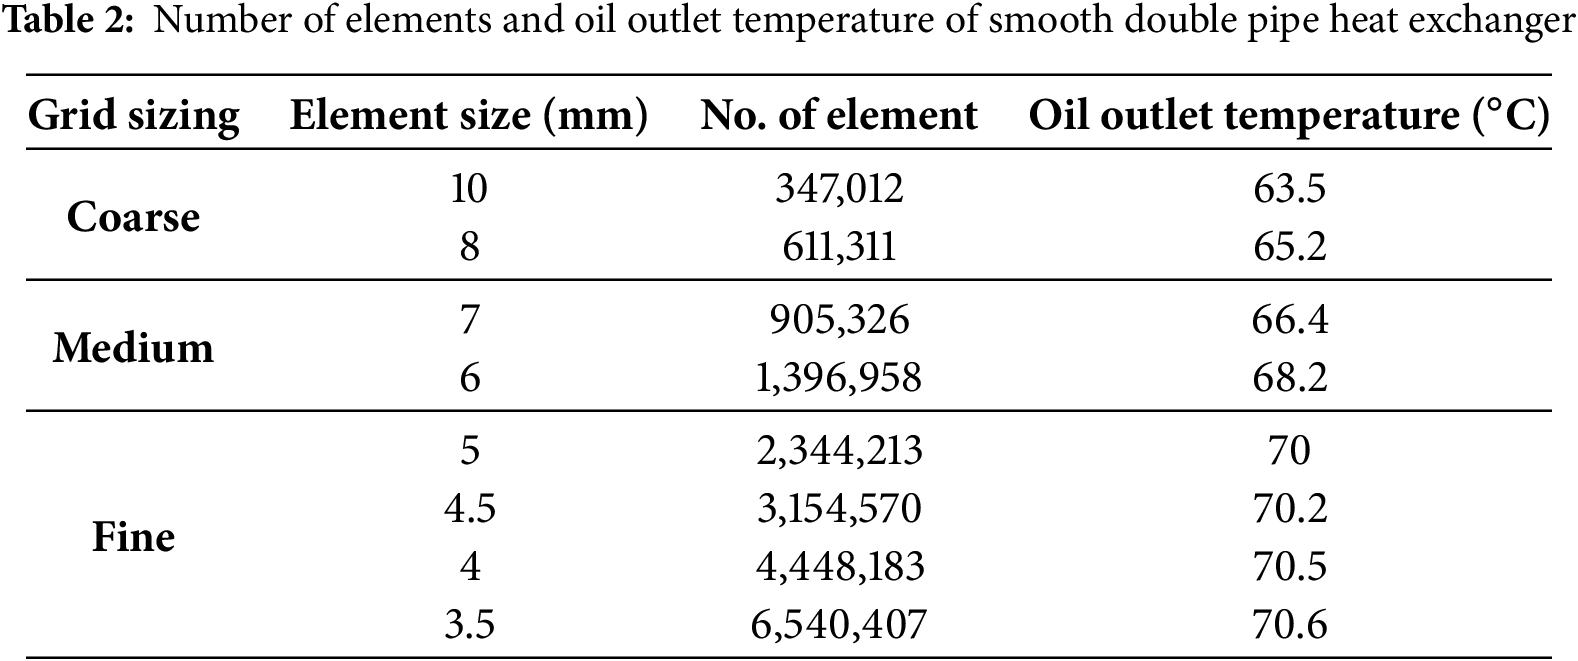
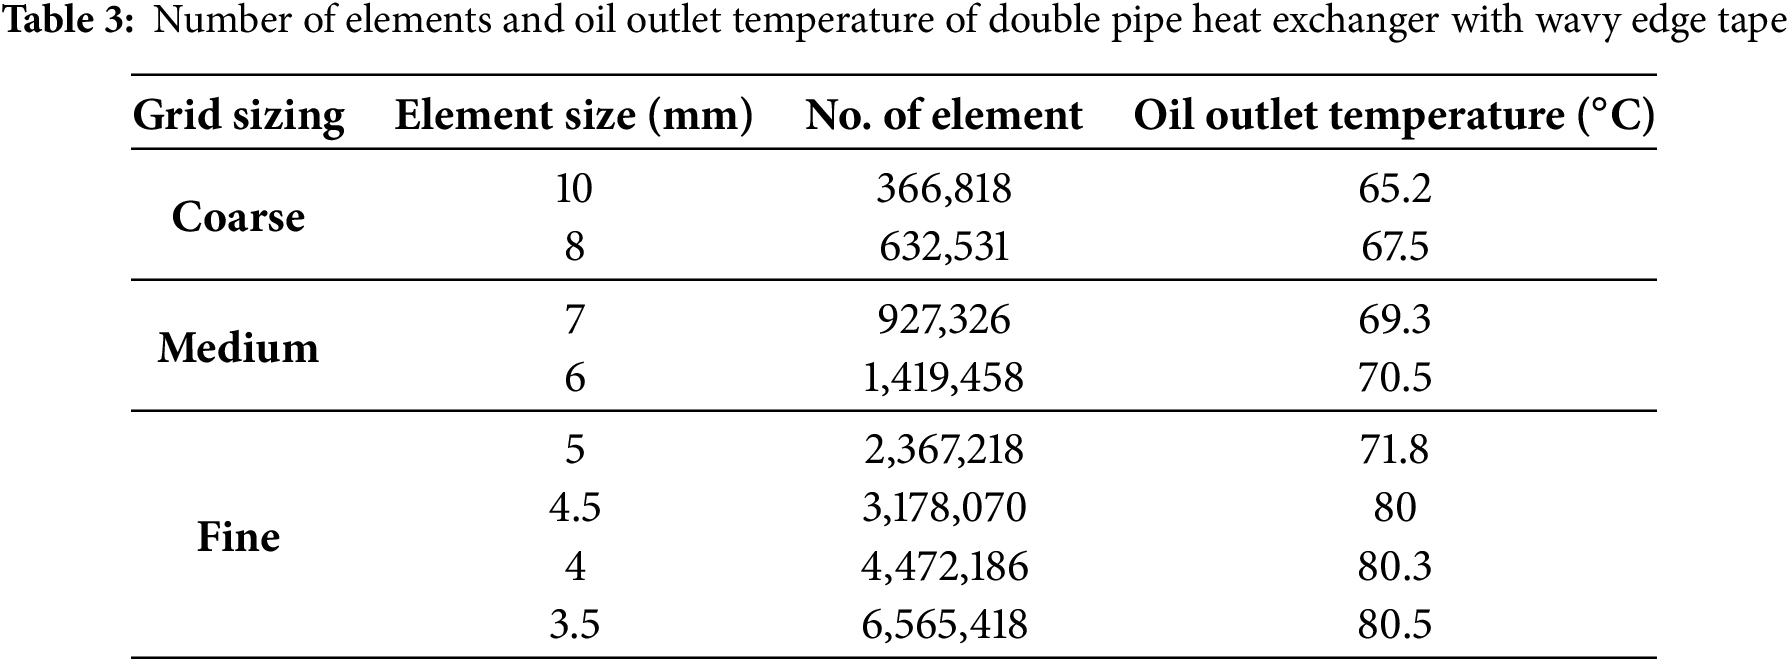

Figure 3: Mesh independence of smooth double pipe heat exchanger

Figure 4: Mesh independence of double pipe heat exchanger with wavy edge tape
The accuracy, efficiency, and stability of simulations, particularly for viscous flows over complex geometry, depend on the mesh quality, which requires longer operating time and more significant computer memory.
The mesh quality is evaluated through criteria such as orthogonal quality and skewness, which are crucial for determining elements’ appropriate shape and size [40].
Orthogonal Quality
Orthogonality is a crucial indicator affecting solution accuracy. It ranges from zero to one, with zero being the worst and one being the best. Fig. 5 shows the average orthogonal quality value in the model.

Figure 5: Orthogonal quality for (a) the smooth pipe and (b) wavy edge tape
Skewness
Skewness average measures mesh element quality, ranging from zero to one. Fig. 6 shows skewness average values in the model.

Figure 6: Skewness quality for (a) the smooth pipe, (b) wavy edge tape
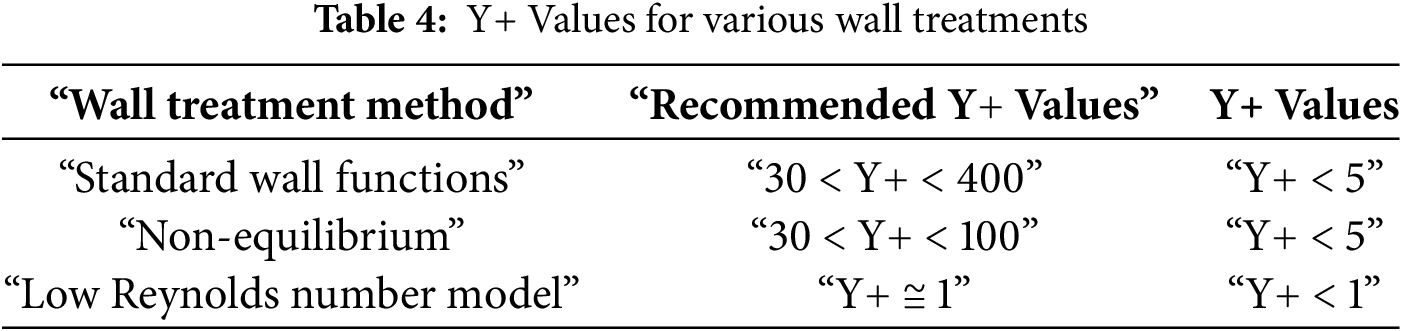
Y+ values are crucial for near-wall treatment, as faster flow near the wall results in larger values. They determine mesh coarseness and ideal cell size near domain barriers, constrained by turbulence model wall laws [41]. Table 4 shows Y+ values for various wall treatments.
Assuming certain conditions about the Navier-Stokes equations, which encompass several variables, facilitate their resolution.
1. Three-dimensional design.
2. Steady state.
3. The flow is turbulent in the inner pipe.
4. The flow is laminar in the outer pipe.
5. The flow is incompressible.
6. Newtonian fluid.
7. Single-phase model.
8. Adiabatic process (no heat losses).
The continuity, momentum, and energy equations employed for turbulent airflow in a circular duct with wavy edge tape inserts are as follows [42]:
Mass conservation (Continuity equation) [43]
Conservation of Momentum:
Conservation of Energy:
Heat transfer from the hot fluid is equal to the cold fluid.
(Nu) and (Δp) represent the Nusselt number and the pressure drop that increases when heat transfer enhancements (WET) are applied, while (Nu0) and (Δp0) represent the Nusselt number and the pressure drop for smooth pipes. A higher TPI value indicates a more efficient heat exchanger, while a lower value suggests excessive pressure drop.
where Qactual represents the actual heat transfer rate between the hot and cold fluids. Qmax represents the maximum possible heat transfer rate (if the cold fluid reached the hot fluid’s inlet temperature).
The standard k–ε model addresses the influence of turbulence on the flow. It is commonly employed in heat transfer due to its acceptable precision, durability, and economy for a wide category of turbulent flows. The k–ε turbulence model was chosen for this study due to its robustness, computational efficiency, and widespread application in industrial heat exchanger simulations. It is well-suited for fully developed turbulence, requires lower computational resources, and is widely validated for industrial applications. The transport equations for the conventional k-epsilon model are as follows [44]:
2.7.1 Turbulence Kinetic Energy Equation
2.7.2 Dissipation Rate (
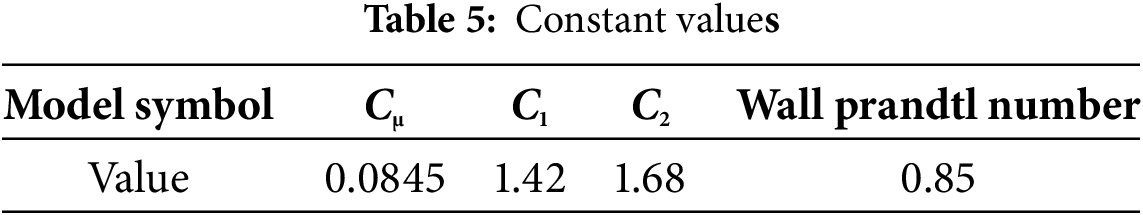
Gk and Gb compute the kinetic energy produced by turbulent motion resulting from mean velocity gradients. Table 5 demonstrates the model constants C1, C2, and Cµ relate to the diffusion of k and ε.
2.7.3 The Eddy Viscosity of Turbulent
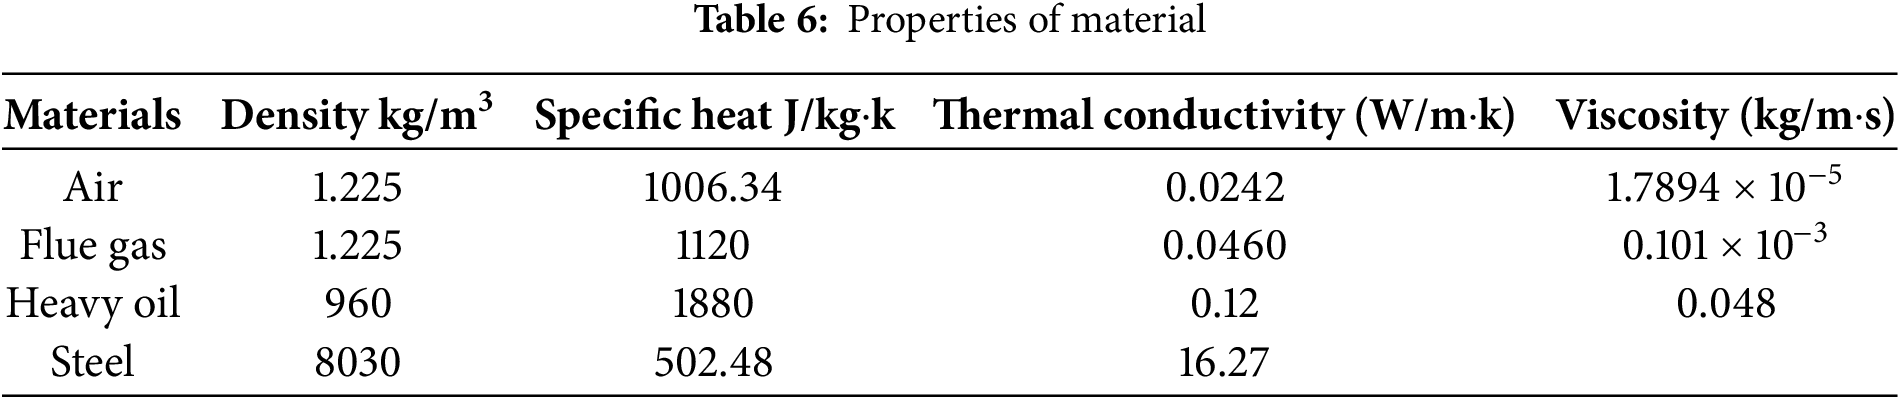
The choice to use steel tubes in double-pipe heat exchangers in brick manufacturing plants is due to their corrosion and rust resistance, high-temperature resistance, resistance to chemical reactions, efficient heat transfer, longer lifespan, lower maintenance, and compliance with health and safety standards. These advantages ensure high operational efficiency, cost reduction, and increased equipment lifespan. Moreover, the utilization of heavy fuel oil (HFO) is another cost-effective energy source for brick manufacturing plants due to its high thermal efficiency and wide availability in Wasit City. Also suitable for large kilns that operate continuously, allowing for efficient storage and use over time. The combustion process in HFO-fired kilns can be adjusted to achieve high thermal efficiency and minimize heat loss, improving overall performance and reducing emissions. The properties of the materials used in this study are listed in Table 6. It is necessary to define whether they are liquid or solid so that the program can identify them.
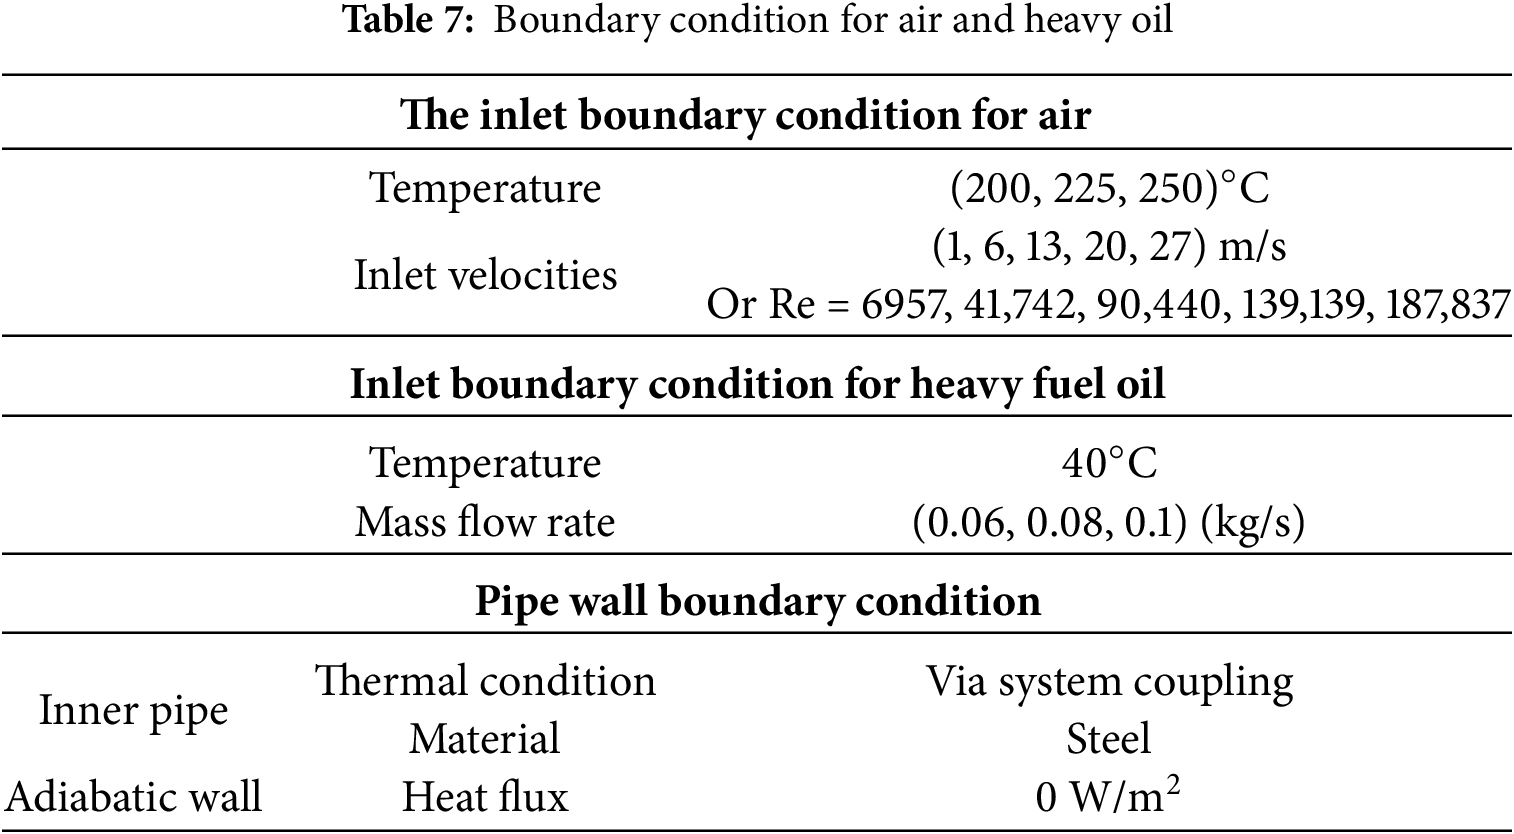
The boundary conditions utilized in this investigation are enumerated in the subsequent Table 7.
Creating a suitable mesh is a fundamental step in enhancing the accuracy of CFD simulation. An accurate mesh generated by a well-designed 3D model reduces the number of iterations, allowing complex geometries to be divided into sections that can be used to discretize a domain. The present study utilized a hybrid mesh of Hexa-Tetra and wedge elements, as depicted in Fig. 7.


Figure 7: Mesh of (a) smooth double pipe, (b) wavy edge tape
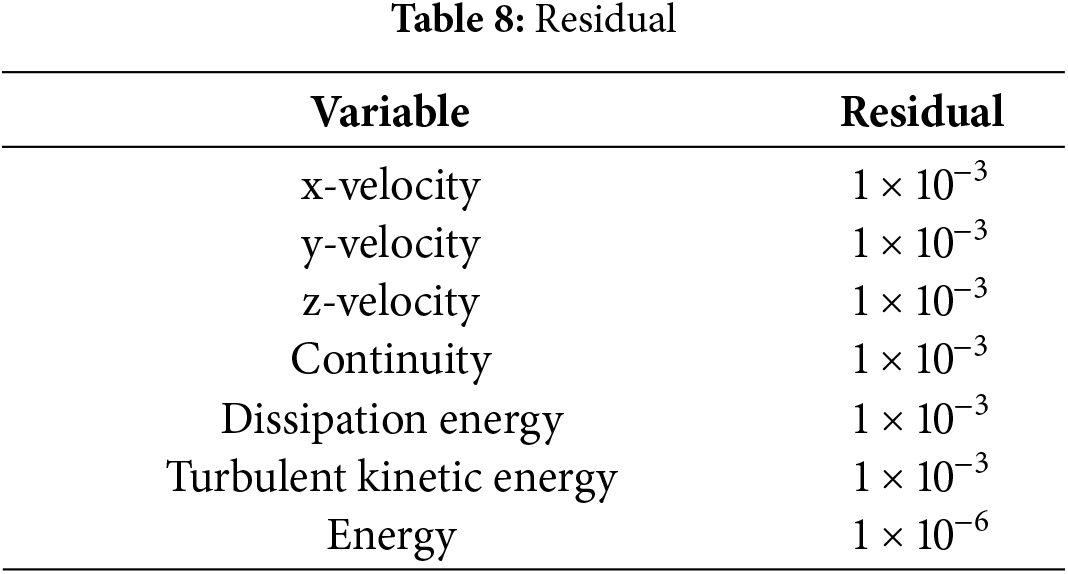
The residuals represent the error magnitudes for equations as iterations advance. The equations consist of the governing equations: The Navier-Stokes momentum equations, the continuity equation, and the energy equation. The equations may pertain to the turbulence model defined under viscous models. Convergence occurs when the answer approaches zero and stabilizes at a precise value after a certain number of repetitions. The residual is defined as the difference between the prior and current findings, as seen in Table 8.
The required iterations to get a converged result ranged from 900 to 2000. According to the condition illustrated in Fig. 8, the time necessary ranged from two to five hours, contingent upon the specific case.

Figure 8: Solution converging of smooth double pipe with wavy edge tape
Before commencing, examining the flow structure in the smooth pipe without the inserts was crucial to comprehending the local and global flow field features. The size and properties of a pipe with published numerical data were chosen for this investigation, and the CFD results were verified against the published data. Fig. 9 compares the heat transfer rate plotted against the airflow velocity for both the computational fluid dynamics (CFD) data acquired in this work and the experimental results from a prior study conducted by Salman et al. [45]. The comparison is made.

Figure 9: Validation of numerical results of heat transfer rate between the present study and the previous study [45]
8.2 Effect of Oil Mass Flow Rate on Heat Transfer Rate and Oil Outlet Temperature on Smooth Pipe
The study explains that increasing the oil mass flow rate increases the heat transfer rate (Q) directly proportional to the oil’s temperature difference (ΔT). However, this increase may not be proportional to the outlet oil temperature due to reduced residence time. Moreover, a higher mass flow rate enhances convection by increasing the Reynolds and Nusselt numbers, improving the convective heat transfer coefficient. The physical explanations for these variations are a low mass flow rate (0.06 kg/s), longer residence time, lower turbulence, higher oil outlet temperature, and higher overall heat transfer rate. The study concludes that a balance between flow rate and temperature increase is necessary for maximum efficiency.
Fig. 10a illustrates that when the oil mass flow rate escalates from 0.06 to 0.1 kg/s, the oil outlet temperature decreases across all three air inlet temperatures (200°C, 225°C, and 250°C). The ratio of temperature reduction may be analyzed to measure this drop over the specified range. At an air temperature of (200, 225, and 250)°C, the oil output temperature decreases, representing a nearly (8.6, 12.6, and 17)% reduction, respectively. This occurs because higher mass flow rates in a heat exchanger reduce oil’s residence time, limiting heat absorption per unit mass. Higher air inlet temperatures lead to higher oil outlet temperatures. Lower mass flow rates are preferred for higher outlet temperatures, while higher mass flow rates improve heat transfer efficiency.

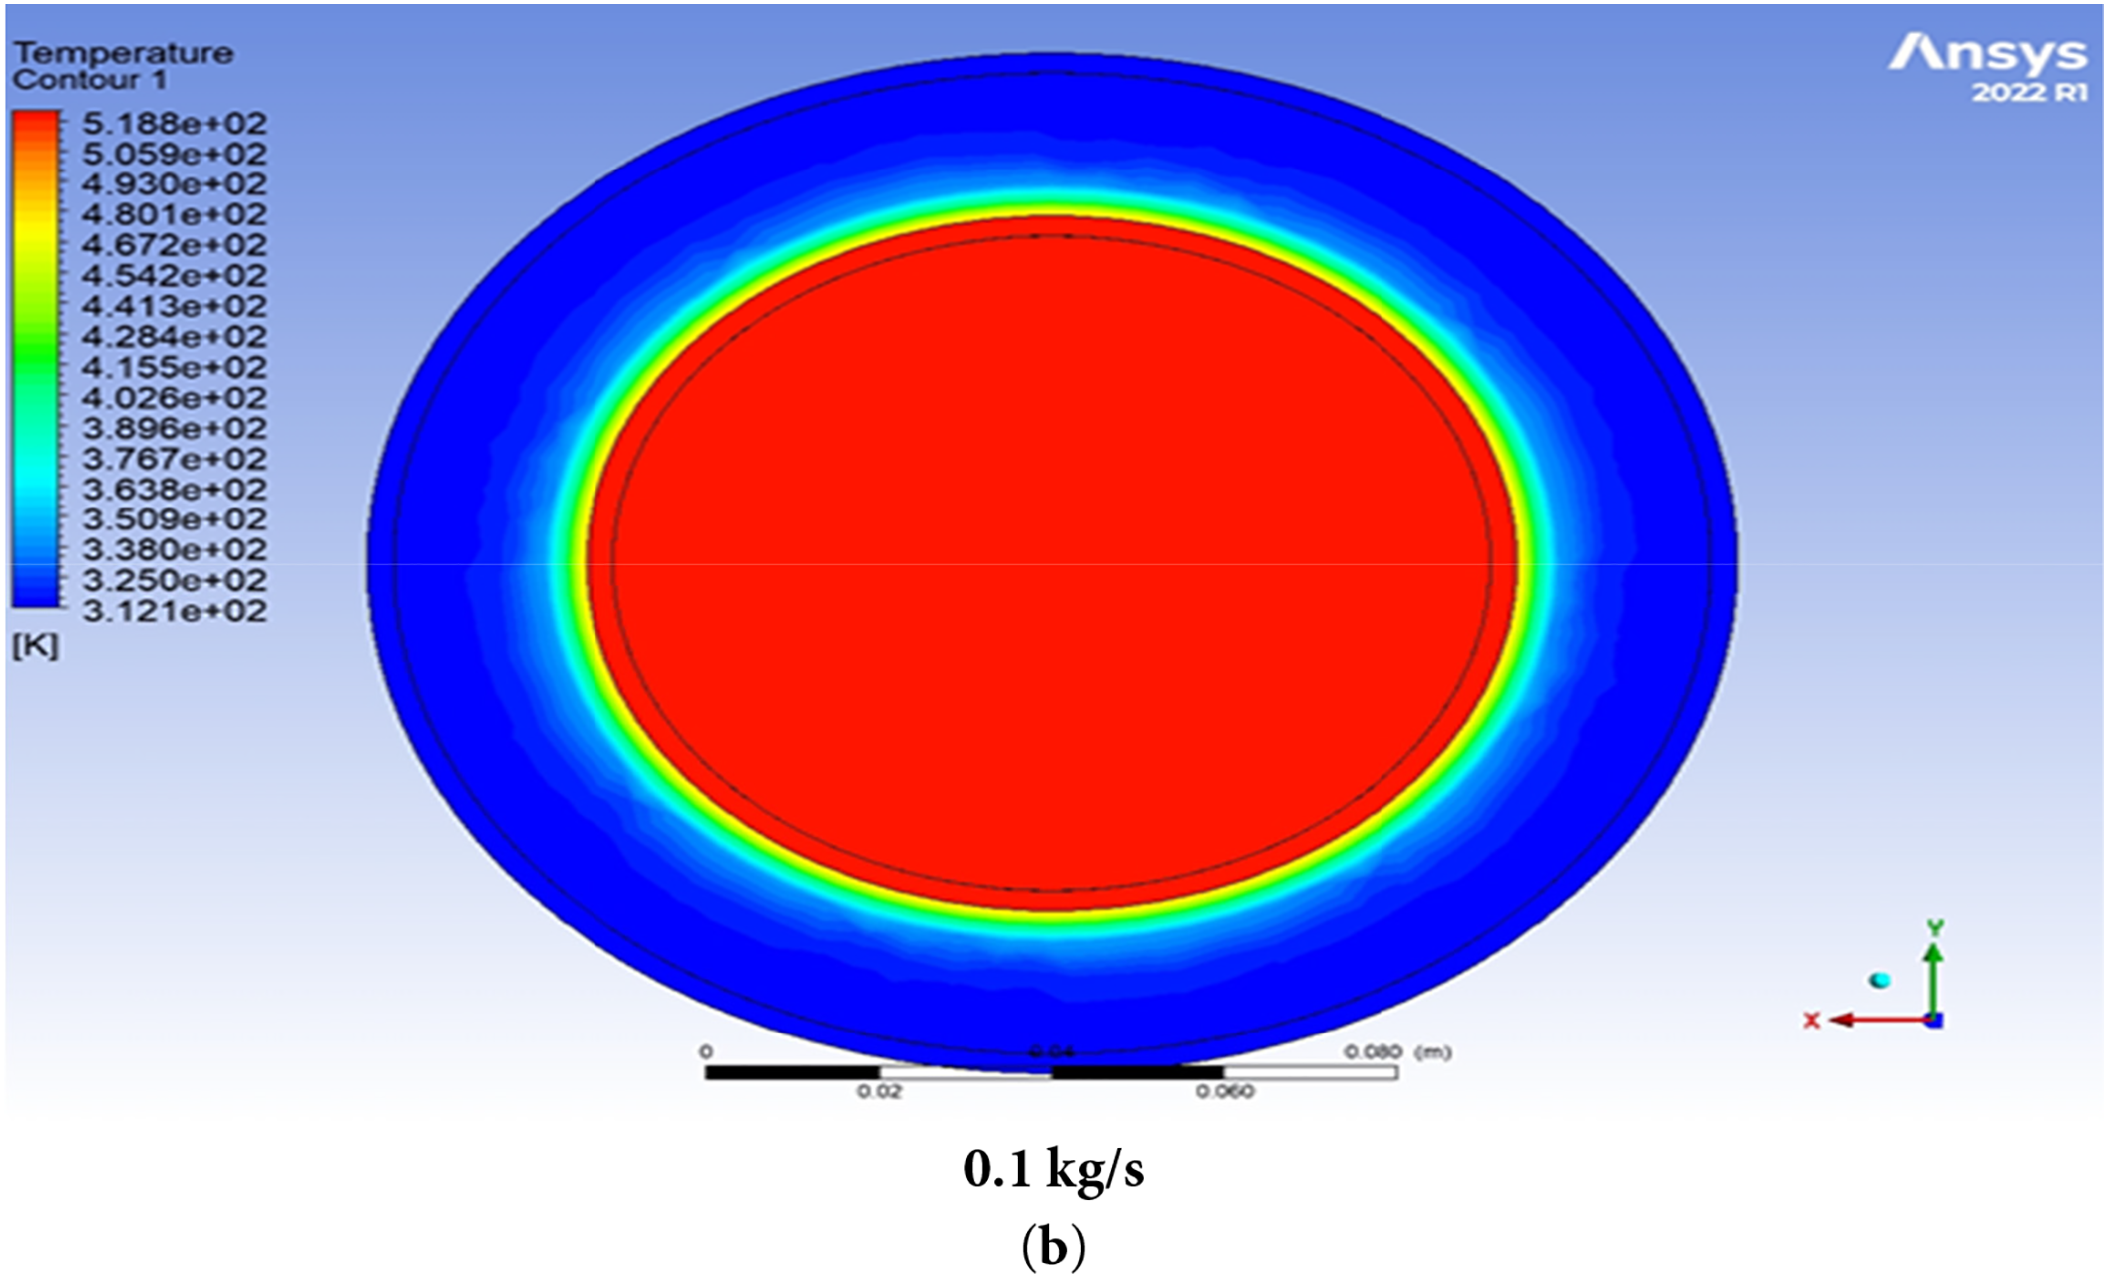
Figure 10: (a,b) Effect of oil flow rate on oil outlet temperature on the smooth pipe at (Vair = 27 m/s (Re = 187,837)). (a) Oil outlet temperature with various oil mass flow rates at (Tair = 200, 225, and 250)°C, Vair = 27 m/s (Re = 187,837)) in the smooth pipe. (b) contour plot of temperature with various oil mass flow rates at (Tair = 200°C, and Vair = 27 m/s (Reair = 187,837)) in the smooth pipe
Fig. 10b shows the contour plots showing the temperature distribution in a counter-flow double-pipe heat exchanger at different oil mass flow rates (0.06, 0.08, and 0.1 kg/s). The inner pipe carries hot air, while the outer oil region absorbs heat from the air. The inner red region remains constant, while the outer oil region shows an increasing temperature gradient. At 0.06 kg/s, the oil absorbs more heat per unit mass, leading to a thicker high-temperature region. The surrounding oil remains cooler as the flow rate increases, indicating improved heat dissipation. The thermal boundary layer effect is thicker at 0.06 kg/s, allowing heat to accumulate and penetrate the fluid.
Fig. 11 shows that higher mass flow rates result in faster heat transfer, enhancing heat exchanger performance. Lower mass flow rates are better for higher oil outlet temperatures, while higher mass flow rates enhance heat transfer efficiency by reducing thermal boundary layer thickness.

Figure 11: Heat transfer rate with various oil mass flow rates at (Vair = 27 m/s (Reair = 187,837), and Tair = 200°C) in the smooth pipe
8.3 The Effect of Wavy Edge Tape on the Thermal Performance
The wavy edge tape is used in a heat exchanger to improve heat transfer, which is a passive technique. It is inserted in the inner pipe to increase turbulence and create an effective flow path for the hot air, making better fluid mixing and minimizing temperature gradient,
Fig. 12a shown air velocity affects oil outlet temperature, with higher air velocity enhancing turbulence and heat transfer, so when the tape is added at a different hot air inlet temperature (200, 225, 250)°C, air velocity of (1–27) m/s, and cold oil at 40°C, it disrupts the smooth flow of hot air, forcing it into swirls and eddies, allowing more heat to be transferred. This also increases the contact time with the pipe wall, allowing more heat to be transferred. The wavy edge tape also increases heat flux through the pipe wall, causing the inner pipe to get hotter and warm the outer pipe surface more efficiently, resulting in an increase in the oil outlet temperature by about (3.2–11.5, 1.2–2.7, and 0.42–2.5)%, respectively, compared to the smooth pipe.

Figure 12: Influence of oil outlet temperature in smooth and wavy edge tape pipe at (moil = 0.06 kg/s). (a) Oil outlet temperature for various air velocities and air temperatures of WET pipe compared to smooth pipe at a constant oil flow rate of 0.06 kg/s; (b) Contour plots of the temperature of smooth and WET pipe at (Tair = 250°C, air velocity of 27 m/s, and oil flow rate of 0.06 kg/s)
The comparison of the temperature distribution of the enhanced tube with the plain tube at an air velocity of 27 m/s is shown in Fig. 12b. Smooth pipes observed uniform temperature distribution and flow with less mixing, while wavy edge tape pipes increased turbulence and mixing, allowing more hot air to interact with the pipe wall, enhancing heat transfer. The wavy edge tape also has stronger temperature gradients, allowing the hot fluid to cool down more rapidly and extract more heat, breaking boundary layers, increasing turbulence, and enhancing residence time, resulting in better thermal performance in the heat exchanger than in plain pipe.
Fig. 13a shows that a wavy edge pipe consistently has a higher pressure drop than a smooth pipe at all air velocities due to turbulence, longer flow paths, and flow separation effects. This effect is more significant at high velocities, leading to higher drag and energy losses. The wavy edge tape introduces obstructions and flow redirection, altering the flow dynamics and increasing turbulence intensity.
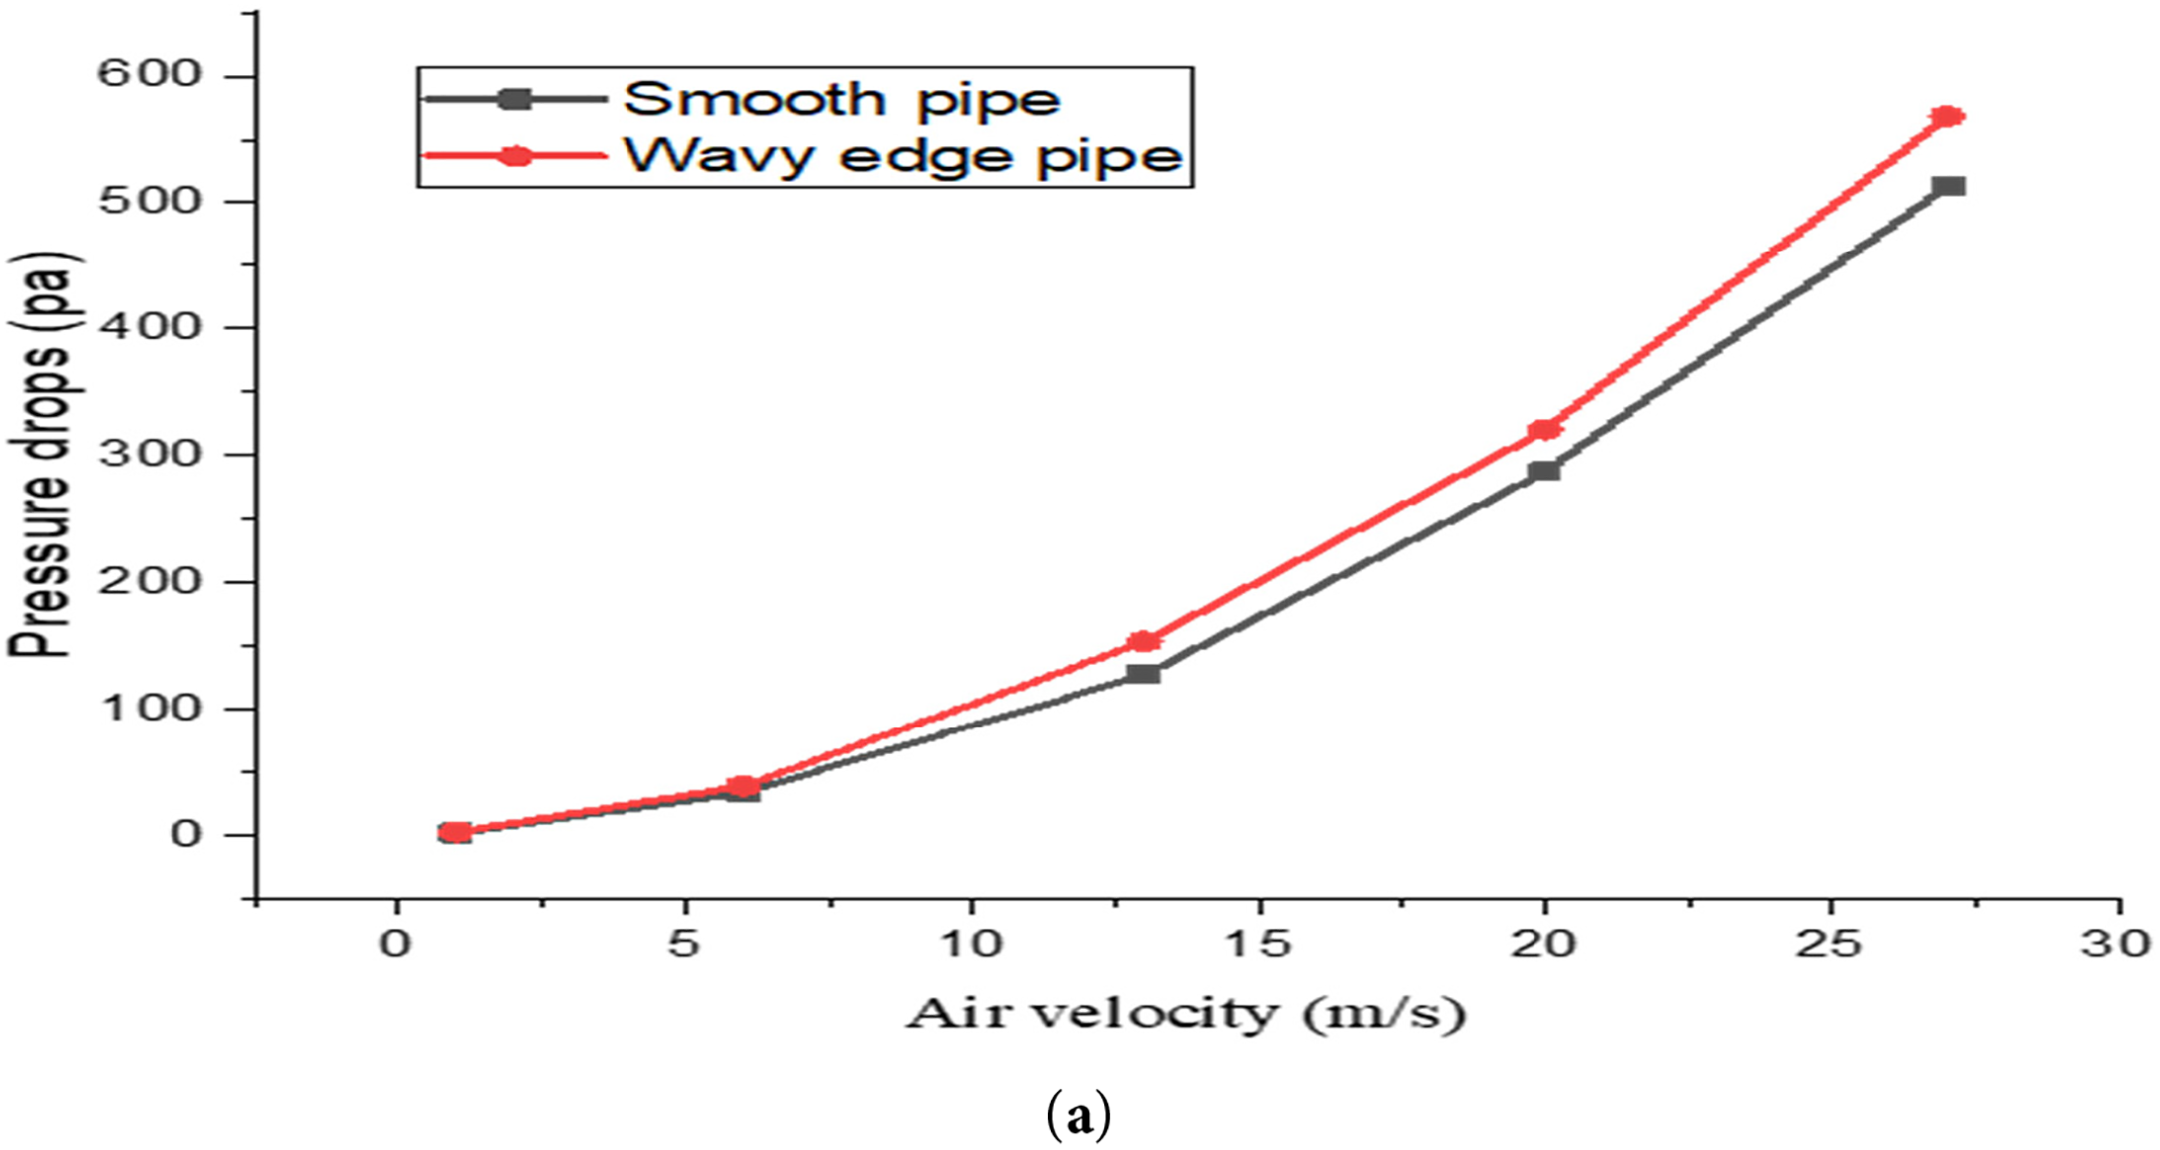

Figure 13: (a,b) Influence of pressure drop in smooth and wavy edge tape pipe at (Tair = 250°C, and moil = 0.06 kg/s). (a) Pressure drop with various air velocities of WET compared with a smooth pipe at (Tin, air = 250°C, moil = 0.06 kg/s); (b) Contour plots of pressure drop of WET compared to smooth pipe at constant air temperatures of 250°C, air velocity of 27 m/s, and oil flow rate of 0.06 kg/s
Fig. 13b shows pressure distribution in two different pipes. The smooth pipe shows a uniform pressure gradient along the flow direction, while the wavy edge tape pipe shows localized variations in pressure by about (10.7–33.3)% at 250°C due to its wavy structure. It enhances mixing and heat transfer but requires more energy consumption. So, it is more useful for heat transfer enhancement despite increased pressure loss.
Fig. 14 shows the smooth pipe and wavy edge tape (WET) pipes in terms of turbulence characteristics at 250°C and 0.06 kg/s oil flow rate. The wavy tape structure induces additional turbulence, enhancing mixing and heat transfer, and slightly higher turbulence levels at higher velocities, suggesting that the wavy tape structure disturbs the flow and induces additional turbulence from (6.6–8.3)% than the smooth pipe, which improves heat transfer by increasing the fluid-to-wall contact area and mixing.

Figure 14: Turbulence with various air velocities of WET compared to smooth pipe at (Tair = 250°C and oil flow rate of 0.06 kg/s)
Fig. 15 shows the effectiveness of heat exchangers, which is the efficiency of heat transfer between two fluids compared to its maximum possible transfer. It is calculated as the ratio of actual heat transfer to the maximum possible heat transfer in the system. As expressed in Eq. (11). Higher effectiveness indicates better heat exchanger performance. Factors affecting effectiveness include heat exchanger type, flow arrangement, surface area and turbulence, and the thermal conductivity of materials. Surface area and higher turbulence enhance heat transfer and increase effectiveness. This combination of increased heat transfer coefficient and enhanced turbulence leads to a higher heat exchanger effectiveness of (0.8–4.9)% compared to smooth pipe.

Figure 15: Effectiveness for various air velocities of WET compared to smooth pipe at constant air temperatures of 250°C and oil flow rate of 0.06 kg/s
8.4 Effect of the Width of Wavy Edge Tape on a Thermal Characteristic
This study examined three types of wavy-edge tape widths (50, 75, and 95)% Di. Increased wavy-edge tape width generates more vigorous fluid blending due to amplified centrifugal force, facilitating rapid heat transmission between the fluid and the heat exchanger wall.
In Fig. 16, wider twisted tapes absorb more heat from the wall, leading to a higher oil outlet temperature of 0.6% compared to the smooth pipe. However, the width of these tapes significantly impacts the heat transmission rate. Wider twisted tapes cause more pronounced secondary flow patterns, resulting in heightened turbulence and improved mixing. This increases heat transfer coefficients and pressure drop across the heat exchanger.

Figure 16: Oil outlet temperature with various air velocities and various tape widths of WET pipe compared to smooth pipe at (Tair = 250°C & moil = 0.06 kg/s)
Fig. 17 shows that the tape width of 50% has less surface area for flow obstruction, leading to lower pressure drop and moderate heat transfer enhancement. A width tape with 75% Di, turbulence, and improved heat transfer results in a mild increase in pressure drop. The widest tape, which almost completely blocks the pipe cross-section, has the highest turbulence, heat transfer rate, and maximum pressure drop due to increased resistance. The study suggests that varying the tape width can improve heat transfer and reduce pressure drop in such systems. The friction factor f (f) in turbulent flow is determined by using the empirical equation:

Figure 17: Pressure drops with various air velocities and various tape widths (50, 75, and 95)% Di of WET pipe compared to smooth pipe at (Tair = 250°C & moil = 0.06 kg/s)
f decreases with increasing Re.
We calculate the Darcy-Weisbach equation can be used to calculate the pressure drop (ΔP) as:
where f = Friction factor (depends on Reynolds number and pipe roughness), L = Pipe length, dh = Hydraulic diameter, ρ = Fluid density, u = Mean velocity of the fluid.
The Nusselt number (Nu) measures heat transfer at the fluid boundary layer as calculated by [42]:
where h: Heat transfer coefficient, k: Thermal conductivity of air, D: Inner pipe diameter.
The results show that 75% Di is the optimal heat transfer and flow resistance. The heat transfer coefficient (h) is directly proportional to Nu, and as Nu increases with increasing width by about (2.5, 5.6, and 8.25)%, respectively, so does the heat transfer coefficient (h), leading to a better thermal performance index (TPI) of about (1.02) due to a significant increase in Nu compared to the rise in resistance. As shown in Fig. 18.

Figure 18: Nusselt number for various air Reynold number (6957–187,837), and tape widths (50, 75, and 95)% Di of WET pipe compared to smooth pipe at (Tair = 250°C & moil = 0.06 kg/s)
The performance of a heat exchanger is evaluated using the thermal Performance Index (TPI) in Fig. 19. It is a metric expressed in Eq. (10) is used to evaluate the effectiveness of heat transfer enhancement techniques without excessive energy losses. It balances heat transfer and pressure drop, ensuring that any increase in Nu is not overly penalized by Δp. The cubic root (1/3) exponent is commonly used to normalize pressure drop impact, ensuring that any increase in Nu is not excessively penalized. The derivative of TPI can expressed as:

Figure 19: The thermal performance index for various tape widths pipes at (Tair = 250°C & moil = 0.06 kg/s, and Reair = 187,837)
Rewrite TPI expressed in Eq. (10) in Power Form;
Differentiate TPI: Taking the derivative concerning Nu and Δp:
1. Partial Derivative concerning Nu:
Since TPI is directly proportional to Nu, increasing Nu increases TPI.
2. Partial Derivative concerning Δp:
Using the power rule:
Since the exponent is negative, increasing Δp reduces TPI, confirming the trade-off between heat transfer and pressure drop.
Moreover, a higher Thermal Performance Index (TPI) can significantly reduce pumping power and cost by improving heat transfer, reducing flow rate requirements, and reducing temperature difference. A wavy edge tape or twisted tape insert with a higher TPI increases turbulence in hot air flow, allowing more heat to be transferred efficiently. This reduces flow rate, pumping power, pressure drop, and energy consumption, lowering operational costs. A larger TPI also allows heat exchangers to be shorter or more compact, resulting in a reduction in pumping power related to [42]:
where P represents pumping power, ΔP represents pressure drop, Q represents volumetric flow rate, and η represents pump efficiency.
8.5 Effect of Length of WET on Oil Outlet Temp, Pressure Drop, Nu, and TPI
Three different lengths of (1000, 1200, 1400) mm are tested in this study. In Fig. 20, a range of air velocity of about (1–27) m/s, the results showed that the twisted tape with a length of 1400 mm significantly enhances the heat transfer surface area between the air and the oil, as a result improving oil outlet temperature by about (1.001–1.003), (1.005–1.02) times relative to the (1200, and 1000) mm lengths and (0.06–3)% compared to the smooth pipe. This occurs due to the prolonged contact between the air and the inner surface of the pipe, which also leads to a high-pressure drop, which can lead to increased pumping power requirements and reduced system efficiency.

Figure 20: Impact of oil outlet temperature at different air velocities and tape lengths (1000, 1200, 1400) mm of WET pipes in comparison to a smooth pipe, maintaining at (Tair = 250°C and moil = 0.06 kg/s)
Fig. 21 demonstrated that the flow in the inner pipe becomes more turbulent. The pressure drop increases linearly with tape length, indicating that longer WET introduces more flow disturbances, resulting in higher frictional losses due to Eq. (16). The WET length of 1400 mm is the length of contact the air has with the tape, increasing total energy dissipation in the system. Additionally, the interaction of air with the wavy edges generates vortices along the pipe length, intensifying the mixing between core flow and near-wall flow. The wavy edge tape forces air to detach and reattach to the tape edges and pipe wall, creating localized low-pressure regions, increasing the overall pressure drop in the system, and requiring higher pumping power to maintain flow. As the length of the WET increases, more surface contact leads to higher frictional losses, increased swirls and vortices, a more substantial flow blockage effect, and greater recirculation and separation zones. Alongside these improvements, longer WET increases pressure drop, necessitating more energy supply to overcome friction losses and increase operational costs for industrial heat exchangers. An optimal WET length must balance efficiency and cost-effectiveness. So, an increase in heat transfer is accepted in the length of 1200 mm at the expense of the rise in pressure drop by about (0.8–0.9), (1.06–1.2) times relative to 1400 and 1000 mm length, respectively, resulting from friction.

Figure 21: Impact of pressure drop at different air velocities and tape lengths (1000, 1200, 1400) mm of WET pipes in comparison to a smooth pipe, maintaining at (Tair = 250°C and moil = 0.06 kg/s)
In Fig. 22, the Nusselt number (Nu) is a key indicator of convective heat transfer performance, and the optimal length is around 1200 mm. The heat transfer coefficient (h) is directly related to Nu as Eq. (15) As Nu increases with tape length by about (1.9, 4.3, 5.5)% compared to smooth, the heat transfer coefficient also improves, leading to better thermal performance. However, after a certain length (1400 mm), the increase in h slows down due to fully developed flow.

Figure 22: Impact of Nusselt number for different air Reynold number (6957–187,837) and tape lengths (1000, 1200, 1400) mm of WET pipes in comparison to a smooth pipe, maintaining at (Tair = 250°C and moil = 0.06 kg/s)
The sudden drop in the Thermal Performance Index (TPI) in Fig. 23, when wavy edge tape length increases from 1200 mm to 1400 mm, can be attributed to various flow physics, vortex dissipation, and swirl flow weakening, which enhances turbulence and heat transfer rate. However, as the tape length increases, the swirl intensity decays due to viscous dissipation, the thermal boundary layer growth, and heat transfer saturation, which weakens the temperature gradient and reduces heat transfer effectiveness, increasing frictional losses and pressure drop, leading to a higher friction factor and increased pressure drop, finally, the transition from turbulence enhancement to resistance-dominating regime, which reduces TPI. The TPI was calculated considering both heat transfer enhancement and pressure drop. Nevertheless, in this particular scenario, the main objective is to enhance the oil outlet’s temperature at the least cost. So, length (1200) is the optimal measurement that yielded an improved thermal performance index (TPI) expressed in Eq. (10) by about (1.007) for HE.
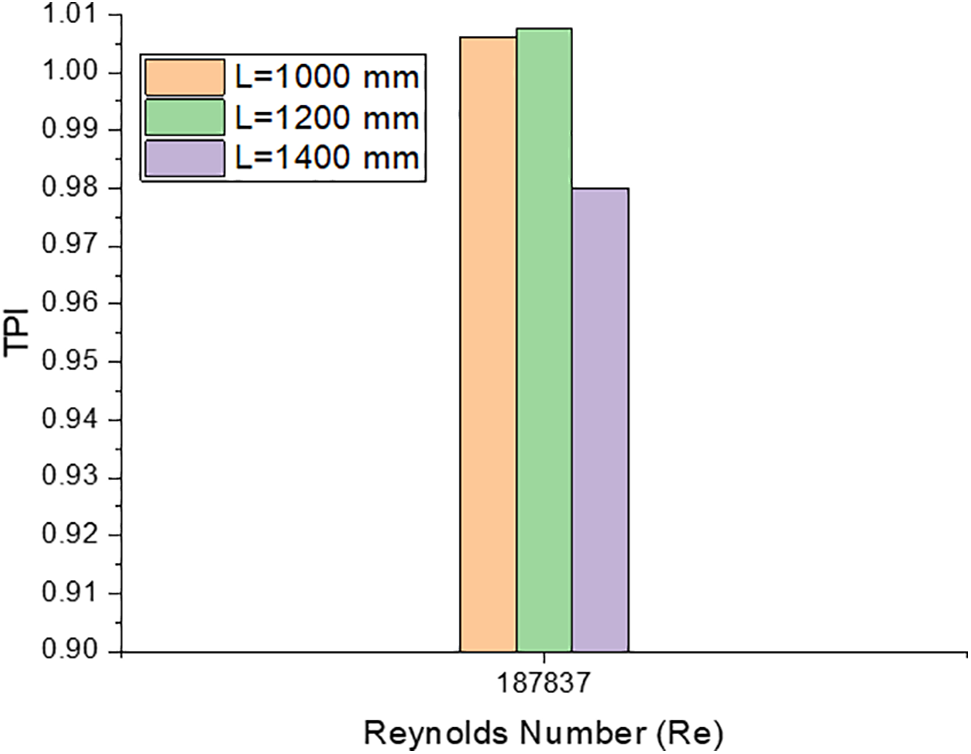
Figure 23: Thermal performance index (TPI) for various tape lengths of WET pipe at (Reair = 187,837, Tair = 250°C and moil = 0.06 kg/s)
8.6 Effect of the Amplitude of WET on Oil Outlet Temp, Pressure Drop, Nu, and TPI
Three types of amplitude (5, 10, 15) mm are used. In Fig. 24, the wavy edge amplifies flow disruption as the oil passes the tape. Increased amplitudes result in more prominent protrusions, which induce enhanced swirling motion and secondary flows, improving fluid layer mixing. This interferes with the thermal boundary layer on the pipe’s surface, where the temperature differential is most pronounced, and enhances the heat transfer coefficient between the hot air in the inner tube and the cold oil in the outer tube. This results in a higher oil outlet temperature by about (0.4–2.5) and (0.6–3)%, respectively, compared to the smooth pipe.

Figure 24: Oil outlet temperature for various air velocities and tape amplitude of WET compared to smooth pipe at a constant air temperature of 250°C & oil mass flow rate of 0.06 kg/s
In Fig. 25, the wavy edge shape impedes flow, resulting in flow separation, vortices, and recirculation zones. Increased amplitudes result in more pronounced protrusions inside the flow channel, augmenting frictional resistance and diminishing the effective cross-sectional area for oil flow. This results in a higher pressure drop of about (1.1–1.3), (1.2–1.5), and (1.27–2) times, respectively, compared to the smooth pipe.
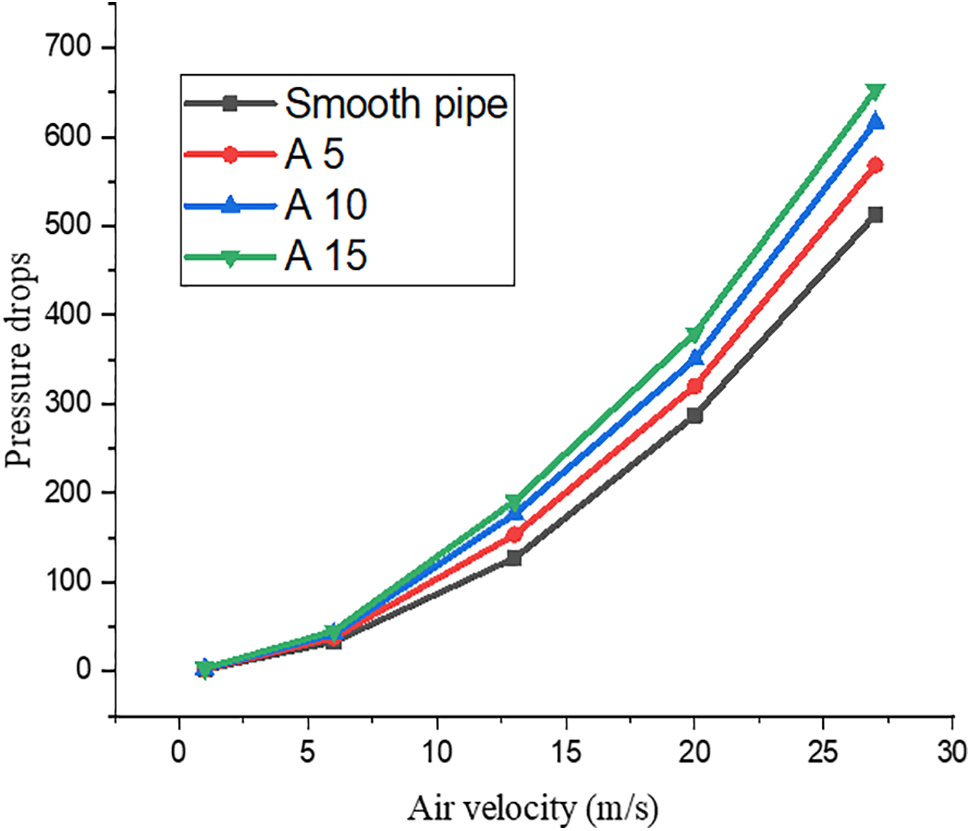
Figure 25: Pressure drops for various air velocities and tape amplitude of WET compared to smooth pipe at a constant air temperature of 250°C & oil mass flow rate of 0.06 kg/s
In Fig. 26, the optimal amplitude is around 5 mm, where Nu increases significantly without excessive resistance. The heat transfer coefficient (h) is directly related to the Nusselt number, with higher amplitude leading to higher Nu by about (5.6%, 6%, and 6.7%). The optimal amplitude is 5 mm, which provides the best balance between heat transfer improvement and pressure drop. However, excessive amplitudes can reduce efficiency due to higher resistance.

Figure 26: Nusselt number for various air Reynold number (6957–187,837), and tape amplitude of WET pipe compared to smooth pipe at a constant air temperature of 250°C & oil mass flow rate of 0.06 kg/s
The thermal performance index (TPI) is expressed in Eq. (10) as shown in Fig. 27. Based on that, a WET of 1200 mm length and 15 mm width was chosen.

Figure 27: Thermal performance index (TPI) for various tape amplitude of WET compared to smooth pipe at a constant air temperature of 250°C, Reair = 187,837 & oil mass flow rate of 0.06 kg/s
8.7 Effect of a Period of WET on Oil Outlet Temp, Pressure Drop, Nu, and TPI
In Fig. 28, it shows three WET types (5, 10, 15) that have been tested. The period refers to a wavy structure’s wavelength, influencing fluid interaction with the tape, affecting turbulence, boundary layer disruption, and flow resistance. A shorter period increases secondary flow, enhancing fluid mixing and preventing the growth of the thermal boundary layer. This leads to a higher heat transfer coefficient, the oil outlet temperature of about (0.1, 1.7, and 0.4), compared to (10p, 15p) and smooth pipe. As shown in Fig. 29.

Figure 28: Period wavy lengths of WET

Figure 29: Oil outlet temperature for various air velocities and tape periods of WET pipe compared to smooth pipe at a constant air temperature of 250°C & oil mass flow rate of 0.06 kg/s
In Fig. 30, the 15 mm period of the tape creates a balance between turbulence and flow stability, reducing pressure drop. The spacing between disturbances is more significant in shorter periods, resulting in fewer flow disruptions per unit length of the pipe. The optimal performance at 15 mm is likely to provide the best compromise between heat transfer enhancement and pressure drop, ensuring efficient thermal performance while minimizing energy consumption and operational costs. The Darcy-Weisbach Eq. (16) for pressure drop shows that the 15 mm period results in a lower friction factor (f) than a shorter period while maintaining a significant heat transfer enhancement.
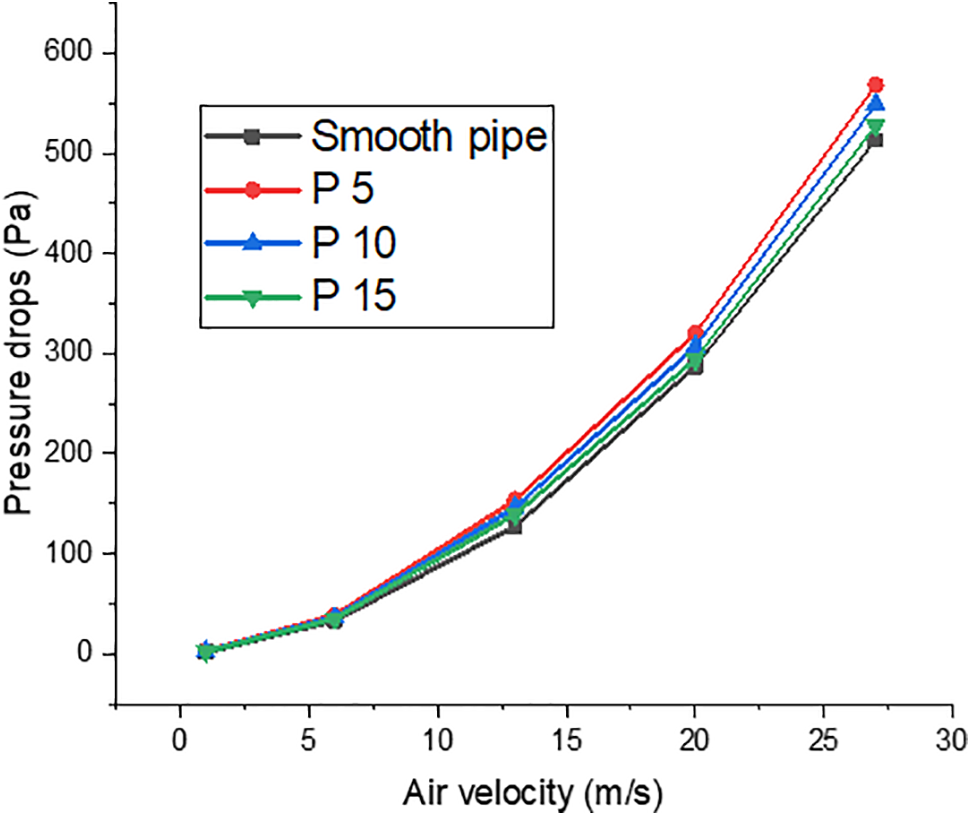
Figure 30: Pressure drops for various air velocities and tape periods of WET pipes compared to smooth pipe at a constant air temperature of 250°C & oil mass flow rate of 0.06 kg/s
In Fig. 31, the Nusselt number (Nu) is a measure of convective heat transfer, and the duration of the heat exchanger influences it. Periods by about 5 and 10 mm generate high turbulence but short-lived vortices, resulting in increased pressure drop. The extended 15 mm period forms stronger, more stable vortices, allowing hot air to stay in contact with the pipe surface for longer and reducing flow obstructions. This results in a maximum Nu due to sustained turbulence and reduced resistance. The heat transfer coefficient (h) is directly related to Nu, and the 15 mm period maximizes Nu by producing efficient, sustained vortices. This results in the highest h among the tested periods. So, the 15 mm period is the best for heat exchanger performance, as it maximizes Nu and the heat transfer coefficient without excessive resistance. This optimizes heat transfer without excessive resistance, increasing effectiveness and the Thermal Performance Index (TPI) expressed in Eqs. (18)–(20) as shown in Fig. 32.

Figure 31: Nusselt number for various air velocities and tape periods of WET compared to smooth pipe at a constant air temperature of 250°C & oil mass flow rate of 0.06 kg/s

Figure 32: Thermal performance index (TPI) for various air Reynold number (6957–187,837) and tape periods of WET compared to smooth pipe at a constant air temperature of 250°C & oil mass flow rate of 0.06 kg/s
A newly constructed computational fluid dynamics (CFD) model was used. This study aimed to improve heat transfer and reduce pressure drop in the counter flow of a double-pipe heat exchanger by modifying the geometry of the inserted wavy edge tapes and selecting the optimal design with a wavy edge to enhance turbulence intensity and liquid mixing. The present work has been done with different geometrical cases, namely: (I) a pipe without a wavy edge tape (smooth), (II) a pipe with various (widths, lengths, amplitude, and periods) of wavy edge tape. The effects of air and oil flow velocities and air temperature on the oil outlet temperature, Nusselt number, pressure drop, and thermal performance index have been analyzed for all cases. The simulations provided the following discoveries:
• Increasing the “oil mass flow rate” from (0.06 to 0.1) kg/s decreases the oil outlet temperature by about 7% and increases the heat transfer rate by 37%.
• The wavy-edge tape inserts increase the oil outlet temperature by about 0.42% compared to the oil outlet temperature in a smooth pipe.
• The pressure drops, turbulence, and effectiveness through the pipe-with-inserts were more than (10.7, 8.3, 0.8)%, respectively, through the same pipe without the insert.
• The oil outlet temperature and Nu were increased by (0.2, 0.42, 0.6)% and (2.5, 5.6, 8.25)% when using WET inserts compared to plain tubes. This improvement was observed for widths of 50%, 75%, and 95% Di.
• The ideal TPI of about 1.02 is found to be at 75% Di owing to the rise in pressure drop caused by the widening of the WE tape.
• The oil outlet temperature and Nu were increased by (0.16, 0.6, 0.62)% and (1.9, 4.3, 5.5)% when using WE tape inserts compared to plain tubes. This improvement was observed when the length of the tubes varied between 1000, 1200, and 1400 mm due to the reduction in the thickness of the boundary layer, resulting in an accelerated heat transfer process. However, the optimal (TPI) of about (1.0077) has been done in 1200 mm length tape when considering the increase in pressure drop.
• The oil outlet temperatures and Nu were increased by (0.4%, 1.3%, and 1.4%) and (5.6%, 6%, and 6.7%) when using WE tape inserts compared to plain tubes. This improvement was observed for amplitude of 5, 10, and 15 mm due to the substantial increase in flow resistance, and the ideal TPI in this case, about (1.02), occurs at an amplitude of 5 mm when there is an increase in pressure drop owing to worry.
• Increasing the period wavy length of the WET from (5 to 15) leads to a decrease in oil temperatures and Nu and a decrease in the pressure gradient. Therefore, the beast TPI was found at 15-period wavy length due to its best effect.
• According to the results, the highest thermal performance index is obtained around air velocity of 27 m/s and 250°C for the (75% Di, 1200 mm, 5 A, and 15 P) wavy edge tape element width, length amplitude, and period, respectively. On the other hand, the minimum pressure drop is calculated for the 15 period.
Comprehending the impact of the specified alterations was crucial for optimizing heat transfer in heat exchangers to achieve cost-effective design, decrease energy consumption, and mitigate pollution.
Future research could focus on exploring different twisted ratios, incorporating perforated wavy-edge tape, and utilizing Nano fluids to further enhance heat transfer performance and optimize heat exchanger efficiency for industrial applications.
Acknowledgement: The authors would like to acknowledge the constructive remarks of worthy reviewers that led this revised article.
Funding Statement: The authors received no specific funding for this study.
Author Contributions: The authors confirm their contribution to the paper as follows: study conception and design: Zainab Mahdi Saleh, Riyadh S. Al-Turaihi, and Zena Khalefa Kadhim; data collection, analysis and interpretation of results: Zainab Mahdi Saleh; draft manuscript preparation: Zainab Mahdi Saleh, Riyadh S. Al-Turaihi, and Zena Khalefa Kadhim. All authors reviewed the results and approved the final version of the manuscript.
Availability of Data and Materials: Not applicable.
Ethics Approval: Not applicable.
Conflicts of Interest: The authors declare no conflicts of interest to report regarding the present study.
References
1. Tang F, Nowamooz H. Factors influencing the performance of shallow borehole heat exchanger. Energy Convers Manag. 2019;181:571–83. doi:10.1016/j.enconman.2018.12.044. [Google Scholar] [CrossRef]
2. Abedin MZ, Sarkar MAR. Experimental study of heat transfer enhancement through a tube with wire-coil inserts at low turbulent reynolds number. Int J Eng Mater Manuf. 2018;3(3):122–33. doi:10.26776/ijemm.03.03.2018.01. [Google Scholar] [CrossRef]
3. Verma A, Kumar M, Patil AK. Enhanced heat transfer and frictional losses in heat exchanger tube with modified helical coiled inserts. Heat Mass Transf. 2018;54(10):3137–50. doi:10.1007/s00231-018-2347-x. [Google Scholar] [CrossRef]
4. Purandare PS, Lele MM, Gupta RK. Investigation on thermal analysis of conical coil heat exchanger. Int J Heat Mass Transf. 2015;90(2):1188–96. doi:10.1016/j.ijheatmasstransfer.2015.07.044. [Google Scholar] [CrossRef]
5. El Maakoul A, El Metoui M, Ben Abdellah A, Saadeddine S, Meziane M. Numerical investigation of thermohydraulic performance of air to water double-pipe heat exchanger with helical fins. Appl Therm Eng. 2017;127:127–39. doi:10.1016/j.applthermaleng.2017.08.024. [Google Scholar] [CrossRef]
6. Abu-Hamdeh NH, Alsulami RA, Rawa MJH, Aljinaidi AA, Alazwari MA, Eltaher MA, et al. A detailed hydrothermal investigation of a helical micro double-tube heat exchanger for a wide range of helix pitch length. Case Stud Therm Eng. 2021;28(8):101413. doi:10.1016/j.csite.2021.101413. [Google Scholar] [CrossRef]
7. Najm A, Jumaah ID, Karim AMA. Effect of using a double coil tube with modified pitch on the overall heat transfer rate. Diyala J Eng Sci. 2022;15(1):40–53. doi:10.24237/djes.2022.15104. [Google Scholar] [CrossRef]
8. Xu P, Zhou T, Xing J, Chen J, Fu Z. Numerical investigation of heat-transfer enhancement in helically coiled spiral grooved tube heat exchanger. Prog Nucl Energy. 2022;145(1):104132. doi:10.1016/j.pnucene.2022.104132. [Google Scholar] [CrossRef]
9. Chu WX, Tsai CA, Lee BH, Cheng KY, Wang CC. Experimental investigation on heat transfer enhancement with twisted tape having various V-cut configurations. Appl Therm Eng. 2020;172:115148. doi:10.1016/j.applthermaleng.2020.115148. [Google Scholar] [CrossRef]
10. Al-Obaidi AR. Monitoring the performance of centrifugal pump under single-phase and cavitation condition: a CFD analysis of the number of ImpellerBlades. J Appl Fluid Mech. 2019;12(2):445–59. doi:10.29252/jafm.12.02.29303. [Google Scholar] [CrossRef]
11. Yaningsih I, Wijayanta AT, Miyazaki T, Koyama S. V-cut twisted tape insert effect on heat transfer enhancement of single phase turbulent flow heat exchanger. AIP Conf Proc. 2018;1931(1):30038. doi:10.1063/1.5024097. [Google Scholar] [CrossRef]
12. Wijayanta AT, Pranowo M, Kristiawan B, Aziz M. Internal flow in an enhanced tube having square-cut twisted tape insert. Energies. 2019;12(2):306. doi:10.3390/en12020306. [Google Scholar] [CrossRef]
13. Wijayanta AT, Kristiawan B, Pranowo, Premono A, Aziz M. Computational fluid dynamics analysis of an enhanced tube with backward louvered strip insert. Energies. 2019;12(17):3370. doi:10.3390/en12173370. [Google Scholar] [CrossRef]
14. Yaningsih I, Tri Wijayanta A. Influences of pitch-length louvered strip insert on thermal characteristic in concentric pipe heat exchanger. MATEC Web Conf. 2017;101(7):3014. doi:10.1051/matecconf/201710103014. [Google Scholar] [CrossRef]
15. Kumar R, Chandra P, Prabhansu. Innovative method for heat transfer enhancement through shell and coil side fluid flow in shell and helical coil heat exchanger. Arch Thermodyn. 2020;41(2):239–56. doi:10.24425/ather.2020.133631. [Google Scholar] [CrossRef]
16. Saleh SA, Kadhim ZK, Khalaf KA. CFD simulation of helical coil heat exchanger with Different coil pitch to heating heavy fuel oil. Wasit J Eng Sci. 2023;119(3):120–39. [Google Scholar]
17. Saleh SAA, Kadhim ZK, Khalaf KA. An experimental study of heating heavy fuel oil by hot air using helical fins in a double-pipe heat exchanger. J Adv Res Fluid Mech Therm Sci. 2023;112(2):102–15. [Google Scholar]
18. Nakhchi ME, Esfahani JA. Numerical investigation of turbulent Cu-water nanofluid in heat exchanger tube equipped with perforated conical rings. Adv Powder Technol. 2019;30(7):1338–47. doi:10.1016/j.apt.2019.04.009. [Google Scholar] [CrossRef]
19. Alnasur FS, Alturaihi RS. Numerical study of hydrothermal enhancement of two-phase flow in a vertical pipe by using modified Vortex generators. J Adv Res Fluid Mech Therm Sci. 2024;124(2):13–38. doi:10.37934/arfmts.124.2.1338. [Google Scholar] [CrossRef]
20. Guled CN, Tawade JV, Kumam P, Noeiaghdam S, Maharudrappa I, Chithra SM, et al. The heat transfer effects of MHD slip flow with suction and injection and radiation over a shrinking sheet by optimal Homotopy analysis method. Results Eng. 2023;18(1–2):101173. doi:10.1016/j.rineng.2023.101173. [Google Scholar] [CrossRef]
21. Alnasur FS, AL-Turaihi RS. A review study on modifying Vortex generators to improve thermal performance in single- and two-phase flow in circular tubes. Eng Headw. 2024;8(1):3–24. doi:10.4028/p-1mvdhb. [Google Scholar] [CrossRef]
22. Mangtani MP, Watt KM. Effect of twisted-tape inserts on heat transfer in a tube—a review. Int J Mech Eng Robot Res. 2015;4(2):97. [Google Scholar]
23. Alikhan AH, Kazemi M, Soroush H. Enhanced performance of photovoltaic thermal module and solar thermal flat plate collector connected in series through integration with phase change materials: a comparative study. Therm Sci Eng Prog. 2024;47:102305. doi:10.1016/j.tsep.2023.102305. [Google Scholar] [CrossRef]
24. Sivakumar K, Rajan K. Experimental analysis of heat transfer enhancement in a circular tube with different twist ratio of twisted tape inserts. Int J Heat Technol. 2015;33(3):158–62. doi:10.18280/ijht.330324. [Google Scholar] [CrossRef]
25. Zhu XW, Fu YH, Zhao JQ. A novel wavy-tape insert configuration for pipe heat transfer augmentation. Energy Convers Manag. 2016;127:140–8. [Google Scholar]
26. Mashoofi N, Pourahmad S, Pesteei SM. Study the effect of axially perforated twisted tapes on the thermal performance enhancement factor of a double tube heat exchanger. Case Stud Therm Eng. 2017;10(2):161–8. doi:10.1016/j.csite.2017.06.001. [Google Scholar] [CrossRef]
27. Kamel HA, Kadhim ZK, Khalaf KA. CFD study of heat transfer enhancement in double pipe heat exchanger with twisted tape inserts. In: 2018 International Conference on Advance of Sustainable Engineering and its Application (ICASEA); 2018 Mar 14–15; Wasit, Iraq. p. 227–32. doi:10.1109/ICASEA.2018.8370986. [Google Scholar] [CrossRef]
28. Hong Y, Du J, Li Q, Xu T, Li W. Thermal-hydraulic performances in multiple twisted tapes inserted sinusoidal rib tube heat exchangers for exhaust gas heat recovery applications. Energy Convers Manag. 2019;185(9):271–90. doi:10.1016/j.enconman.2019.01.074. [Google Scholar] [CrossRef]
29. Bhattacharyya S, Bashir AI, Dey K, Sarkar R. Effect of novel short-length wavy-tape turbulators on fluid flow and heat transfer: experimental study. Exp Heat Transf. 2020;33(4):335–54. doi:10.1080/08916152.2019.1639847. [Google Scholar] [CrossRef]
30. Saleh ZM, Al-Turaihi RS, Kadhim ZK. Enhancement of heat transfer in double-pipe heat exchangers using wavy edge twisted tape with varying twist ratios and perforated diameters. Heat Trans. 2025;4(9):281. doi:10.1002/htj.23311. [Google Scholar] [CrossRef]
31. Moya-Rico JD, Molina AE, Belmonte JF, Córcoles Tendero JI, Almendros-Ibáñez JA. Experimental characterization of a double tube heat exchanger with inserted twisted tape elements. Appl Therm Eng. 2020;174:115234. doi:10.1016/j.applthermaleng.2020.115234. [Google Scholar] [CrossRef]
32. Singh S, Pandey L, Kharkwal H, Sah H. Augmentation of thermal performance of heat exchanger using elliptical and circular insert with vertical twisted tape. Exp Heat Transf. 2020;33(6):510–25. doi:10.1080/08916152.2019.1662856. [Google Scholar] [CrossRef]
33. Dagdevir T, Ozceyhan V. An experimental study on heat transfer enhancement and flow characteristics of a tube with plain, perforated and dimpled twisted tape inserts. Int J Therm Sci. 2021;159(1):106564. doi:10.1016/j.ijthermalsci.2020.106564. [Google Scholar] [CrossRef]
34. Wang Y, Qi C, Ding Z, Tu J, Zhao R. Numerical simulation of flow and heat transfer characteristics of nanofluids in built-in porous twisted tape tube. Powder Technol. 2021;392:570–86. doi:10.1016/j.powtec.2021.07.066. [Google Scholar] [CrossRef]
35. Al-Kayiem HH, Kassim MS, Taher ST. Applications of compound nanotechnology and twisted inserts for enhanced heat transfer. In: Inverse heat conduction and heat exchangers. IntechOpen; 2020. doi:10.5772/intechopen.80096. [Google Scholar] [CrossRef]
36. Singh SK, Kacker R, Chaurasiya PK, Gautam SS. Correlations on heat transfer rate and friction factor of a rectangular toothed v-cut twisted tape exhibiting the combined effects of primary and secondary vortex flows. Int Commun Heat Mass Transf. 2022;139(3):106503. doi:10.1016/j.icheatmasstransfer.2022.106503. [Google Scholar] [CrossRef]
37. Bucak H, Yilmaz F. Heat transfer augmentation using periodically spherical dimple-protrusion patterned walls of twisted tape. Int J Therm Sci. 2022;171:107211. doi:10.1016/j.ijthermalsci.2021.107211. [Google Scholar] [CrossRef]
38. Nalavade SP, Deshmukh PW, Sane NK. Heat transfer and friction factor characteristics of turbulent flow using thermally non conductive twisted tape inserts. Mater Today Proc. 2022;52(7):373–8. doi:10.1016/j.matpr.2021.09.061. [Google Scholar] [CrossRef]
39. Wright AA, Wilson TS. Flashpoint of marine distillate oil fuels. London, UK: Lloyd’s Register; 2012. [Google Scholar]
40. Thulukkanam K. Heat exchanger design handbook. Boca Raton, FL, USA: CRC Press; 2000. [Google Scholar]
41. Firas A. Augmentation of heat transfer by using nanotechnology [dissertation]. Baghdad, Iraq: University Al-Mustansiriya; 2014. [Google Scholar]
42. Fluent A. Ansys fluent theory guide. Ansys Inc. 2011;15317:724–46. [Google Scholar]
43. White FM, Xue H. Fluid mechanics. Vol. 3. New York, NY, USA: McGraw-Hill; 2003. [Google Scholar]
44. Kotian S, Methekar N, Jain N, Vartak P, Naik P, Bhusnoor SS. Theoretical investigation of thermo-hydraulic characteristics of shell and tube heat exchanger. In: Proceedings of the 26th National and 4th International ISHMT-ASTFE Heat and Mass Transfer Conference; 2021 Dec 17–20; Chennai, India. [Google Scholar]
45. Salman ZA, Kadhim ZK, Abdulhussein K, Ali Kamil H. An experimental study to improve heat transfer rate in a double pipe heat exchanger using helical tape. In: 2021 International Conference on Advance of Sustainable Engineering and its Application (ICASEA); 2021 Oct 27–28; Wasit, Iraq. p. 16–21. doi:10.1109/icasea53739.2021.9733075. [Google Scholar] [CrossRef]
Cite This Article
 Copyright © 2025 The Author(s). Published by Tech Science Press.
This work is licensed under a Creative Commons Attribution 4.0 International License , which permits unrestricted use, distribution, and reproduction in any medium, provided the original work is properly cited.
 Downloads
 Citation Tools