
 Submit a Paper
 Propose a Special lssue
 Open Access
ARTICLE

Operation Performance of Scroll Compressor under Different Pressure Ratio Conditions
1 School of Civil Engineering and Architecture, Xinxiang University, Xinxiang, 453003, China
2 School of Computer and Software Engineering, Sias University, Zhengzhou, 451150, China
* Corresponding Author: Yaping Liu. Email:
Frontiers in Heat and Mass Transfer 2025, 23(6), 2051-2072. https://doi.org/10.32604/fhmt.2025.070138
Received 08 July 2025; Accepted 21 October 2025; Issue published 31 December 2025
 View Full Text
 Download PDF
Abstract
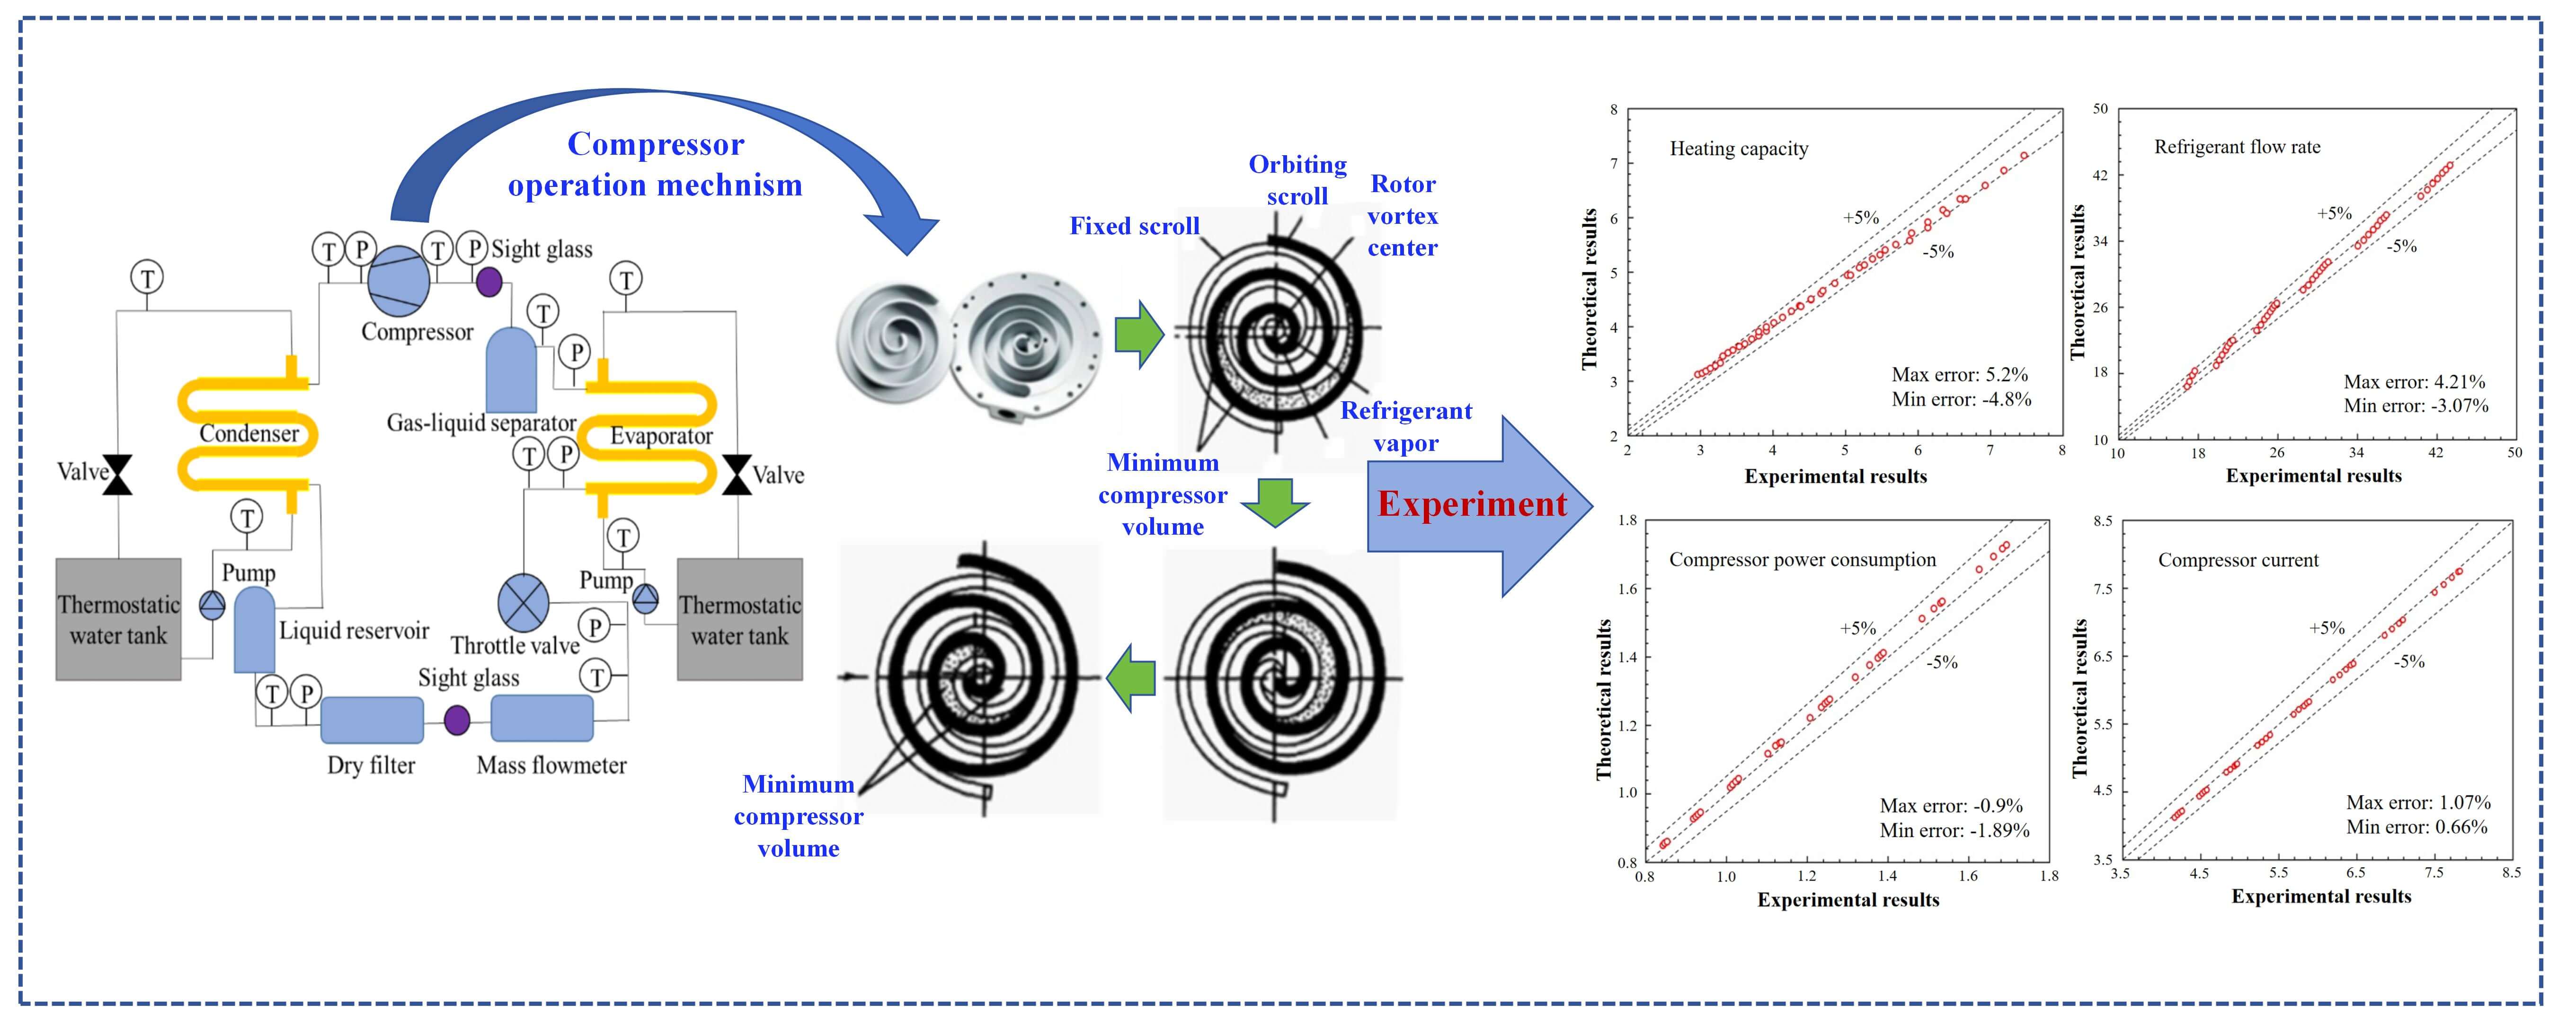
This study experimentally investigates the operational performance of a scroll compressor using R513A to expand its application range as a substitute for R134a. A vapor compression heat pump test platform was established to analyze the variation trends of heating capacity, refrigerant mass flow rate, compressor power consumption, and current by controlling the compressor inlet and outlet pressures (i.e., evaporating and condensing temperatures). The results indicate that both heating capacity and refrigerant mass flow rate decrease with increasing pressure ratio. Compressor power consumption and current initially increase and then decrease with rising evaporating temperature, whereas they exhibit an approximately linear positive correlation with condensing temperature. Based on the experimental data, a polynomial model with pressure ratio as the independent variable was developed. This model predicts heating capacity, mass flow rate, power consumption, and current with high accuracy, showing an average deviation of less than 2%. However, the model’s applicability is significantly influenced by evaporating and condensing temperatures. Therefore, an enhanced 10-coefficient polynomial model, incorporating both evaporating and condensing temperatures as independent variables, was established. This improved model eliminates operational limitations and demonstrates superior prediction performance, with an average deviation of ±1.44% for compressor performance parameters, confirming its practical value for engineering applications.Graphic Abstract
Keywords
The scroll compressor is a positive displacement compressor, which has been widely used in the field of refrigeration and air conditioning due to its high efficiency, energy-saving, low noise, long life, and other advantages. To further improve its efficiency and enhance its operational reliability, many scholars have carried out a lot of research on the improvement of structural parameters and system principle optimization of scroll compressors.
In essence, the scroll profile of the compression cavity is the basis for the development of the scroll compressor. Li et al. [1] theoretically analyzed the relationship between the geometric parameters of a scroll profile and the flow resistance loss of working fluid and interphase heat transfer characteristics in compression cavity, and cleared that the geometric parameters of vortex profile are the main factors affecting the flow resistance loss caused by the motion of orbiting scroll, which used the flow resistance heat transfer theoretical model of scroll compressors. At the same time, to achieve the most accurate solution of the theoretical model of vortex profile, Zhang et al. [2] proposed a mapping method for the circle involute profile of scroll compressors, which can use the circle radius, circle center coordinates, and initial and final angle of involutes to achieve the highest accuracy circle involutes of any given scroll compressor. To explore the law of the influence of scroll profile bias on the size and dynamic characteristics of the scroll disc, Cheng et al. [3] established the geometric, thermodynamic, and dynamic models of scroll compressors respectively to study a scroll compressor with asymmetric algebraic spiral profiles. To explore the influence of spread Angle on tooth head geometry and compression ratio, Ding et al. [4] used the external and internal profile equation of variable base circles to study the scroll profile of variable base circles with internal and external starting angles.
In theoretical research addressing vortex compressors, various studies have focused on exhaust methods and construction materials. Bing [5] analyzed the temperature and pressure trends of the working medium within the compression chamber, proposing a strength calculation model based on bending fatigue strength. Diniz et al. [6] developed a lumped parameter thermal model to predict temperatures across different compressor chambers and components by calculating the thermal resistance and global heat transfer conductivity. To construct the complete meshing profile (CMP), Wang et al. [7] established three geometric models using the equidistant curve method: the modified arc envelope, the modified arc with additional line envelope, and the asymmetric arc-modified envelope. Their theoretical calculations indicated that the arc-corrected envelope yields higher exhaust pressure than the arc additional line-corrected envelope, while symmetric envelopes demonstrate superior compression efficiency compared to asymmetric ones. Based on the conservation laws of mass and energy, Yang et al. [8] developed a highly accurate, fast, and stable general model for vortex compressors using pressure and specific enthalpy as state variables, achieving prediction errors of less than 3.5% for cooling capacity and power consumption. Wang et al. [9] introduced a geometric model for an improved circular involute scroll, connecting the central area, center, and peripheral scroll contours via circular involute lines, and discussed the influence of geometric parameters on the scroll’s shape and performance by deriving the relationship between the contour equations and these parameters.
Furthermore, research on scroll compressor performance has been extended to include several other critical factors. These encompass the compressor’s structural design [10], its operating frequency [11], the refrigerant charge quantity [12], and the operating conditions, such as condensing and evaporating temperatures [13]. In addition, to expand the application range of scroll compressors, Liu et al. [14] focused on studying the performance of air source heat pump water heaters with economizers or flash-tanks, and analyzed the existing problems of jet enthalpy increasing scroll heat pump units. To solve the problem of insufficient heating capacity of the heat pump system and excessive discharge temperature of the compressor under harsh working conditions in winter, Tang et al. [15] redesigned the quasi-two-stage compression heat pump air conditioning system using flash tank vapor injection. Yang et al. [16] proposed a two-phase refrigerant injection refrigeration system for scroll compressor using two-phase refrigerant injection to reduce the high discharge temperature, and optimized the system design and control method by using simulation. Li et al. [17] researched steam jet scroll compressor heat pump air conditioning, focusing on the impact of injection pressure and oil circulation rate on the performance of mass flow rate, exhaust temperature, compressor power consumption, and volume efficiency. Xu and Ma [18], through the theoretical modeling of the refrigeration system of a scroll compressor with two intermediate air replenishment, proved that compared with the intermediate air replenishment system and single-stage system, the two intermediate air replenishment systems can reduce the compressor exhaust temperature by 34°C.
To further enhance the performance of scroll compressor air conditioning heat pump units, several studies have focused on system-level innovations. Zheng et al. [19] investigated a transcritical CO2 heat pump system for electric vehicles, revealing the physical mechanism of an asymmetric leakage flow influenced by coupled aerodynamic and thermodynamic effects. To improve heating performance in cold climates, Wang et al. [20] developed an IDCAHP-assisted jet air source heat pump using a novel two-stage variable-speed scroll compressor. At an ambient temperature of −20°C, their unit achieved a heating capacity of 68.1% of its rated value, with heating coefficient (COP) and energy efficiency ratio (EER) values of 2.0 and 1.8, respectively. Addressing poor compressor performance at low ambient temperatures, Peng et al. [21] established 3D transient simulation models for R134a scroll compressors, both with and without injection. Their results demonstrated that differently shaped injection tubes could increase isentropic efficiency by 8.51%–9.35% and reduce exhaust temperature by 6.0°C–9.08°C. η conditions, Shi et al. [22] designed a pre-discharge valve (PDV). Under identical conditions, the PDV-equipped compressor reduced power consumption by 165.4–897.7 W, while increasing volumetric and isentropic efficiency by approximately 0.13% and 6.63%, respectively. Finally, Wang et al. [23] validated performance enhancement measures for startup and defrosting processes, which were necessitated by issues such as increased oil sump levels resulting from compressor housing subcooling and reduced lubricant viscosity.
R513a is a 1:1 mixture of R1234yf and R134a, which is the most ideal substitute for the current refrigerant R134a due to its characteristics of non-ozone depletion and low global warming potential. For conventional air-conditioning heat pump systems, Yıldız and Yıldırım [24] verified the performance advantages of the R513a system compared with the R134a system through experiments. Compared with R134a, the COP of R513a steam compression system is higher than that of R134a (the difference is about 8%) due to the increase of effective heat transfer in the heat exchanger (about 5.6%) and the reduction of compressor power consumption (about 3%) under the same working conditions [25]. Yang et al. [26] also quantitatively evaluated the performance advantages of R513a in refrigerator applications from the aspects of cooling time, power consumption, and freezing capacity, and found that the cooling time of R513A was about 21% lower than that of R134a, and the system power consumption was about 3.5% lower than that of R134a. Shen and Wang [27] used unit mass cooling capacity (MCC), unit volume cooling capacity (VCC), EER, and exhaust temperature (T) to conduct a comparative study on the performance of R515b, R513a, and R134a in a chiller. In addition, in addition to the performance advantages of R513a, the charge volume of R513a is about 16.7% lower than that of R134a in the best working condition of the same equipment [28]. In a comparative study with R407C, Meramveliotakis et al. [29] reported that R454C exhibited approximately 2% higher volumetric efficiency and an 11%–13% greater mass flow rate under identical conditions. However, due to its lower latent heat, R454C consequently showed a reduction in heating capacity by about 13%–14.8% and a decrease in the energy efficiency ratio by approximately 6%. To evaluate R452B and R454B as potential replacements for R410A, Shen et al. [30] investigated the heat transfer characteristics of these refrigerants in both tube-fin (TFHXs) and microchannel heat exchangers (MCHXs), assessing their overall impact on the performance of a two-speed scroll compressor heat pump unit.
The Compressor, as the core component of driving the flow of the working medium, has a direct impact on the operation performance of the air conditioning heat pump system. Therefore, to enrich the existing research of R513a in the field of air conditioning heat pumps and further expand the replacement range of R513a to R134a, this paper conducted an experimental study on the operation performance of R513a scroll compressors. In addition to the analysis of the variation trend of compressor operating performance under different working conditions, the theoretical model of scroll compressor operating performance is set up to improve the theoretical guidance for the application of scroll compressors in various industrial fields.
2 Mathematical Model and Methods
To study the performance of the scroll compressor under different evaporating and condensing temperature, a vapor-compression system test platform was set up. As shown in Fig. 1, the test platform is mainly composed of the refrigeration circuit, the chilled water circuit, the cooling water circuit, and data acquisition system, etc. Among them, the refrigeration circuit is mainly composed of a condenser, evaporator, liquid reservoir, gas-liquid separator, throttle valve, filter dryer, mass flow meter, and other components. The performance test of a certain type of scroll compressor to be tested is completed in the refrigeration circuit. The inlet and outlet pressure of the compressor to be tested is mainly controlled by adjusting the temperature of the chilled water and cooling water in the evaporator and condenser.
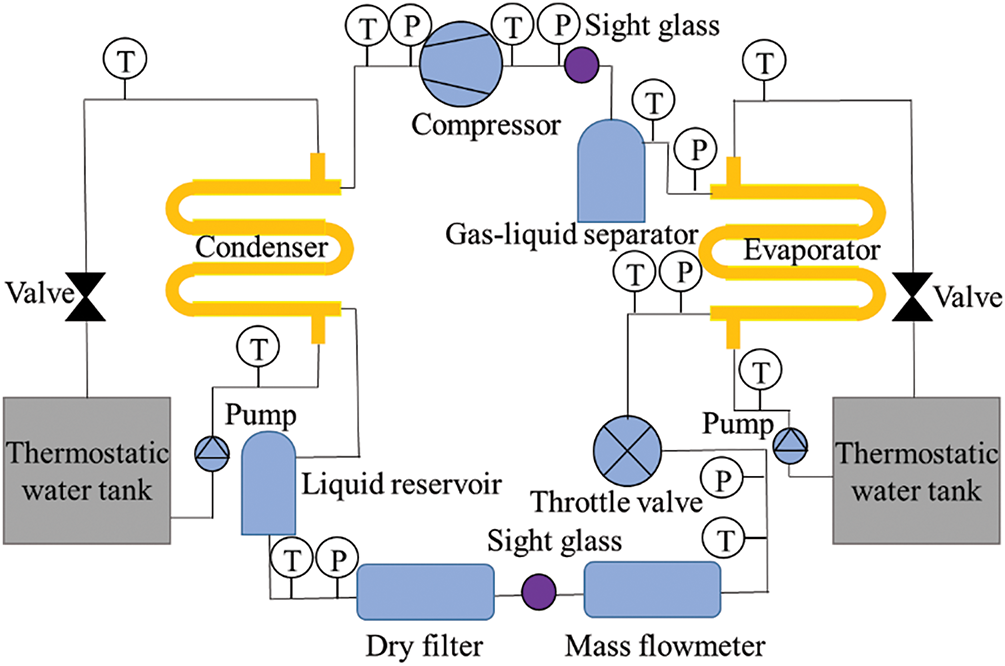
Figure 1: The schematic diagram of the compressor performance test device
The sensors used in the test platform mainly include temperature sensors, pressure sensors, and flowmeters. Among them, the Coriolis mass flowmeter with a measuring accuracy of ±0.1% was used to measure the refrigerant circulation flow, and the Ldg integrated electromagnetic flowmeter with a measuring accuracy of ±0.2% was used to measure the circulation flow of chilled water and cooling water. At the same time, BST9900-GP pressure transmitter with a measuring accuracy of ±0.1% was used to measure the refrigerant pressure at different positions of the test platform, and Pt100 platinum resistor with an accuracy of ±0.3°C and a measuring range of −150°C~200°C was used to measure the temperature of the refrigerant, cooling water and frozen water in the test platform. The data acquisition system can collect the measured data of the above instruments in real-time, to realize the real-time monitoring of the experimental process during the operation of the test platform.
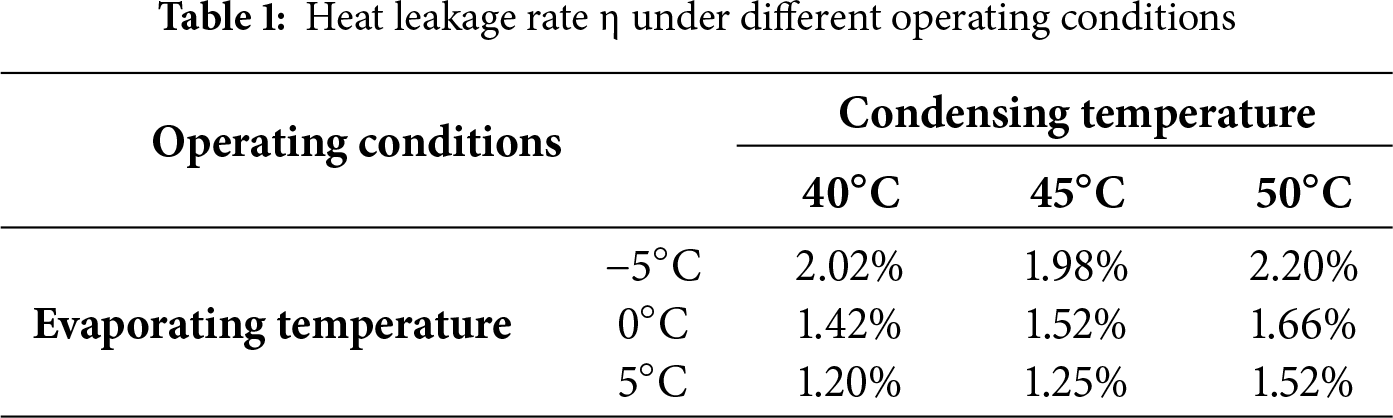
The test experiment is mainly operated at the evaporating temperature of −10°C~15°C and the condensing temperature of 30°C~65°C. In each experimental condition, the suction superheat of the compressor (about 8°C) and the pre-throttle supercooling temperature (about 5°C) are kept constant, and the throttle opening degree is automatically adjusted (self-tuning) with the change of suction and exhaust pressure (saturation temperature) of the compressor to be measured. Considering the experimental heat Leakage, the experimental data were considered valid when the heat leakage rate was within ±3%. The heat leakage rate is defined as the difference between the water-side and refrigerant-side heat transfer rates, divided by their arithmetic mean, the corresponding test results are presented in Table 1.
The energy exchange between the test platform and the external environment mainly includes, the heating treatment of cooling water by the refrigerant in the condenser, the cooling treatment of frozen water by the refrigerant in the evaporator, and the power consumption required for the operation of the compressor. Among them, the heat transfer Qcon between the working medium in the condenser is
where mcon is the circulating flow rate of cooling water in the condenser, kg/s; Cpcon is the specific heat capacity at constant pressure of the cooling water in the condenser at the average temperature, kJ/(kg·K); Tcon,in and Tcon,out are respectively the inlet and outlet temperature of cooling water in the condenser, °C.
The heat transfer Qevp between the working medium in the evaporator is
where mevp is the circulating flow rate of cooling water in the evaporator, kg/s; Cpevp is the specific heat capacity at constant pressure of the cooling water in the evaporator at the average temperature, kJ/(kg·K); Tevp,in and Tevp,out are respectively the inlet and outlet temperature of cooling water in the evaporator, °C.
The power output of the compressor is obtained by multiplying the voltage and current of the compressor, and its expression is
where Ucom and Icom are the input voltage and current during the operation of the compressor to be measured, respectively, A and V.
The test platform heat leakage rate η is defined as
Experimental provisions: When the heat leakage rate η is less than 3%, the experimental data measured in the experiment is considered valid.
The inlet and outlet pressure of the compressor is mainly measured directly by the pressure transmitter, and the pressure value indirectly converted according to the measured saturation temperature is verified and checked.
where Tr is the measurement value of refrigerant temperature in the pipeline, °C; Pr,cal is the refrigerant pressure converted from the measured temperature, kPa; Pr,m indicates the measurement value of the refrigerant pressure in the pipeline, kPa.
Experimental provisions: When the inlet and outlet pressure error φ of the compressor to be tested is less than 3%, the experimental data are considered valid.
In the data analysis, the variation trends of heating capacity, refrigerant mass flow, compressor electric power, and current under different pressure ratio conditions are mainly studied.
3 Scroll Compressor Operation Mechanism
For scroll compressors, the compression chamber is mainly composed of a fixed involute scroll disk (static disk) and an involute scroll disk (moving disk) with eccentric rotational translational motion, as shown in Fig. 2a.
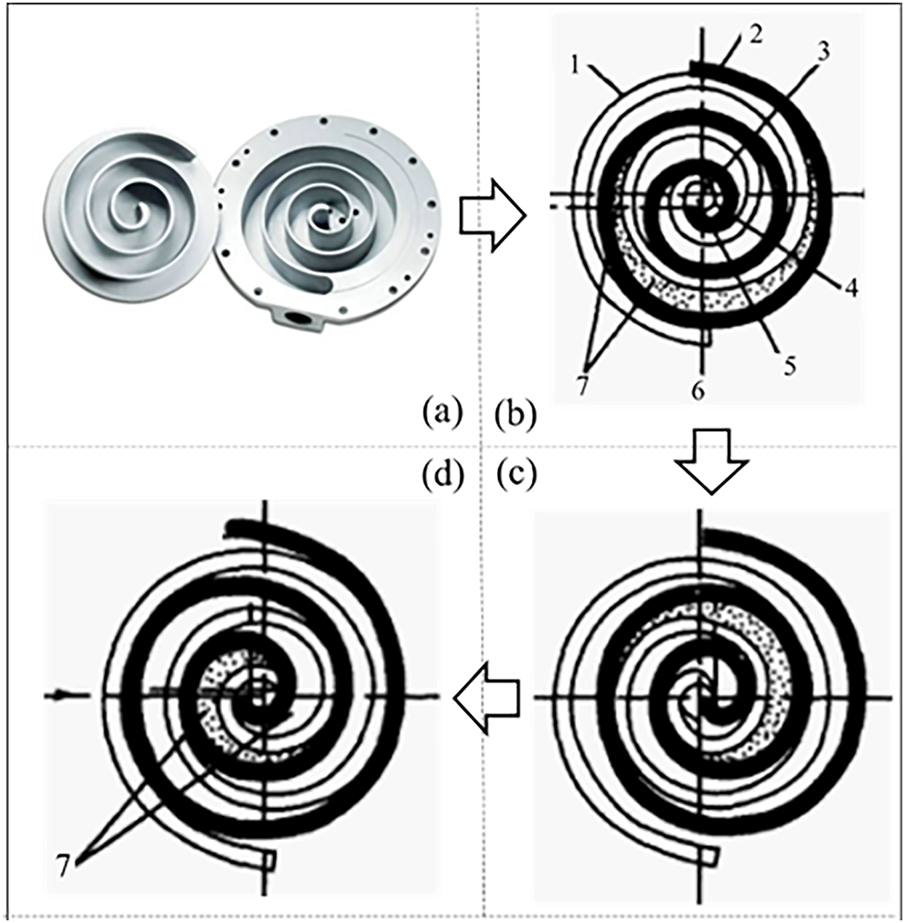
Figure 2: The physical picture of the scroll compressor compression chamber and its operation mechanism. (a) The physical picture of scroll (b) End of inspiration (c) The compression process (d) Exhaust opening. 1 Fixed scroll, 2 Orbiting scroll, 3 Rotor vortex center, 4~6 Refrigerant vapor, 7 Minimum compressor volume
The two vortex disks bite each other to form a crescent-shaped space (primitive volume), as shown in Fig. 2b. When the rotating vortex disk takes the center of the static vortex disk as the rotating center and performs rotation translational motion without rotation at a certain rotating radius, the outer crescent space moves to the center continuously, the inner primitive volume shrinks continuously, and the unenclosed primitive volume expands continuously. At this time, the refrigerant gas enters the outermost crescent-shaped space between the dynamic and static scroll disks through the suction hole opened outside the static scroll disk. With the movement of the dynamic scroll disk, the refrigerant gas is gradually pushed to the central space, and its volume keeps shrinking while its pressure keeps rising, thus achieving effective compression of the refrigerant gas, as shown in Fig. 2c.
During the operation of the compressor, the unit volume between the dynamic and static scroll disks is periodically expanded and reduced. An exhaust hole is opened at the top center of the static scroll disk. When the crescent space is connected with the central exhaust hole, the high-pressure refrigerant gas is discharged from the compressor, as shown in Fig. 2d.
4 Experimental Results and Discussions
The influence of inlet and outlet pressure (equivalent to evaporating temperature and condensing temperature) on compressor performance was quantitatively analyzed by using a single variable method, based on the variation trend of heating capacity, refrigerant mass flow rate, compressor power consumption, and current with the inlet and outlet pressure ratio of compressor.
4.1 Effects of the Evaporating Temperature
When the condensing temperature is the same, the high-low pressure ratio of the device shows a decreasing trend as the evaporating temperature increases. When the condensing temperature is 40°C, 45°C and 50°C, the changes in heating capacity and refrigerant mass flow of the test device with evaporating temperature are shown in Fig. 3, and it can be found that:
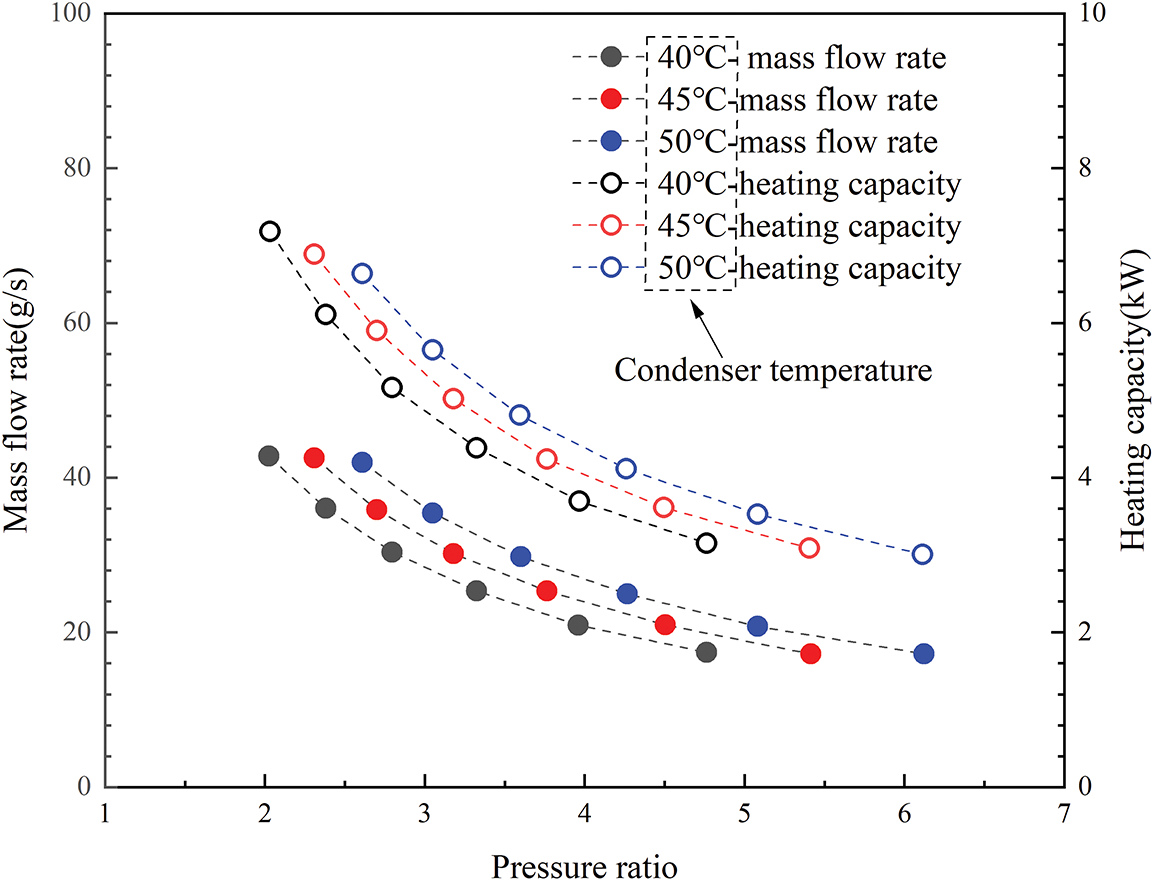
Figure 3: The variation tendency of heating capacity and refrigerant mass flow rate with pressure ratio at different evaporating temperatures
(1) Since the device heating capacity is the product of the refrigerant mass flow rate and the enthalpy difference between the refrigerant inlet and outlet in the condenser, the device heating capacity and refrigerant mass flow rate have similar trends with experimental variables under the same working condition;
(2) The heating capacity of the device and the mass flow rate of the refrigerant decrease with the increase of the high-low pressure ratio of the device (the decrease of evaporating temperature). Based on the analysis of refrigerant physical properties, the density of R513a in the gas phase decreases with the decrease of evaporating temperature. When the compressor operating frequency and the volume of the conveying chamber are constant, the R513a volume flow remains constant. However, the decrease of gas phase R513a density will lead to a decrease in its mass flow rate. From the perspective of the structural design of a scroll compressor, the volumetric efficiency of the compressor decreases with the increase of inlet and outlet pressure ratio [31], that is, the effective transport volume of the compressor decreases with the decrease of evaporating temperature, and the volume flow rate of R513a decreases. At the same time, the reduction of a mass flow rate of R513a is a direct factor leading to the reduction of the heating capacity of the device.
(3) Under the high-low pressure ratio of the same device, both the heating capacity of the device and the mass flow rate of the refrigerant increase with the increase of the condensing temperature, and the average increase of the two is about 2.98% and 2.03% for every 5°C increase of the condensing temperature. To keep the compressor inlet and outlet pressure ratio constant, the evaporating temperature increases with the condensing temperature. When the effective transport volume of the compressor is kept constant, the R513a mass flow rate is closely related to the increase of gas phase density caused by the increase in evaporating temperature. Therefore, the change of the two with the condensing temperature is essentially caused by the increase in the evaporating temperature.
Fig. 4 shows the variation trend of compressor power consumption and its current at 40°C, 45°C, and 50°C evaporating temperature. It can be found that:
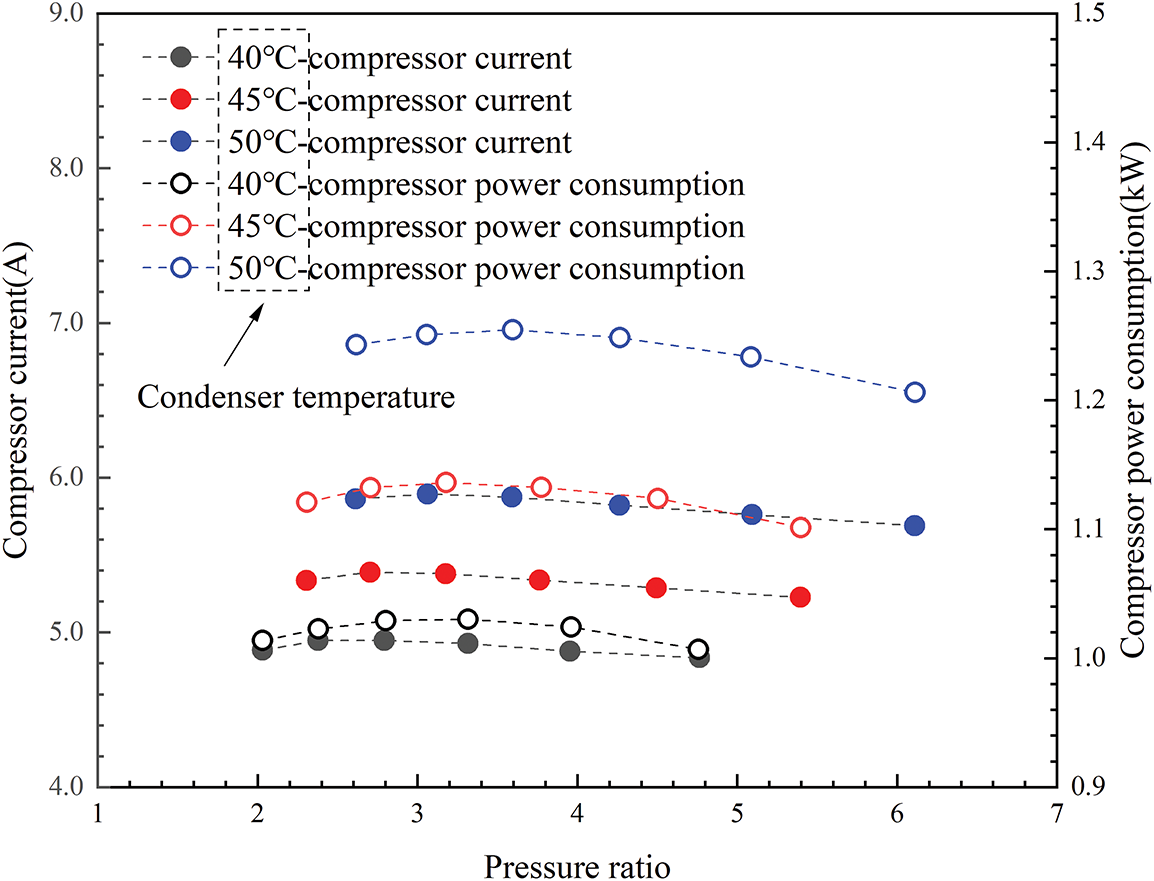
Figure 4: The variation tendency of compressor power consumption and current with pressure ratio at different evaporating temperatures
(1) According to Formula (3), the compressor power consumption is the product of its current and industrial voltage. When the industrial voltage remains constant, the compressor power consumption and its current change trend with the experimental variables are similar.
(2) The compressor power consumption and its current both firstly increase and then decrease with the increase of the device’s high-low pressure ratio (the decrease of evaporating temperature). This is because, the isentropic efficiency of the compressor decreases with the increase of the high and low pressure ratio of the device [32]. When the isentropic power of the compressor changes relatively small, the compressor power consumption increases with the decrease of its isentropic efficiency (the increase of the pressure ratio or the decrease of the evaporating temperature). When the high-low pressure ratio of the device exceeds a certain value, the decrease of the refrigerant mass flow rate will directly cause the decrease of the isentropic power of the compressor, which shows that the compressor power consumption decreases with the increase of the device pressure ratio.
(3) Under the high-low pressure ratio of the same device, the compressor power consumption and its current increase with the increase of condensing temperature, and the average increase of both is about 9.2% ± 0.3% for every 5°C increase in condensing temperature. To keep the high-low pressure ratio of the device constant, the evaporating temperature increases with the increase of the condensing temperature. In this case, the change of refrigerant mass flow rate with condensing temperature directly leads to a positive correlation between compressor power consumption and condensing temperature.
4.2 Effects of the Condensing Temperature
In essence, the evaporating temperature and condensing temperature mainly affect the performance of the device and its components through the high-low pressure ratio of the device. When the evaporating temperature is kept constant, the high-low pressure ratio of the device increases with the increase of the condensing temperature. At the evaporating temperatures of −5°C, 0°C and 5°C, the variation of heating capacity and refrigerant mass flow of the device with the condensing temperature is shown in Fig. 5, and it can be found that:
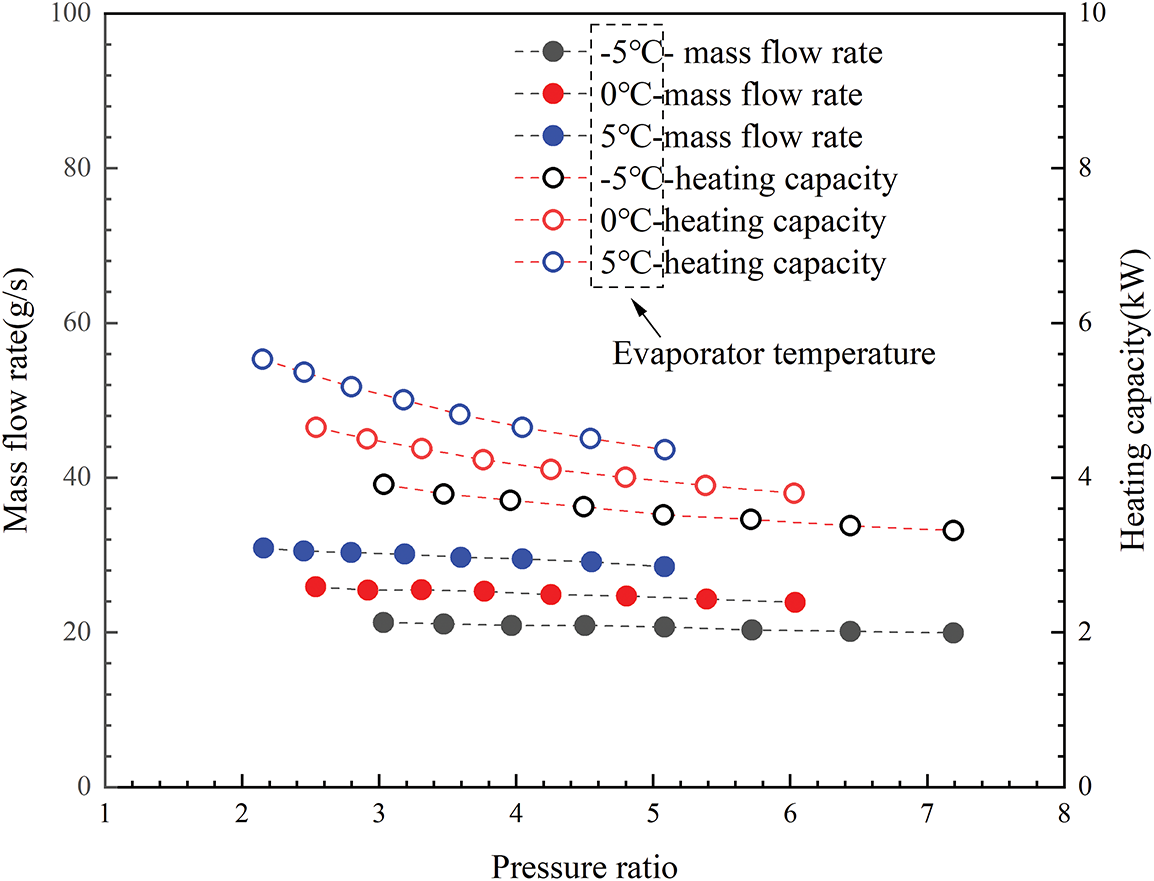
Figure 5: Under variable condensing temperature conditions, variation tendency of heating capacity and refrigerant flow rate with pressure ratio
(1) The variation trend of heating capacity and refrigerant mass flow of the device is similar to the condensing temperature, and both of them decrease with the increase of the condensing temperature. However, the effect of condensing temperature on heating capacity is greater than that of refrigerant mass flow rate. This is because, the constant evaporating temperature represents the constant physical property of the refrigerant at the compressor suction port, and further, the decrease in the compressor volume efficiency caused by the increase in the device’s high-low pressure ratio [15] becomes the dominant factor that leads to the negative correlation between the refrigerant mass flow rate and the condensing temperature. Since the latent heat value of unit mass R513a decreases with the increase of saturation temperature, in addition to the refrigerant mass flow rate, the decrease of latent heat value of R513a under corresponding working conditions also enhances the variation intensity of the device heating capacity with the condensing temperature.
(2) Under the high-low pressure ratio of the same device, the heat produced by the device and the mass flow rate of the refrigerant increase with the increase of the condensing temperature, and the average increase of both is about 14.7% and 16.2% for every 5°C increase of the condensing temperature. When the high-low pressure ratio of the device is kept constant, the condensing temperature increases with the evaporating temperature. Therefore, the refrigerant mass flow rate is positively correlated with the condensing temperature, which is mainly caused by the increase of gas phase R513a density caused by the increase in evaporating temperature. Although the increase of refrigerant mass flow rate will simultaneously cause the increase of device heating capacity, the decrease of unit mass R513a latent heat value leads to the increase of device heating capacity less than the refrigerant mass flow rate.
Fig. 6 shows the changing trend of compressor power consumption and current with the evaporating temperature at −5°C, 0°C, and 5°C. It can be found that:
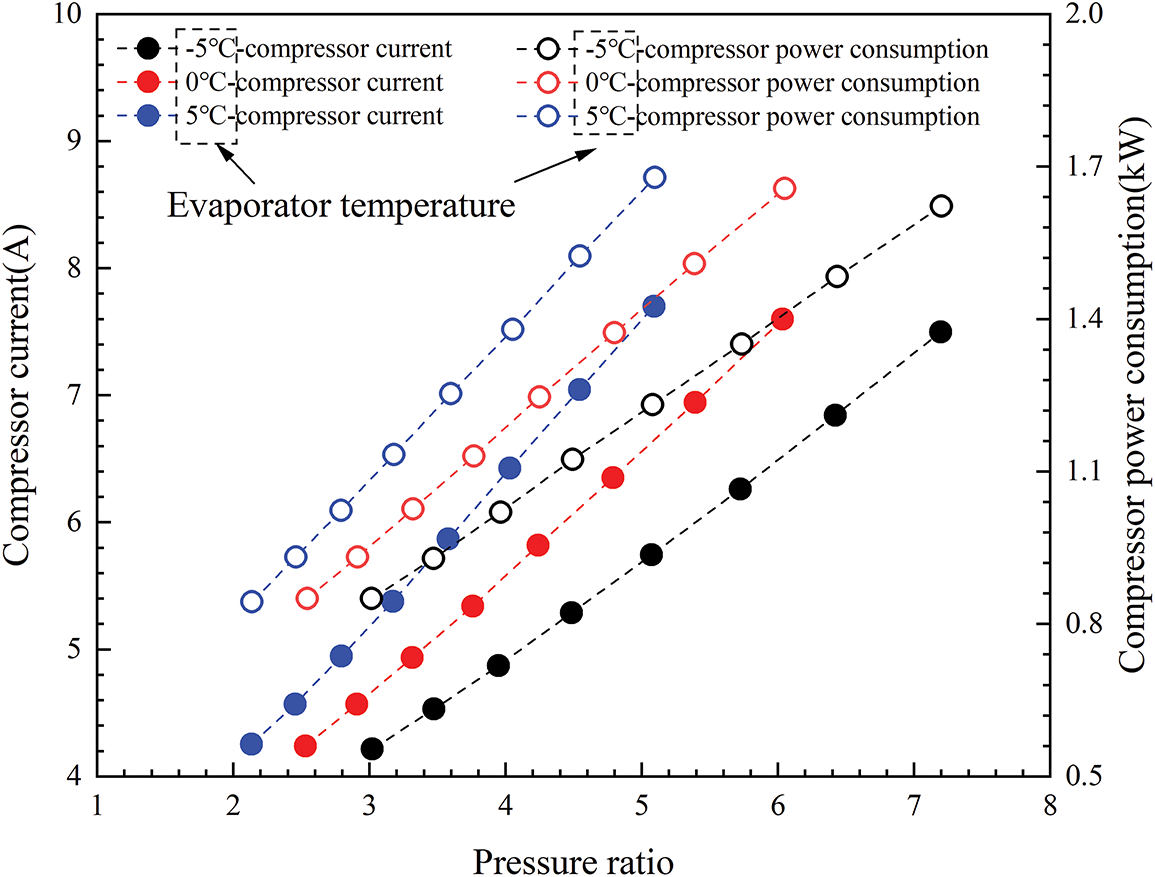
Figure 6: Under variable evaporating temperature conditions, variation tendency of compressor power consumption and current with pressure ratio
(1) At the same evaporating temperature, the compressor power consumption and current increase with the increase of the device’s high-low pressure ratio (the increase of condensing temperature). In numerical calculation, the compressor power consumption is equal to the product of the refrigerant mass flow rate and the enthalpy difference between the inlet and outlet of the compressor. However, when the evaporating temperature is kept constant, the mass flow rate of refrigerant does not change much with the high-low pressure ratio of the device. Therefore, the increase in the enthalpy value of the refrigerant at the compressor outlet caused by the increase in condensing temperature is the leading factor leading to the increase in compressor power consumption.
(2) Under the high and-low pressure ratio of the same device, the compressor power consumption and current are linearly increased with the condensing temperature, and the average increase of both is about 0.82 ± 0.07% when the condensing temperature is increased by 5°C. At this time, in addition to the increase of refrigerant mass flow caused by the increase in evaporating temperature, the increase of the enthalpy difference between the inlet and outlet of the compressor caused by the increase of condensation temperature is also a key factor that the compressor power consumption is positively correlated with the condensing temperature.
The suitability of R513A as a substitute for R134A in refrigeration and air conditioning was further evaluated through a comparative study, with compressor exhaust temperature and COP serving as the key metrics. Empirical data presented in Fig. 7 demonstrates a positive correlation between the compressor exhaust temperature and the system pressure ratio. Quantitative analysis reveals that, at a constant pressure ratio, a 5°C increase in condensing temperature elevates the exhaust temperature by approximately 8.3% to 10.8%. In contrast, a corresponding increase in evaporating temperature raises it by approximately 2.5% to 7.3%. Additionally, the impact of both condensing and evaporating temperatures on exhaust temperature is amplified at higher pressure ratios.
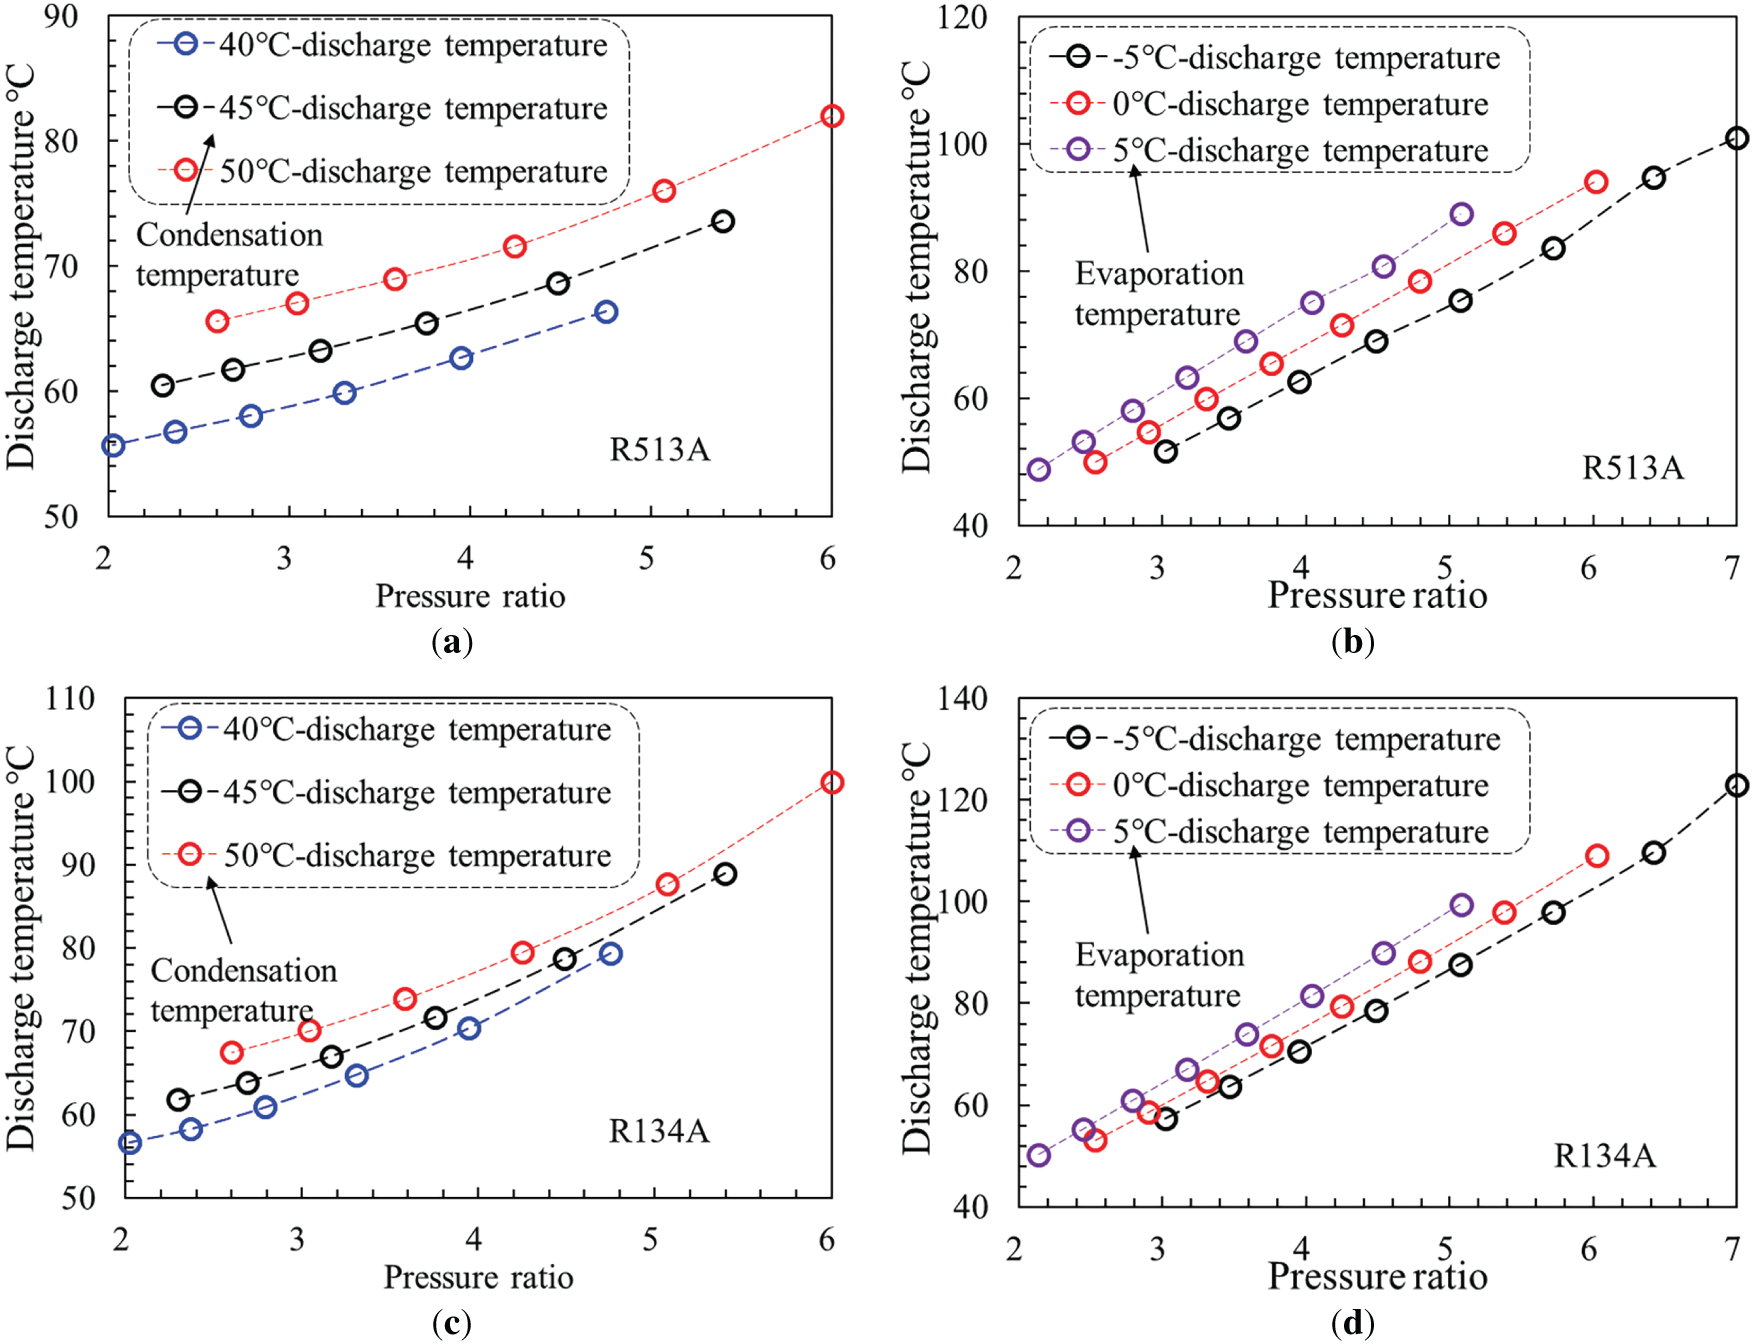
Figure 7: Variation trend of unit exhaust temperature under different pressure ratio conditions: (a) Condensing temperature (R513A); (b) Evaporating temperature (R513A); (c) Condensing temperature (R134A); (d) Evaporating temperature (R134A)
Furthermore, the R134A unit exhibits a significantly higher exhaust temperature than the R513A unit. Across the test range, the temperature difference between the two ranges from approximately 1.5°C to 21.9°C, representing a relative difference of up to 21.3% under high-pressure ratio conditions. A lower exhaust temperature under identical operating conditions signifies enhanced operational reliability, improved lubrication for the compressor’s moving parts, a broader operational range, and greater potential for energy efficiency improvements. Consequently, the lower exhaust temperature of the R513A unit directly confirms its superior potential for industrial application.
As shown in Fig. 8, the COP of the unit decreases as the pressure ratio increases. The influence of condensing temperature on COP is relatively minor; however, under high-pressure-ratio conditions, the COP increases as the evaporation temperature decreases. This behavior can be attributed to the simultaneous decrease in both the isentropic efficiency and volumetric efficiency of the compressor at higher pressure ratios. A reduction in isentropic efficiency leads to increased power consumption, while a drop in volumetric efficiency reduces the refrigerant mass flow rate, thereby diminishing heat transfer in the evaporator and condenser. Since COP is numerically defined as the ratio of heat transfer in the heat exchanger to the compressor’s power input, the combined effect of these factors results in an inverse relationship between COP and the compressor pressure ratio.
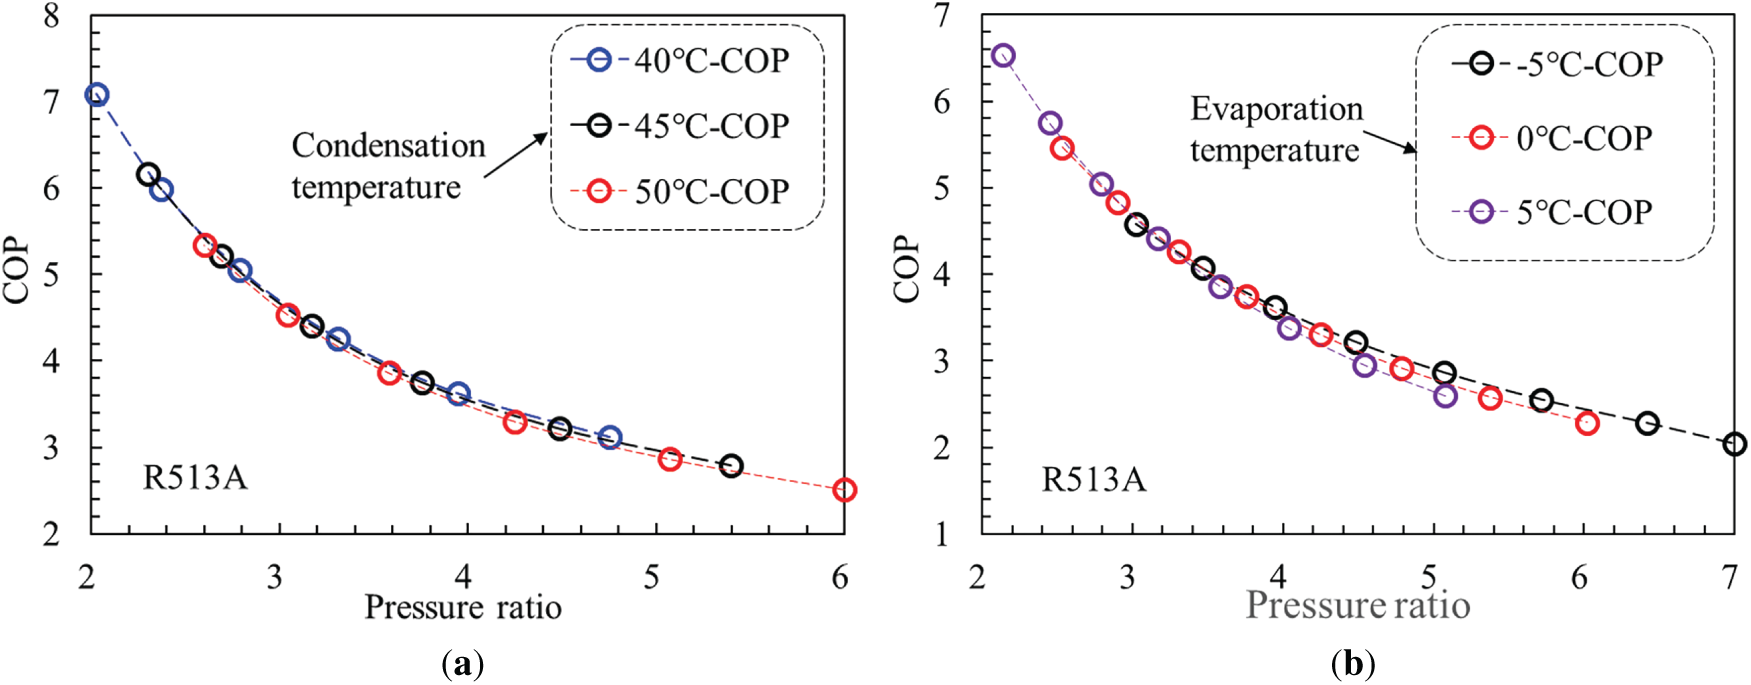
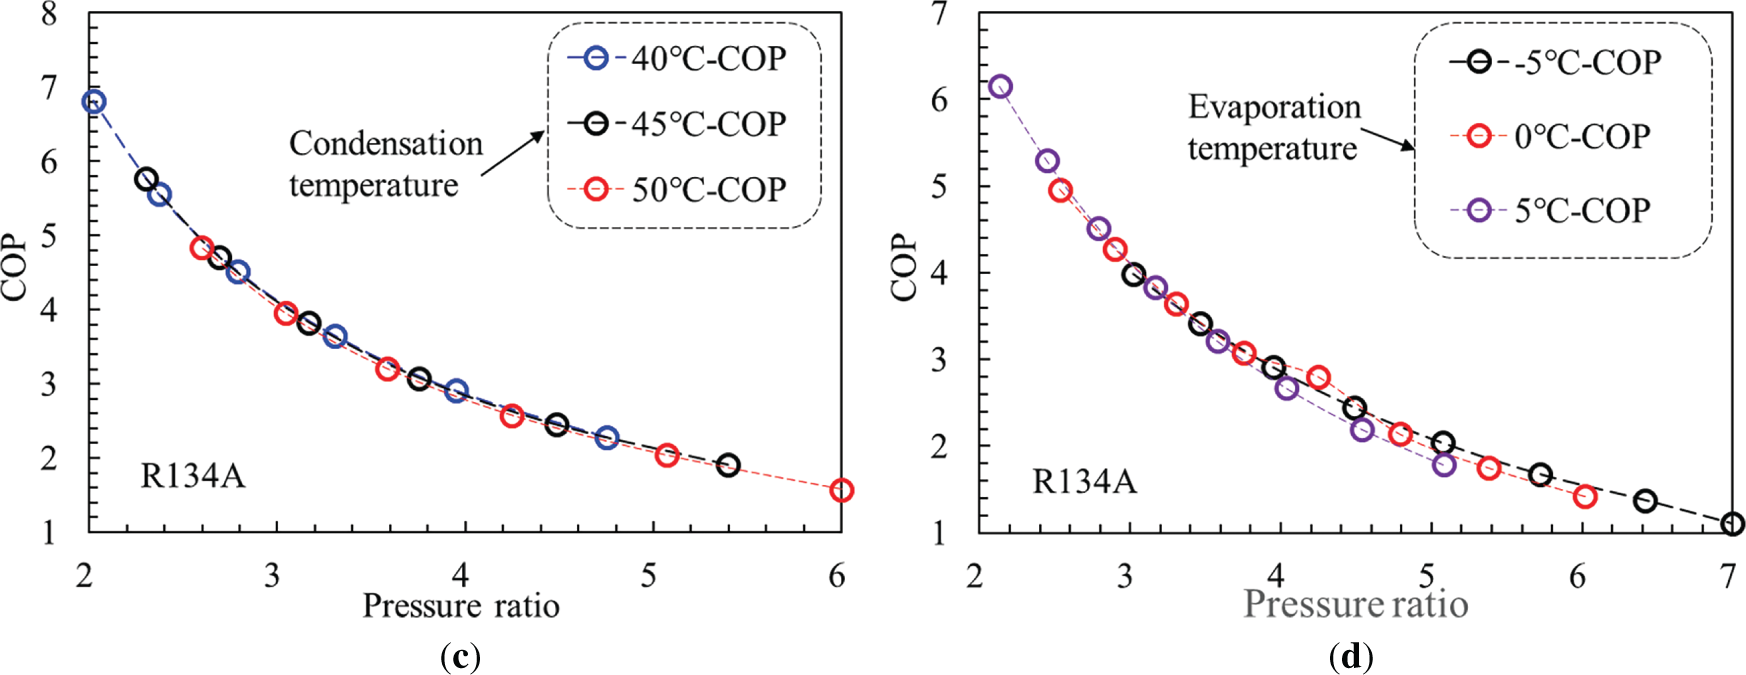
Figure 8: Variation trend of unit COP under different pressure ratio conditions: (a) Condensing temperature (R513A); (b) Evaporating temperature (R513A); (c) Condensing temperature (R134A); (d) Evaporating temperature (R134A)
Under identical operating conditions, the COP of the R513A unit is approximately 0.27 to 0.93 higher than that of the R134A unit, and this difference widens with increasing pressure ratio. The maximum difference occurs at an evaporation temperature of −10°C and a condensing temperature of 50°C, where the COP of the R513A unit is about 58.9% higher. COP represents the maximum cooling capacity achieved per unit of power consumed—a higher COP indicates lower energy consumption for the same cooling demand. Therefore, the superior COP performance of R513A underscores its greater application potential in the refrigeration and air conditioning industry.
In essence, the theoretical model-building process is a systematic and accurate analysis process of experimental data, involving parameters definition, model generation, model verification, and other steps. Based on the theoretical analysis of the variation trend of the device performance parameters (such as heating capacity, compressor power consumption, etc.) with each regulating variable, it can be concluded that the device performance parameters are mainly affected by the evaporating temperature and condensing temperature, while the temperature and pressure of the saturated refrigerant can be converted to each other through a monotone function. Therefore, the device performance parameters can be expressed as a function of the device’s high-low pressure ratio. In addition, the acquisition of heating capacity and compressor power consumption is directly related to the refrigerant mass flow rate and compressor current. It can be concluded that there is a correlation between the theoretical models of the relevant parameters.
Under the conditions of specific evaporating temperature and condensing temperature, the heating capacity, refrigerant mass flow rate, compressor power consumption, and current can be expressed as multiple aspects of the device’s high-low pressure ratio (Pc/Pe), that is, the 4-coefficient polynomial model.
In the formula, a0, a1, a2, and a3 are the functional relation coefficients, respectively, which are mainly determined by the experimental data measured under specific working conditions, and the specific values are shown in Table 2. At the same time, the accuracy of polynomial models such as heating capacity, refrigerant mass flow rate, compressor power consumption, and current can be checked by comparing the experimental data in experimental conditions with the calculated values of the model, as shown in Figs. 9–12. It can be seen from the figure:
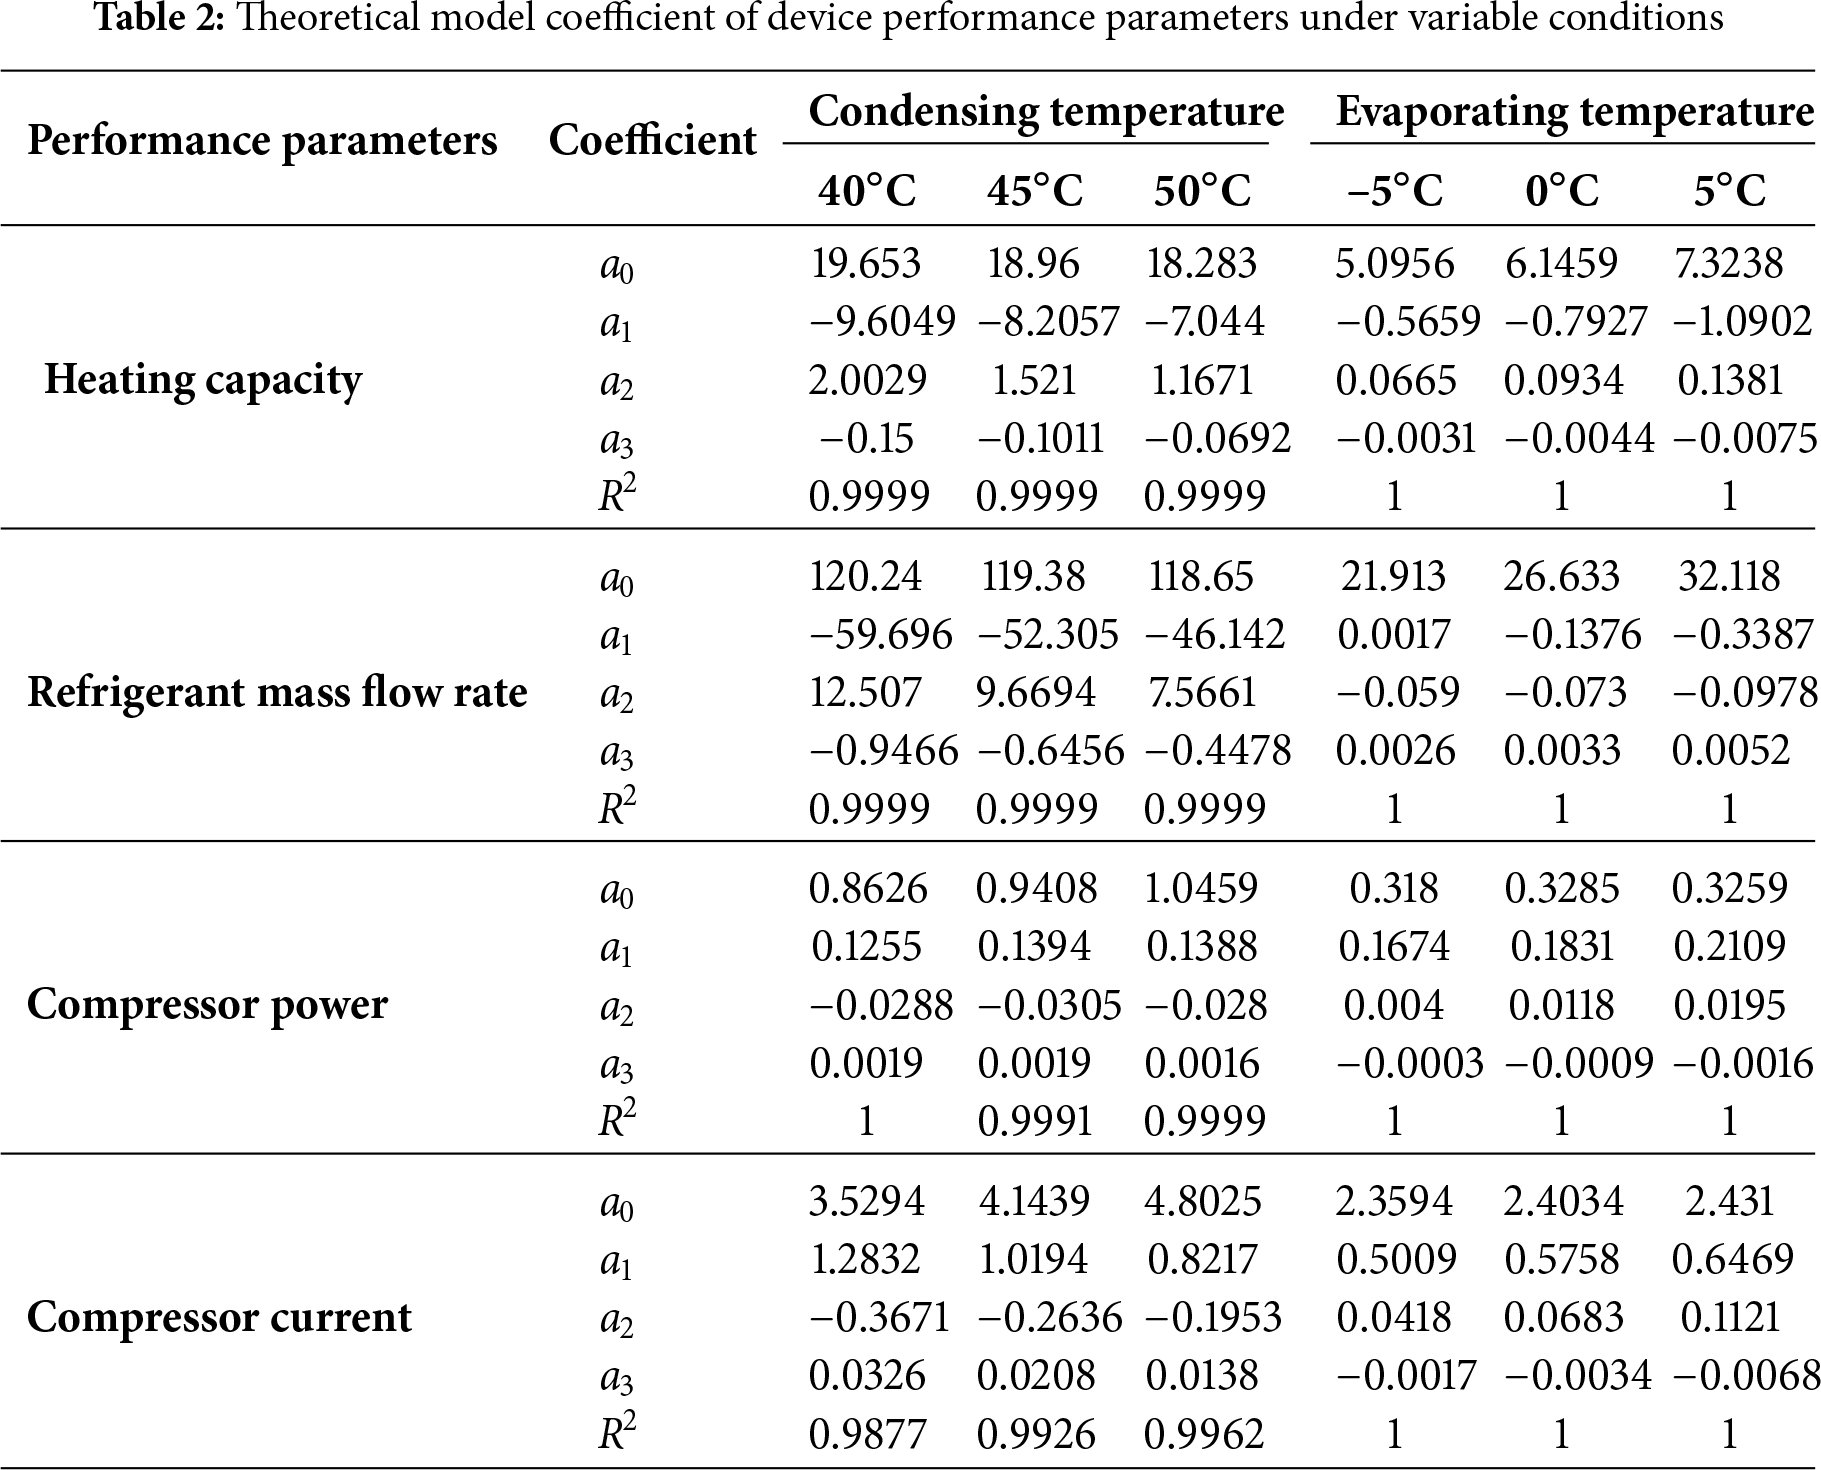
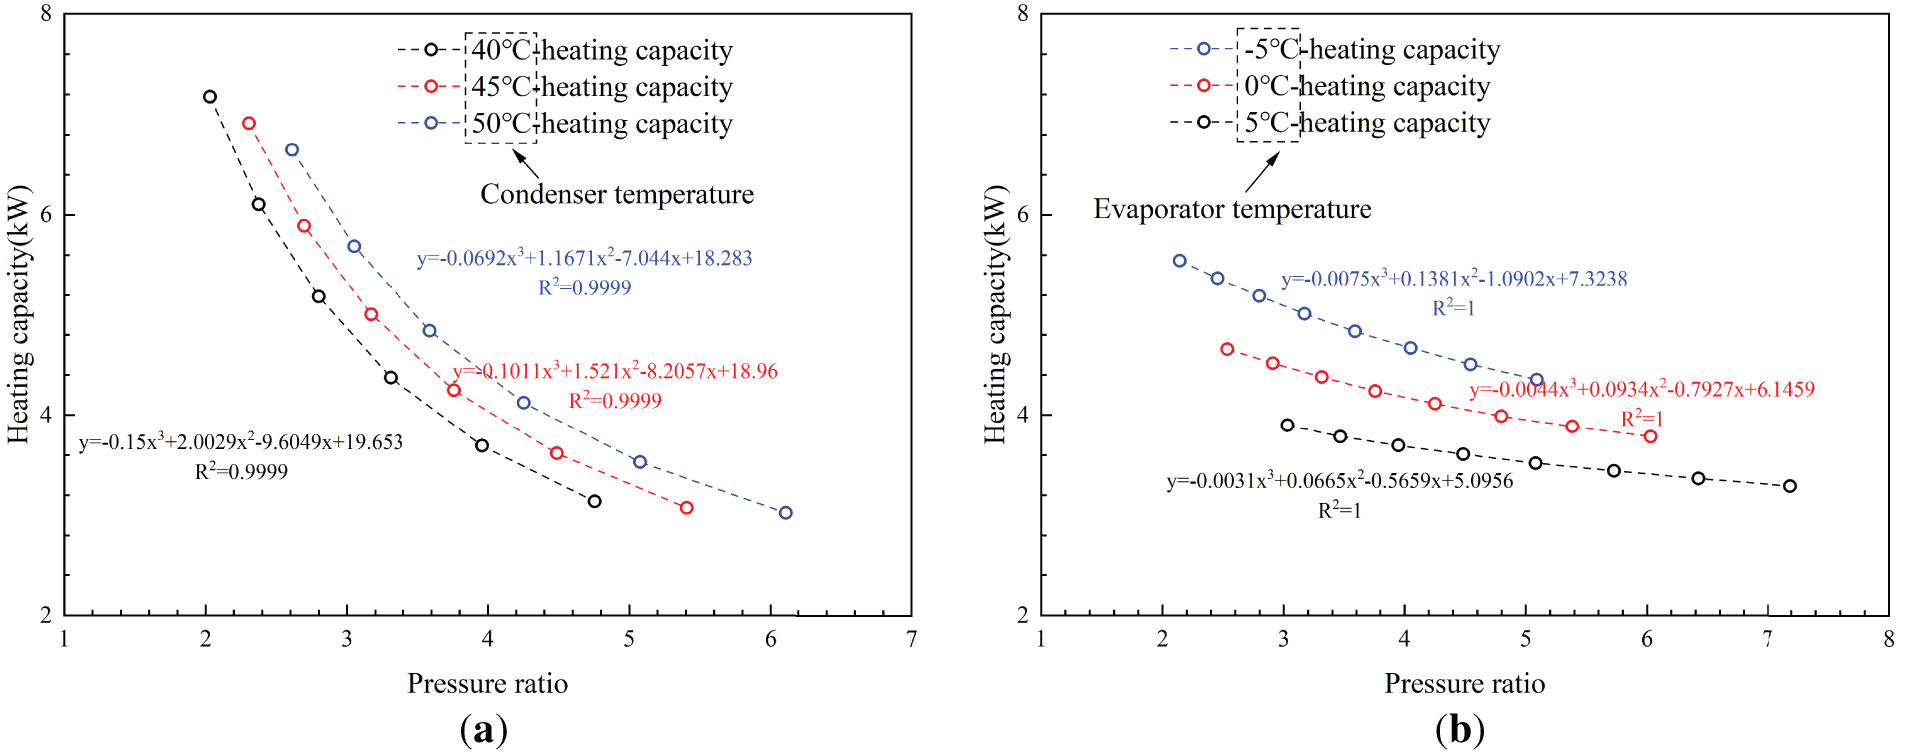
Figure 9: Under variable conditions, theoretical derivation of heating capacity with pressure ratio: (a) Evaporating temperature; (b) Condensing temperature
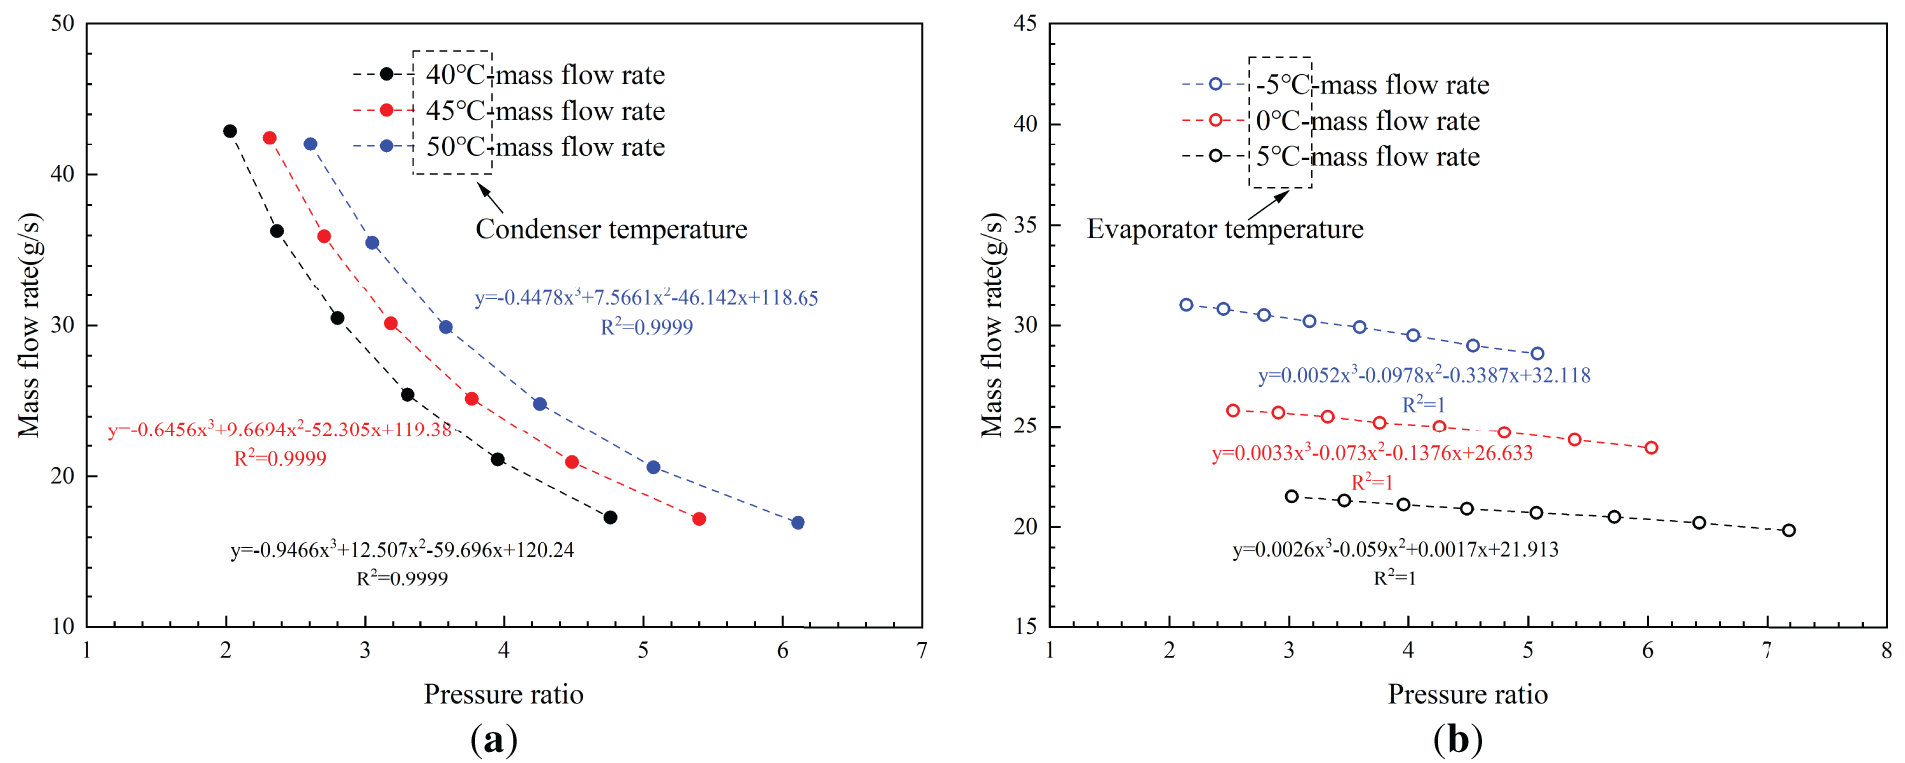
Figure 10: Under variable conditions, theoretical derivation of refrigerant mass flow rate with pressure ratio: (a) Evaporating temperature; (b) Condensing temperature
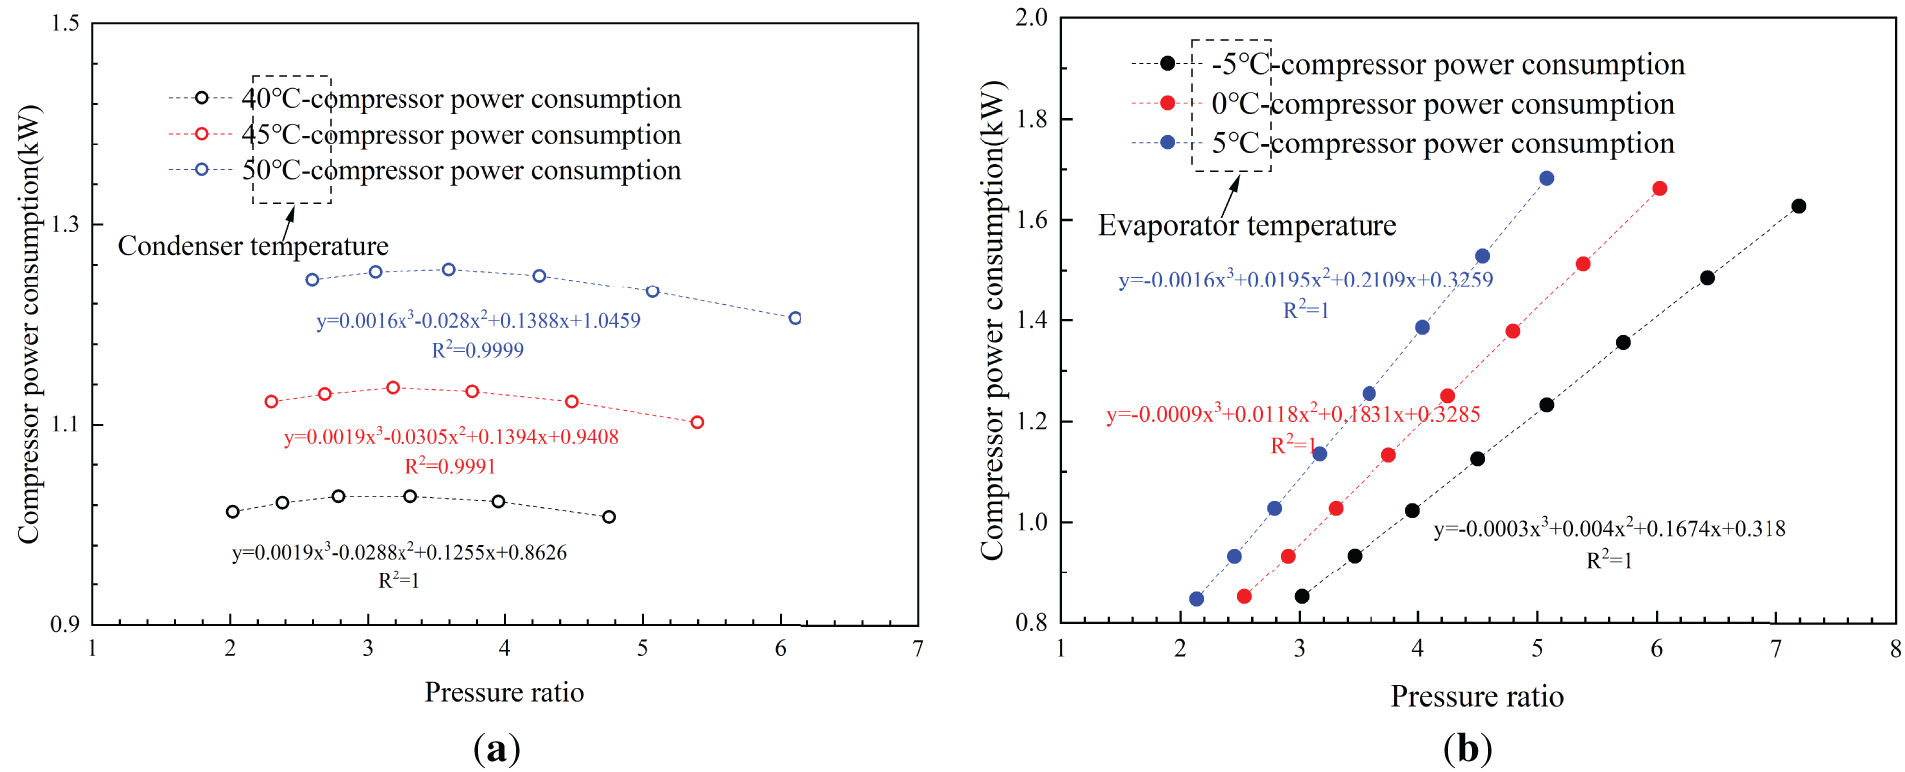
Figure 11: Under variable conditions, theoretical derivation of compressor power with pressure ratio: (a) Evaporating temperature; (b) Condensing temperature
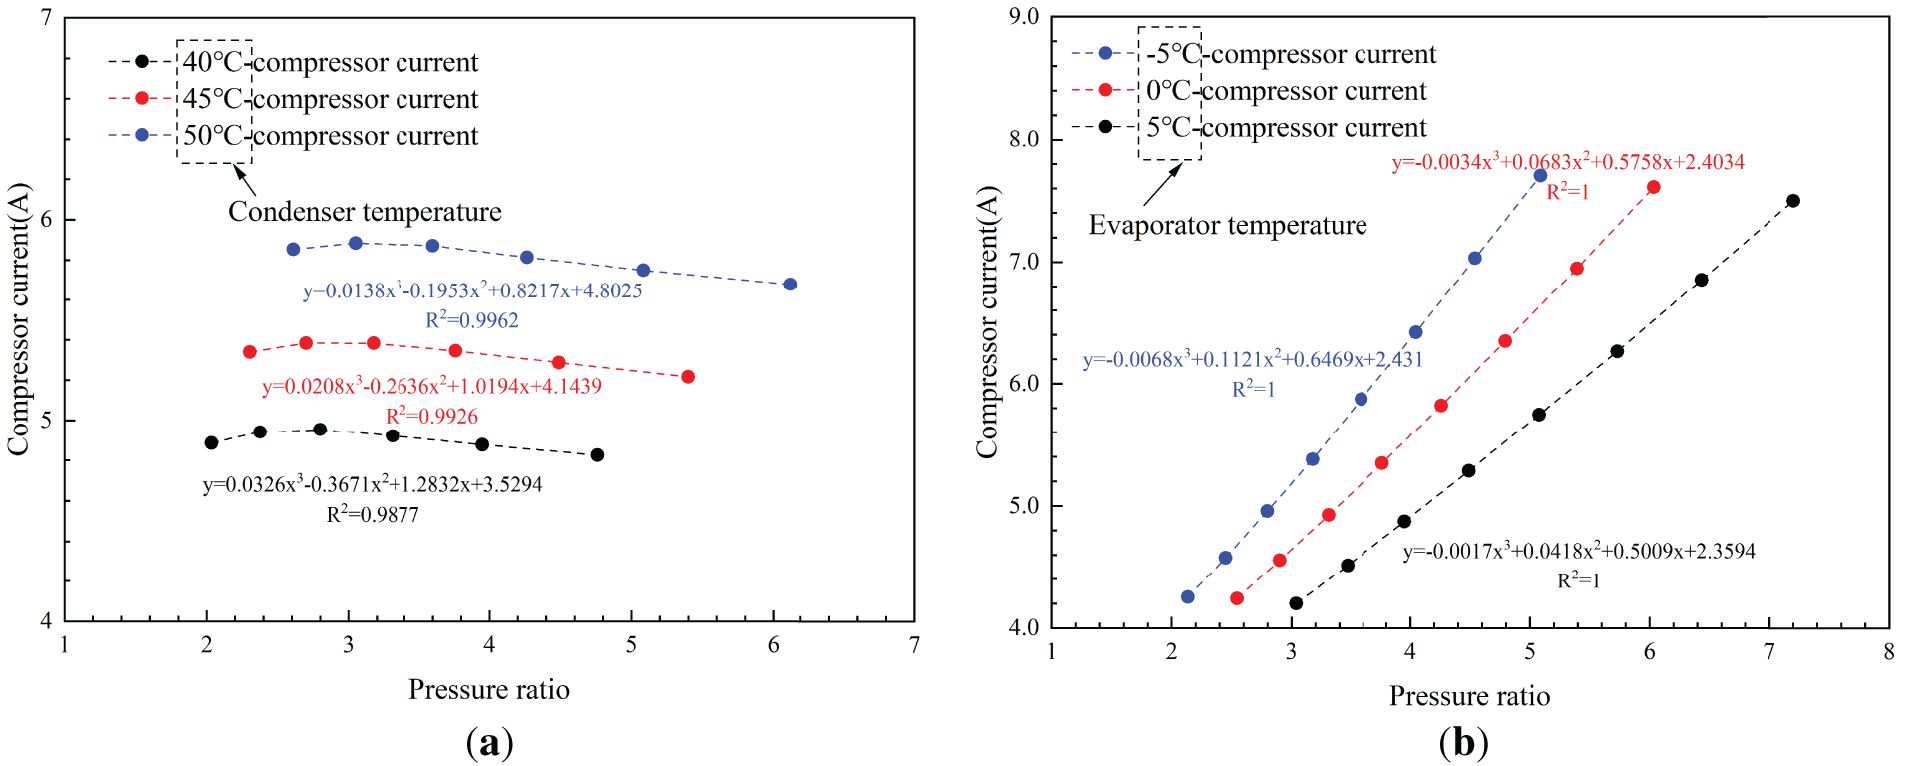
Figure 12: Under variable conditions, theoretical derivation of compressor current with pressure ratio: (a) Evaporating temperature; (b) Condensing temperature
(1) The polynomial model can accurately characterize the relationship between heating capacity, refrigerant mass flow rate, compressor power consumption, and current with the device’s high-low pressure ratio, and the error between the model and the experimental value is less than 2%;
(2) There are large differences in the coefficients of different polynomial models, which proves that the application range of a single model is greatly affected by variables such as evaporating temperature and condensing temperature;
(3) The fitting degree of the polynomial model can be maintained as 1 at different condensing temperatures, but it fluctuates in the range of 0.9877~1 at different evaporating temperatures. It can be confirmed that the evaporating temperature has a greater influence on the calculation accuracy of the polynomial model than the condensing temperature.
(4) The closer the variation trend line of device performance parameters with the variation trend line of device high-low pressure ratio is to the conventional function trend line, the better the polynomial model fitting degree is to 1.
In addition, to solve the shortcomings of the above polynomial model and further expand the application scope of the polynomial model, this paper redefines the theoretical model of device performance parameters in polynomial form, taking evaporating temperature and condensing temperature as independent variables, that is
where b0, b1, b2, b3, ..., b9 is a functional correlation coefficient, which is also determined by the experimental data measured under specific working conditions, and the specific values are shown in Table 3.
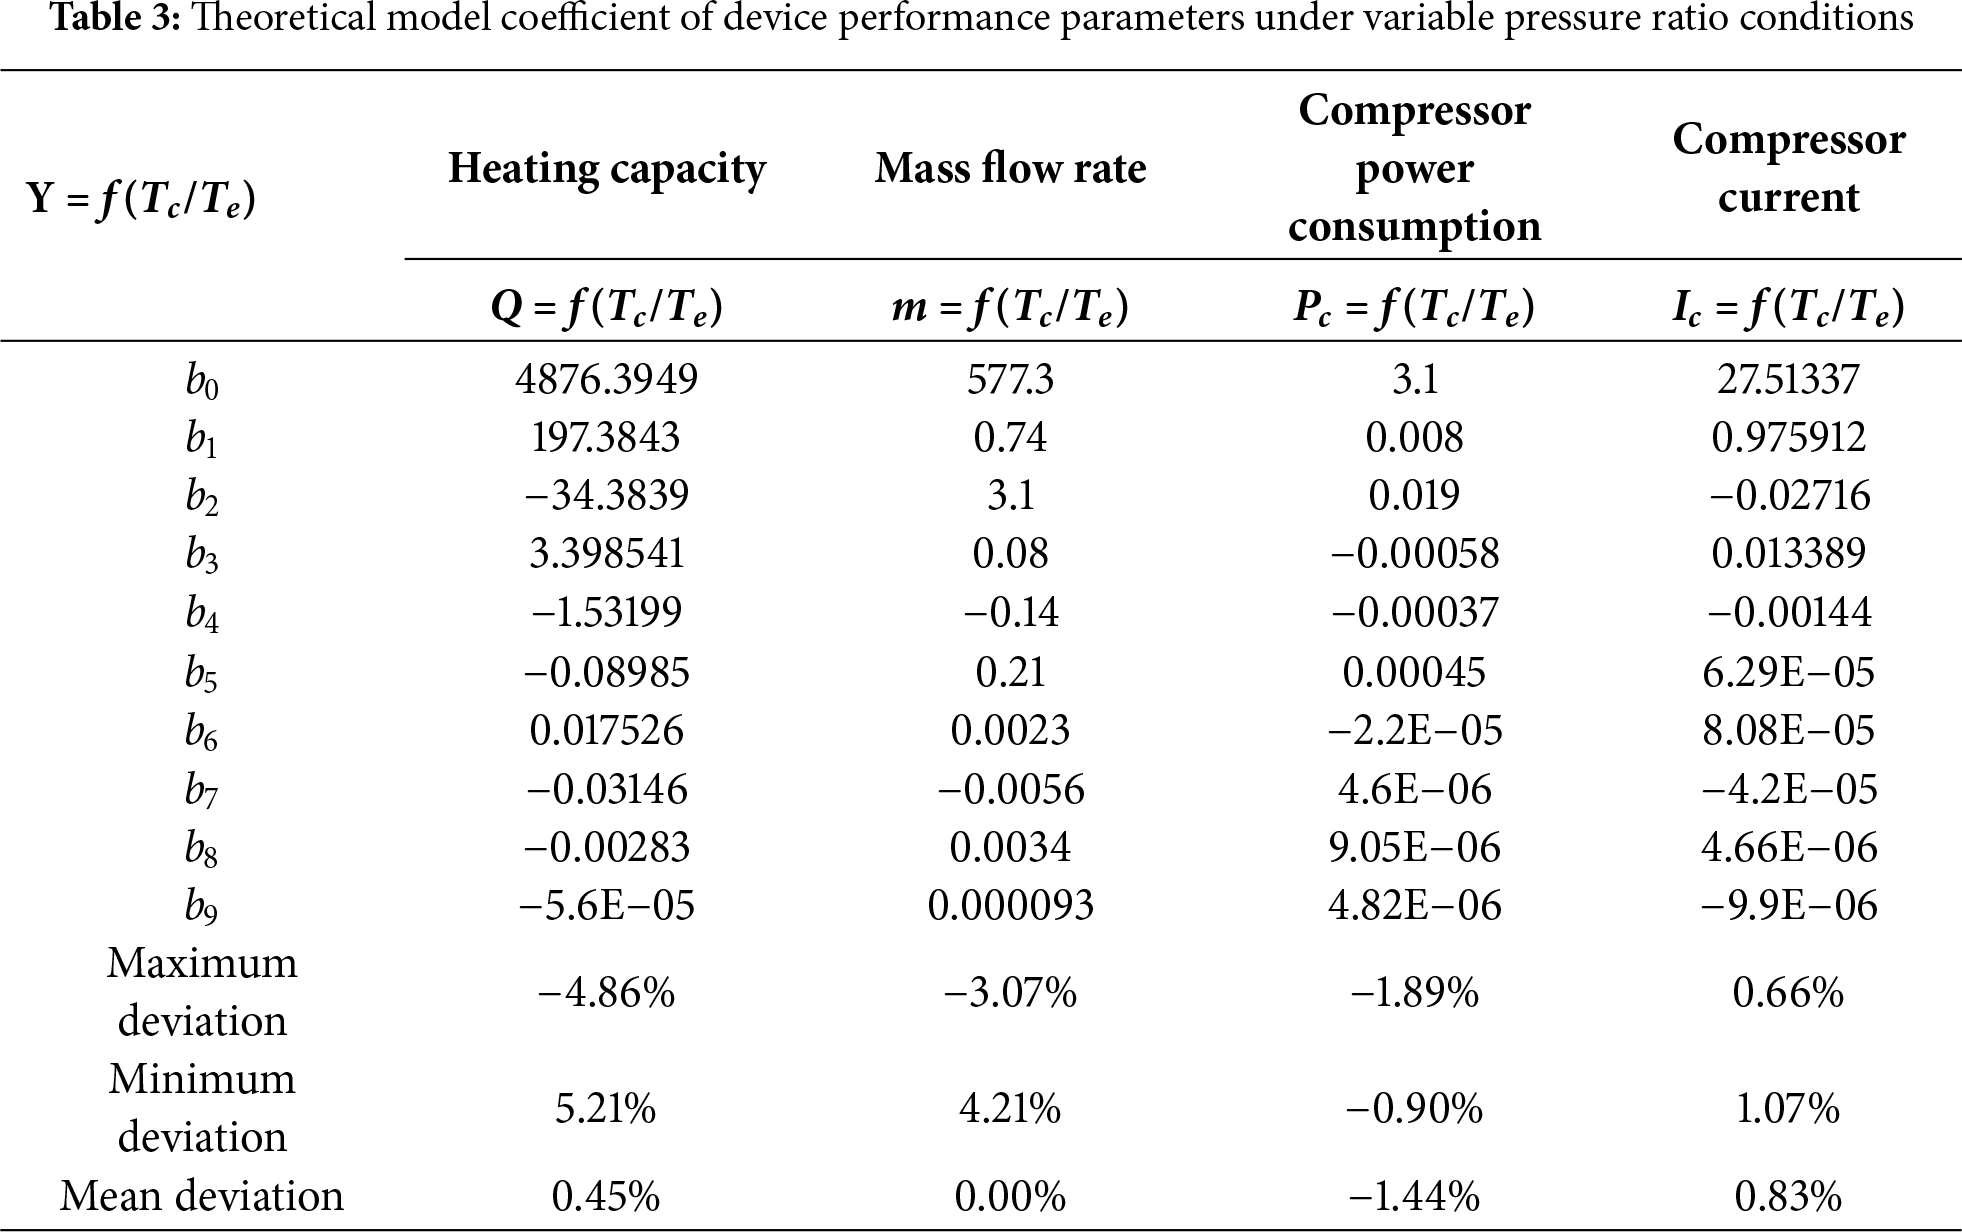
As shown in Fig. 13, the polynomial model has similar errors in solving heating capacity and refrigerant mass flow rate, with error ranges of −4.8%~5.2% and −3.07%~4.21%, respectively, and average errors of 0.45% and 0.00%, respectively. Similarly, the polynomial model also shows a similar prediction effect for compressor power and current, and its error range is less than 1%. However, the average errors of −1.44% and 0.83% for compressor power and current indicate that the model needs further improvement.
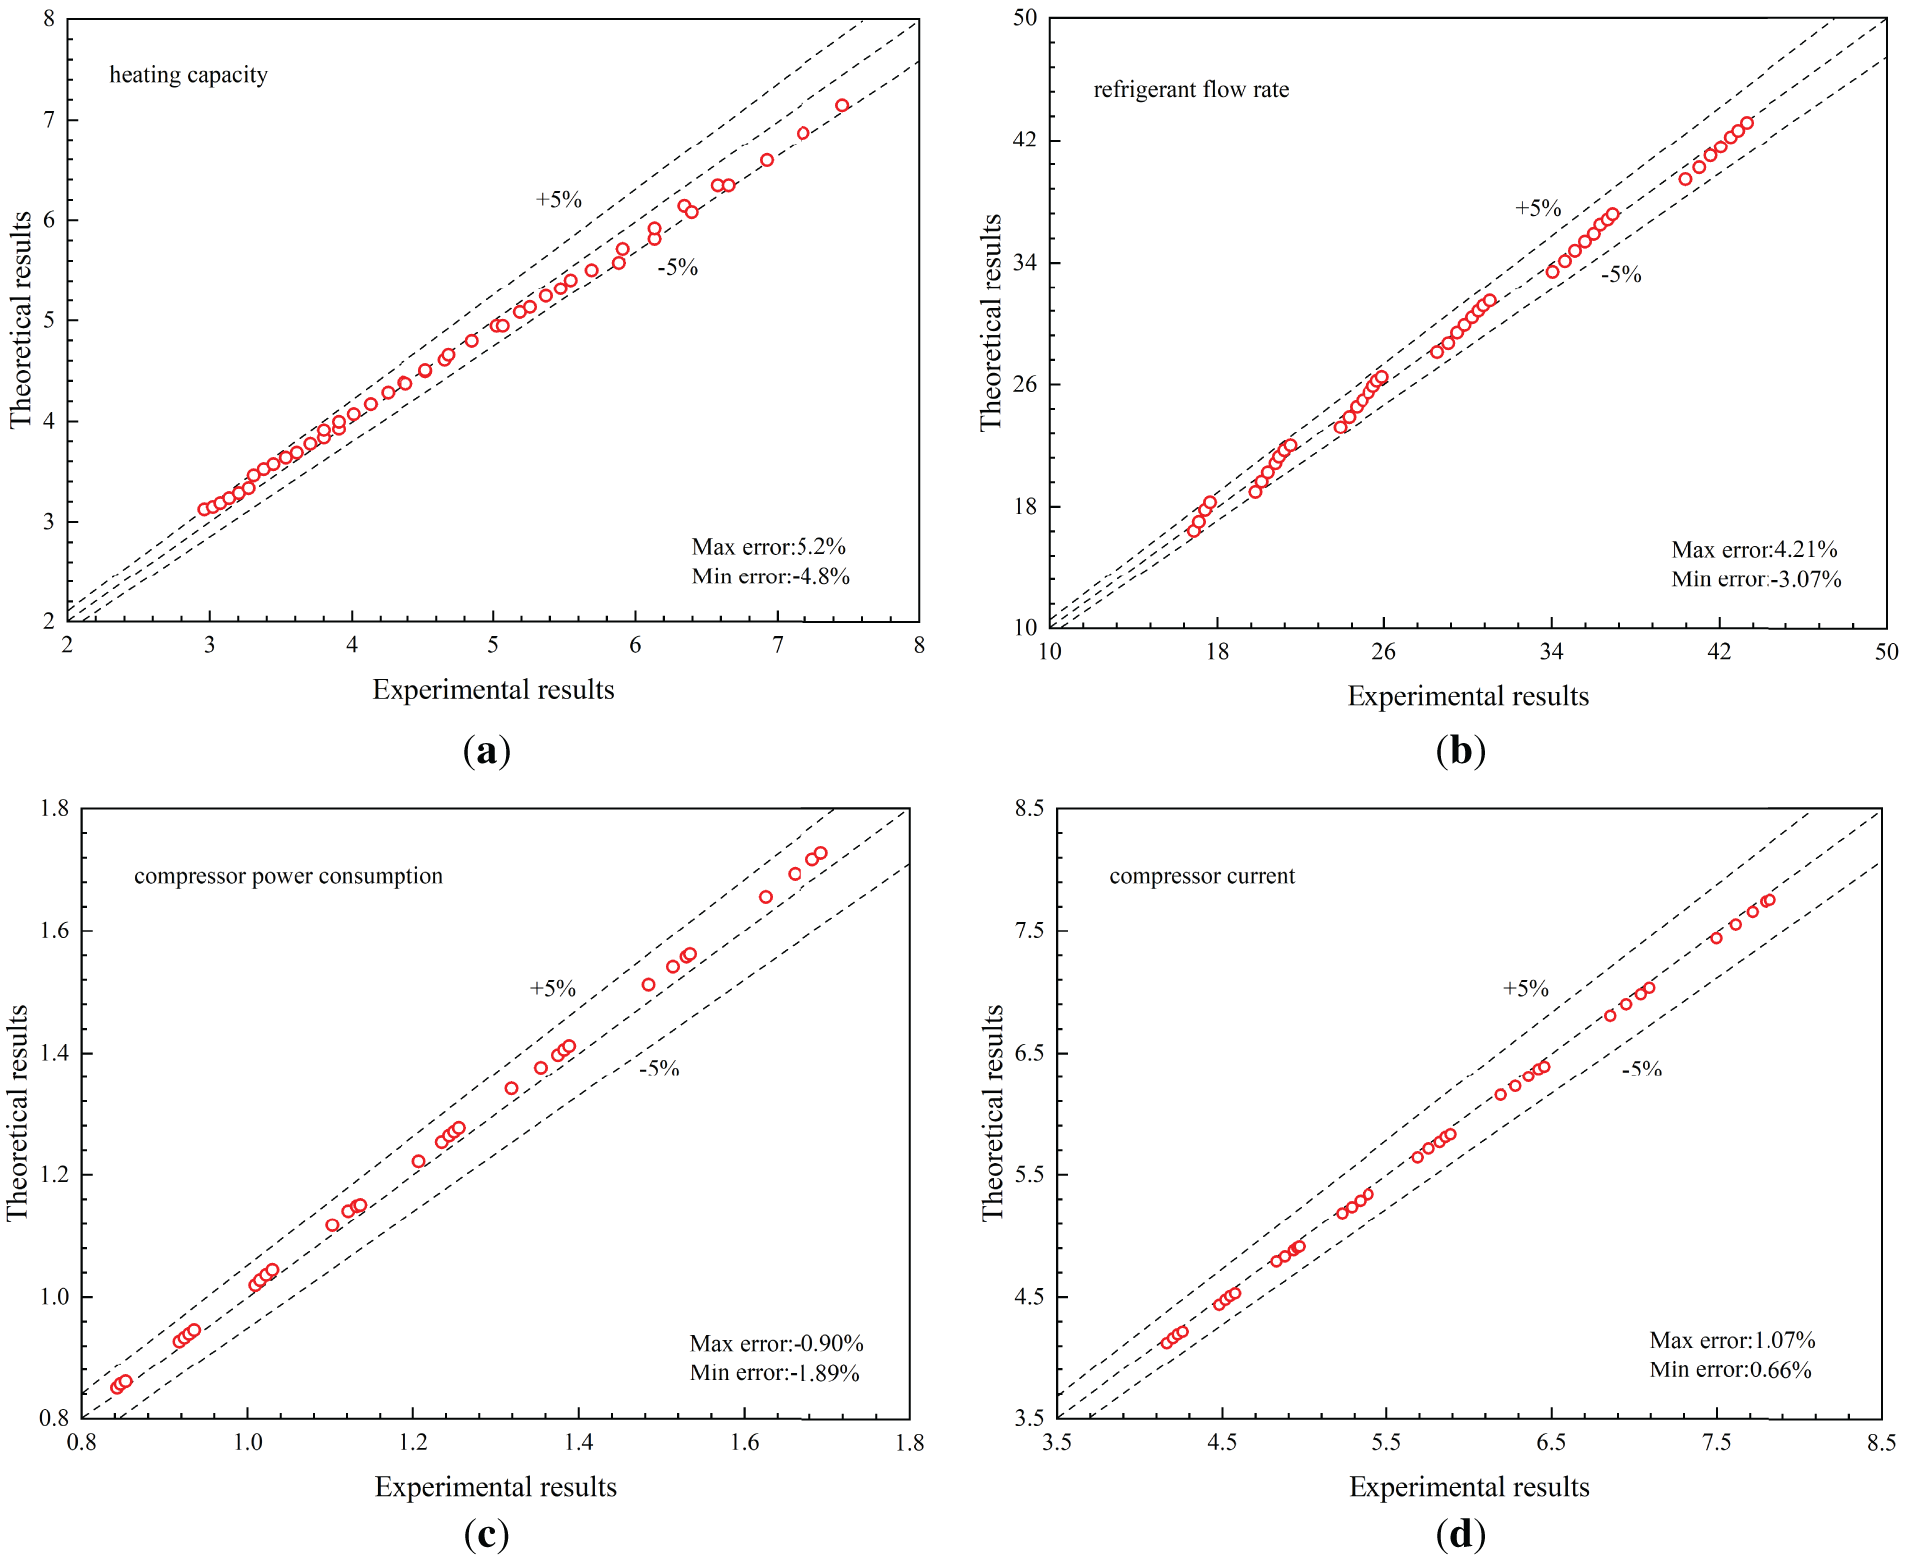
Figure 13: Under variable pressure ratio conditions, theoretical model calibration of device performance parameters: (a) Heating capacity; (b) Refrigerant flow rate; (c) Compressor power; (d) Compressor current
In summary, the error range of ±5% and the average error of ±1.44% can prove the engineering application value of the 10-coefficient polynomial model.
The model presented in Eq. (8) only accounts for the influence of the unit’s suction and discharge pressures on compressor performance (e.g., cooling capacity, power consumption, current, refrigerant flow rate), without considering variables such as compressor structure or heat pump unit load. Therefore, to further evaluate the applicability of the theoretical model, this study employed two scroll-type heat pump units, models MLZ019T5A (Unit #1) and MLZ019T4B (Unit #2), to assess the predictive accuracy of the theoretical model for cooling capacity and power consumption.
As shown in Fig. 14a,b, the cooling capacity model exhibited similar prediction performance for both Unit #1 and Unit #2. The prediction error ranged from −14.5% to 35.6%, with 73.5% of the experimental data falling within a ±15% error margin. However, under high-pressure ratio conditions (accounting for approximately 26.5% of the data), the prediction error exceeded 15%.
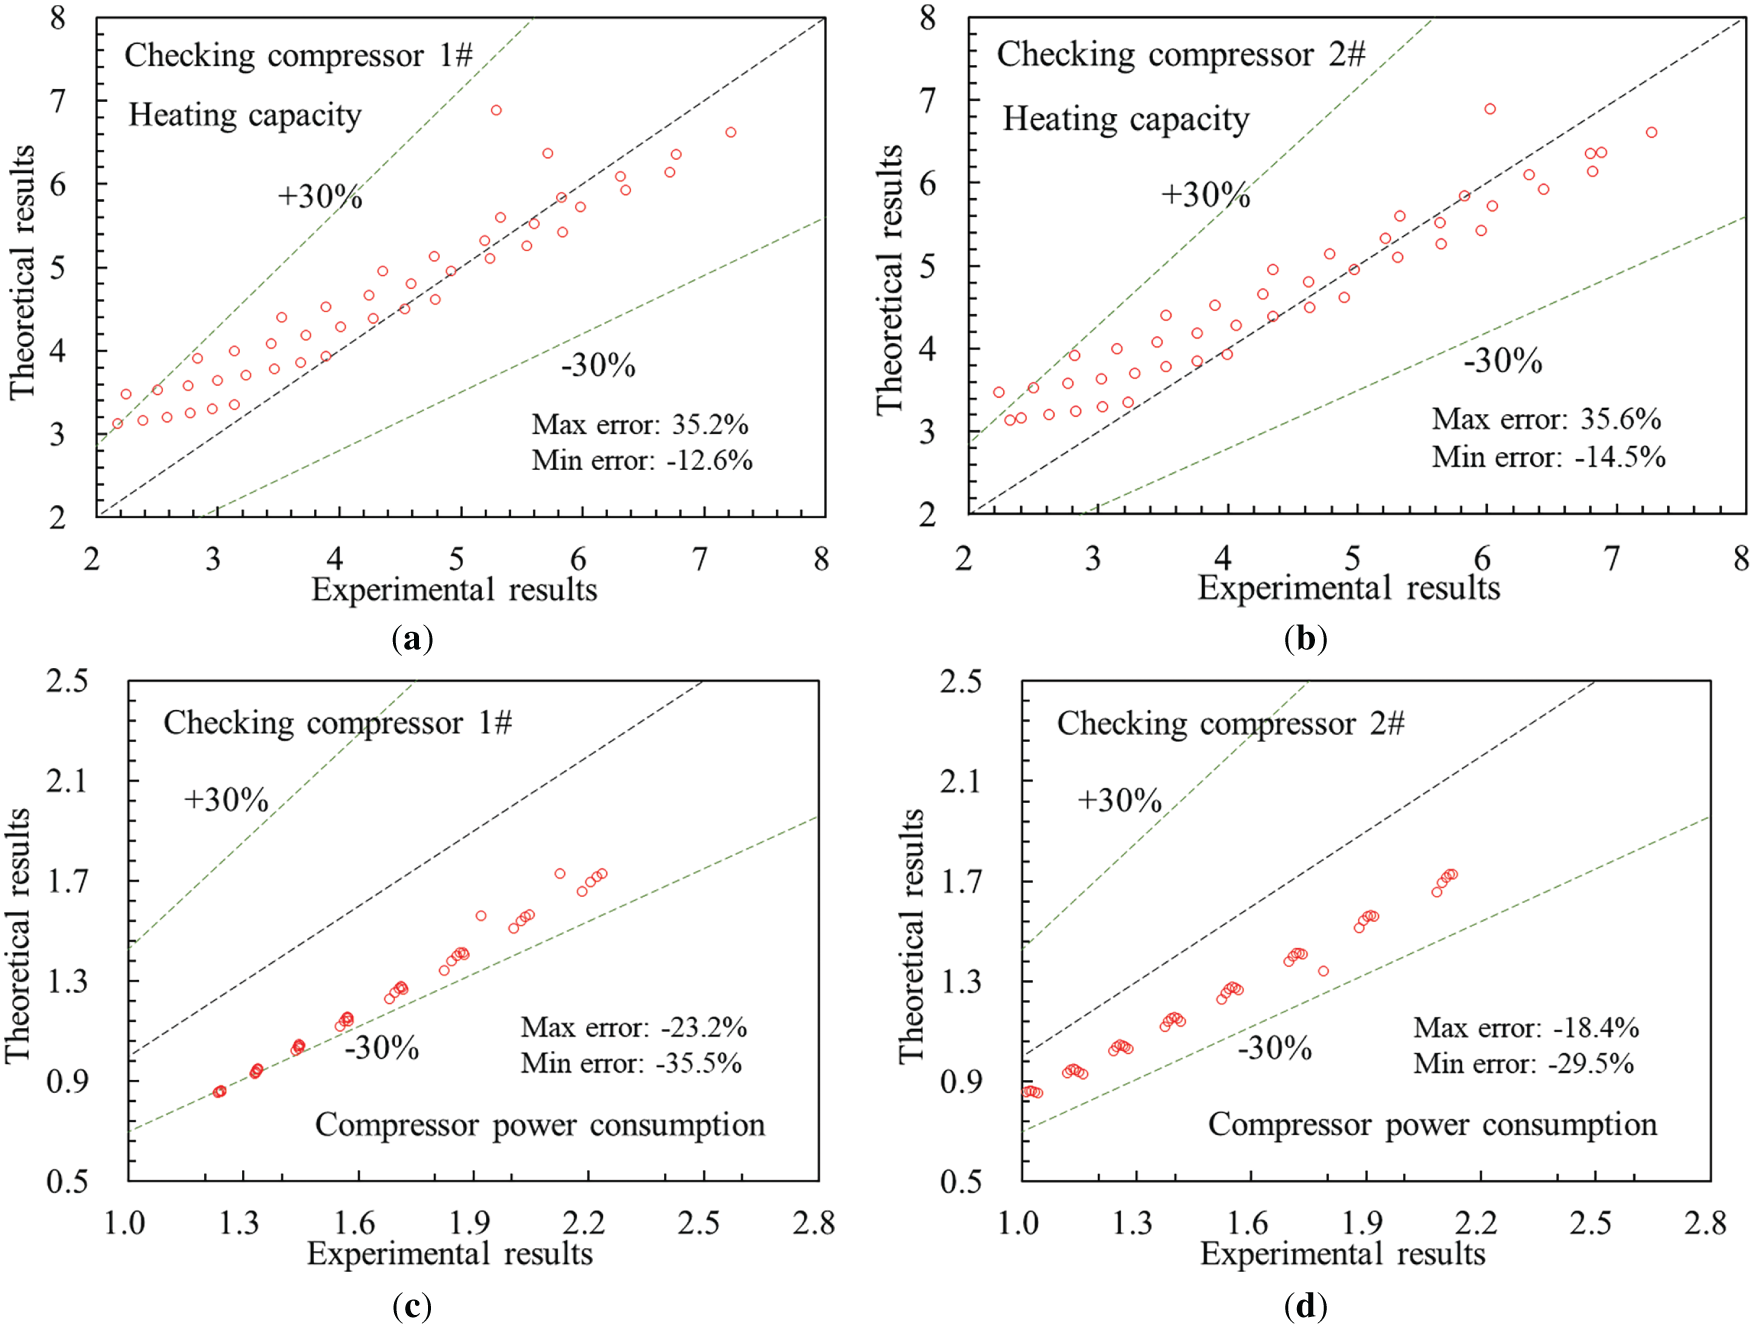
Figure 14: Verification of the theoretical model: (a) Heating capacity (1# verification compressor); (b) Heating capacity (2# verification compressor); (c) Compressor power consumption (1# verification compressor); (d) Compressor power consumption (2# verification compressor)
As shown in Fig. 14c,d, the pressure ratio had a relatively minor influence on the prediction of power consumption, and both test units showed similar trends in prediction accuracy. The prediction errors for Unit #1 and Unit #2 ranged from −35.5% to −23.2% and from −29.5% to −18.4%, respectively. Since all prediction errors exceeded 15%, the theoretical model is considered unsuitable for predicting the performance of prototype units. In conclusion, the theoretical model for scroll compressor performance, being based solely on operating conditions, shows limited accuracy when applied to compressors with different structural designs or under varying heat pump loads. Significant further work is required to broaden its applicability.
This study analyzed the influence of evaporating and condensing temperatures on the performance of a heat pump unit and its scroll compressor using R513A refrigerant. Polynomial models for key performance parameters were developed and evaluated. The main conclusions are as follows:
(1) Under constant condensing temperature, both the heating capacity and the refrigerant mass flow rate decrease with an increase in the unit’s pressure ratio. Conversely, the compressor power consumption and current exhibit a trend of first increasing and then decreasing as the pressure ratio rises.
(2) Under constant evaporating temperature, the heating capacity and refrigerant mass flow rate show a negative correlation with the condensing temperature, while the compressor power consumption and current are positively correlated with the unit’s pressure ratio.
(3) Quantitative analysis reveals that for every 5°C increase in condensing temperature under a constant pressure ratio, the average heating capacity and refrigerant mass flow rate increase by approximately 2.98% and 2.03%, respectively, while the compressor power consumption and current increase by approximately 9.2 ± 0.3%.
(4) The polynomial model using pressure ratio as the independent variable accurately characterizes the relationship between the performance parameters and the pressure ratio, with errors less than 2%. However, its applicability is constrained by specific operating temperatures.
(5) The enhanced 10-coefficient polynomial model, which incorporates both evaporating and condensing temperatures as independent variables, effectively overcomes the limitation of fixed working conditions. This model demonstrates superior prediction performance with an average error of ±1.44%, confirming its significant value for practical engineering applications.
Future work should employ a more extensive experimental design, such as the Response Surface Methodology (RSM), to develop a more generalized performance model that incorporates the influence of compressor structural parameters and operating frequency.
Acknowledgement: Not applicable.
Funding Statement: This work was supported by Henan province key science and technology research projects with No. 23A560018.
Author Contributions: The authors confirm contribution to the paper as follows: Conceptualization, Weifang Yang and Yaping Liu; methodology, Weifang Yang and Chao Gui; formal analysis, Yaping Liu and Mengyi Ge; investigation, Chao Gui; resources, Mengyi Ge and Yaping Liu; data collection, Yangyu Shi; writing—original draft preparation, Chao Gui; writing—review and editing, Chao Gui, Weifang Yang and Yaping Liu; supervision, Chao Gui; project administration, Yaping Liu. All authors reviewed the results and approved the final version of the manuscript.
Availability of Data and Materials: The data that support the findings of this study are available from the corresponding author upon reasonable request.
Ethics Approval: Not applicable.
Conflicts of Interest: The authors declare no conflicts of interest to report regarding the present study.
References
1. Li C, Hou J, Liu Z, Wei N, Jin Y, Yin H, et al. Research on the influence of scroll compressor geometry on its flow resistance and heat transfer. Compress Technol. 2022;3:6–11. (In Chinese). doi:10.16051/j.cnki.ysjjs.2022.03.002. [Google Scholar] [CrossRef]
2. Zhang Q, Sun M, Zhang C, Peng X. A reverse engineering method of the profile equations of scroll compressor. Compress Technol. 2022;5:1–5. (In Chinese). doi:10.16051/j.cnki.ysjjs.2022.05.008. [Google Scholar] [CrossRef]
3. Cheng J, Wang C, Zhang S, Zhao Z, Wu J. Influences of profile offsetting on orbiting scroll radius and dynamic characteristics of a scroll compressor. Fluid Mach. 2023;51(7):46–52. [Google Scholar]
4. Ding J, Zhang Y, Yue X, Ba D. Study on the circular profile of scroll compressors with changing radii. J Northeast Univ Nat Sci. 2019;40(5):722–7. [Google Scholar]
5. Bing S. The strength model of small parameter scroll wrap in a scroll compressor. In: Proceedings of the 15th International Conference on Advances in Materials and Processing Technologies (AMPT 2012); 2012 Sep 23–26; Wollongong, Australia. [Google Scholar]
6. Diniz MC, Pereira ELL, Deschamps CJ. A lumped-parameter thermal model for scroll compressors including the solution for the temperature distribution along the scroll wraps. Int J Refrig. 2015;53:184–94. doi:10.1016/j.ijrefrig.2014.01.003. [Google Scholar] [CrossRef]
7. Wang J, Liu Q, Cao C, Wang Z, Li Q, Qu Y. Design methodology and geometric modeling of complete meshing profiles for scroll compressors. Int J Refrig. 2018;91(5):199–210. doi:10.1016/j.ijrefrig.2018.05.011. [Google Scholar] [CrossRef]
8. Yang M, Wang B, Li X, Shi W, Shao S. A computationally efficient scroll compressor model for both single-phase and two-phase compression considering scroll wrap temperature distribution. Int J Refrig. 2022;138(5):159–68. doi:10.1016/j.ijrefrig.2022.03.008. [Google Scholar] [CrossRef]
9. Wang J, Han Y, Xi Z, Wang Z, Cui D. Geometric design and analysis of scroll compressors with a novel circular involute modified wrap. Proc Inst Mech Eng Part E J Process Mech Eng. 2022;236(3):964–74. doi:10.1177/09544089211053075. [Google Scholar] [CrossRef]
10. Li K, Li C, Mohtaram S, Liu N, Zhang H, Dou B, et al. Experimental and numerical study on scroll compressor under different profile correction and discharge ports shapes. Int J Refrig. 2025;169(5–6):241–53. doi:10.1016/j.ijrefrig.2024.10.007. [Google Scholar] [CrossRef]
11. Aprea C, Mastrullo R, Renno C. Experimental analysis of the scroll compressor performances varying its speed. Appl Therm Eng. 2006;26(10):983–92. doi:10.1016/j.applthermaleng.2005.10.023. [Google Scholar] [CrossRef]
12. Dechesne BJ, Tello-Oquendo FM, Gendebien S, Lemort V. Residential air-source heat pump with refrigerant injection and variable speed compressor: experimental investigation and compressor modeling. Int J Refrig. 2019;108(7):79–90. doi:10.1016/j.ijrefrig.2019.08.034. [Google Scholar] [CrossRef]
13. Carrington CG, Bannister P, Liu Q. Performance of a scroll compressor with R134a at medium temperature heat pump conditions. Int J Energy Res. 1996;20(8):733–43. doi:10.1002/(SICI)1099-114X(199608)20:8<733::AID-ER187>3.0.CO;. [Google Scholar] [CrossRef]
14. Liu Q, Fan S, He S. Application of enhanced vapor injection technology in ASHPWH. Fluid Mach. 2008;9:68–72. (In Chinese). [Google Scholar]
15. Tang J, Li C, Ye B, Meng X. Experimental study on performance of heat pump cycle of quasi two-stage compression for electric vehicle air-conditioning with scroll compressor. J Refrig. 2018;39(1):34–9. [Google Scholar]
16. Yang M, Wang B, Shi W, Li X. Design and control of R32 two-phase refrigerant injection system utilizing scroll compressor. J Refrig. 2015;36(5):1–9. (In Chinese). [Google Scholar]
17. Li K, Ma J, Cao J, Zhang B, Dou B, Liu N, et al. The influences of the oil circulation ratio on the performance of a vapor injection scroll compressor in heat pump air conditioning system intended for electrical vehicles. Int J Refrig. 2023;151:208–18. doi:10.1016/j.ijrefrig.2023.03.008. [Google Scholar] [CrossRef]
18. Xu S, Ma G. Characteristic of scroll compressor refrigeration system with twice-vapor injection. J Refrig. 2015;36(1):40–4. (In Chinese). [Google Scholar]
19. Zheng S, Wei M, Song P, Hu C, Tian R. Thermodynamics and flow unsteadiness analysis of trans-critical CO2 in a scroll compressor for mobile heat pump air-conditioning system. Appl Therm Eng. 2020;175(1):115368. doi:10.1016/j.applthermaleng.2020.115368. [Google Scholar] [CrossRef]
20. Wang J, Qv D, Ni L, Yao Y. Experimental study on an injection-assisted air source heat pump with a novel two-stage variable-speed scroll compressor. Appl Therm Eng. 2020;176(1):115415. doi:10.1016/j.applthermaleng.2020.115415. [Google Scholar] [CrossRef]
21. Peng M, Peng X, Wang D, Liu X, Yang Y, Wang G, et al. Investigation of the unsteady characteristic in a scroll compressor of a heat pump system for electric vehicles. J Therm Anal Calorim. 2023;148(3):956–76. doi:10.1007/s10973-022-11816-4. [Google Scholar] [CrossRef]
22. Shi W, Song S, Zhao Y, Liu Y, Liu G, Yang Q, et al. Numerical analysis of scroll compressor performance with pre-discharge valve for low-temperature heat pumps. Appl Therm Eng. 2024;254:123899. doi:10.1016/j.applthermaleng.2024.123899. [Google Scholar] [CrossRef]
23. Wang C, Wu Q, Zhang J, Zhang Z, Wu J. Startup and defrosting dynamic characteristics of the heat pump and its influence on horizontal scroll compressor reliability of high-speed train. Case Stud Therm Eng. 2025;66:105732. doi:10.1016/j.csite.2024.105732. [Google Scholar] [CrossRef]
24. Yıldız A, Yıldırım R. Investigation of using R134a, R1234yf and R513A as refrigerant in a heat pump. Int J Environ Sci Technol. 2021;18(5):1201–10. doi:10.1007/s13762-020-02857-z. [Google Scholar] [CrossRef]
25. Mota-Babiloni A, Navarro-Esbrí J, Pascual-Miralles V, Barragán-Cervera Á, Maiorino A. Experimental influence of an internal heat exchanger (IHX) using R513A and R134a in a vapor compression system. Appl Therm Eng. 2019;147:482–91. doi:10.1016/j.applthermaleng.2018.10.092. [Google Scholar] [CrossRef]
26. Yang M, Zhang H, Qin Y, Meng Z. Thermodynamic performance comparison and experimental study of mixed refrigerant R134a/R1234yf (R513A) and R134a. Chem Ind Eng Prog. 2019;38(3):1182–9. doi:10.16085/j.issn.1000-6613.2018-1185. [Google Scholar] [CrossRef]
27. Shen Z, Wang J. Experimental analysis of R515B and R513A as a drop-in replacement for R134a in screw water chiller. Refrig Air-Cond. 2023;23(7):91–7. [Google Scholar]
28. Belman-Flores JM, Heredia-Aricapa Y, Pardo-Cely D, Rodríguez-Valderrama DA, De Alba-Rosano M, Silva-Romero JC. Experimental evaluation of R513A as a low GWP refrigerant to replace R134a in a domestic refrigerator. Int J Refrig. 2022;142(43):148–55. doi:10.1016/j.ijrefrig.2022.06.019. [Google Scholar] [CrossRef]
29. Meramveliotakis G, Kosmadakis G, Karellas S. Testing and characterisation of a scroll compressor with vapour injection using R454C as a drop in refrigerant in a water source heat pump. Int J Refrig. 2025;176:359–72. doi:10.1016/j.ijrefrig.2025.05.006. [Google Scholar] [CrossRef]
30. Shen B, Li Z, Gluesenkamp KR. Experimental study of R452B and R454B as drop-in replacement for R410A in split heat pumps having tube-fin and microchannel heat exchangers. Appl Therm Eng. 2022;204(517):117930. doi:10.1016/j.applthermaleng.2021.117930. [Google Scholar] [CrossRef]
31. Hu P, Tao L, Yu Z. Experimental study on variable suction port of compressor in water source heat pump system. J Eng Therm Energy Power. 2020;35(7):168–76. (In Chinese). doi:10.16146/j.cnki.rndlgc.2020.07.024. [Google Scholar] [CrossRef]
32. Wang C, Tao L, Yu Z, Huang L. Effects of different R32 suction status on the variable frequency compressor efficiency. J Eng Therm Energy Power. 2017;32(9):40–4. (In Chinese). doi:10.16146/j.cnki.rndlgc.2017.09.007. [Google Scholar] [CrossRef]
Cite This Article
 Copyright © 2025 The Author(s). Published by Tech Science Press.
This work is licensed under a Creative Commons Attribution 4.0 International License , which permits unrestricted use, distribution, and reproduction in any medium, provided the original work is properly cited.
 Downloads
 Citation Tools