
 Submit a Paper
 Propose a Special lssue
 Open Access
ARTICLE

Analytical Modeling of Internal Thermal Mass: Transient Heat Conduction in a Sphere under Constant, Exponential, and Periodic Ambient Temperatures
1 The College of Electrical Engineering, Zhejiang University of Water Resources and Electric Power, Hangzhou, 310018, China
2 Zhejiang-Belarus Joint Laboratory of Intelligent Equipment and System for Water Conservancy and Hydropower Safety Monitoring, Hangzhou, 310018, China
* Corresponding Author: Yihang Lu. Email:
(This article belongs to the Special Issue: Heat Transfer Analysis and Optimization in Energy Systems)
Frontiers in Heat and Mass Transfer 2025, 23(6), 2109-2126. https://doi.org/10.32604/fhmt.2025.072643
Received 31 August 2025; Accepted 11 October 2025; Issue published 31 December 2025
 View Full Text
 Download PDF
Abstract
Internal thermal mass, such as furniture and partitions, plays a crucial role in enhancing building energy efficiency and indoor thermal comfort by passively regulating temperature fluctuations. However, the irregular geometry of these elements poses a significant challenge for accurate modeling in building energy simulations. This study addresses this gap by developing a rigorous analytical model that idealizes internal thermal mass as a sphere, thereby capturing multi-directional heat conduction effects that are neglected in simpler one-dimensional slab models. The transient heat conduction within the sphere is solved analytically using Duhamel’s theorem for three representative indoor air temperature scenarios: (1) constant, simulating a space with active HVAC; (2) exponentially decaying, representing a free-floating space after HVAC shutdown; and (3) periodically varying, corresponding to a naturally ventilated environment. Closed-form solutions are derived for the sphere’s internal temperature field, surface heat flux, and cumulative heat absorbed. The results demonstrate that a material’s Biot number governs its transient thermal response, with high-Biot-number materials (e.g., plywood) exhibiting a faster surface temperature rise but a steeper internal temperature gradient compared to low-Biot-number materials (e.g., concrete). The analysis of exponentially decaying and periodic scenarios reveals that sphere radius is the dominant factor determining total heat storage capacity; larger spheres absorb and release significantly more energy per cycle, despite having a lower heat flux density. Furthermore, a quantitative comparison of the decrement factor and time lag shows that while different materials may similarly dampen temperature amplitudes, a material with lower thermal diffusivity (like reinforced concrete) provides a substantially longer time lag, making it more effective for shifting thermal loads. This work provides a versatile and physically insightful analytical framework that advances the modeling accuracy of internal thermal mass beyond existing lumped-parameter methods.Keywords
Global building energy use has become a critical focus in addressing climate change. The building sector—through both operation and construction—consumes roughly one-third of the world’s total energy and produces a comparable share of energy-related carbon-dioxide (CO2) emissions [1,2]. In 2022, buildings were responsible for about 32% of global final energy demand and 34% of energy-sector CO2 emissions [3]. This outsized environmental footprint has made improving building energy efficiency a global priority, as evidenced by international assessments and policies targeting the decarbonization of buildings [4]. Achieving these goals requires not only active technological solutions but also passive design strategies that reduce energy consumption inherently while maintaining comfort.
Among passive measures, thermal energy storage in building thermal mass has emerged as a key strategy for enhancing energy efficiency and indoor comfort. Thermal mass refers to the ability of heavyweight materials (e.g., concrete, brick, stone) to absorb and store heat when the indoor environment is warm, and release that heat back when the space cools, thereby damping temperature swings [5,6]. By buffering internal heat gains and losses, properly utilized thermal mass can significantly lower heating/cooling loads and peak demand. Studies have demonstrated that incorporating sufficient thermal mass in buildings can yield substantial energy savings—on the order of 10%–20% reductions in annual HVAC energy use under many climates and operating scenarios [7,8]. For instance, Marceau et al. observed 3%–11% whole-building energy savings in typical U.S. commercial buildings by increasing interior concrete mass, with even greater savings (up to ≈17%–21% cost reduction) when combined with modest envelope improvements [9]. In climates with large day–night temperature swings, the benefits can be even more pronounced: heavy-mass construction has been shown to cut cooling loads by as much as ≈30% compared to lightweight buildings in favorable conditions [10]. These findings underline that thermal mass, when properly integrated (e.g., shaded during hot periods and exposed for night cooling), can passively shift and reduce HVAC loads, leading to energy-efficiency gains and improved thermal comfort [11].
It is important to distinguish internal thermal mass from external thermal mass in buildings, as their roles and impacts differ. External thermal mass (e.g., structural walls, roof slabs) is part of the building envelope and primarily buffers the indoor climate from outside temperature fluctuations. Its main function is to resist external environmental swings, reducing their impact on the indoors [12]. Internal thermal mass refers to massive elements located inside the thermal envelope—for example, concrete interior partitions, masonry furnishings, floors, and large furniture pieces. Internal mass is in direct contact with indoor air and actively exchanges heat with the room, thereby stabilizing the indoor temperature against internal gains or losses [13,14]. Because internal objects typically have a large exposed surface area to the room air, researchers have argued that internal thermal mass can exert an even stronger influence on indoor thermal dynamics than external mass [15]. Balcomb’s seminal work on passive solar design noted that the extensive surface exposure of interior mass allows it to absorb and release heat more effectively to the indoor space, often making it more impactful on indoor comfort than an equivalent amount of mass in the exterior envelope [16]. However, a major challenge with utilizing internal thermal mass is the irregular geometry and distribution of interior objects. Unlike uniform walls or slabs, furniture and contents have complex shapes and layouts, making it difficult to accurately quantify their effective thermal properties (surface area, thickness, volume, etc.) for heat-transfer analysis [17]. In building energy models, internal mass is often greatly simplified or omitted due to this complexity. Yet studies show that neglecting or mischaracterizing internal thermal mass can lead to notable errors in predicting indoor temperatures and loads [18]. For example, including realistic furniture and flooring in simulations has been shown to alter room-temperature profiles during dynamic heating/cooling cycles (with furnished rooms warming more slowly), highlighting the need to model internal mass properly [19]. In summary, internal thermal mass offers clear benefits for passive thermal regulation, but its irregular forms pose difficulties for conventional modeling approaches [20].
Due to these difficulties, researchers and building engineers have developed several simplified modeling methods to represent internal thermal mass in building thermal calculations. Each method attempts to approximate the heat-storage and release behavior of furniture and other objects in a tractable way, but each comes with limitations. One common approach is the “Equivalent Slab” method, used in many building-energy-simulation programs (e.g., EnergyPlus and DeST) to incorporate internal mass effects [21,22]. In this approach, the total internal thermal mass in a space is lumped into an imaginary slab or panel with an assigned area, thickness, and material properties, which is then included as an additional interior surface in the thermal model. In practice, however, the parameters for the slab are often uncertain and chosen based on rough rules or user experience [21]. More fundamentally, standard implementations assume the internal-mass slab is uniformly mixed with the zone air—effectively in thermal equilibrium with indoor air at each time step—which eliminates any ability to capture the transient surface heat exchange between the mass and air [23]. As a result, the equivalent-slab method may inaccurately estimate the timing and magnitude of heat release, especially during rapid indoor-temperature swings [24].
Another modeling approach is the “Virtual Sphere” method, which seeks to standardize irregular shapes by converting them into an idealized sphere for analysis [25]. The basic idea is to choose a “virtual” sphere radius such that the sphere’s volume (or surface area) corresponds to the actual object’s characteristics, allowing the object’s cooling/heating behavior to be approximated by the sphere’s behavior. The limitation of the virtual-sphere approach is that it still focuses on the object’s internal thermal response rather than the detailed surface interaction with the room; assuming a uniformly cooling sphere can misrepresent the true heat-exchange process at the surface [26,27].
A more recent simplification strategy is the “Effective Area” method (EAM), which introduces empirical conversion factors to better map an irregular object onto an equivalent slab model [28]. While EAM improves upon the basic equivalent slab, it remains a lumped-parameter approach and struggles to capture the detailed, time-varying relationship between the mass surface and the indoor air [29,30]. In summary, all three methods—Equivalent Slab, Virtual Sphere, and Effective Area—provide useful simplifications, but none can fully describe the detailed surface-temperature evolution and heat-exchange dynamics of actual furniture, leaving gaps in accuracy for transient or non-uniform conditions [31].
In our previous work [32], the furniture and interior partitions were idealised as a one-dimensional transient equivalent-slab model to analytically derive the temperature and heat-flux relationship between the internal thermal mass and the room air under three operating conditions (HVAC on, HVAC off, and natural ventilation). However, important limitations remain. The slab formulation assumes heat transfer occurs only in the direction normal to an infinitely extended plane, thereby neglecting multi-directional conduction and the non-uniform surface-to-air interaction inherent to realistically shaped objects. Building on that slab-based framework, the present study develops an analytical model that represents the internal thermal mass as an idealised sphere, aiming to capture radial heat-conduction effects while still retaining mathematical tractability. Three representative indoor-air temperature scenarios are addressed—(1) constant, (2) exponentially decaying, and (3) periodically varying—corresponding to conditioned, free-floating, and naturally ventilated spaces, respectively. Closed-form solutions are derived for the internal temperature field and the convective heat flux at the sphere surface, yielding precise expressions for key dynamic behaviours such as time lag and attenuation. By generalising our earlier equivalent-slab approach to a spherical geometry, this work provides a more versatile yet rigorous analytical tool for quantifying the transient interaction between internal thermal mass and indoor air across diverse operating conditions, thereby advancing modelling accuracy beyond existing lumped-capacitance or empirical methods and offering deeper physical insight for building designers.
2.1 Governing Equations and Boundary Conditions
Thermal mass in buildings can be classified as internal or external based on its spatial location. Internal thermal mass includes not only furniture but also interior walls. Due to the typically irregular shapes of furniture, a common simplification is to model it as an equivalent ideal geometry, such as a sphere or a plate. In this study, as illustrated in Fig. 1, the internal thermal mass is simplified as a spherical model. Consider a uniform solid sphere with an initial temperature T0 and radius r0. At time t = 0, the sphere’s surface begins to exchange heat via convection with the indoor air, which has a temperature of Tf(t). The transient temperature field, T(r, t), within the sphere during this physical process is described by the following one-dimensional heat conduction equation, boundary conditions, and initial condition.
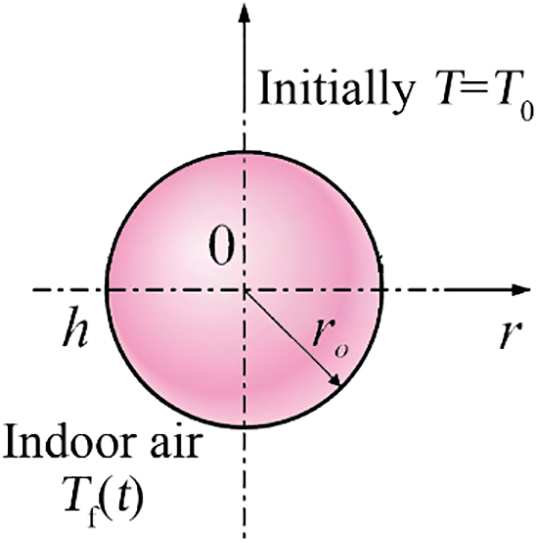
Figure 1: Schematic for a sphere subjected to varying ambient temperature
The governing partial differential equation in spherical coordinates is given by [27]:
where T is the temperature of the internal thermal mass (°C); α is the thermal diffusivity (m2/s); r is the radial coordinate (m); t is the time (s); and Tf(t) is the indoor air temperature (°C).
The boundary conditions are defined at the center and the surface of the sphere. At the center (r = 0), a symmetry condition of zero heat flux is applied:
At the surface (r = r0), a convective boundary condition is applied:
where k is the thermal conductivity (W/m·°C) and h is the convective heat transfer coefficient.
The initial condition assumes a uniform temperature distribution throughout the sphere:
where T0 is the initial temperature (°C).
2.2 Derivation of the Analytical Solution
To solve this non-homogeneous problem, the variable substitution T*(r, t) = T(r, t) − T0 and the auxiliary function θ(r, t) = r⋅T*(r, t) are introduced. This transforms the original problem into a standard one-dimensional heat conduction equation with a zero initial condition and non-homogeneous boundary conditions:
The boundary conditions are transformed to:
At r = 0:
At r = r0:
where Bi = hr0/k is the Biot number.
According to Duhamel’s theorem, the solution can be expressed in the form of a convolution integral. Finally, by applying the inverse transformation T(r, t) = u(r, t)/r + T0, the general solution for the original temperature field is obtained. The construction of this solution depends on the eigenvalues βm, the coefficients Am, and the convolution integral kernel Im(t), which varies with the boundary conditions. The eigenvalues βm are the positive roots of the transcendental equation
2.3 Analytical Solutions for Specific Boundaries
The core of the general solution is the convolution integral kernel Im(t), defined as:
By substituting the analytical solution for Im(t) into the general solution, the final expressions for any physical quantity can be obtained.
The indoor temperature of a building is typically related to the operation of its air conditioning system. When the air conditioning is on, the indoor temperature is usually maintained at a setpoint. Shortly after it is turned off, the indoor temperature often follows an exponential decay. If natural ventilation is used, the indoor temperature will exhibit periodic variations. Therefore, the following sections will analyze the temperature distribution and heat transfer of the internal thermal mass under these three distinct scenarios.
2.3.1 Constant Indoor Air Temperature
In an environment with a constant air temperature
Temperature:
Surface heat flux:
Total heat absorbed:
2.3.2 Exponentially Varying Indoor Air Temperature
When the indoor air temperature varies exponentially as
Temperature:
Surface heat flux:
Total heat absorbed:
2.3.3 Sinusoidally Varying Indoor Air Temperature
For a sinusoidally varying indoor air temperature given by
Temperature:
Surface heat flux:
Total heat absorbed:
where βm is the eigenvalue, Am is the oscillation amplitude coefficient, and q(r, t) is the heat flux, w/m2.
3.1 Thermal Response to a Constant Temperature Environment
3.1.1 Surface Temperature Dynamics: A Comparison of Materials
In indoor environments, the activation of air conditioning systems leads to a rapid stabilization of the ambient air temperature. This phenomenon is attributable to the low heat capacity of air, which allows it to reach a thermal steady state in a relatively short period. Consequently, for the purposes of analyzing thermal dynamics, the indoor air temperature can be considered constant. This study focuses on the thermal performance of common indoor heat storage bodies, specifically reinforced concrete and plywood. The essential thermophysical properties of these materials, which govern their heat storage and transfer characteristics, are detailed in Table 1.
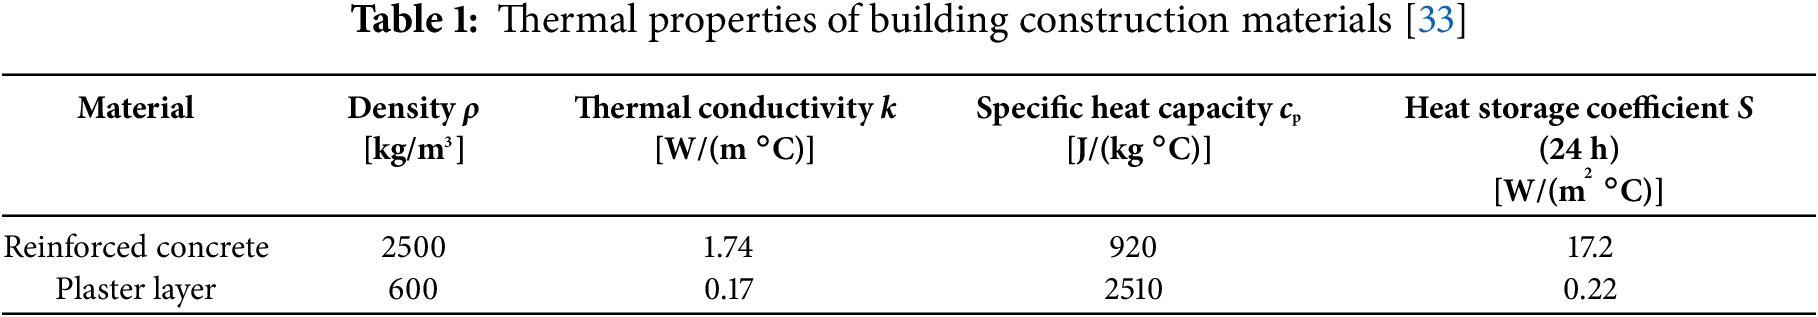
To compare the surface temperature dynamics, two solid spheres, one made of reinforced concrete and the other of plywood, are modeled. Both spheres have a diameter of 0.02 m and share a uniform initial temperature of 20°C. They are subsequently exposed to a constant ambient air temperature of 25°C. Fig. 2 illustrates the simulated transient response of the surface temperature for both materials.
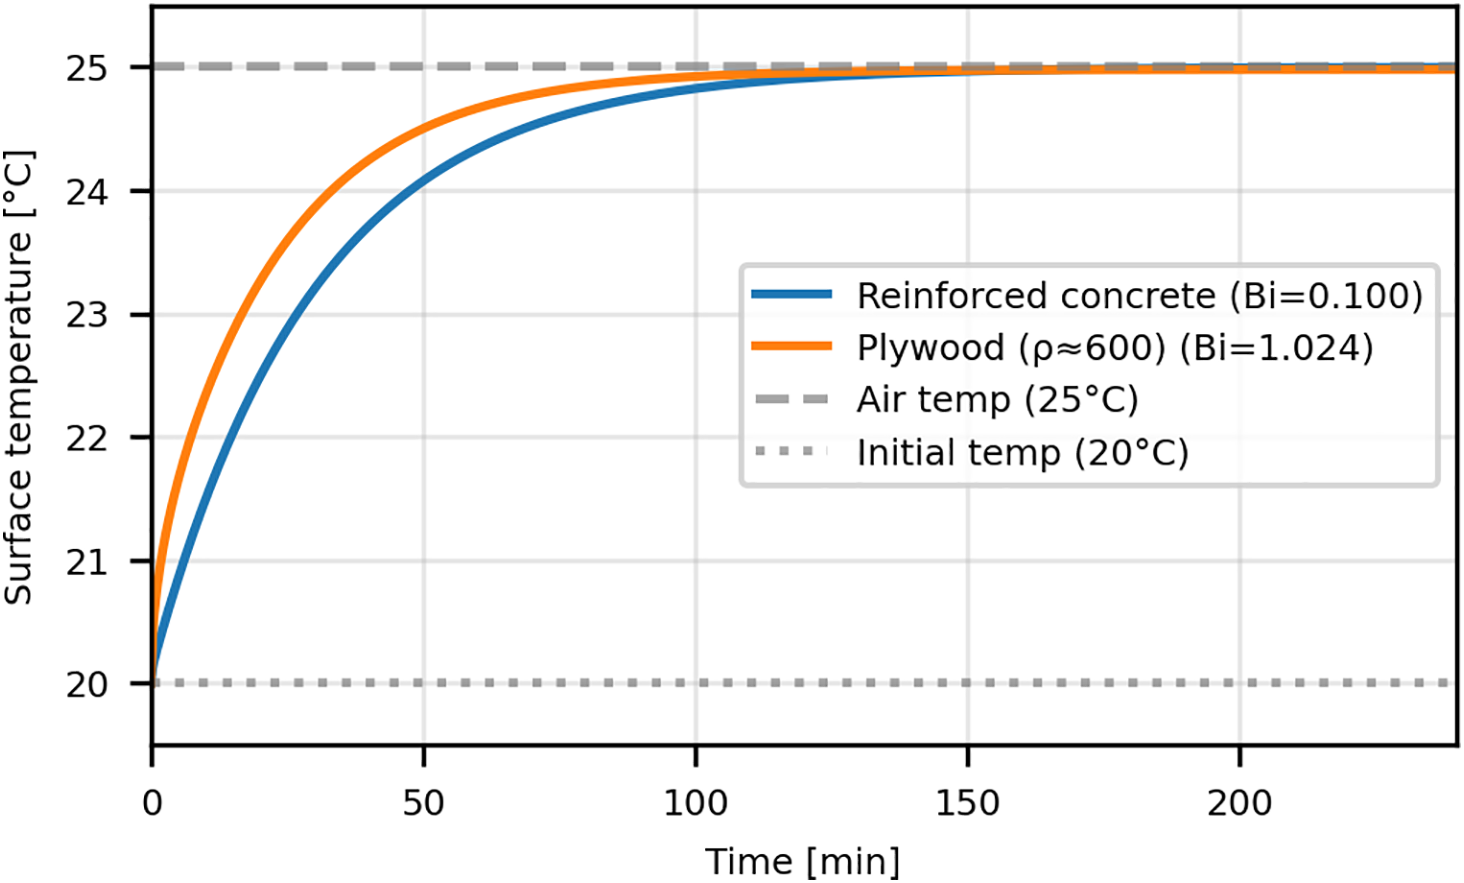
Figure 2: Surface temperature evolution for spheres of different materials
As shown in Fig. 2, the surface temperatures of both spheres exhibit an asymptotic increase from the initial 20°C towards the ambient temperature of 25°C. Initially, the large temperature difference between the air and the sphere’s surface drives a high rate of convective heat transfer, causing a rapid rise in surface temperature. As the surface heats up, this temperature difference diminishes, thereby slowing the rate of temperature increase until thermal equilibrium is approached. A key distinction is observed in the response rates of the two materials. The surface of the plywood sphere heats up significantly faster. For example, at t = 60 min, the plywood surface reaches 24.8°C, completing 96% of its total temperature rise, while the reinforced concrete only reaches 23.5°C (a 70% rise). The plywood sphere approaches equilibrium (99% of temperature rise) in 75 min, while the concrete sphere requires 125 min to reach the same state. This difference is primarily explained by their respective Biot numbers (Bi). Plywood has a much higher Biot number (Bi ≈ 1.024) than reinforced concrete (Bi ≈ 0.100). The Biot number represents the ratio of the internal (conductive) thermal resistance of a body to the external (convective) thermal resistance at the surface. For plywood, the high Biot number indicates that internal conduction is the limiting factor in the heat transfer process. Heat transferred to the surface via convection cannot be conducted into the interior as quickly, causing it to accumulate at the surface and leading to a rapid temperature rise there. Conversely, the low Biot number for reinforced concrete signifies that heat is conducted away from the surface into the interior much more effectively. This results in a slower surface temperature response but a more uniform temperature distribution throughout the sphere’s volume during the heating process.
3.1.2 Surface Heat Flux and Cumulative Heat Absorption
Fig. 3 further investigates the transient thermal behavior of the reinforced concrete and plywood spheres under the same heating conditions (initial temperature of 20°C, ambient air at 25°C). Fig. 3a illustrates the transient surface heat flux, while Fig. 3b presents the corresponding total cumulative heat absorbed by the spheres over a 240-min period. These curves are obtained from Eqs. (11) and (12).
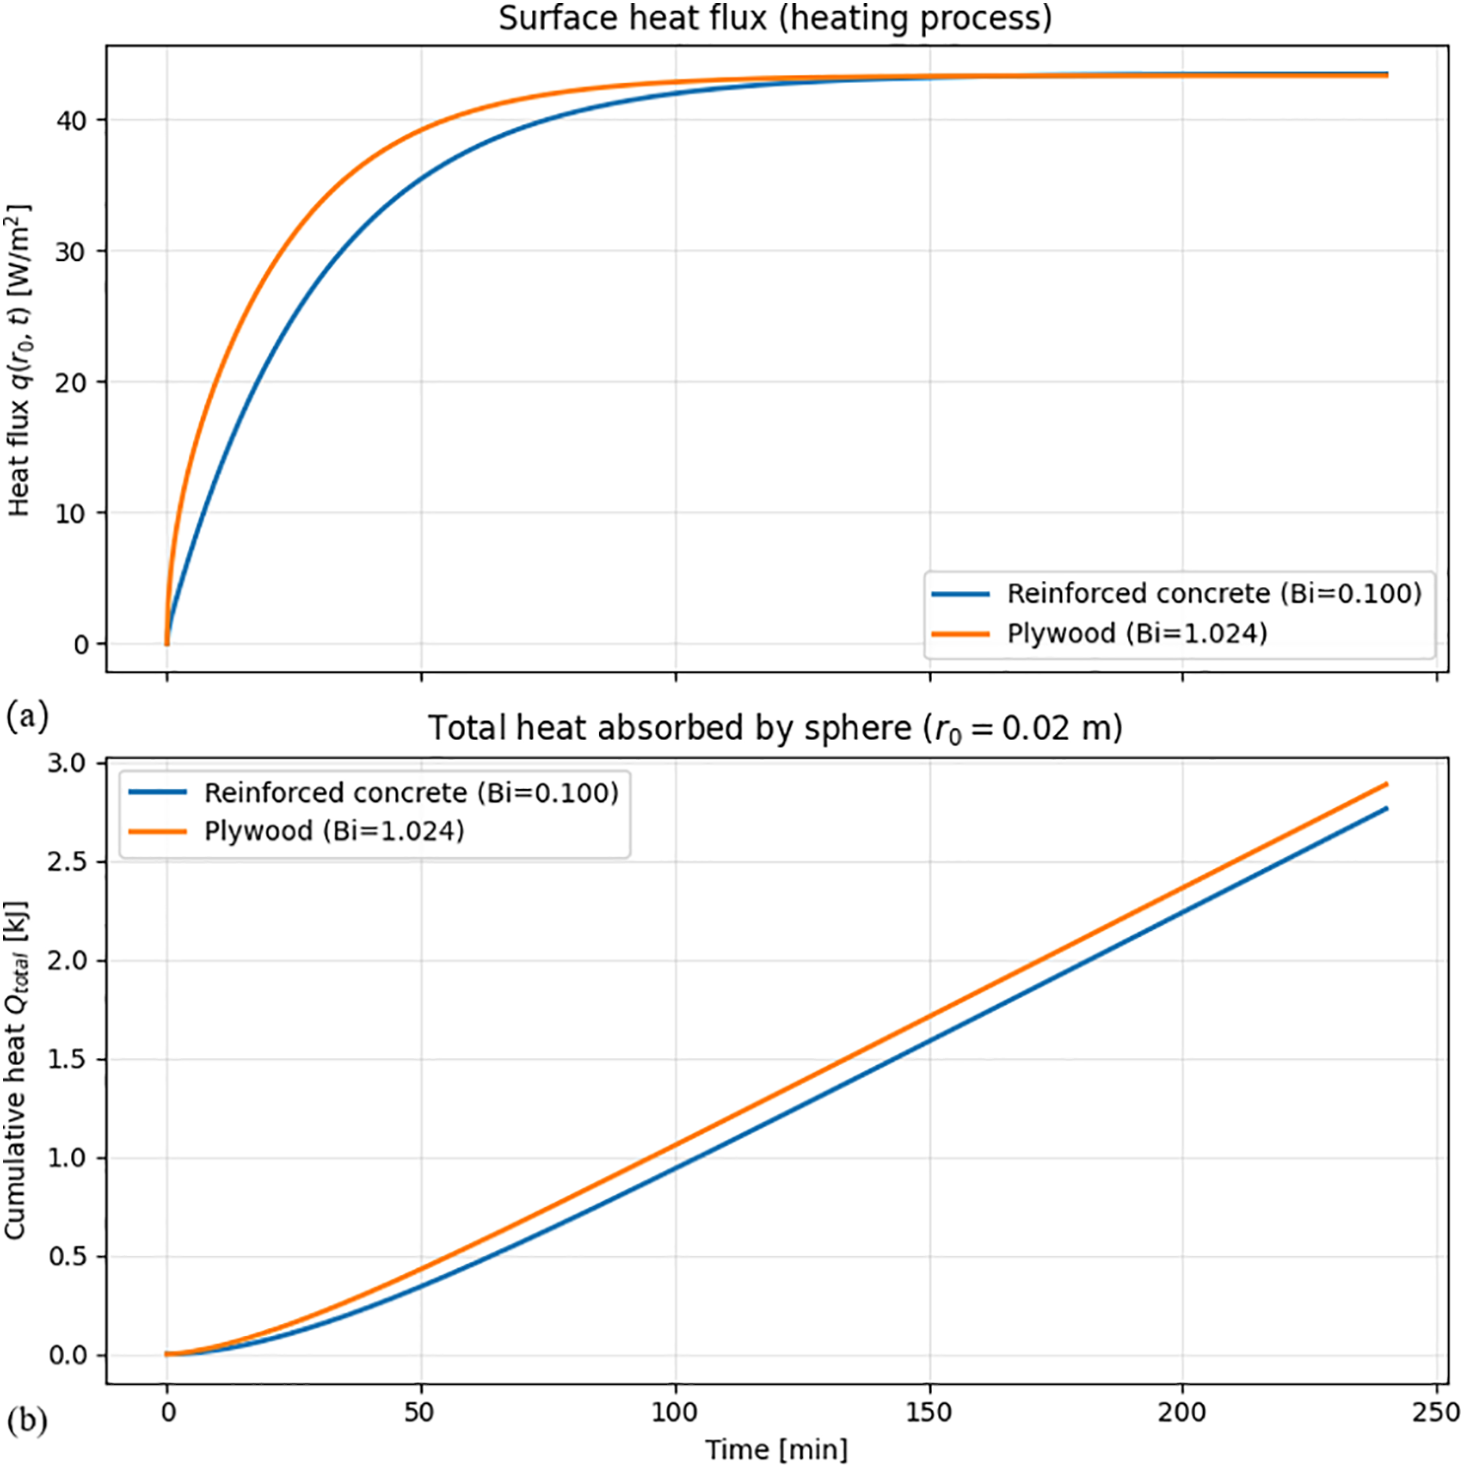
Figure 3: Comparison of transient heat transfer for reinforced concrete and plywood spheres: (a) Surface heat flux; (b) Total cumulative heat absorbed
As shown in Fig. 3a, the surface heat flux, q(r0, t), for both materials starts from zero and increases rapidly before asymptotically approaching a steady-state value of approximately 42 W/m2. A critical quantitative observation is that the heat flux for the plywood sphere (Bi ≈ 1.024) is significantly higher during the initial transient phase. For instance, at the 50-min mark, the heat flux for plywood is approximately 38 W/m2, which is over 25% higher than that of reinforced concrete (≈30 W/m2). This higher heat flux in plywood directly leads to a faster and greater accumulation of energy, as quantified in Fig. 3b. By the end of the 240-min period, the plywood sphere has absorbed approximately 2.9 kJ of energy, about 5.5% more than the reinforced concrete sphere (≈2.75 kJ). The underlying reason for this seemingly counter-intuitive behavior—where the poorer conductor (plywood) absorbs heat more rapidly—is clarified by the Biot number. Plywood’s high Biot number signifies a large internal resistance to heat flow. This resistance causes the absorbed heat to “accumulate” near the surface, creating a very steep temperature gradient (∂T/∂r). The model demonstrates that for plywood, the effect of this steep gradient is more dominant than its low thermal conductivity (k), resulting in a greater net surface heat flux (−k ∂T/∂r) during the transient heating process.
3.2 Thermal Response to an Exponentially Varying Temperature Environment
3.2.1 Influence of Ambient Temperature Decay Rate
Fig. 4 illustrates the transient thermal response of a plywood sphere with a 0.02 m radius when subjected to an exponentially decaying indoor air temperature. The analysis investigates the effect of four different decay coefficients, Ls, on the sphere’s behavior. The initial temperature of the sphere is 20°C, while the ambient air starts at 25°C. The figure systematically displays the imposed air temperature decay (Fig. 4a) and the resulting surface temperature (Fig. 4b), surface heat flux (Fig. 4d), and cumulative heat absorbed (Fig. 4c) over an 8-h period.
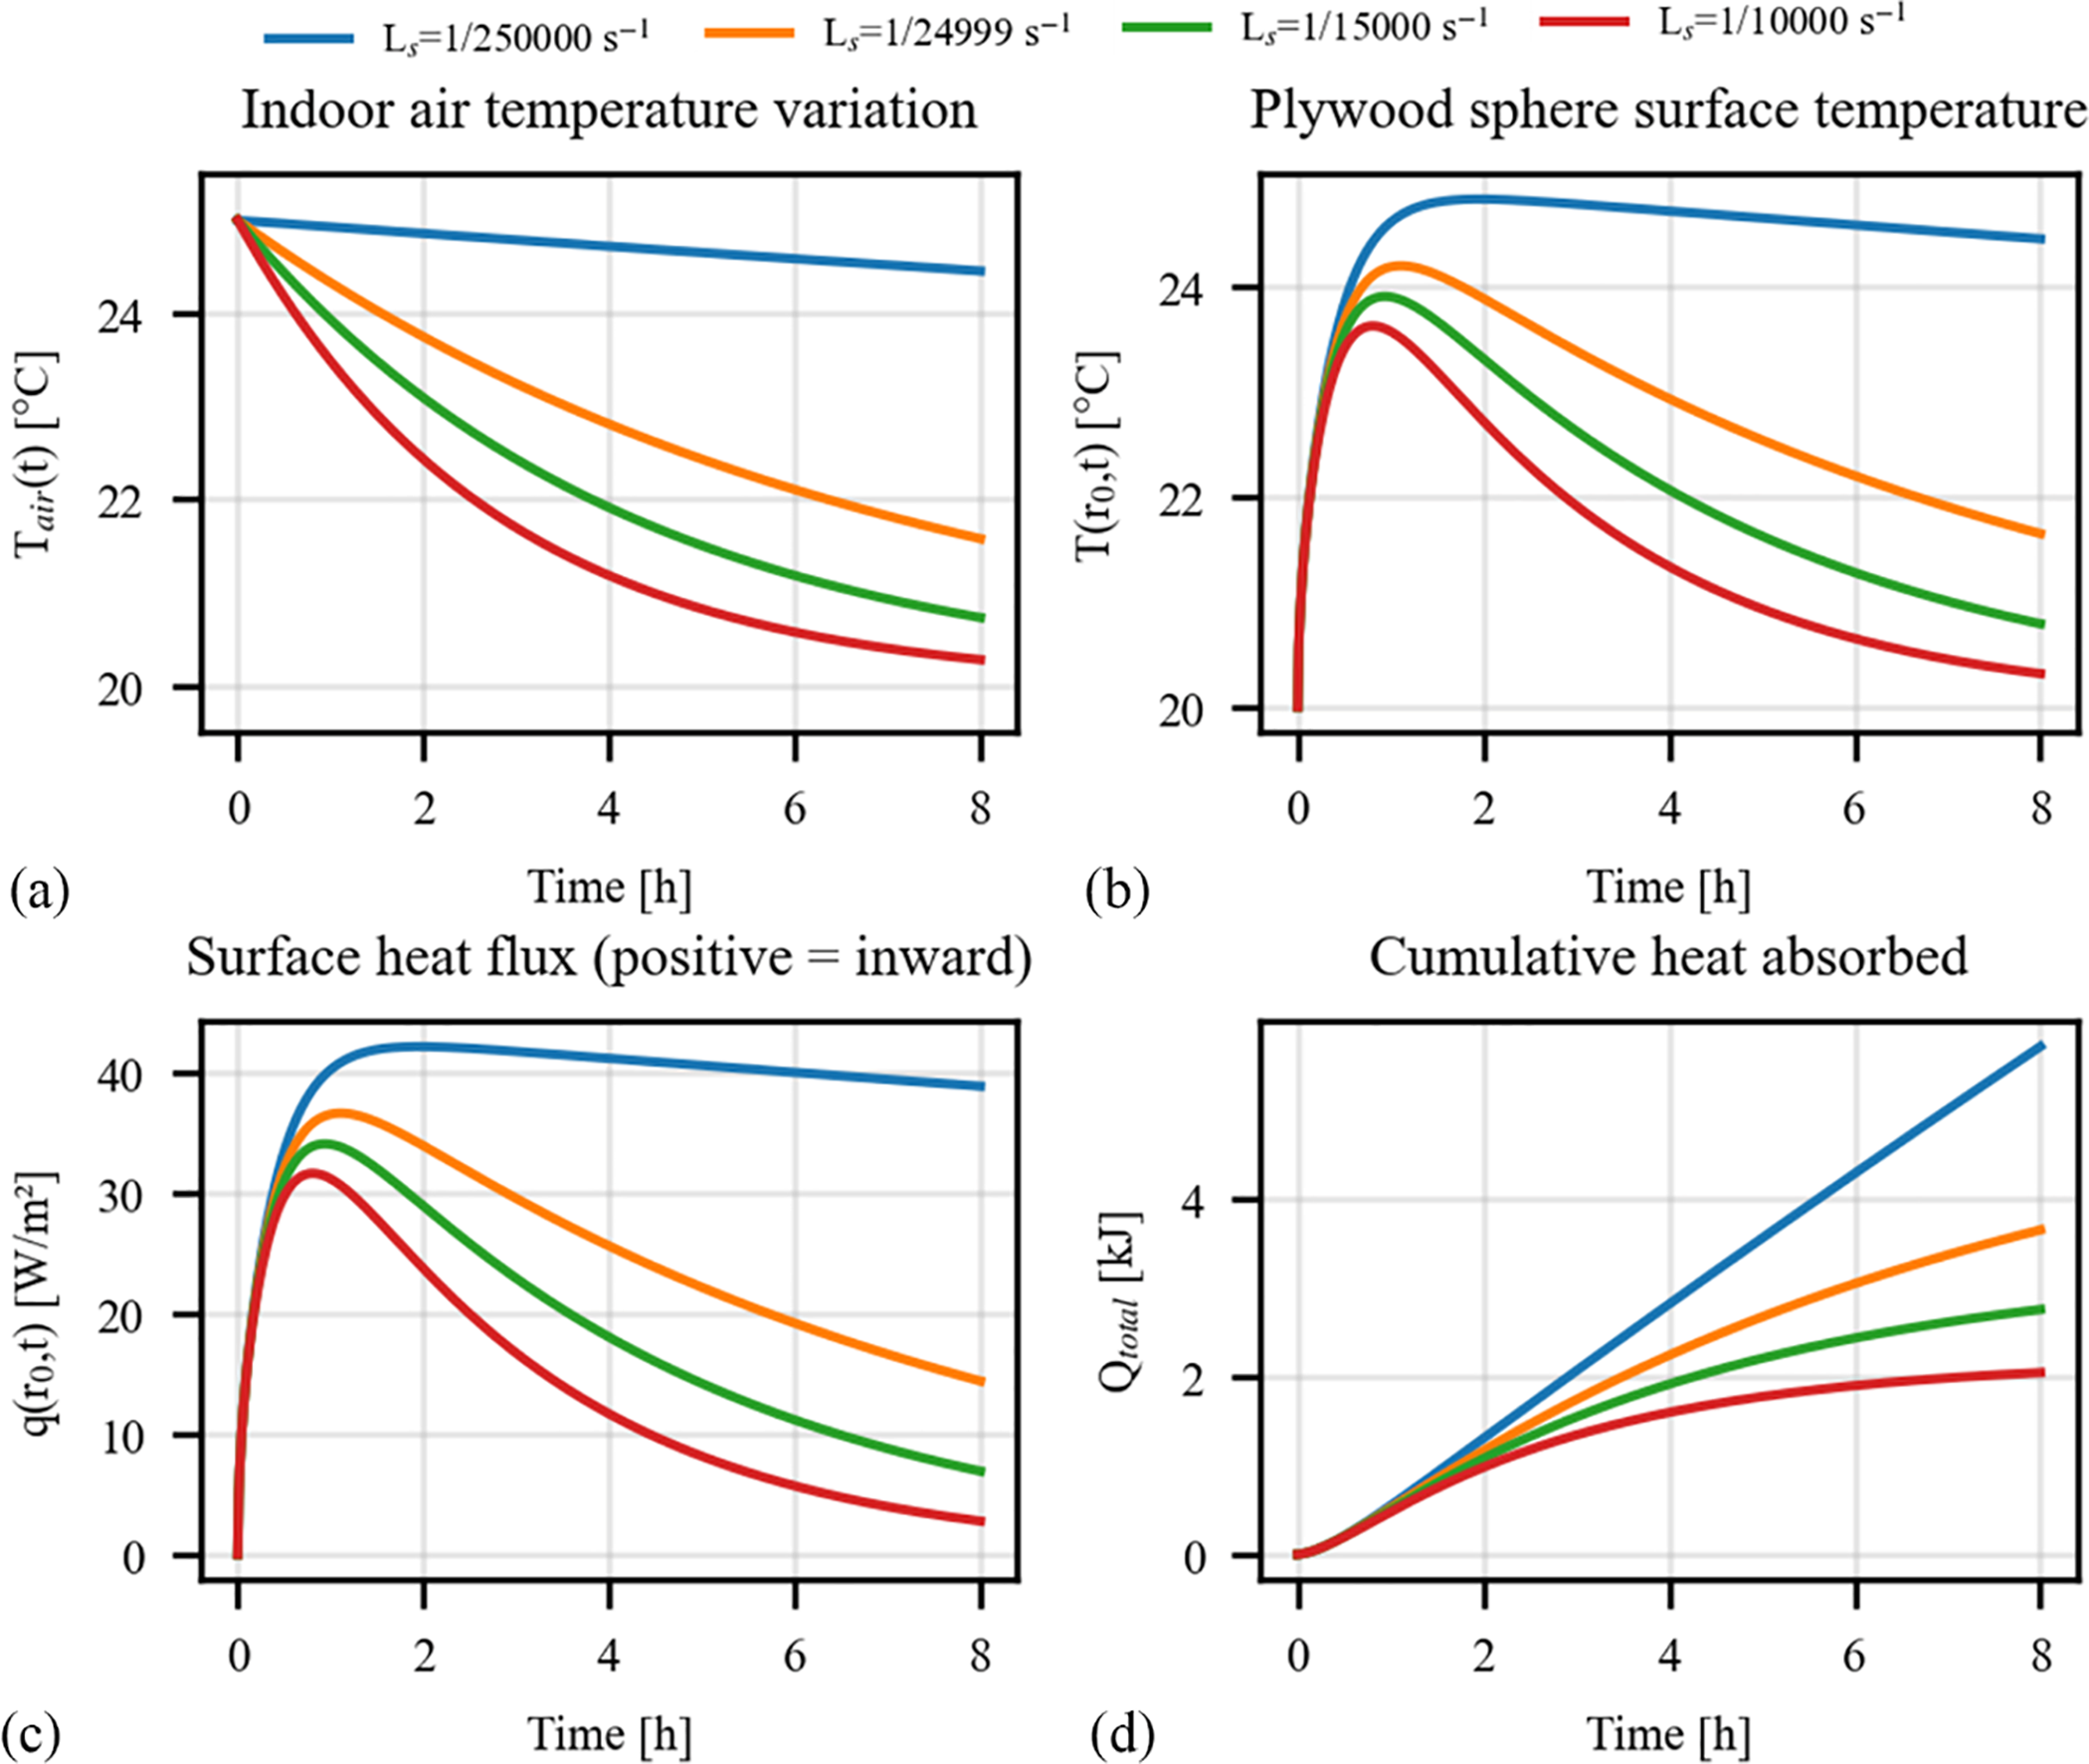
Figure 4: Thermal response of a plywood sphere subjected to different rates of ambient temperature decay (r0 = 0.02 m): (a) Imposed indoor air temperature profiles; (b) Resulting sphere surface temperature; (c) Surface heat flux into the sphere; (d) Cumulative heat absorbed
The decaying air temperature, shown in Fig. 4a, acts as a dynamic boundary condition where a larger Ls value signifies more rapid cooling. The rate of this decay has a dramatic effect on the sphere’s ability to store energy. As quantified in Fig. 4c, the sphere under the slowest decay rate (Ls = 1/250,000 s−1) absorbs approximately 5.2 kJ over the 8-h period. In stark contrast, under the fastest decay rate (Ls = 1/10,000 s−1), it absorbs only 2.0 kJ—a reduction of over 60%. This significant difference in energy storage is a direct consequence of the sustained thermal driving force in the slower decay scenarios. For the slowest decay, the surface heat flux (Fig. 4d) reaches a robust peak of approximately 40 W/m2, and the surface temperature (Fig. 4b) rises to a maximum of 24.7°C. Conversely, the rapid air cooling in the fastest decay scenario limits the peak heat flux to only 25 W/m2 and the peak surface temperature to 22.0°C. This analysis quantitatively demonstrates that a more prolonged temperature difference between the ambient air and the thermal mass is crucial for maximizing dynamic heat absorption.
Fig. 5 investigates the thermal response of a large plywood sphere, with a radius of 0.20 m, subjected to the same four rates of exponentially decaying indoor air temperature (Ls). The initial conditions remain consistent, with the sphere at 20°C and the ambient air starting at 25°C. The figure’s subplots detail the transient behavior of the air temperature (Fig. 5a), the sphere’s surface temperature (Fig. 5b), the surface heat flux (Fig. 5d), and the total cumulative heat absorbed (Fig. 5c).
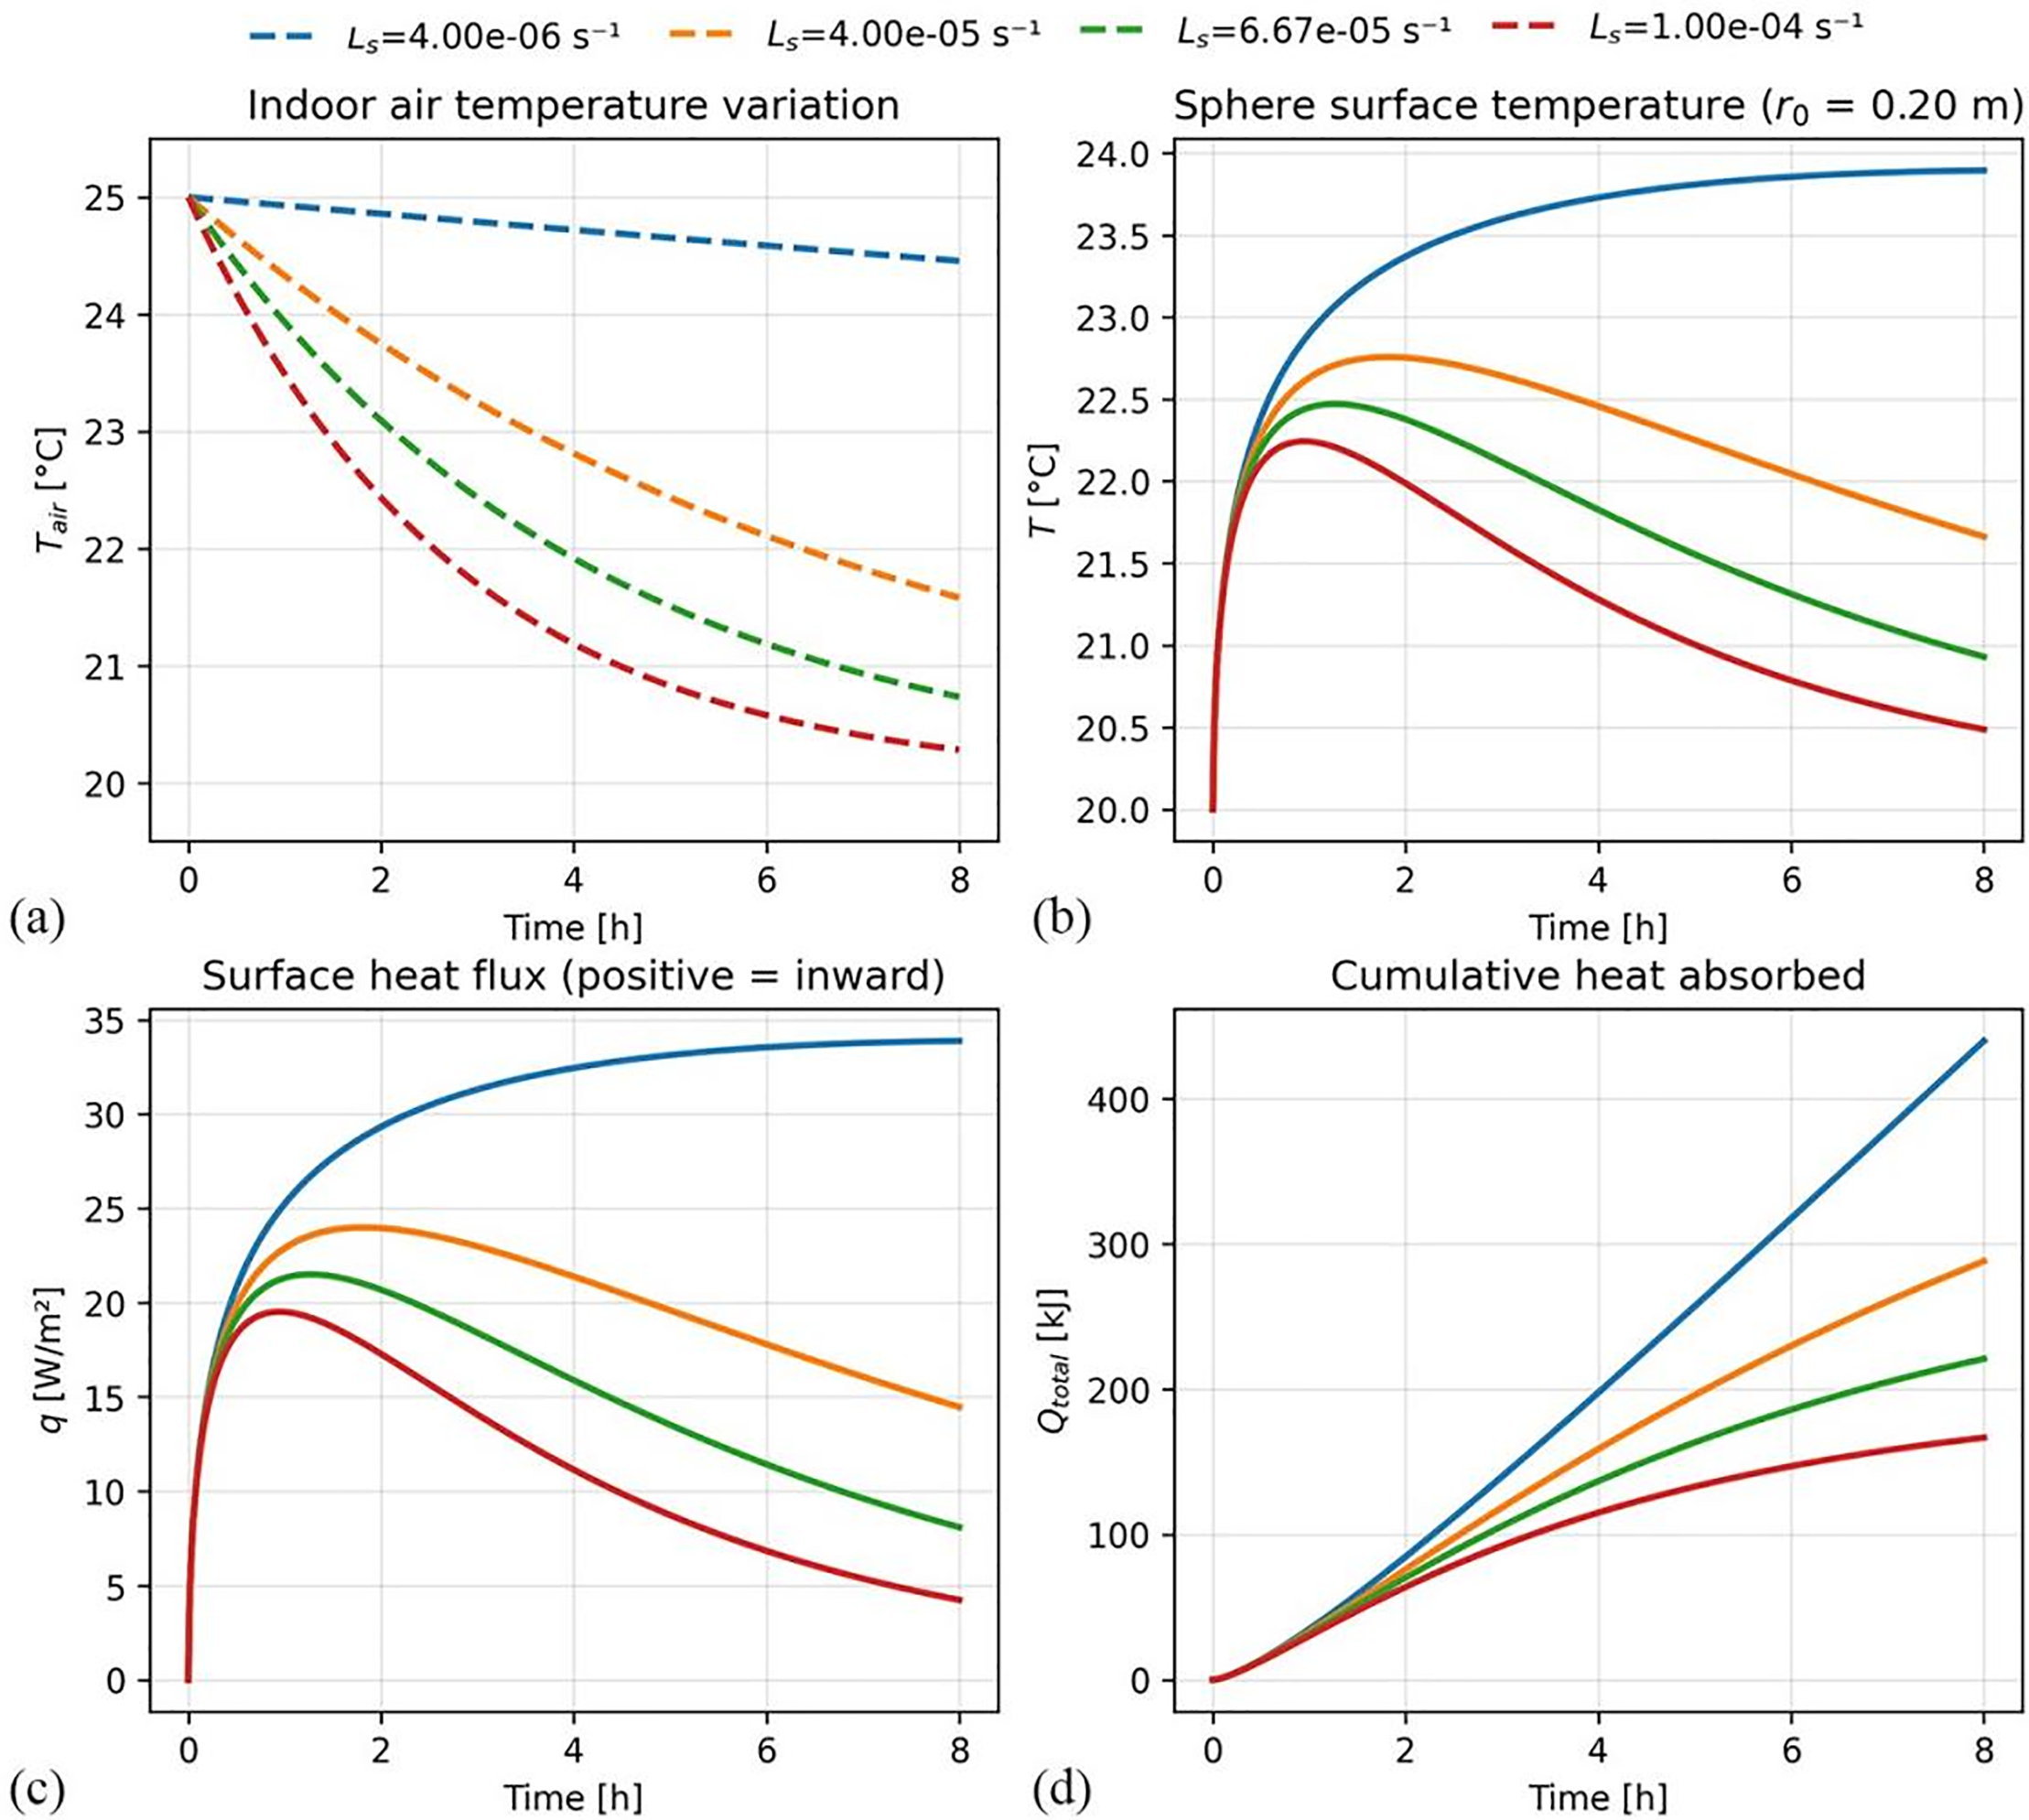
Figure 5: Thermal response of a large plywood sphere (r0 = 0.2 m) under varying rates of ambient temperature decay: (a) Imposed indoor air temperature profiles; (b) Resulting sphere surface temperature; (c) Surface heat flux into the sphere; (d) Cumulative heat absorbed
The larger radius dramatically increases the sphere’s capacity as a heat sink, with the total energy absorbed being highly dependent on the air’s decay rate. As quantified in Fig. 5c, under the slowest cooling rate (Ls = 4.00 × 10⁻⁶ s−1), the sphere absorbs over 425 kJ in 8 h. This is nearly three times the 150 kJ absorbed under the fastest cooling rate (Ls = 1.00 × 10⁻⁴ s−1). Crucially, the total energy absorbed by this large sphere is approximately 80 times greater than the maximum absorbed by the small sphere (r0 = 0.02 m) under similar conditions (Fig. 4), highlighting the profound impact of size on total heat storage.
This sustained heat absorption is reflected in the surface temperature and heat flux dynamics. For the slowest decay rate, the sphere’s vast thermal capacity allows its surface temperature to rise monotonically for the entire 8-h period without peaking (Fig. 5b), and the heat flux similarly continues to increase, reaching approximately 35 W/m2 by the end of the period (Fig. 5d). In contrast, for the faster decay rates, the thermal driving force diminishes more quickly, causing the surface temperature and heat flux to peak and then decline within the observation period. This analysis quantitatively demonstrates that a large thermal mass acts as a substantial heat sink, and that a slower rate of ambient temperature change is critical to allow sufficient time for a large amount of energy to be transferred into the sphere’s interior.
3.2.2 Influence of Sphere Radius
Fig. 6 isolates the effect of geometry by examining the thermal response of plywood spheres with five different radii (from 0.02 to 0.06 m). All spheres are subjected to the identical, exponentially decaying indoor air temperature profile shown in Fig. 6a, starting from an initial state of 20°C for the sphere and 25°C for the air.
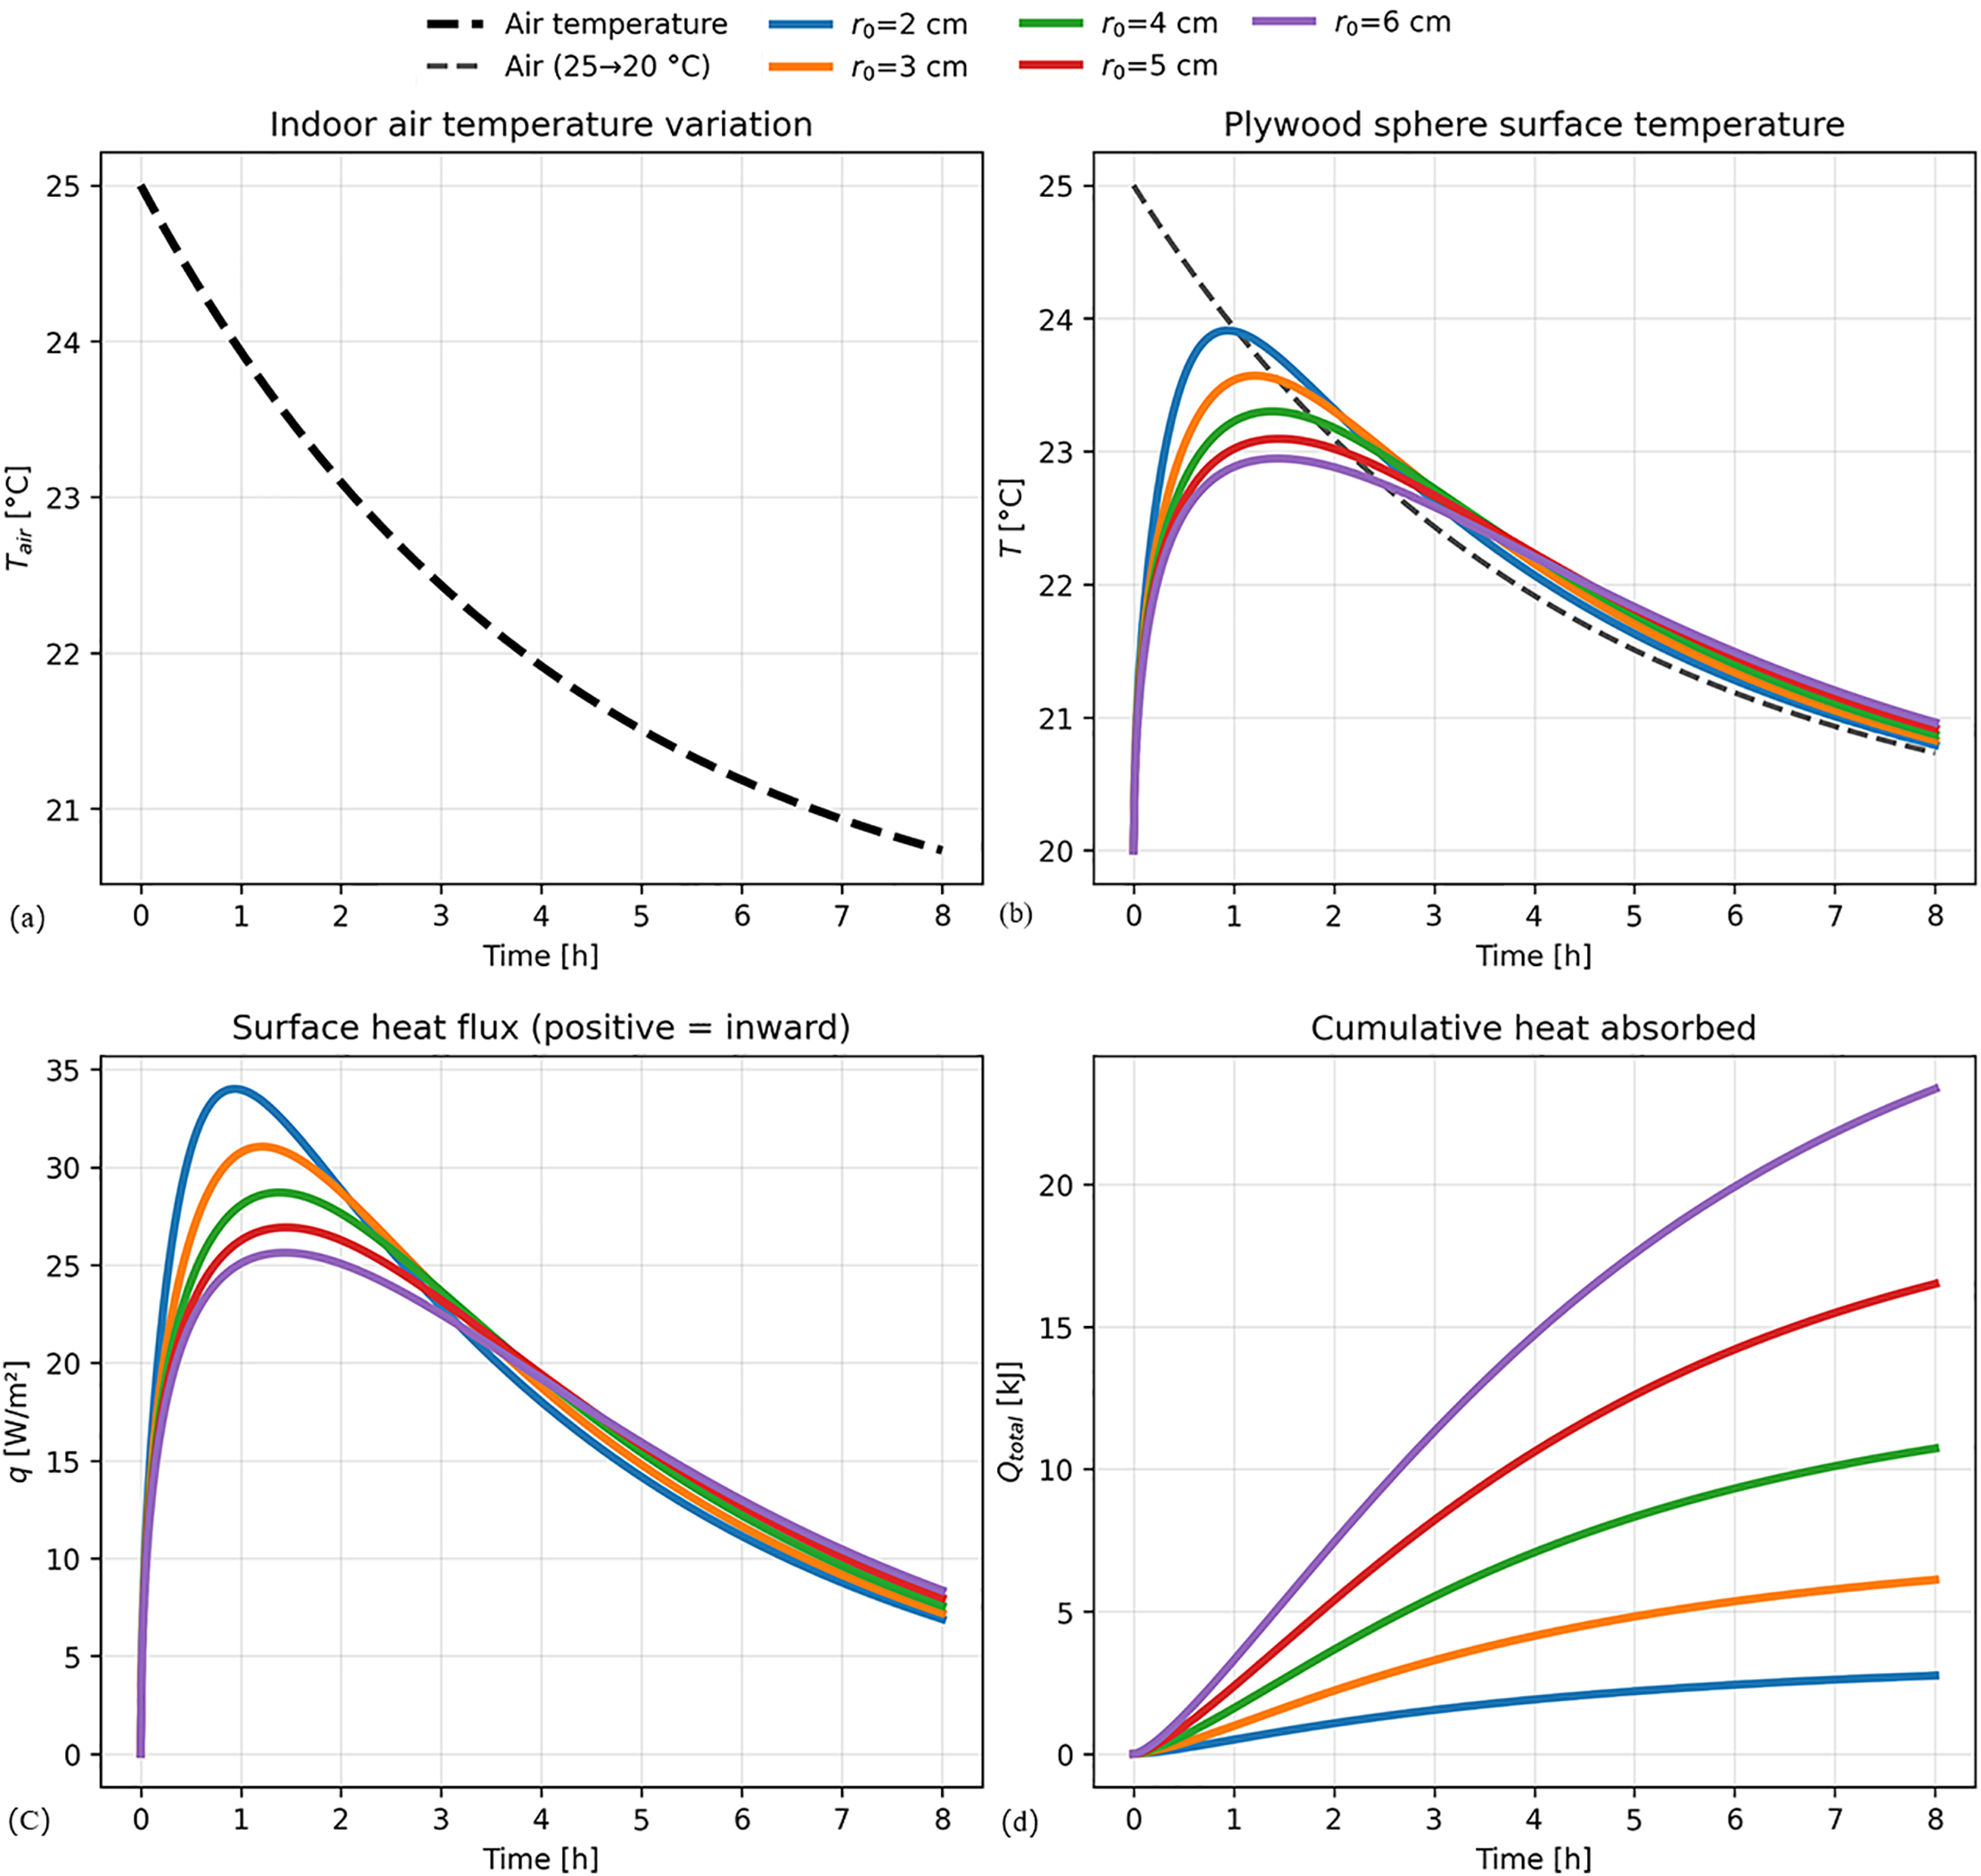
Figure 6: Influence of sphere radius on the thermal response of plywood spheres to a decaying ambient temperature (Ls = 1/15,000): (a) Imposed indoor air temperature profile; (b) Resulting surface temperature for different sphere radii; (c) Resulting surface heat flux; (d) Resulting cumulative heat absorbed
As shown in Fig. 6b,d, smaller spheres exhibit a more agile thermal response per unit area. For instance, the smallest sphere (r0 = 2 cm) reaches a peak surface heat flux density of approximately 34 W/m2. In contrast, the largest sphere (r0 = 6 cm) demonstrates greater thermal inertia, resulting in a more sluggish response with its heat flux density reaching a lower peak of only 28 W/m2. However, a contrasting and more significant trend emerges when considering the total energy absorbed (Fig. 6c). Despite their lower heat flux density, larger spheres function as far more effective total heat sinks. By the end of the 8-h period, the largest sphere (r0 = 6 cm) has absorbed approximately 22.5 kJ of energy. This is more than four times the 5.5 kJ absorbed by the smallest sphere (r0 = 2 cm). This outcome is because the total heat flow rate is the product of the heat flux density (q) and the surface area (A). While the peak heat flux density for the 6 cm sphere is about 18% lower than for the 2 cm sphere, its surface area is nine times larger. The geometric scaling of the surface area is clearly the dominant effect, leading to a substantially greater total heat absorption for larger spheres.
3.3 Thermal Response to a Periodically Varying Temperature Environment
3.3.1 Influence of Radius on Dynamic Thermal Response
Fig. 7 provides a dynamic thermal analysis of reinforced concrete spheres with radii varying from 0.01 to 0.06 m. The spheres are subjected to a periodic, sinusoidal indoor air temperature over a 48-h cycle, simulating daily temperature fluctuations. The analysis focuses on the resulting surface temperature, surface heat flux, and cumulative heat absorbed to evaluate the influence of thermal mass on dynamic heat storage performance.
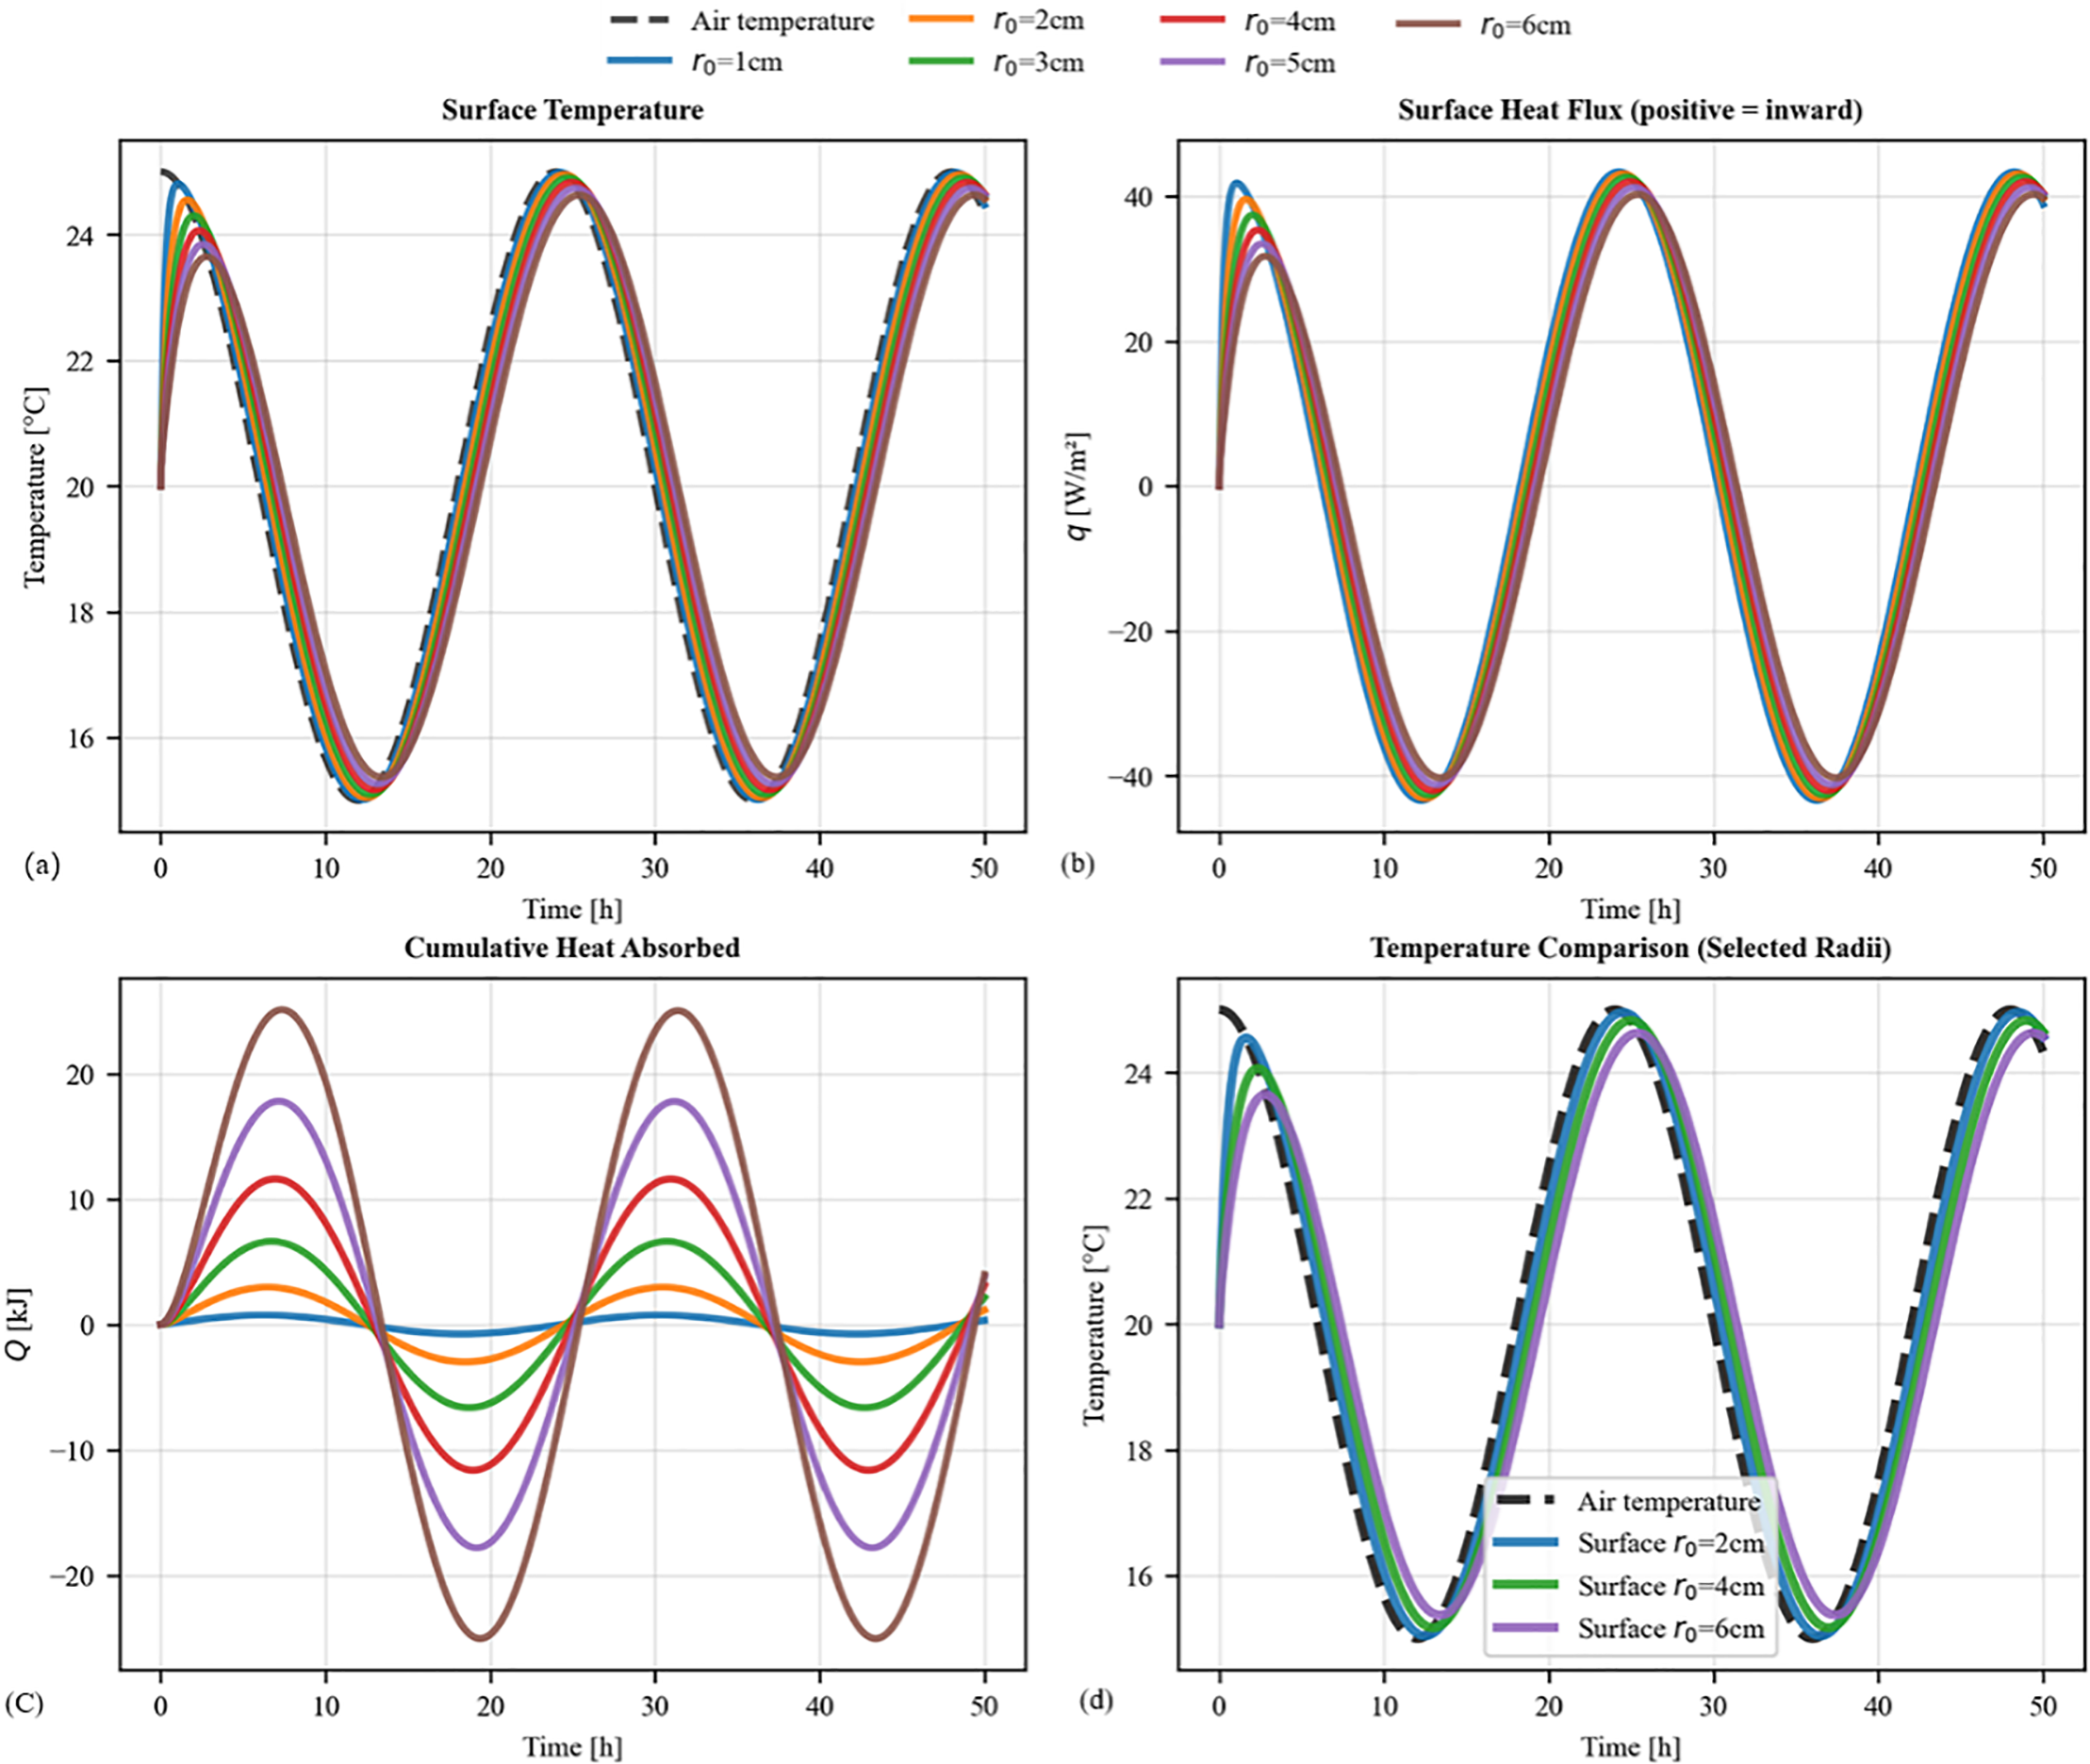
Figure 7: Influence of sphere radius (r0) on the periodic thermal response of concrete spheres: (a) Surface temperature of all spheres compared to the sinusoidal air temperature; (b) Corresponding surface heat flux; (c) Cumulative heat absorbed and released during each cycle; (d) Detailed temperature comparison for selected radii to highlight phase lag and damping
As shown in Fig. 7a, the sphere’s radius directly governs its thermal inertia, leading to distinct modifications of the surface temperature response: a decrement in amplitude and an increase in time lag. For example, the surface temperature of the largest sphere (r0 = 6 cm) exhibits a noticeable time lag, peaking approximately 1.5 h after the ambient air temperature peak. This inertia directly influences the heat exchange dynamics. The surface heat flux density (Fig. 7b), driven by the instantaneous air-to-surface temperature difference, consequently has a smaller amplitude for larger spheres. The peak heat flux for the largest sphere is approximately 30 W/m2, which is nearly 30% lower than the ~42 W/m2 peak observed for the smallest sphere (r0 = 1 cm). However, the most critical insight comes from the cumulative heat plot (Fig. 7c), which quantifies the total dynamic heat storage capacity. Despite the lower heat flux per unit area, larger spheres exchange a vastly greater amount of total energy with their surroundings each cycle. The amplitude of energy exchanged by the largest sphere (r0 = 6 cm) is approximately ±23 kJ. This is nearly eight times greater than the ±3 kJ exchanged by the smallest sphere (r0 = 1 cm). This outcome is because the total heat transfer rate is the product of the flux density (q) and the surface area (A = 4πr02). While the peak flux density for the 6 cm sphere is about 30% lower than for the 1 cm sphere, its surface area is 36 times larger. The geometric increase in surface area is unequivocally the dominant factor, quantitatively demonstrating that larger thermal mass provides a superior capacity for dynamic heat storage.
Fig. 8 concludes the analysis by examining the dynamic thermal response of plywood spheres with radii ranging from 0.01 to 0.06 m. The spheres are exposed to a 24-h sinusoidal indoor air temperature, simulating a typical daily cycle. The subsequent analysis of the surface temperature, heat flux, and cumulative heat absorbed reveals the critical role of size and thermal mass in the dynamic heat storage characteristics of plywood.
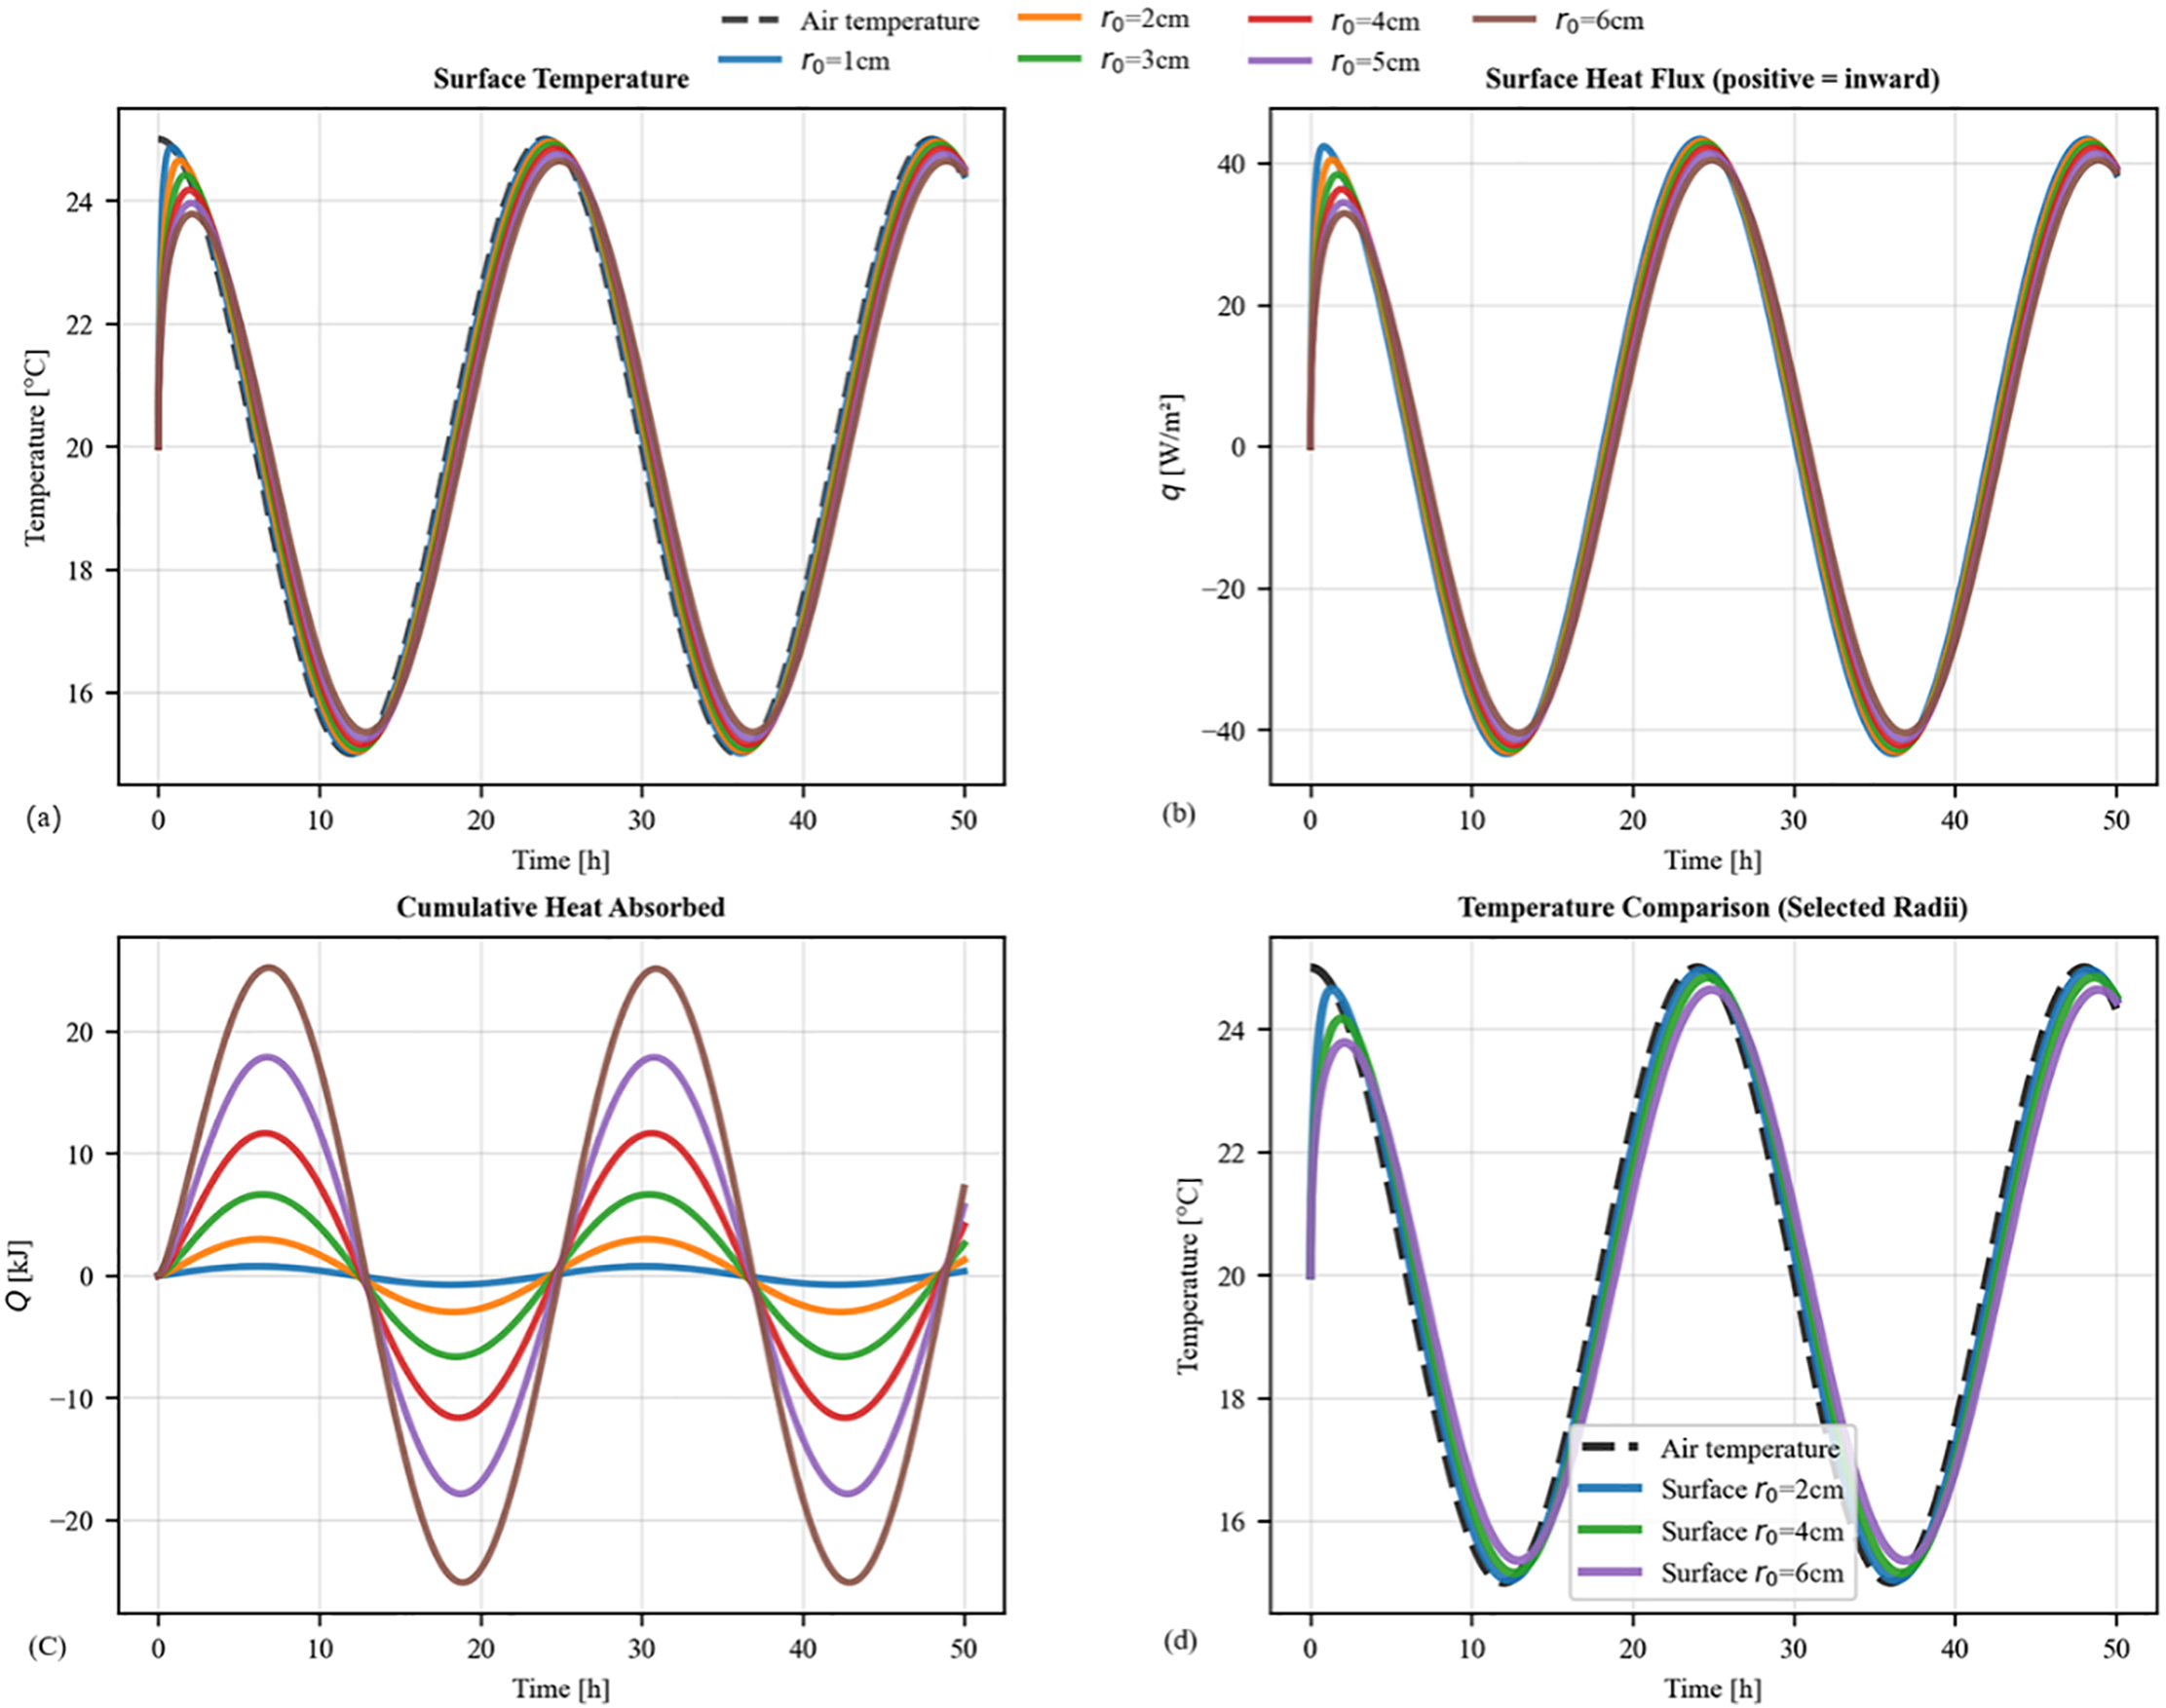
Figure 8: Influence of sphere radius (r0) on the periodic thermal response of plywood spheres. (a) Surface temperature of all spheres compared to the sinusoidal air temperature; (b) Corresponding surface heat flux; (c) Cumulative heat absorbed and released during each cycle; (d) Detailed temperature comparison for selected radii to highlight phase lag and damping
As shown in Fig. 8a, increasing the sphere’s radius enhances its thermal inertia, leading to significant amplitude dampening and time lag. For example, the largest sphere (r0 = 6 cm) exhibits a noticeable time lag, with its surface temperature peaking approximately 1 h after the ambient air. This stability directly impacts the heat flux (Fig. 8b). The peak heat flux density for the 6 cm sphere is approximately 32 W/m2, which is over 20% lower than the ~42 W/m2 peak observed for the 1 cm sphere. However, the most critical insight for energy storage is revealed in Fig. 8c. Despite a lower heat flux per unit area, the total amount of energy exchanged per cycle increases dramatically with the sphere’s radius. The amplitude of cumulative heat absorbed for the largest sphere (r0 = 6 cm) is approximately ±24 kJ. This is nearly seven times greater than the ±3.5 kJ exchanged by the smallest sphere (r0 = 1 cm). This outcome is governed by the geometric scaling of the sphere. The total heat flow is the product of the flux density (q) and the total surface area (A = 4πr02). While the peak flux density for the 6 cm sphere is over 20% lower than for the 1 cm sphere, its surface area is 36 times larger. The quadratic scaling of the surface area far outweighs the reduction in flux density, proving that larger plywood spheres possess a substantially greater capacity for dynamic heat storage.
3.3.2 Quantitative Comparison of Thermal Inertia: Decrement Factor and Time Lag
Fig. 9 provides a direct quantitative comparison of the dynamic thermal inertia of reinforced concrete and plywood. The analysis uses two key metrics, plotted as a function of sphere radius: the temperature decrement factor (Fig. 9a), which measures the damping of temperature swings, and the temperature peak time lag (Fig. 9b), which measures the phase lag of the thermal response.
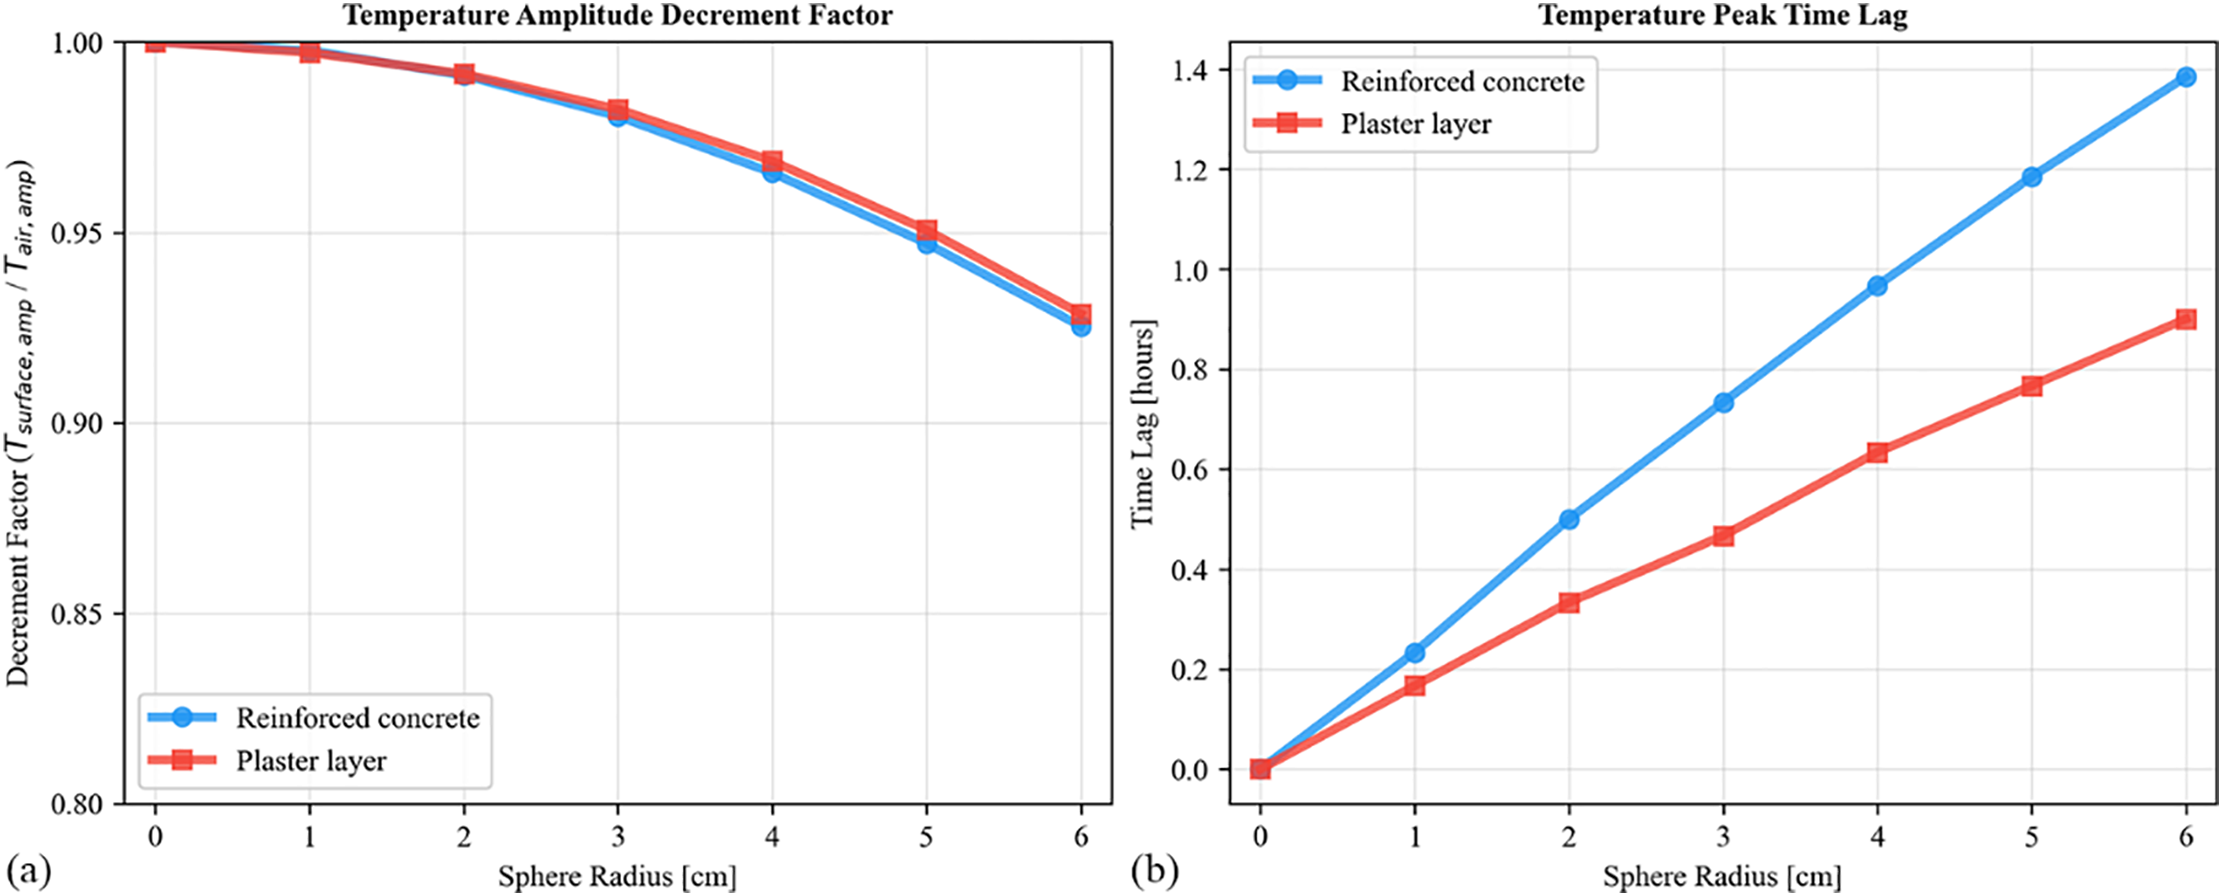
Figure 9: Comparison of dynamic thermal metrics for reinforced concrete and plaster layer spheres of varying radii: (a) Decrement factor, showing the reduction in temperature swing amplitude at the surface; (b) Time lag, showing the delay in the surface temperature response
In terms of decrement factor (Fig. 9a), both materials perform remarkably similarly. For both, the attenuation factor decreases with increasing radius, confirming that greater thermal mass enhances the ability to dampen temperature fluctuations. However, there is little difference between the two materials in their capacity to reduce the magnitude of the temperature swing. In stark contrast, Fig. 9b shows a significant divergence in their ability to delay the thermal wave. While the peak delay time increases linearly with radius for both materials, reinforced concrete induces a substantially longer time lag at any given size. This superior capability for shifting thermal loads is directly attributable to its lower thermal diffusivity (α). Thermal diffusivity governs the rate at which heat propagates through a material. Reinforced concrete’s combination of high density (ρ) and specific heat capacity (cp) results in a lower α value, meaning it takes longer for the thermal wave to penetrate. This makes it far more effective at delaying the impact of external temperature changes.
The proper use of internal thermal mass can reduce building energy consumption while meeting comfort requirements. A prerequisite for this is to accurately determine the temperature and heat transfer relationships between the thermal mass and the indoor air. For this purpose, this study developed and applied an analytical heat transfer model to investigate the dynamic thermal response of internal building thermal mass, simplified as a sphere. Through theoretical analysis, the temperature and heat transfer dynamics were obtained for three typical scenarios: a constant indoor temperature (simulating active air conditioning), an exponentially decaying temperature (simulating the period after air conditioning is turned off), and a periodic sinusoidal temperature (simulating natural ventilation). By analyzing the behavior of different materials (reinforced concrete and plywood/plaster) and sizes under these conditions, the following main conclusions are drawn:
(1) The Biot number, not just thermal conductivity, governs transient surface phenomena. Counter-intuitively, materials with high internal thermal resistance (high Bi), such as plywood, can exhibit a faster surface temperature rise and a higher initial surface heat flux than better conductors like reinforced concrete. This is because the internal resistance creates a steep temperature gradient at the surface, which can dominate the heat transfer process in the initial phase.
(2) The effect of size (radius) on thermal storage is twofold and dominated by geometry. Increasing the thermal mass radius enhances thermal inertia, leading to a more sluggish response per unit area (i.e., lower surface temperature peaks and reduced heat flux density). However, the total heat exchange capacity increases dramatically with size. The geometric scaling of the surface area (which increases with the square of the radius) far outweighs the reduction in flux density, making larger bodies substantially more effective as total heat sinks.
(3) A critical distinction exists between a material’s ability to dampen temperature swings and its ability to delay them. Decrement factor: The study showed that reinforced concrete and plywood are remarkably similar in their capacity to reduce the amplitude of surface temperature fluctuations. Time Lag: In stark contrast, reinforced concrete demonstrates a far superior capability to delay the thermal wave, inducing a significantly longer time lag than plywood at any given size.
(4) Thermal diffusivity (α) is the key property differentiating phase lag performance. The superior time-shifting capability of reinforced concrete is directly attributable to its lower thermal diffusivity. This property, combining the effects of conductivity, density, and specific heat, governs the propagation speed of a thermal wave through the material. Materials with low thermal diffusivity are therefore more effective for applications requiring the shifting of thermal loads, a key strategy in passive building design.
In summary, this work provides a detailed physical interpretation of how material properties and geometry dictate the dynamic heat storage performance of internal thermal mass. The derived analytical solutions serve as a valuable and efficient tool for optimizing the selection and sizing of thermal storage elements in buildings to achieve desired energy performance outcomes.
Acknowledgement: Not applicable.
Funding Statement: This work was supported by the Nanxu Scholars Program for Young Scholars of ZJWEU (RC2024021184).
Author Contributions: The authors confirm contribution to the paper as follows: investment, validation, writing—original draft, Liangjian Lei; conceptualization, supervision, resources, project administration, writing—review & editing, Yihang Lu. All authors reviewed the results and approved the final version of the manuscript.
Availability of Data and Materials: Not applicable.
Ethics Approval: Not applicable.
Conflicts of Interest: The authors declare no conflicts of interest to report regarding the present study.
References
1. Ji M, Yan G, Abed AM, Elattar S, Khadimallah MA, Jan A, et al. The effect of carbon dioxide emissions on the building energy efficiency. Fuel. 2022;326(2):124842. doi:10.1016/j.fuel.2022.124842. [Google Scholar] [CrossRef]
2. Sun Y, Yan C, Xing H. Can green buildings reduce carbon dioxide emissions? Energy. 2024;312(2):133613. doi:10.1016/j.energy.2024.133613. [Google Scholar] [CrossRef]
3. Ürge-Vorsatz D, Cabeza LF, Serrano S, Barreneche C, Petrichenko K. Heating and cooling energy trends and drivers in buildings. Renew Sustain Energy Rev. 2015;41(2):85–98. doi:10.1016/j.rser.2014.08.039. [Google Scholar] [CrossRef]
4. Navarro L, De Gracia A, Colclough S, Browne M, McCormack SJ, Griffiths P, et al. Thermal energy storage in building integrated thermal systems: a review. Part 1. Active storage systems. Renew Energy. 2016;88(1):526–47. doi:10.1016/j.renene.2015.11.040. [Google Scholar] [CrossRef]
5. Shafigh P, Asadi I, Binti Mahyuddin N. Concrete as a thermal mass material for building applications—a review. J Build Eng. 2018;19(5):14–25. doi:10.1016/j.jobe.2018.04.021. [Google Scholar] [CrossRef]
6. Li Y, Tao X, Zhang Y, Li W. Combining use of natural ventilation, external shading, cool roof and thermal mass to improve indoor thermal environment: field measurements and simulation study. J Build Eng. 2024;86(4):108904. doi:10.1016/j.jobe.2024.108904. [Google Scholar] [CrossRef]
7. Liu Y, Yan H, Lam JC. Thermal comfort and building energy consumption implications—a review. Appl Energy. 2014;115:164–73. doi:10.1016/j.apenergy.2013.10.062. [Google Scholar] [CrossRef]
8. Eugénio R, Fernandes MS, Gaspar AR, Gomes A, Costa JJ. Thermal transmittance effect on energy consumption of Mediterranean buildings with different thermal mass. Appl Energy. 2019;252(1):113437. doi:10.1016/j.apenergy.2019.113437. [Google Scholar] [CrossRef]
9. Marceau ML, Zmeureanu R. Nonintrusive load disaggregation computer program to estimate the energy consumption of major end uses in residential buildings. Energy Convers Manag. 2000;41(13):1389–403. doi:10.1016/S0196-8904(99)00173-9. [Google Scholar] [CrossRef]
10. Li H, Li Y, Wang Z, Shao S, Deng G, Xue H, et al. Integrated building envelope performance evaluation method towards nearly zero energy buildings based on operation data. Energy Build. 2022;268(2):112219. doi:10.1016/j.enbuild.2022.112219. [Google Scholar] [CrossRef]
11. Francesco L, Salvadori G, Bisegna F. Thermal resilience of buildings: the role of partition walls and slabs in the optimization of the building external envelope. Appl Therm Eng. 2024;257(9):124084. doi:10.1016/j.applthermaleng.2024.124084. [Google Scholar] [CrossRef]
12. Kuczyński T, Staszczuk A. Experimental study of the influence of thermal mass on thermal comfort and cooling energy demand in residential buildings. Energy. 2020;195(1):116984. doi:10.1016/j.energy.2020.116984. [Google Scholar] [CrossRef]
13. Hicham J, Heiselberg P. Influence of internal thermal mass on the indoor thermal dynamics and integration of phase change materials in furniture for building energy storage: a review. Renew Sustain Energy Rev. 2017;69(3):19–32. doi:10.1016/j.rser.2016.11.145. [Google Scholar] [CrossRef]
14. Li W, Xu P, Wang H, Lu X. A new method for calculating the thermal effects of irregular internal mass in buildings under demand response. Energy Build. 2016;130(41):761–72. doi:10.1016/j.enbuild.2016.08.057. [Google Scholar] [CrossRef]
15. Mao Y, Li Z, Zhang Y-P, He Y-L, Tao W. A review of mass-transfer models and mechanistic studies of semi-volatile organic compounds in indoor environments. Indoor Built Environ. 2018;27(10):1307–21. doi:10.1177/1420326X17704275. [Google Scholar] [CrossRef]
16. Balcomb JD. Passive solar heating research. In: Advances in solar energy: an annual review of research and development. Boston, MA, USA: Springer; 1982. Vol. 1. p. 265–304. doi:10.1016/0378-7788(84)90074-4. [Google Scholar] [CrossRef]
17. Kana H, Yao Y, Yao J. Numerical optimisation of thermal comfort improvement for indoor environment with occupants and furniture. Energy Build. 2015;88:303–15. doi:10.1016/j.enbuild.2014.12.015. [Google Scholar] [CrossRef]
18. Eirini M, Hopfe CJ, Cook MJ, Glass J, Strachan P. The modelling gap: quantifying the discrepancy in the representation of thermal mass in building simulation. Build Environ. 2018;131:74–98. doi:10.1016/j.buildenv.2017.12.017. [Google Scholar] [CrossRef]
19. Yousef Mousa WA, Lang W, Yousef WA. Simulations and quantitative data analytic interpretations of indoor-outdoor temperatures in a high thermal mass structure. J Build Eng. 2017;12:68–76. doi:10.1016/j.jobe.2017.05.007. [Google Scholar] [CrossRef]
20. Al-Homoud MS. Performance characteristics and practical applications of common building thermal insulation materials. Build Environ. 2005;40(3):353–66. doi:10.1016/j.buildenv.2004.05.013. [Google Scholar] [CrossRef]
21. Kang X, Yan D, Xie X, An J, Liu Z. Co-simulation of dynamic underground heat transfer with building energy modeling based on equivalent slab method. Energy Build. 2022;256(4):111728. doi:10.1016/j.enbuild.2021.111728. [Google Scholar] [CrossRef]
22. Chen G, Hou Y, Ge H, Zhang S, Liu X, Guo X, et al. Effect of thermal bridges on the energy performance of Chinese residential buildings. Energy Built Environ. 2025;6(3):545–54. doi:10.1016/j.enbuild.2016.08.057. [Google Scholar] [CrossRef]
23. Zeng C, Liu S, Shukla A. A review on the air-to-air heat and mass exchanger technologies for building applications. Renew Sustain Energy Rev. 2017;75:753–74. doi:10.1016/j.jobe.2020.101560. [Google Scholar] [CrossRef]
24. Döring B, Kendrick C, Lawson RM. Thermal capacity of composite floor slabs. Energy Build. 2013;67(1):531–9. doi:10.1016/j.enbuild.2013.08.038. [Google Scholar] [CrossRef]
25. Zhou J, Zhang G, Lin Y, Wang H. A new virtual sphere method for estimating the role of thermal mass in natural ventilated buildings. Energy Build. 2011;43(1):75–81. doi:10.1016/j.enbuild.2010.08.015. [Google Scholar] [CrossRef]
26. Li Y, Xu P. Thermal mass design in buildings-heavy or light? Int J Vent. 2006;5(1):143–50. doi:10.1080/14733315.2006.11683731. [Google Scholar] [CrossRef]
27. Lu Y, Hu J, Zhong K. An approximate parametric model for quantifying the thermal mass with harmonic variation of outdoor air temperature. J Build Eng. 2022;50(2):104195. doi:10.1016/j.jobe.2022.104195. [Google Scholar] [CrossRef]
28. Ma P, Wang L-S. Effective heat capacity of exterior Planar Thermal Mass (ePTM) subject to periodic heating and cooling. Energy Build. 2012;47(3):394–401. doi:10.1016/j.enbuild.2011.12.015. [Google Scholar] [CrossRef]
29. Ma P, Wang L-S. Effective heat capacity of interior planar thermal mass (iPTM) subject to periodic heating and cooling. Energy Build. 2012;47:44–52. doi:10.1016/j.enbuild.2011.11.020. [Google Scholar] [CrossRef]
30. Li W, Liu Y, Zhu J, Li R. A pre-processing method of internal thermal mass for building energy simulation software. J Build Perform Simul. 2021;14(3):328–42. doi:10.1080/19401493.2021.1917665. [Google Scholar] [CrossRef]
31. Georges L, Thalfeldt M, Skreiberg Ø, Fornari W. Validation of a transient zonal model to predict the detailed indoor thermal environment: case of electric radiators and wood stoves. Build Environ. 2019;149(10):169–81. doi:10.1016/j.buildenv.2018.12.020. [Google Scholar] [CrossRef]
32. Yang R, Yuan L, Zhang D, Wu T, Lu Y. Dynamic heat transfer mechanisms of internal thermal mass: effects of thermal conductivity and diffusivity under varied temperature conditions. Case Stud Therm Eng. 2025;65(1):105600. doi:10.1016/j.csite.2024.105600. [Google Scholar] [CrossRef]
33. Ma X, Luo Q, Yan F, Lei Y, Lu Y, Chen H, et al. Evaluating the microclimatic performance of elevated open spaces for outdoor thermal comfort in cold climate zones. Buildings. 2025;15(15):2777. doi:10.3390/buildings15152777. [Google Scholar] [CrossRef]
Cite This Article
 Copyright © 2025 The Author(s). Published by Tech Science Press.
This work is licensed under a Creative Commons Attribution 4.0 International License , which permits unrestricted use, distribution, and reproduction in any medium, provided the original work is properly cited.
 Downloads
 Citation Tools