
 Submit a Paper
 Propose a Special lssue
 Open Access
ARTICLE

Infrared Thermography Study of Thermal Footprints Generated by Ordinary and Extraordinary Respiratory Activities in Persons Wearing Face Masks
Dipartimento di Ingegneria Industriale e Scienze Matematiche, Università Politecnica delle Marche, via Brecce Bianche 12, Ancona, Italy
* Corresponding Author: Luca Giammichele. Email:
(This article belongs to the Special Issue: Heat and Mass Transfer Applications in Engineering and Biomedical Systems: New Developments)
Frontiers in Heat and Mass Transfer 2026, 24(1), 18 https://doi.org/10.32604/fhmt.2026.072535
Received 29 August 2025; Accepted 28 November 2025; Issue published 28 February 2026
 View Full Text
 Download PDF
Abstract
The airborne diffusion of saliva droplets during respiratory activities is one of the major factors in the spread of infections. During the COVID-19 pandemic, the use of protective face masks was essential to reduce the risk of infection and spread of SARS-CoV-2. The face mask is able to significantly reduce the saliva droplet emission in front of the person. However, the use of masks also produces a particle leakage towards the back of the person, which could increase the infection risk of people behind the subject. Most of the experimental investigations applied invasive and/or complex experimental techniques to evaluate the face masks leakage. The primary objective of this study is to develop a novel, non-invasive methodology for assessing rearward droplet emission associated with the use of protective face masks. Specifically, a thermographic analysis of the thermal footprint released during ordinary and extraordinary respiratory activities is presented, evaluating the maximum temperature, the detection time, and the spread area of the thermal footprint. Both surgical and FFP2 face masks were tested. Two different subjects were involved in the experimentation to evaluate the influence of face conformation. The findings indicate that the area influenced by droplet dispersion is larger when wearing a surgical mask compared to an FFP2 mask, with the highest recorded temperatures observed for the surgical mask. The thermal footprint was found to be strongly dependent on individual facial morphology and mask fit. Notably, the FFP2 mask also altered the position of the thermal footprint, which was primarily confined to the region near the neck.Keywords
During the global pandemic of 2020, the diffusion of COVID-19 disease has caused more than 700 million cases and 7 million deaths worldwide [1]. The transmission of respiratory disease is based on three kinds of mechanisms [2]: (i) direct or indirect contact with mucous, skin, or contaminated surfaces; (ii) large droplet emission transmitted to the nose or mouth of the receiver; (iii) aerosol transmission of smaller particles and droplet nuclei, which can remain suspended for a long time. The infected droplet can be expelled by breathing, speaking, coughing, and sneezing. Among these respiratory activities, coughing was the most studied since it is more intense than breathing and speaking and could occur more frequently than sneezing [3]. In order to limit the spread of the SARS-CoV-2 virus, the World Health Organization (WHO) recommended wearing face masks. This kind of protective strategy has played a fundamental role in the reduction of infection rate [4,5].
In recent years, researchers have intensively studied the fluid dynamics of droplet emission during human respiratory activities, with particular attention to the cough. The flow field of saliva droplets and the effectiveness of protective face masks were evaluated both numerically [6–11] and experimentally [12–19]. These works highlight that the use of protective face masks significantly reduces the saliva droplet emission in front of the person. However, the flow can be partially leaked through gaps at the edge of the masks if they do not fit correctly on the face of the individual. The leakages are concentrated upwards, downwards, and on the side of the mask and could be very dangerous since they are not filtered by the face mask [3]. Furthermore, it was seen that the larger saliva droplet leakage is on the side of the mask, and it is directed towards the back of the person. Rearward leakage can be dangerous as it increases the risk of infection in people positioned behind the subject. This condition can be particularly critical in theaters, cinemas, schools, and public transportation.
Most of the experimental works applied PIV (Particle Image Velocimetry) [12–14] or the Schlieren [15–17] techniques for the quantitative evaluation of saliva droplet distribution. Qualitative flow visualizations were also performed by means of a smoke tracer and a laser source [18,19]. However, PIV and Schlieren techniques require a quite complex experimental setup. Furthermore, the use of a pulsating laser source and a tracer (PIV) could be dangerous for the living subject. Infrared thermography could be a solution to overcome these issues. In literature, only a few studies applied this technique to address the effectiveness of protective face masks [20–24]. Some studies [20,21] investigate the thermal comfort induced by wearing a protective face mask. They used the face skin temperature, measured by infrared thermography, as a key parameter to evaluate the subject’s thermal comfort. Du et al. [22] evaluate the air permeation capability of three types of face masks by coupling infrared thermography and X-ray tomographic imaging techniques. A warmer region in the infrared image was associated with high air filtration, while a colder zone was associated with low air filtration. The filtration performance of different types of face masks was also studied by Fragoso-Mandujano et al. [23]. In this study, infrared thermography was used to detect the temperature distribution induced on a screen placed in front of the test subject while breathing. Koroteeva and Shagiyanova [24] study the effect of wearing surgical, cloth, and N95 face masks on the exhaled airflow near a human face while coughing, talking, or breathing. A mid-wave infrared camera was adopted to measure the thermal distribution induced by the carbon dioxide concentration increase during exhalation.
This paper presents a novel non-invasive method to evaluate the saliva droplet leakage towards the back of a subject wearing a face mask while breathing and coughing. The proposed method adopts infrared thermography to measure the thermal footprint released by the saliva droplet on a screen placed behind the subject. Indeed, during exhalation, the particle cloud exits at a higher temperature than the screen, which was kept at
The paper is organized as follows. Section 2 describes the experimental apparatus, the image post-processing, and the test procedure. Section 3 presents the results of the experimental measurements. Finally, the conclusions are reported in Section 4.
Two types of protective face masks were tested, namely surgical and FFP2 masks. The face masks were worn by two subjects, one male (subject 1) and one female (subject 2), in order to verify the influence of face conformation on the saliva droplet thermal footprint. The two subjects have an age ranging between 25 and 35 years. The male subject has a beard, which would influence the saliva droplet leakage. The male subject also presents a better fit of the masks on the face. Informed consent was obtained prior to performing the measurement, including permission for publication of the images. The study was conducted in accordance with the Declaration of Helsinki. The subjects were seated on a chair placed at a distance of 10 cm from a black fabric screen located behind them. Each subject was required to perform two deep breaths followed by two coughs as a standard sequence for all the tests. During this sequence, the thermal footprint behind the subject was measured by infrared thermography. The quantitative analysis of the thermal footprint was performed excluding the emission zone near the subject’s neck. This decision reflects the consideration that emissions at head height are more relevant for infection risk than those near the neck. The tests were performed in an air-conditioned environment with the ambient temperature set to
The thermal camera adopted is the Flir A655sc. It is a long-wave bolometric thermal camera (wavelength ranging between 7.5 and 14 μm), with a NEDT (Noise Equivalent Differential Temperature) equal to 30 mK and a resolution of 640
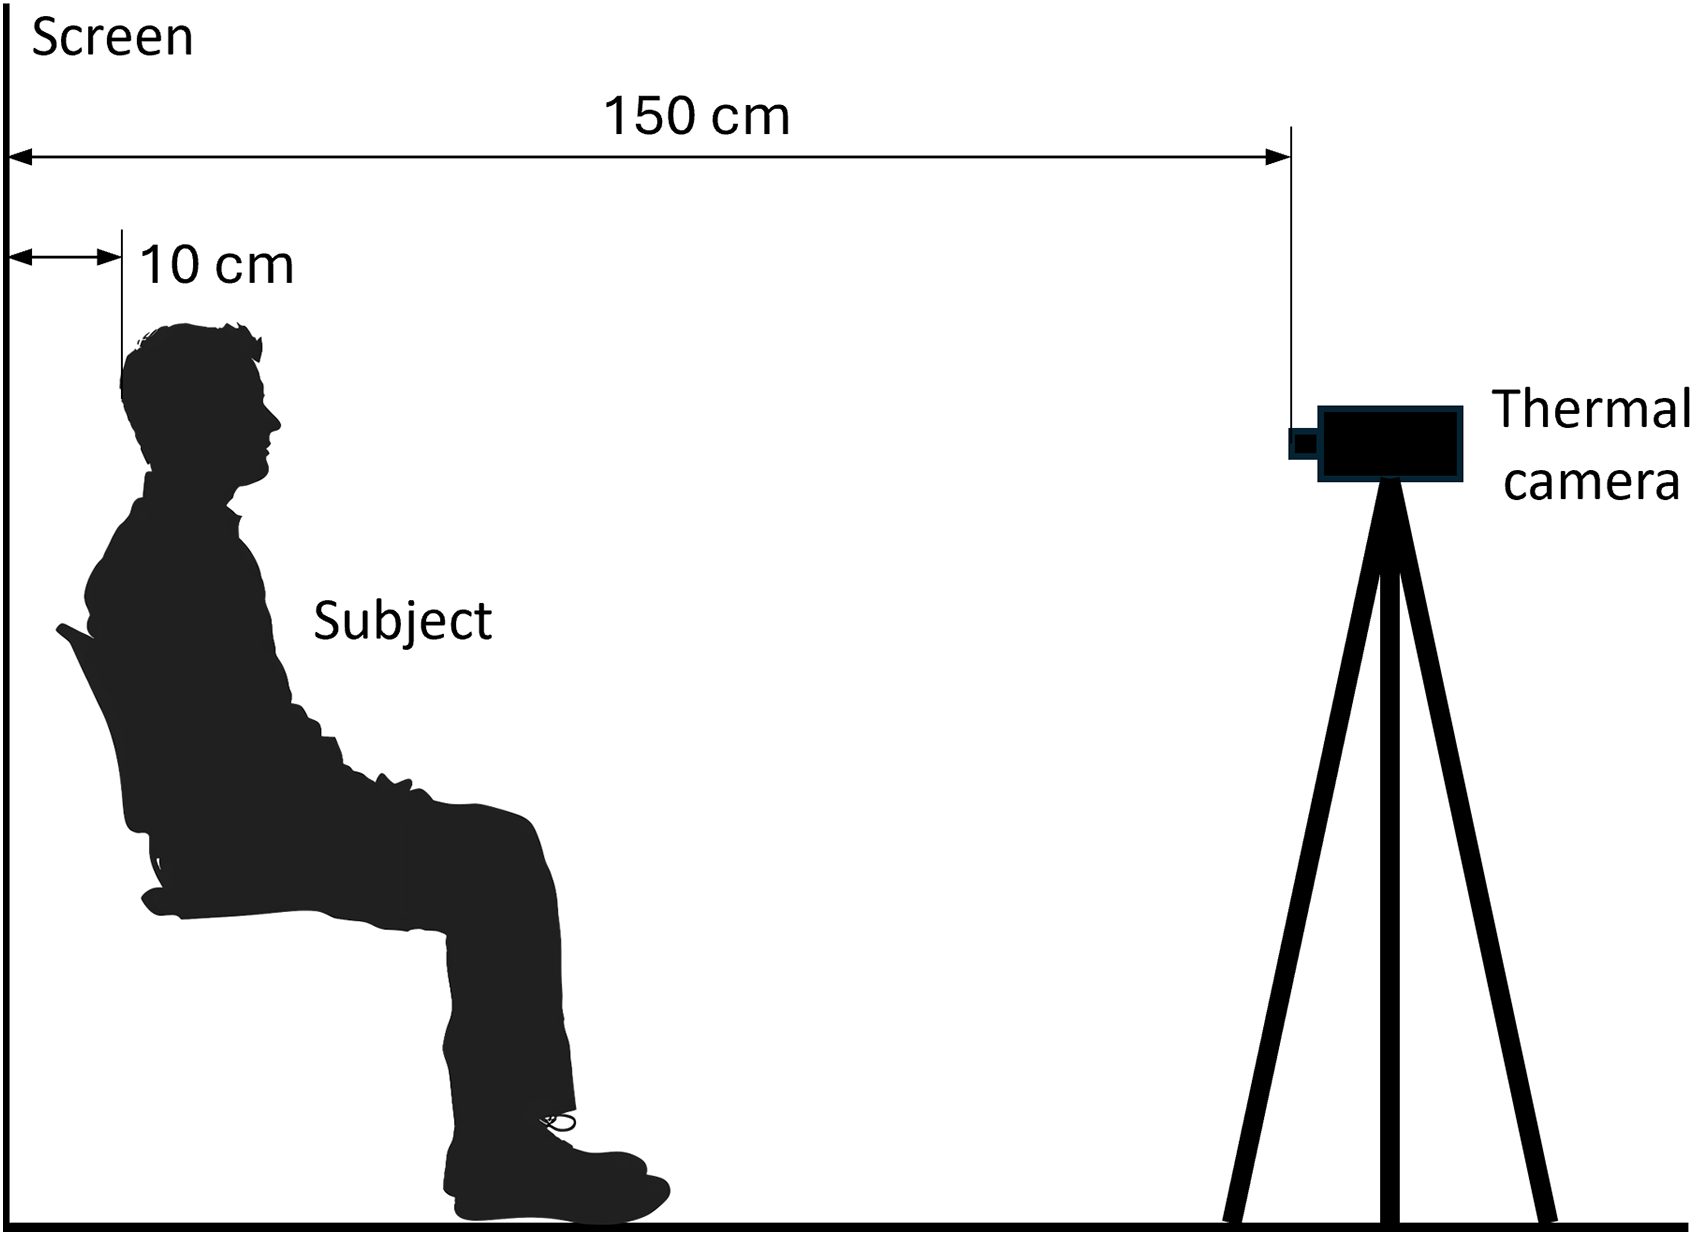
Figure 1: Schematic diagram of the experimental setup.
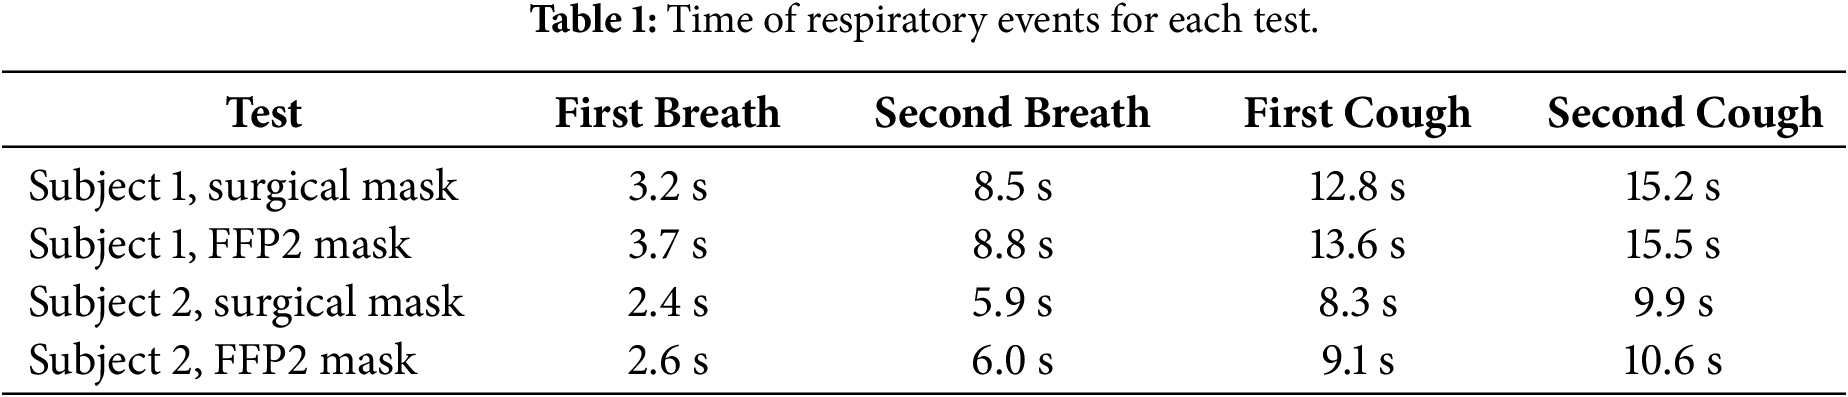
The thermographic images were acquired at 6 Hz for the duration of the test. This frequency is suitable for the analysis, as respiratory and coughing phenomena evolve at speeds compatible with a 6 Hz sampling rate, ensuring that no relevant information is lost during acquisition. Then, a reference frame of the acquisition was subtracted from each image acquired. The subtraction allows to better highlight the thermal footprint since the temperature increase due to the saliva droplets is very low. In order to clearly individuate the reference frames, the mean temperature measured on the face mask was analyzed for each test. Fig. 2 shows the mean temperature measured for subject 1 wearing the surgical mask. It is worth noting that in this case, the first frame was taken as a reference for the subtraction. The points just before each temperature increase were associated with the breaths and coughs, as highlighted by the dashed lines in Fig. 2. Table 1 summarizes the times of breaths and coughs for each test. Hereinafter, the frame corresponding to the time of the first cough was taken as the reference frame for the image subtraction.
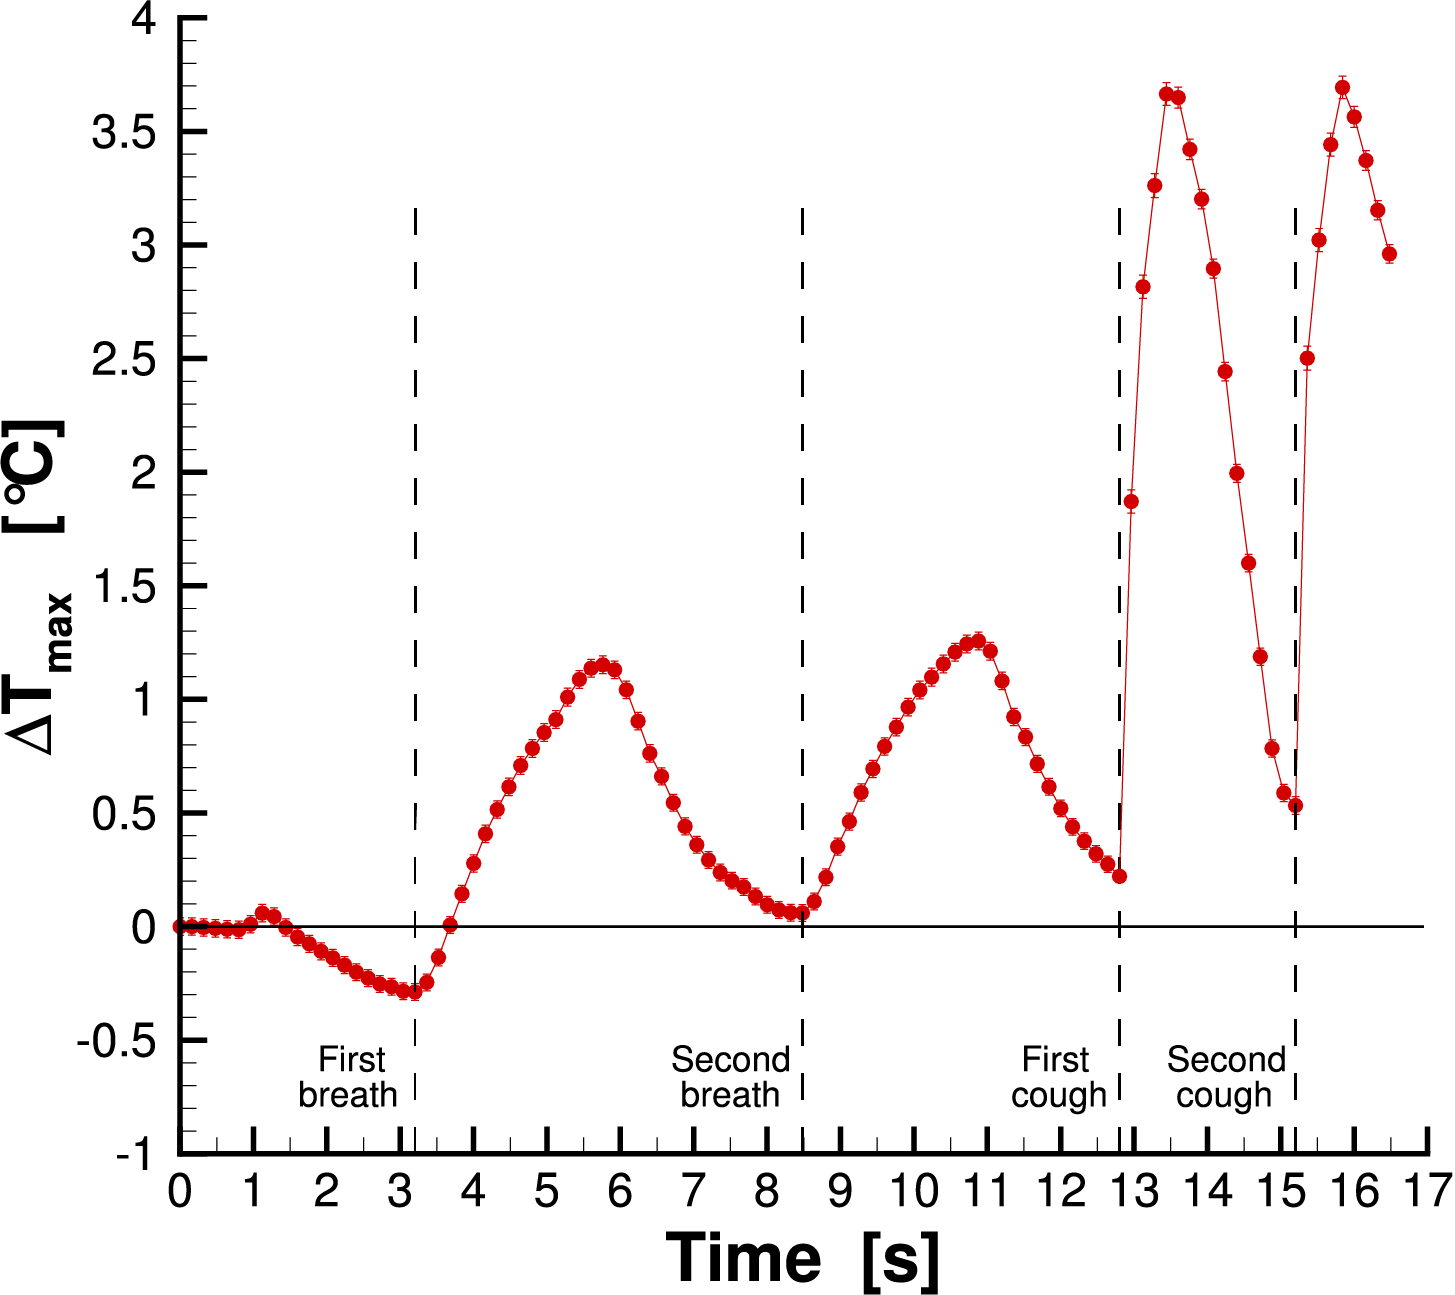
Figure 2: Mean temperature measured on the mask for subject 1 wearing the surgical mask.
Finally, a window average filter, with an extension of 5
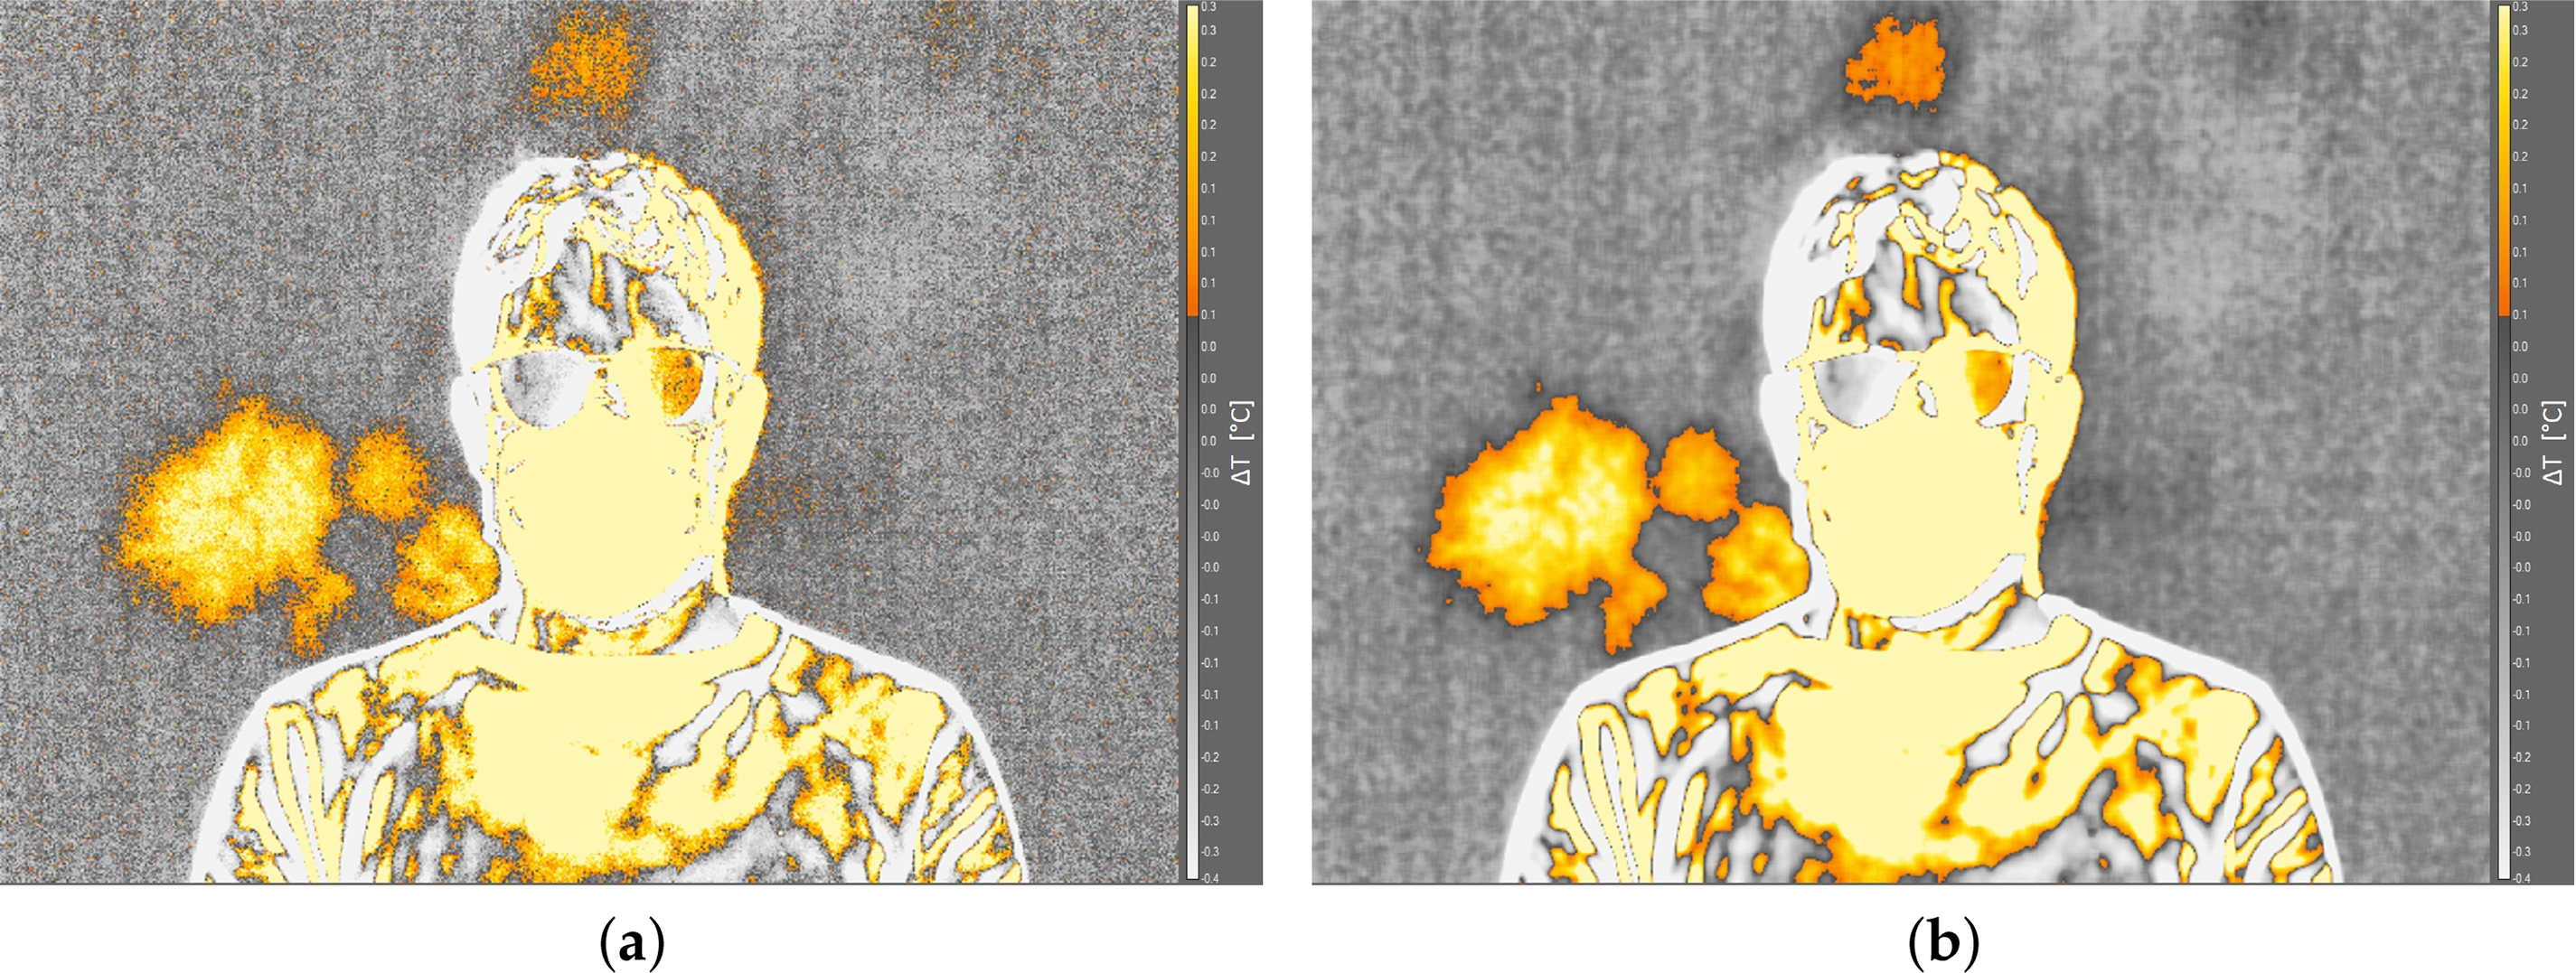
Figure 3: Effect of the window average filter applied to a frame: (a) filter off; (b) filter on.
Two preliminary tests were performed in order to optimize the detection of the thermal footprint. First, the necessity to use the screen behind subjects was evaluated. The screen is made of a black fabric with emissivity equal to 0.9. Fig. 4 shows the thermal images captured with and without the screen. The thermal footprint was not detectable in the case without the screen; otherwise, the saliva droplet diffusion is visible when adopting the screen. It is worth noting that ambient temperature, distance of the subject from the screen, and the sequence of breaths and coughs were the same for the two images acquired.
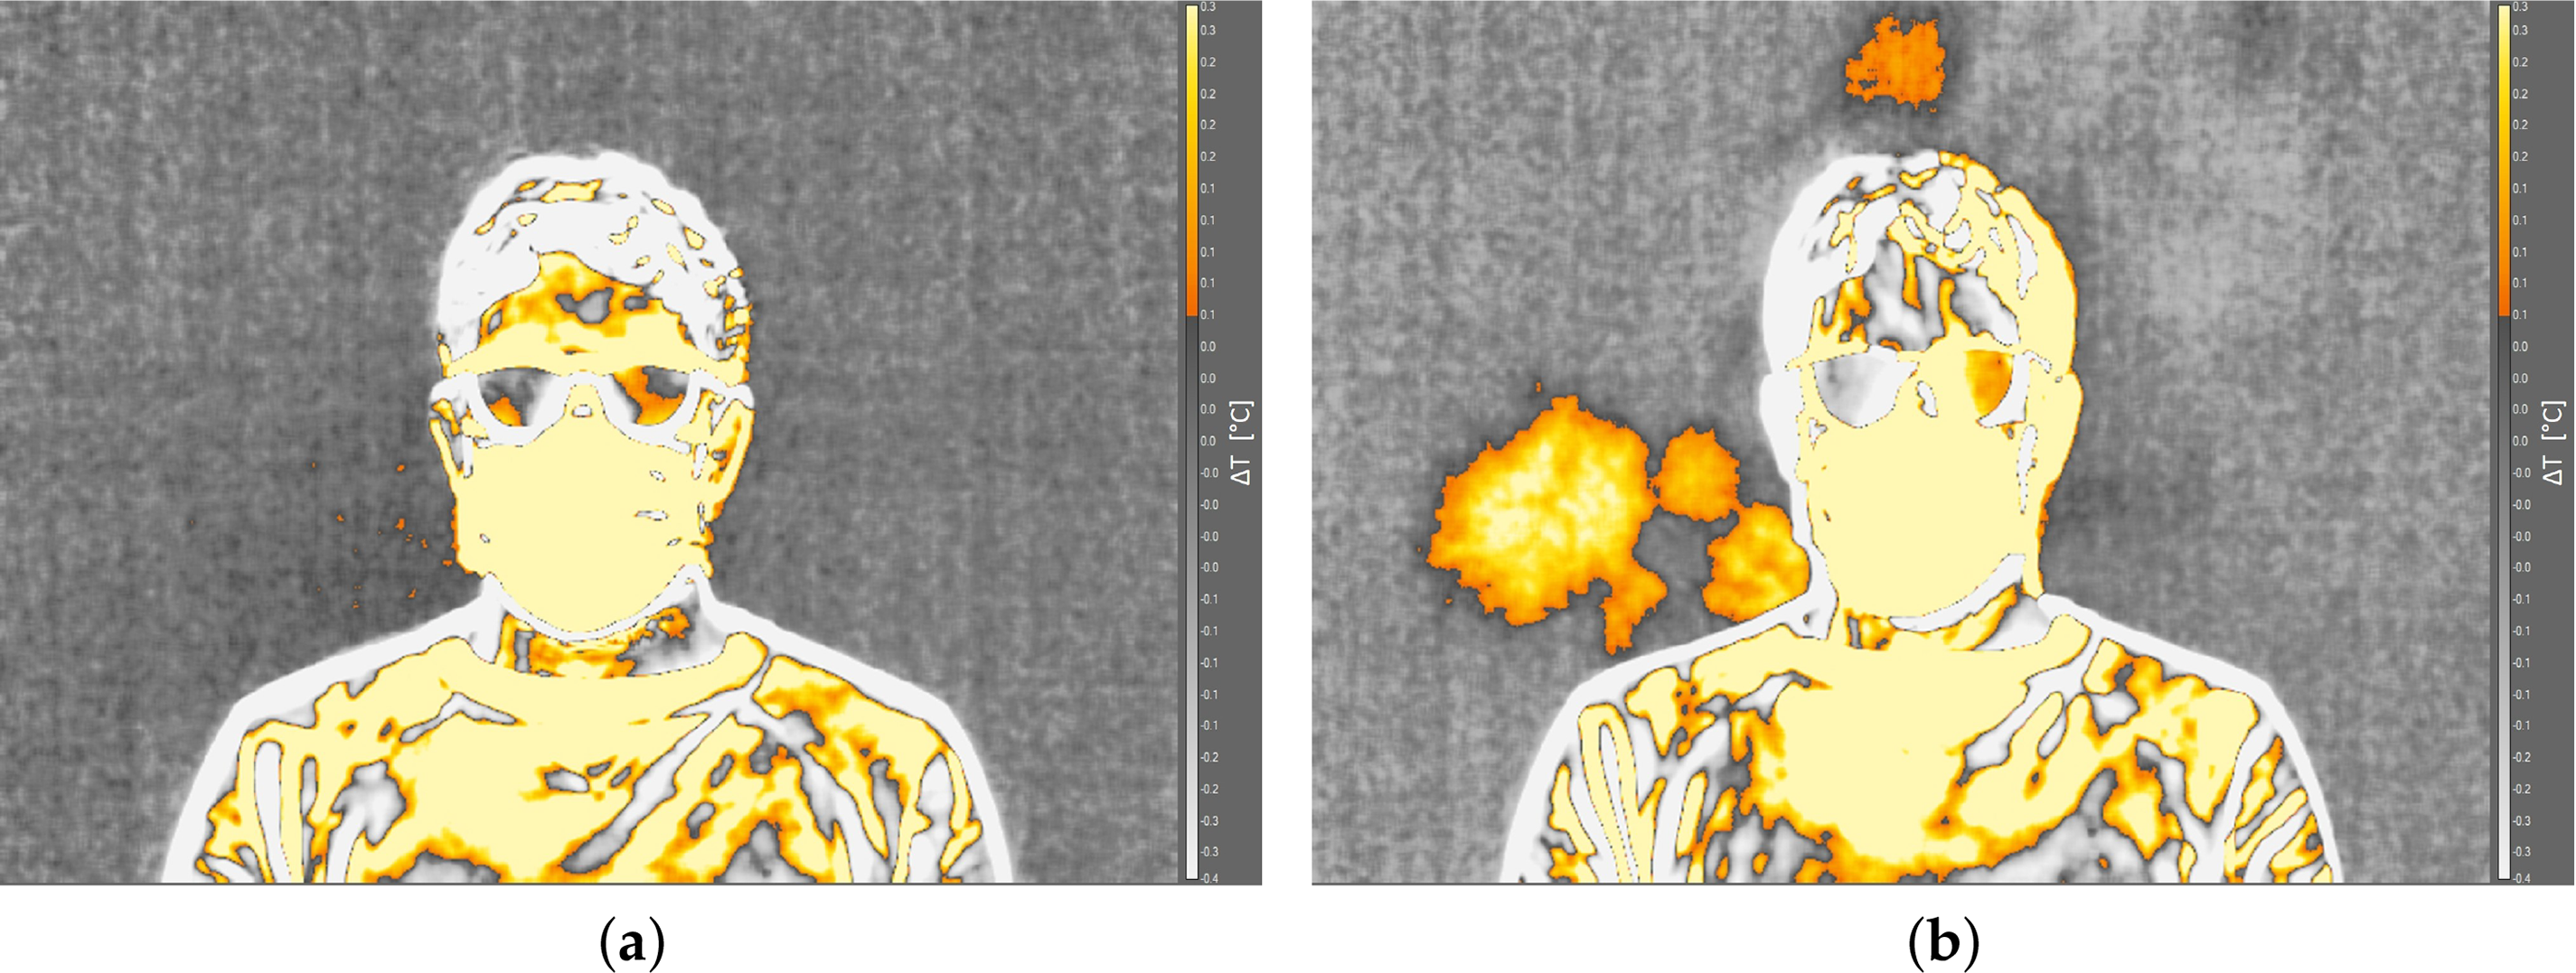
Figure 4: Effect of the screen behind the subject: (a) without screen; (b) with screen.
The second test deals with the distance from the screen. Fig. 5 shows two infrared images with the subject placed at a distance from the screen of 10 cm (Fig. 5a) and 40 cm (Fig. 5b). The first detectable thermal footprint for both cases was represented in the figure. The thermal footprint is detectable for both of the two distances. However, in the case of higher distance from the screen, the thermal footprint has lower intensity. Furthermore, there is a higher delay between the cough and the thermal footprint detection. Indeed, Fig. 5a refers to the fourth frame after the first cough, which corresponds to a delay of about 0.5 s. Otherwise, Fig. 5b refers to the thirtieth frame after the first cough, which corresponds to a delay of about 4.8 s. For this reason it was decided to place the subjects at a distance of 10 cm from the screen, which allows a clear and easy detection of the thermal footprint. A shorter distance was considered inappropriate, as the subject’s presence could alter the temperature distribution on the screen or even result in accidental contact during a coughing event.
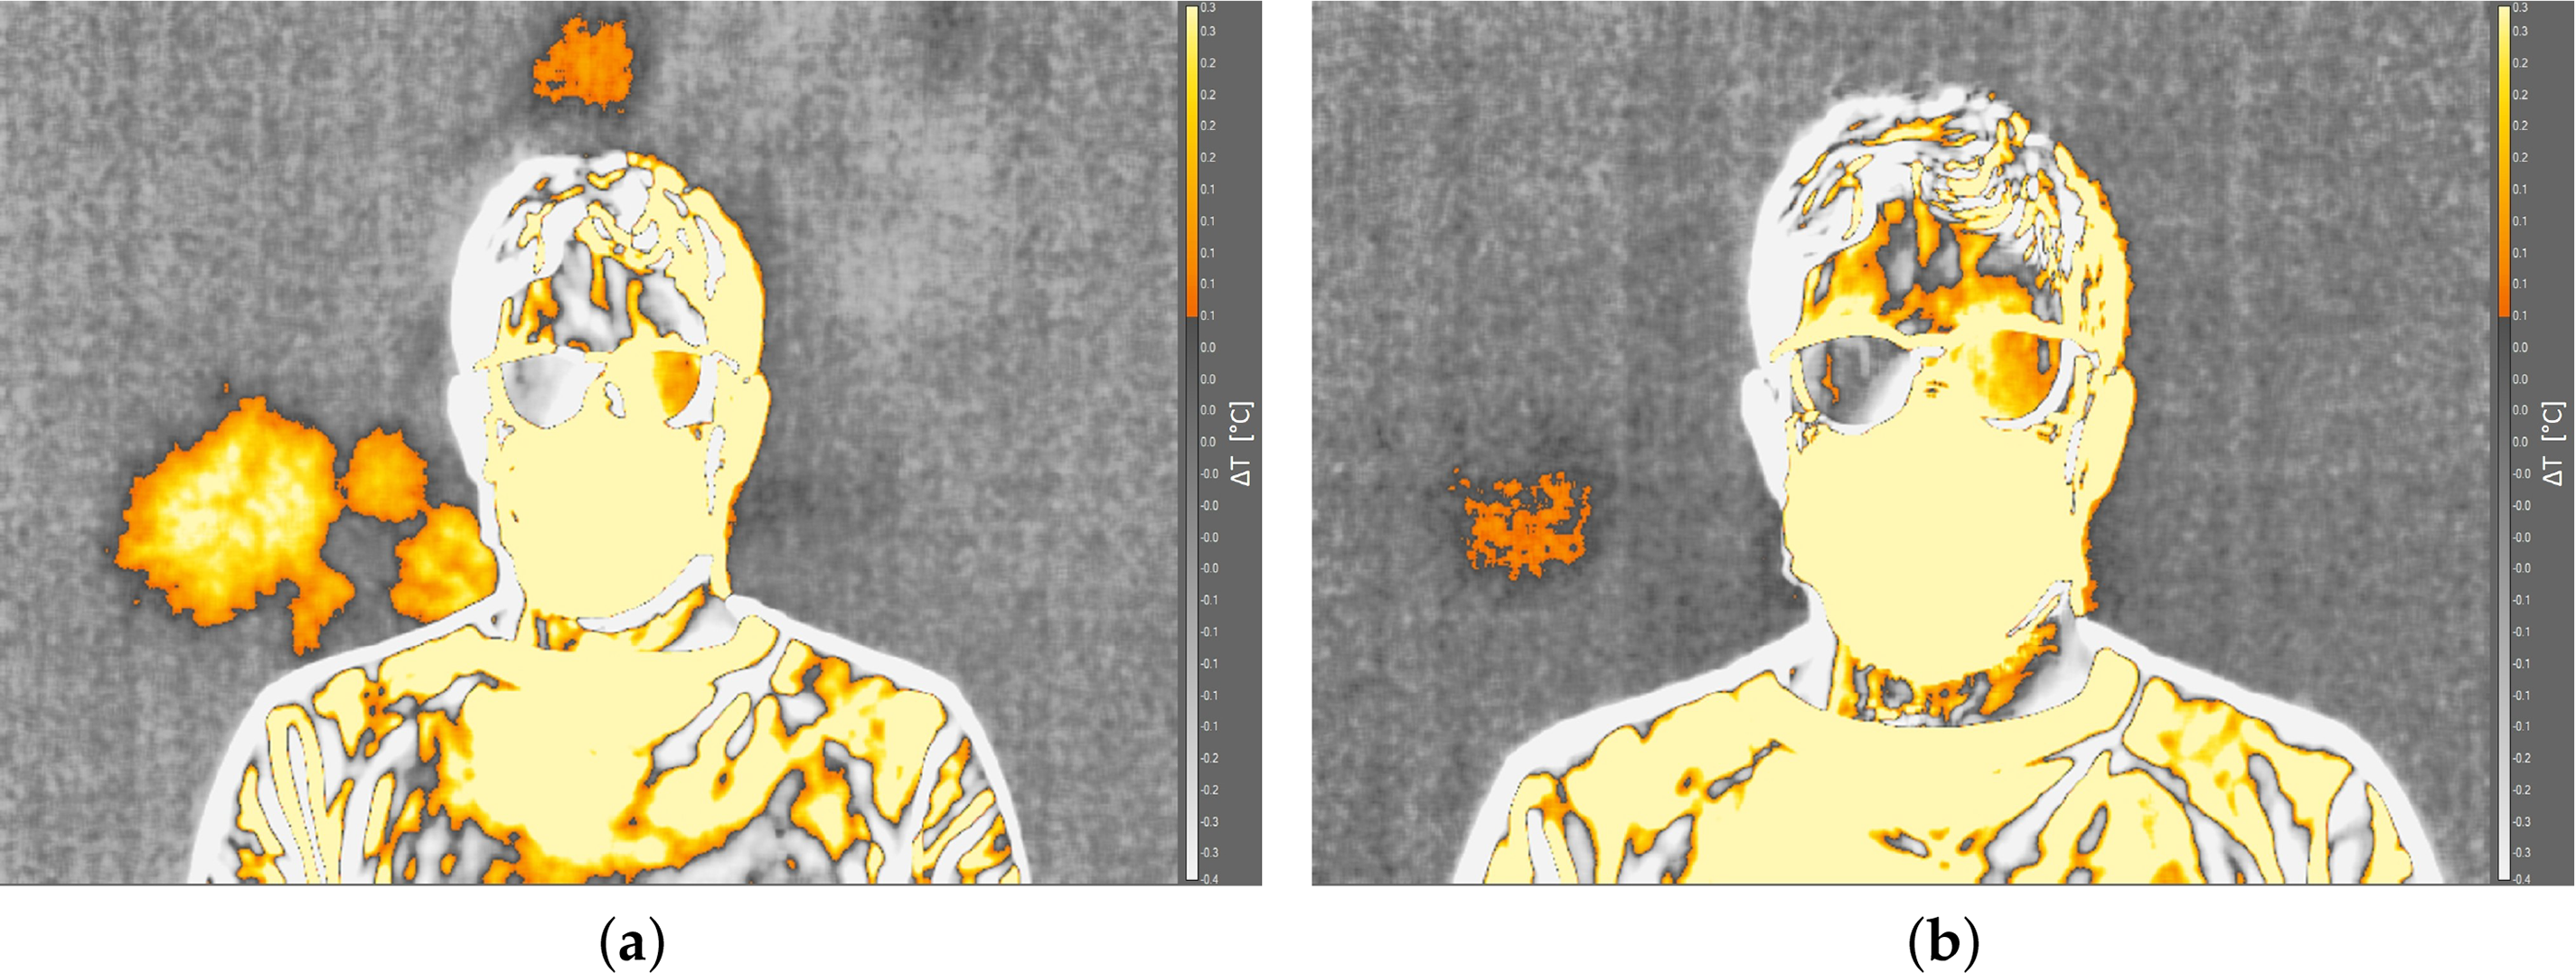
Figure 5: Effect of the distance between the subject and the screen: (a) 10 cm; (b) 40 cm.
The analysis of experimental results was performed both from a qualitative and quantitative point of view. The infrared images allow to immediately detect the spread of the thermal footprint behind the subjects. From a first qualitative analysis of the infrared images, it was also possible to define the area interested by the saliva droplets, highlighted by the green lines in Fig. 6. The area was selected for the surgical mask tests and maintained the same for the tests with the FFP2 mask. In this way, it was possible to perform a quantitative comparison of the results. In particular, the time histories of maximum and mean temperatures inside these areas were calculated to analyze the experimental results. The maximum temperature value is related to the intensity of the thermal footprint, which corresponds to the amount of saliva droplet emission behind the subject: a higher maximum temperature means a more intense thermal footprint. The mean temperature deals with the spread of the thermal footprint: a higher mean temperature in the same area is related to a larger zone interested by the saliva droplets. Both parameters were employed to quantify the magnitude of leakage behind the subjects associated with mask use and, consequently, the potential infection risk to other individuals. Furthermore, the time interval between the cough event and the first peak in the time history of the maximum temperature difference was analyzed. This parameter provides an estimate of the droplet arrival time on the screen.
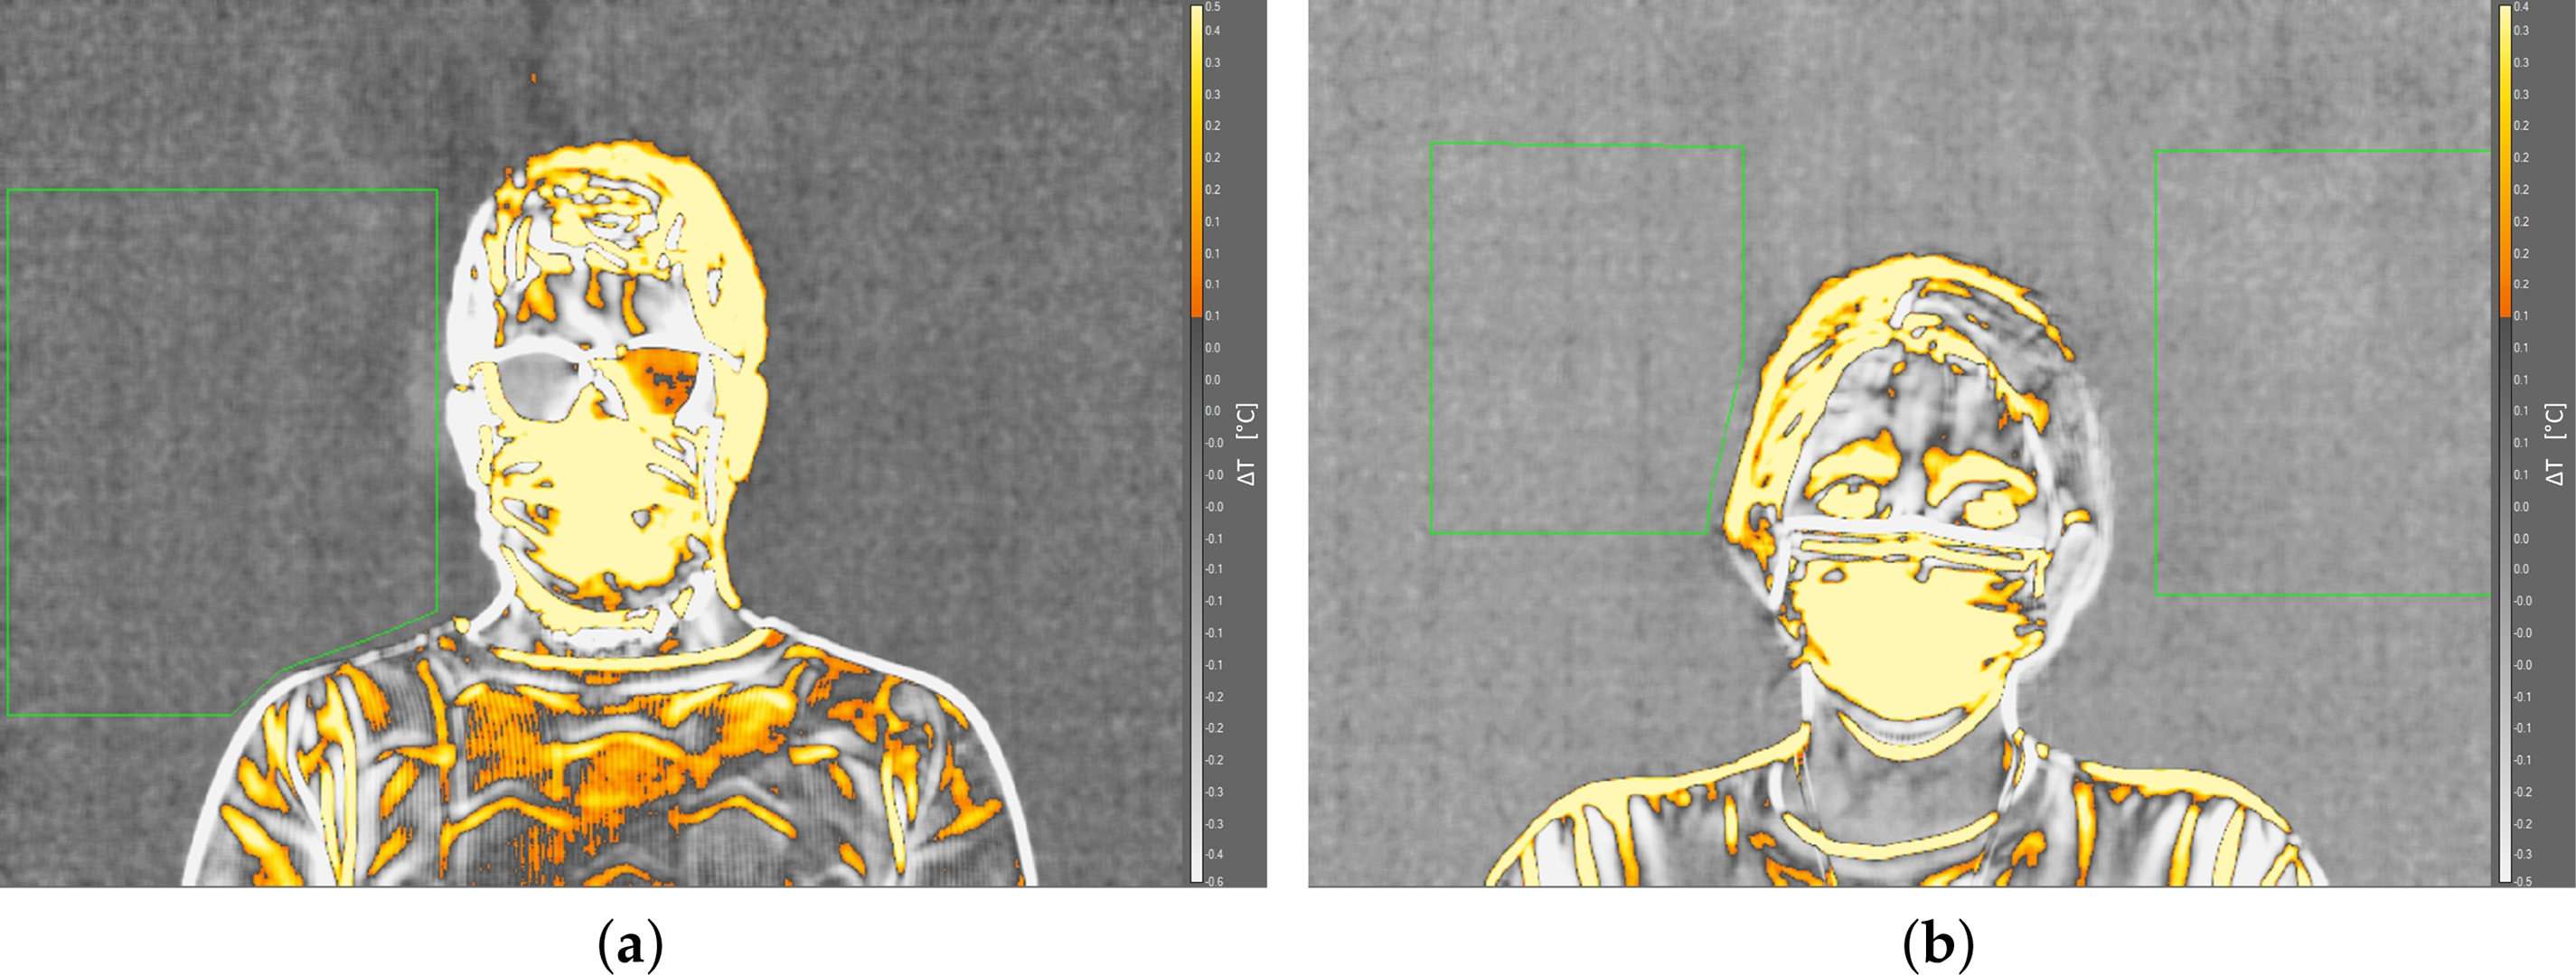
Figure 6: Area of analysis: (a) subject 1; (b) subject 2.
Fig. 7 shows the time history of the maximum temperature inside the area of analysis of subject 1 wearing the surgical mask. The dashed lines represent the time of each respiratory event, as reported in Table 1.
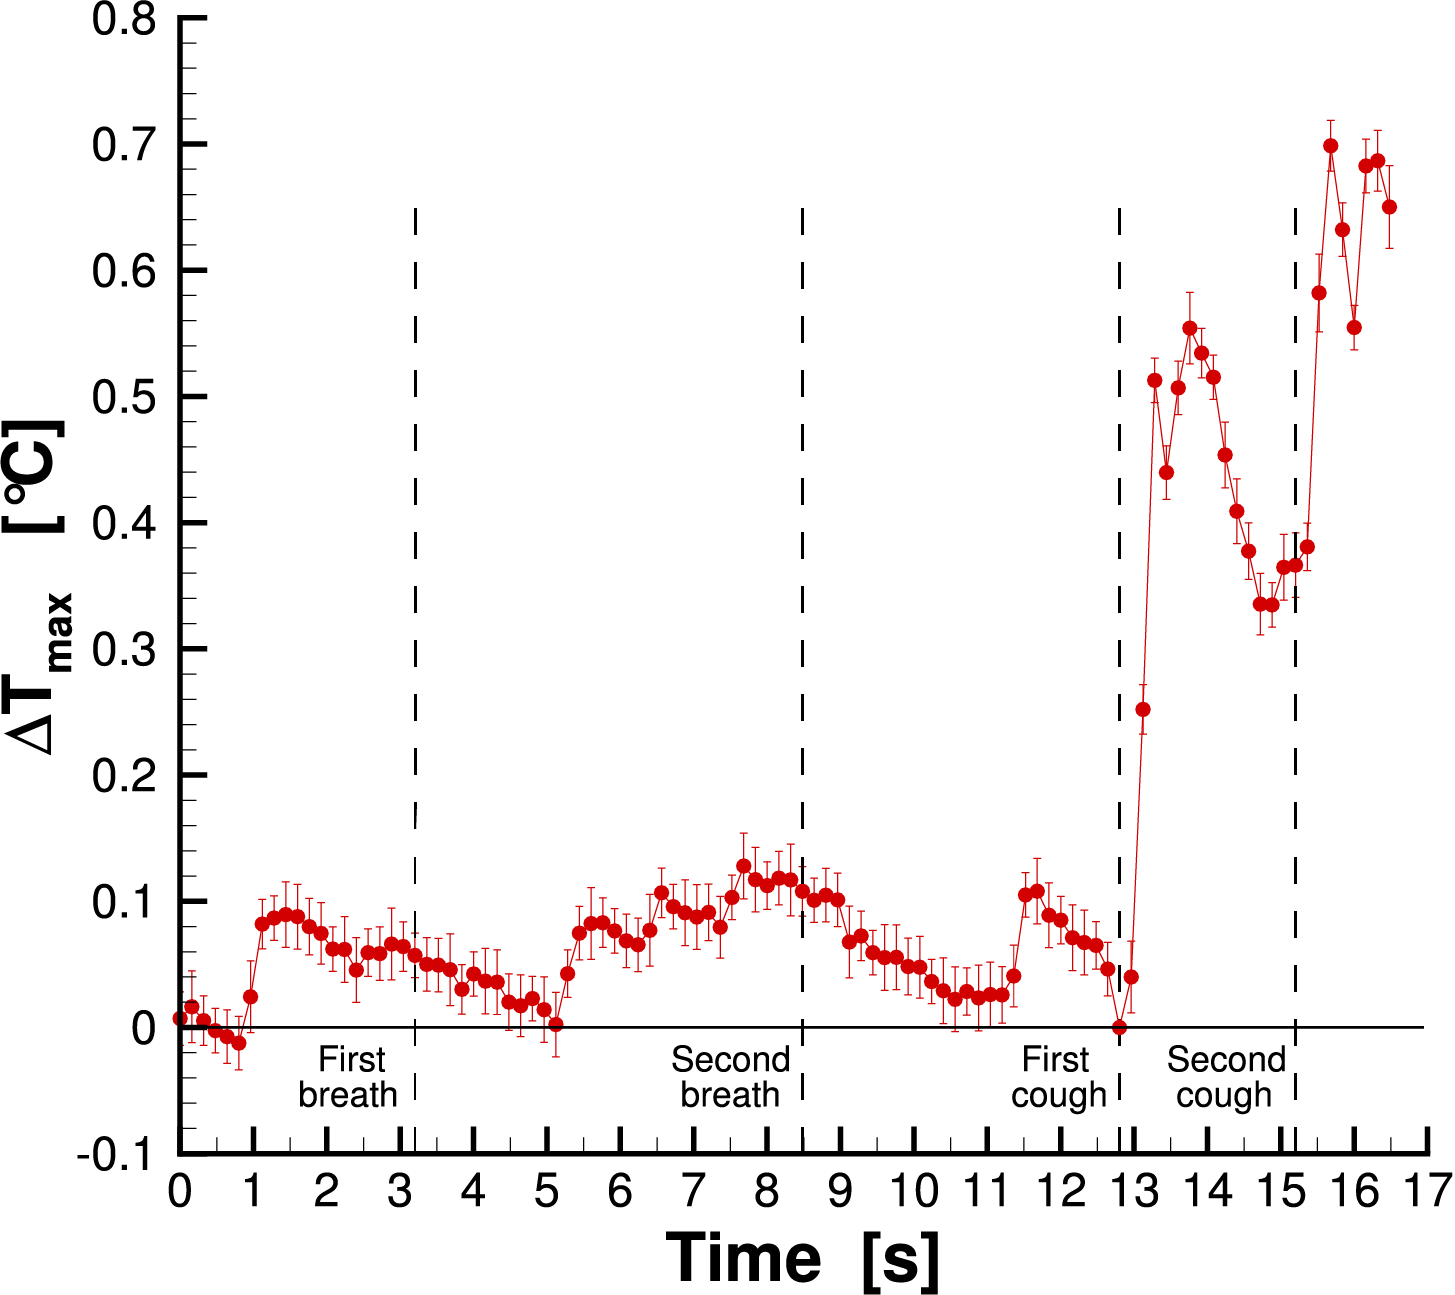
Figure 7: Maximum temperature measured for subject 1 wearing the surgical mask.
It is easy to note that the effect of the breaths was not detected since there is not a clear temperature peak in the plot. Otherwise, after the two coughs, it is possible to detect a sharp increase in the temperature. In particular, the maximum temperature plot exhibits a rapid increase after each cough, due to the saliva droplet thermal footprint, which ends in a maximum value and in a subsequent temperature decrease due to the thermal dissipation of the screen. The same result was found for the other tests. For this reason, only the zone after the first cough was reported in the following. Figs. 8 and 9 show the infrared images for cases of surgical and FFP2 masks, respectively. The times of breathing and coughing are reported in Table 1.
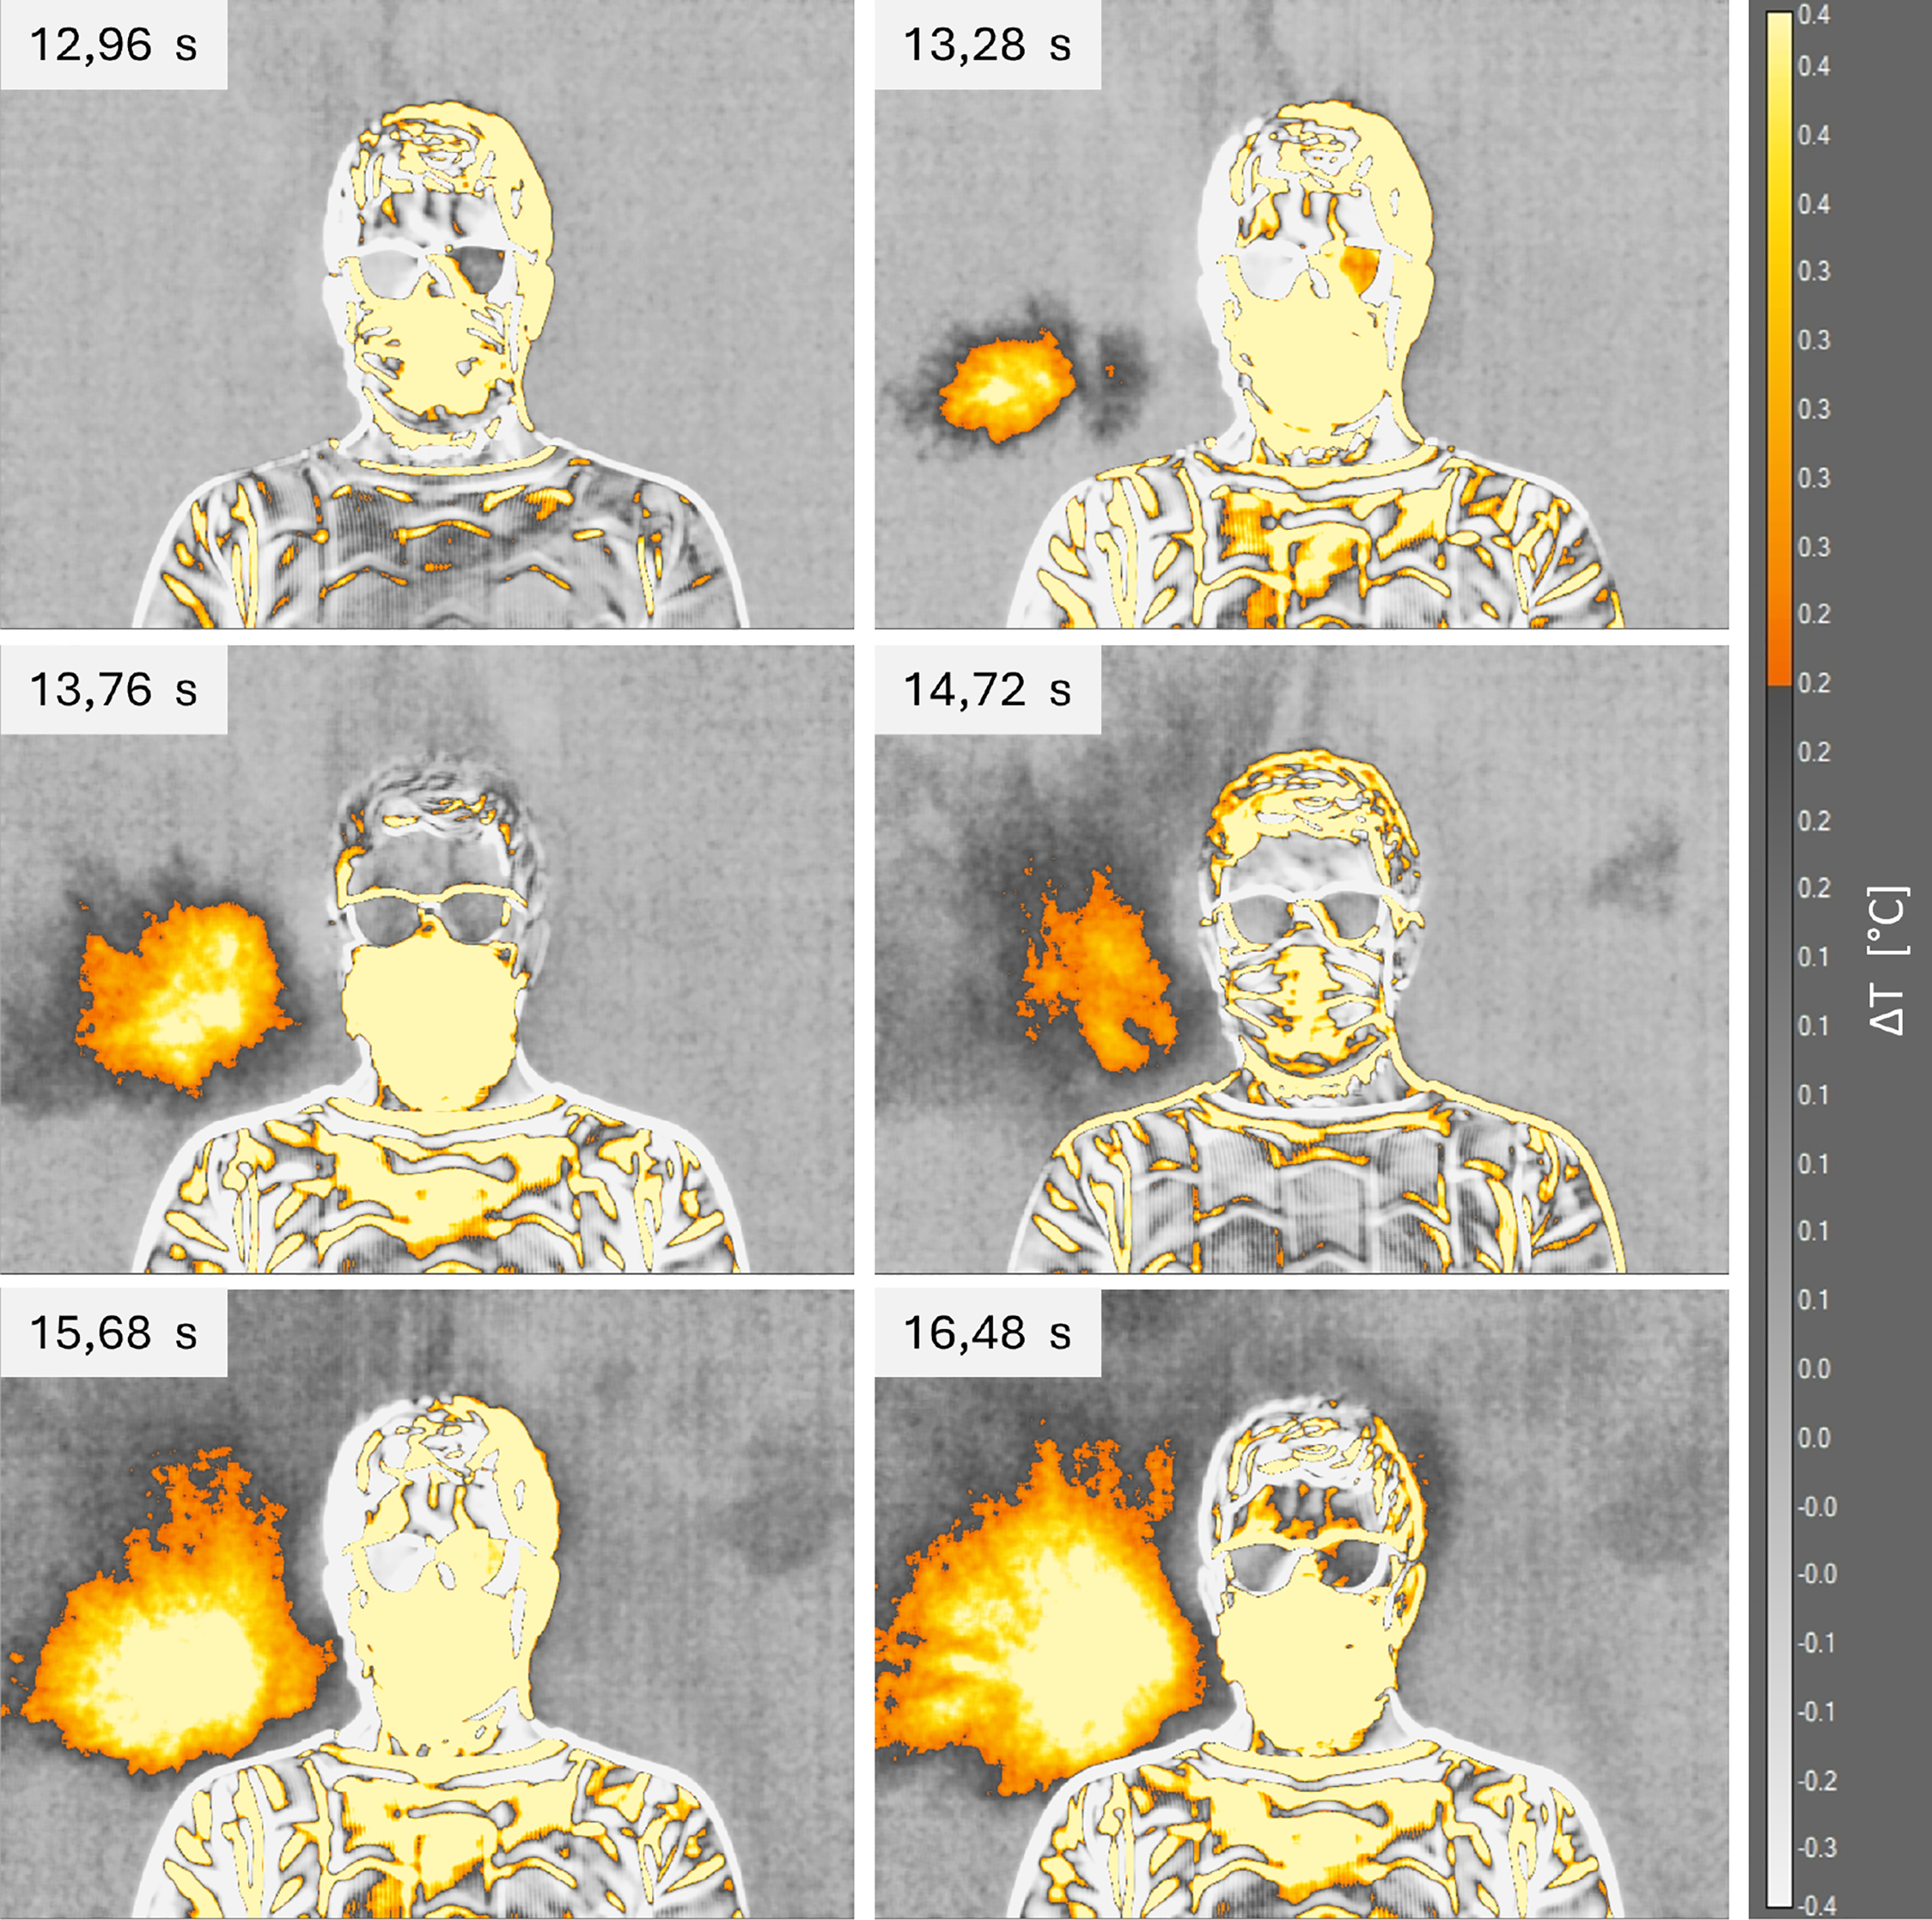
Figure 8: Infrared images of thermal footprint for subject 1 wearing the surgical mask.
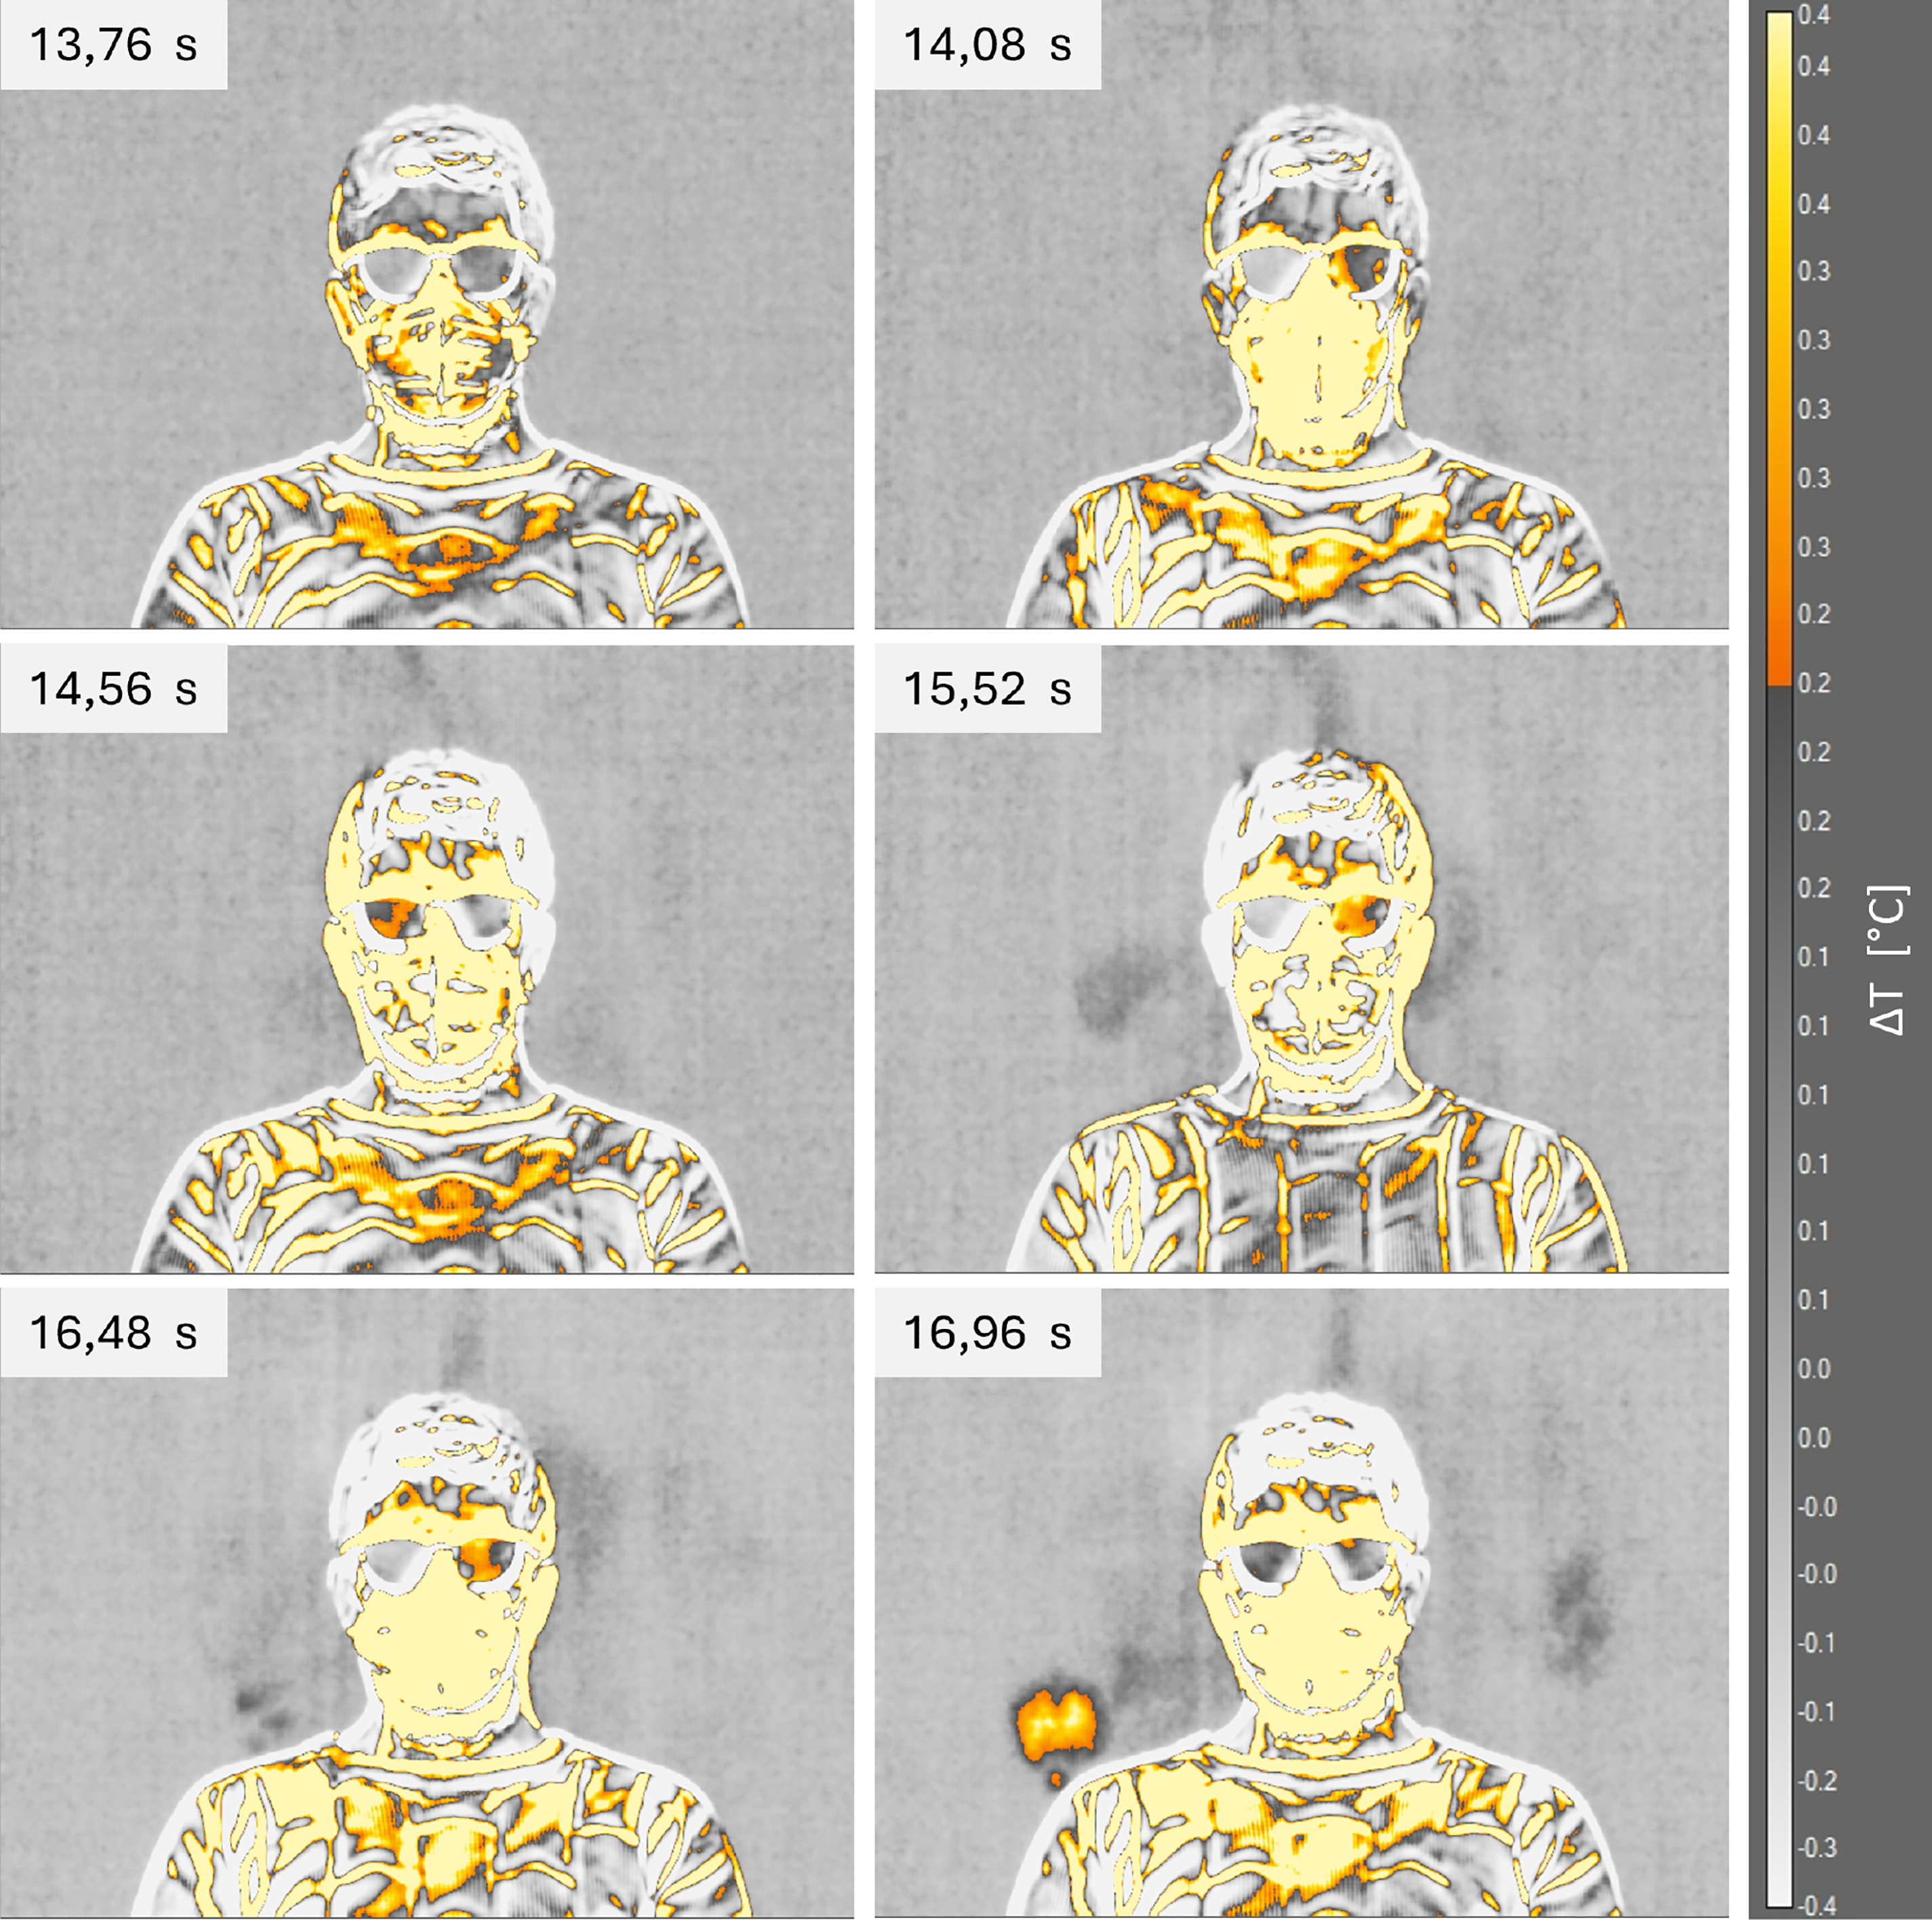
Figure 9: Infrared images of thermal footprint for subject 1 wearing the FFP2 mask.
For compactness, only 6 frames were reported in the figures, which correspond to some relevant points of the maximum temperature time history: the frame subsequent to the first cough, the first visible thermal footprint, the first maximum value, the subsequent minimum value, the second maximum, and the last frame. Since the FFP2 mask case does show the behavior highlighted in Fig. 7, the thermographic images shown in Fig. 9 were selected as follows: it was calculated the time difference between each relevant point and the first cough of the surgical mask case; then, the FFP2 images were selected at the same time difference by the first cough for this case. The images immediately highlight a different behavior between the two face masks. For the surgical mask, the thermal footprint is clearly detectable, and the zone of interest is significantly larger than that of the FFP2 mask. Using the FFP2 mask, the emission of saliva droplets was almost eliminated, with only a small emission after the second cough near the subject’s shoulder. It is also interesting to note that the first subject exhibits an emission of saliva droplets mainly in the left zone.
Fig. 10 shows the time history of the maximum and mean temperature in the reference area (Fig. 6a) for both the face masks tested. The dashed lines indicate the time of coughs for the surgical mask, while the dash-dot lines indicate the time of coughs for the FFP2 mask.
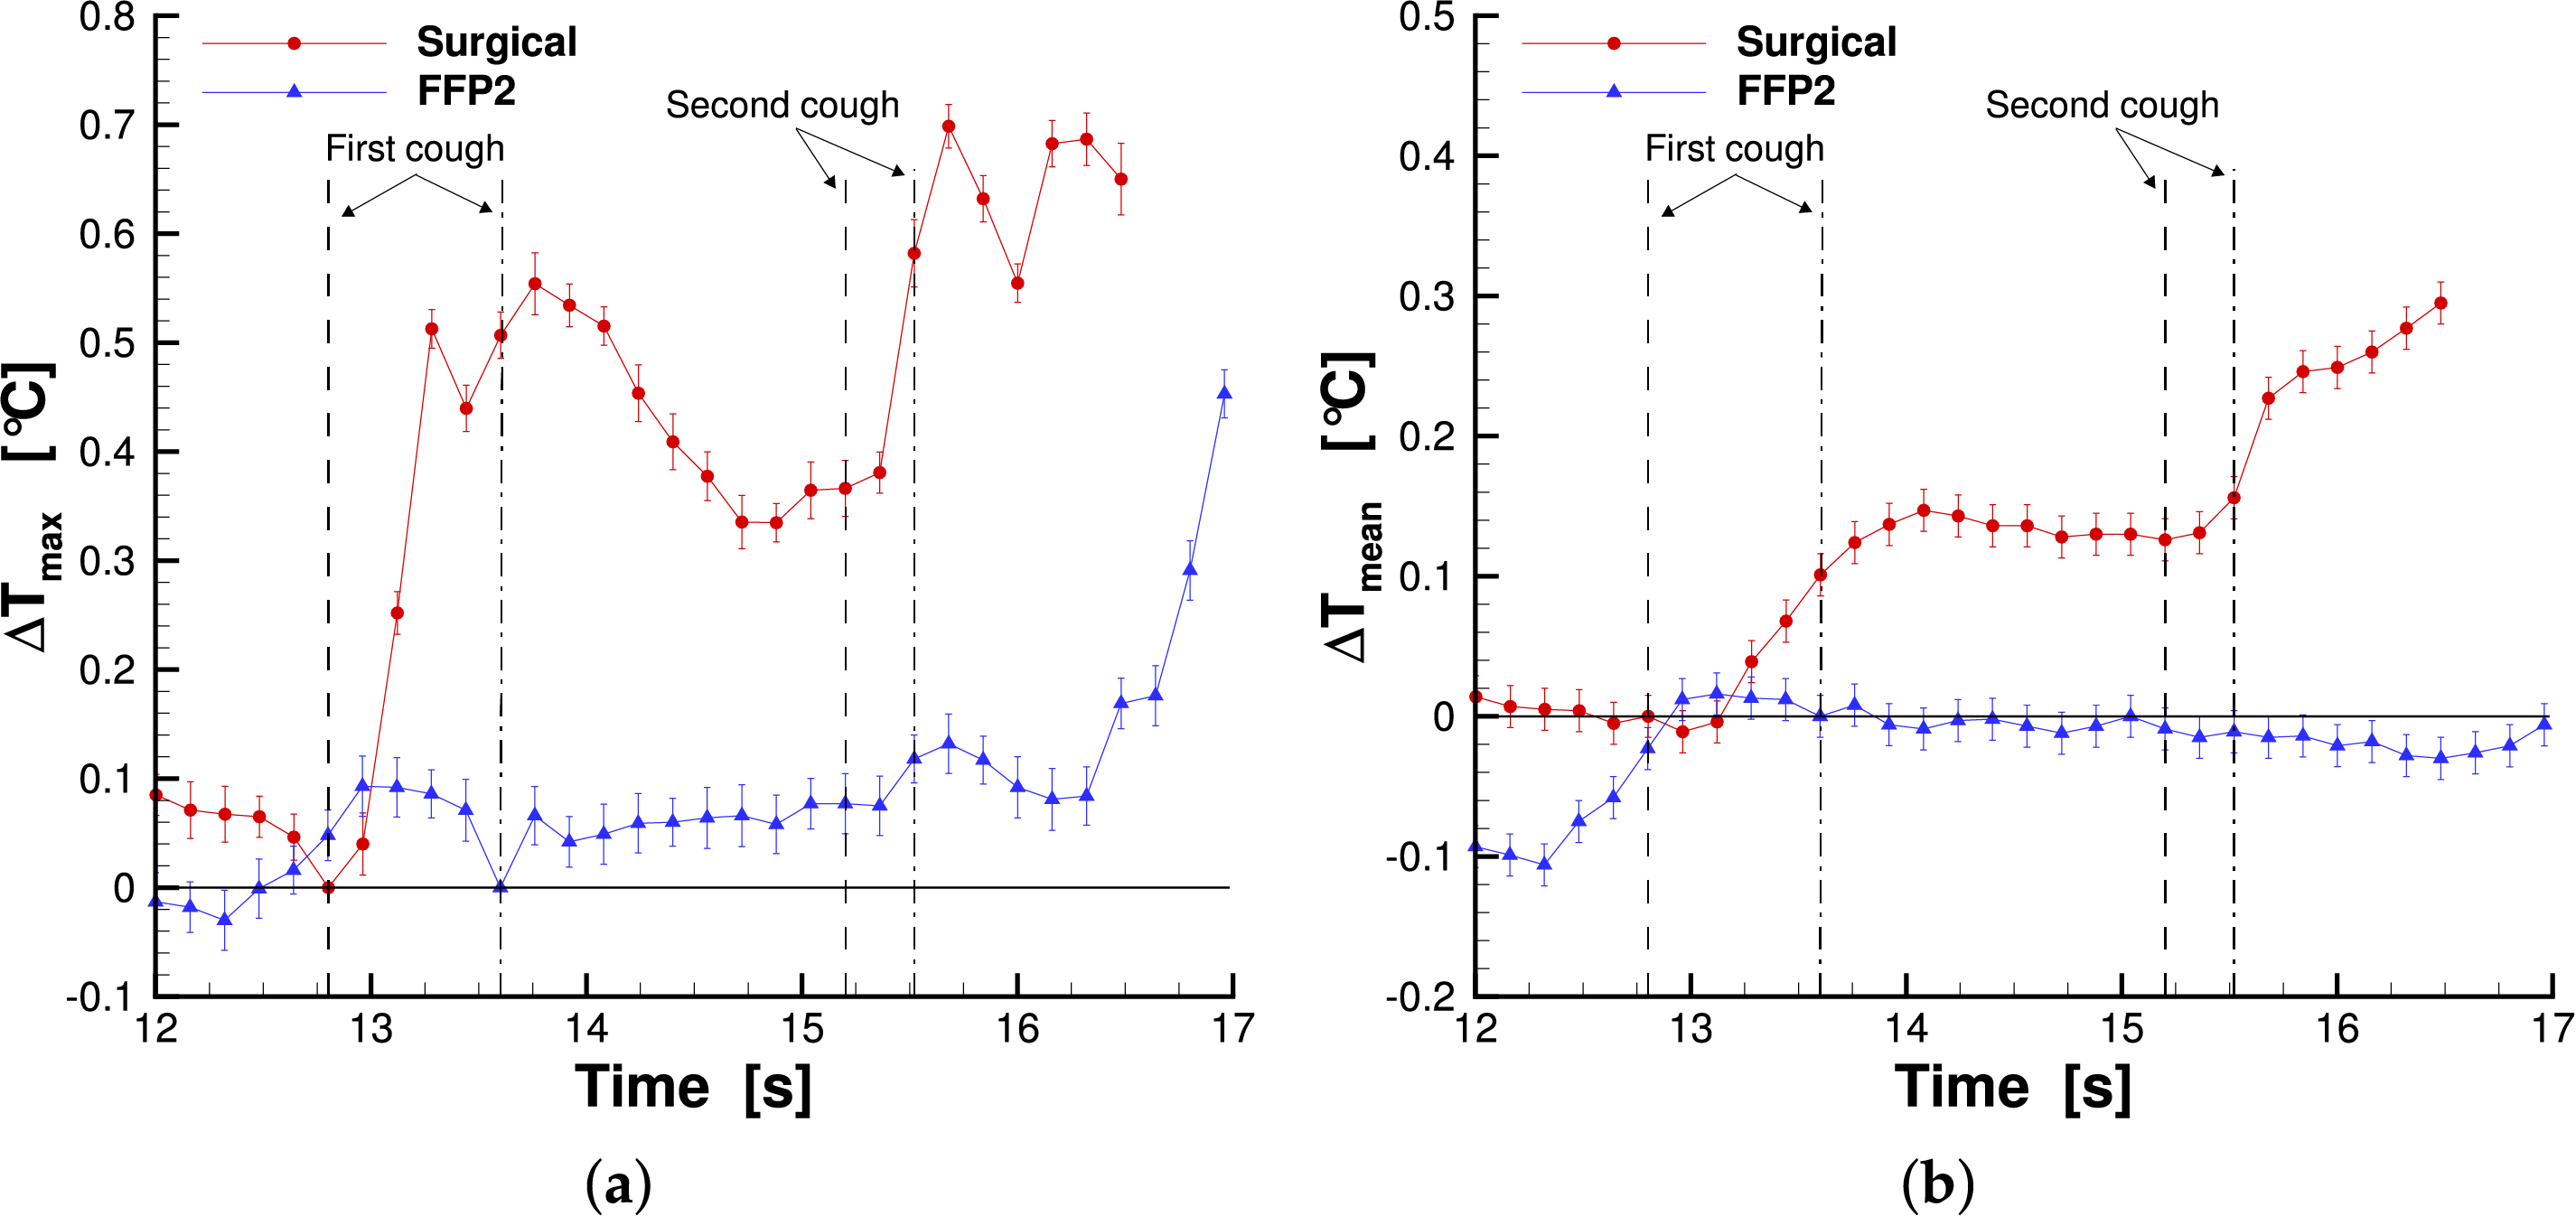
Figure 10: Maximum temperature (a) and mean temperature (b) measured in the reference area for subject 1.
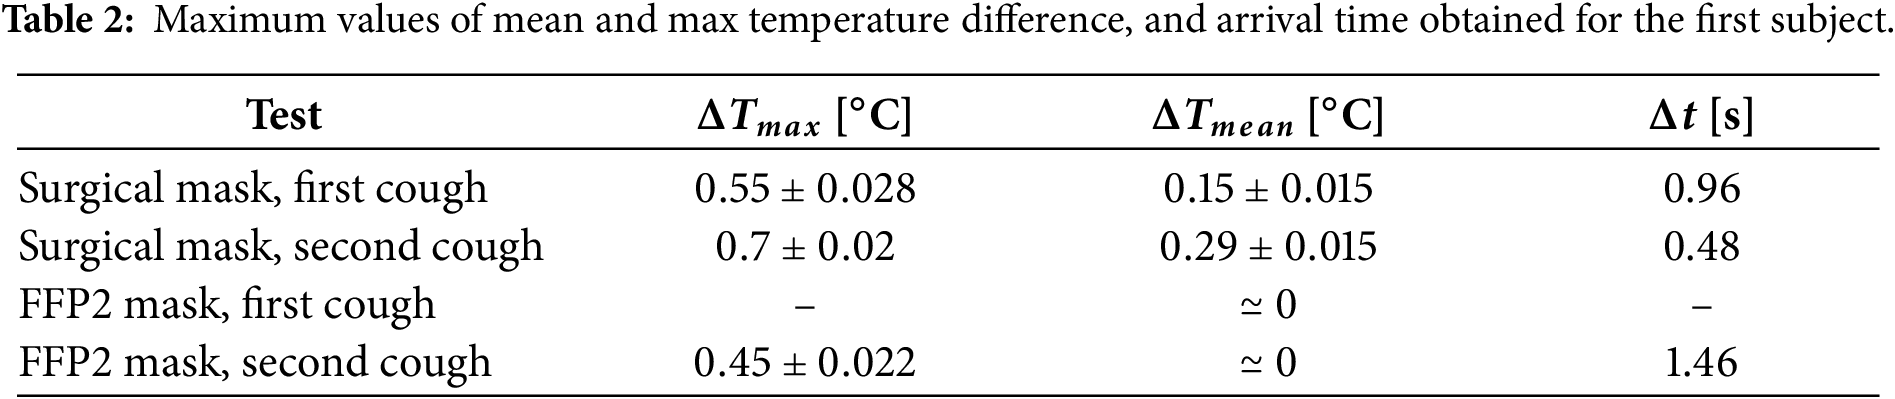
The plots highlight that both the maximum and mean temperatures are higher in the case of the surgical mask. This means that the saliva droplet emission of the surgical mask has a higher intensity and a larger area of interest than the FFP2 case, as is also clearly evident by the infrared images. The peaks subsequent to the first and second cough in the maximum temperature time history measured for the surgical mask have a time delay with respect to the coughs, and they were shown in Table 2. This delay is attributed to the time required for the saliva droplet to reach the screen and produce its thermal footprint. The FFP2 case shows only a peak after the second cough with a larger time delay. The mean temperature plot of the surgical mask also shows a higher value after the second cough with respect to the first one. This behavior corresponds to a larger area affected by the thermal footprint after the second cough, as highlighted by infrared images (Fig. 8). Table 2 summarizes the main finding for the first subject. In the table, the maximum values and the corresponding measurement uncertainties are reported.
The same kind of analysis was performed for the second subject. Figs. 11 and 12 show the thermographic images for the second subject wearing the surgical and FFP2 masks, respectively. The times of breathing and coughing are reported in Table 1. This time both of the two cases show the same behavior, and the images selected were the same relevant points of the subject 1 surgical mask case. The only exception is the last image of the FFP2 case (at the time of 12 s), which was selected at a time interval from the second maximum value of the temperature plot equal to 0.96 s. This time interval is the same value that elapses between the second maximum value and the last frame of the surgical mask case.
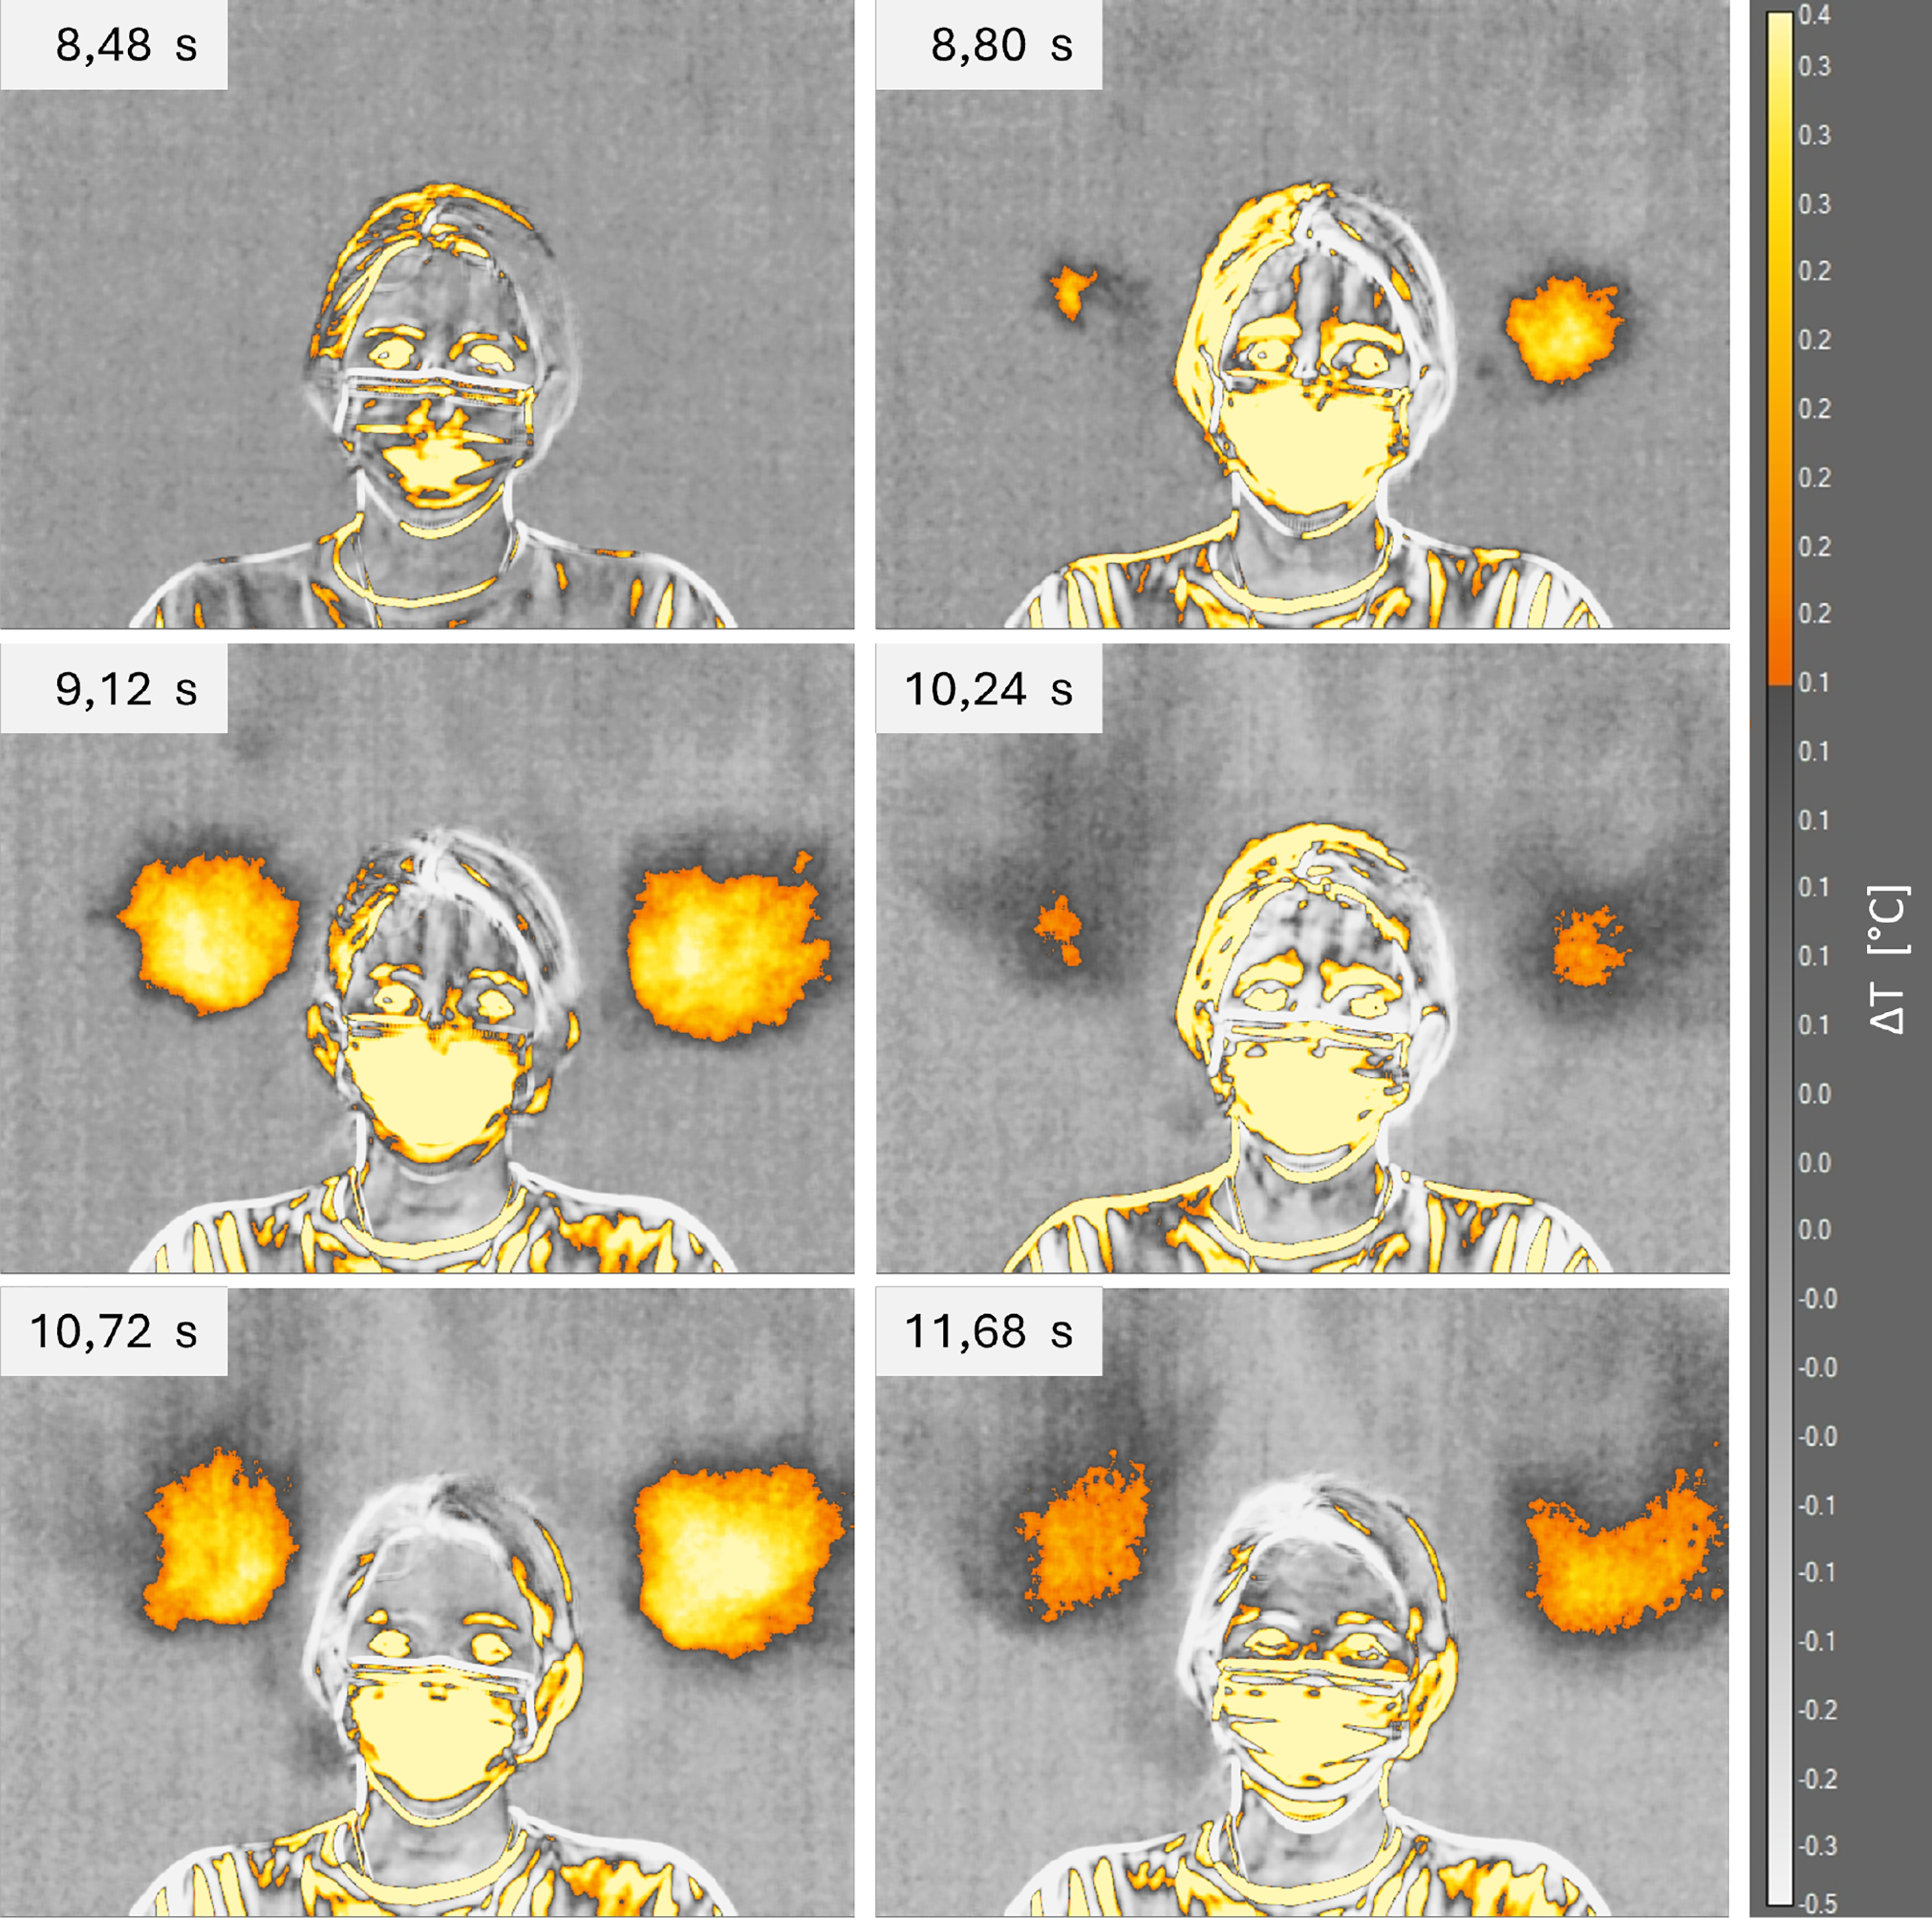
Figure 11: Infrared images of thermal footprint for subject 2 wearing the surgical mask.
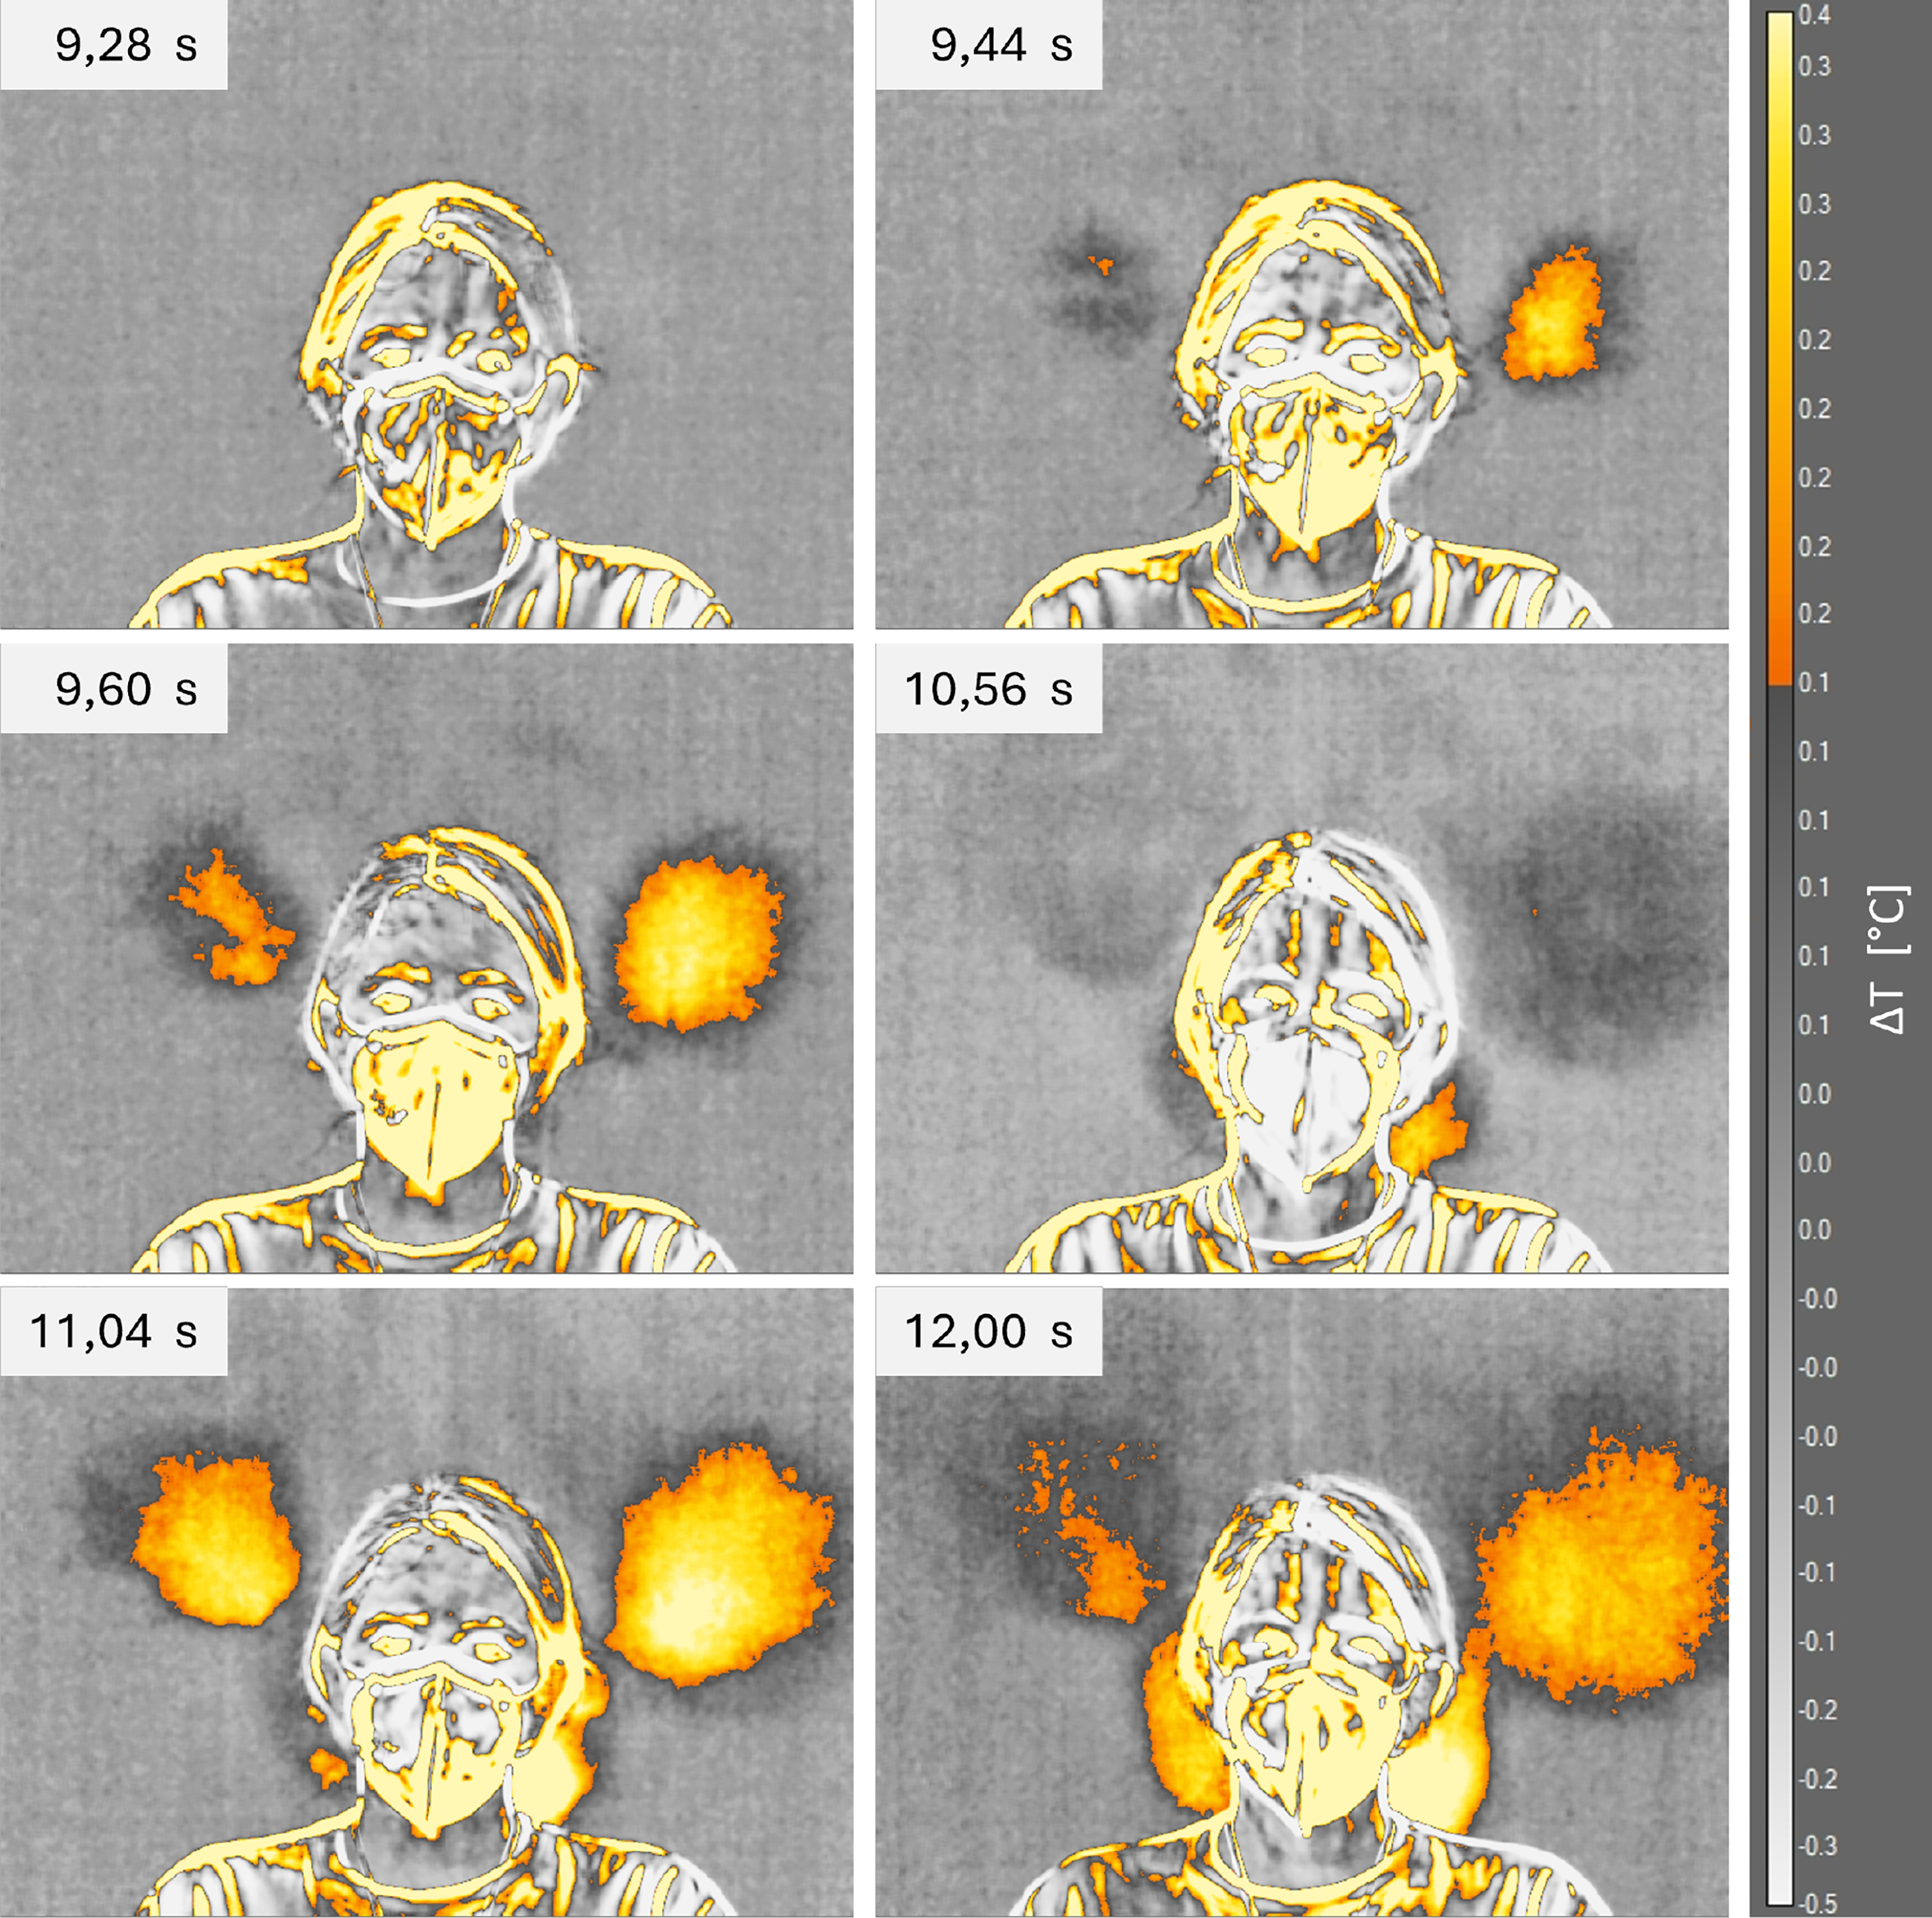
Figure 12: Infrared images of thermal footprint for subject 2 wearing the FFP2 mask.
Also in this case, the thermal footprint left by the saliva droplet is immediately visible from the infrared images. For the second subject, it is worth noting that the saliva droplet diffusion is equally divided between the left and right sides. Furthermore, the effect of the FFP2 mask is less pronounced than for the first subject, as the temperature distribution appears quite similar to that observed with the surgical mask. Finally, only the FFP2 case shows a second zone of emission close to the subject’s neck. The strong difference with the first subject could be due to the different face conformation: the presence of a beard and a more adherent mask to the face limit the saliva droplet emissions behind the first subject.
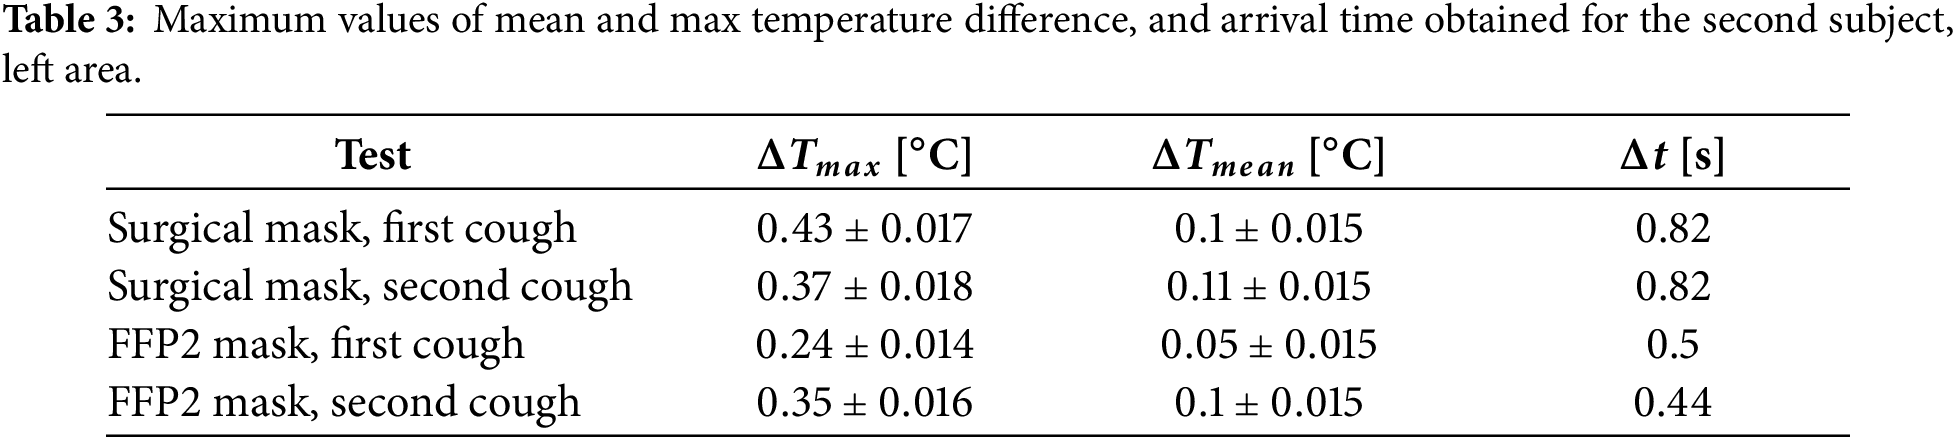
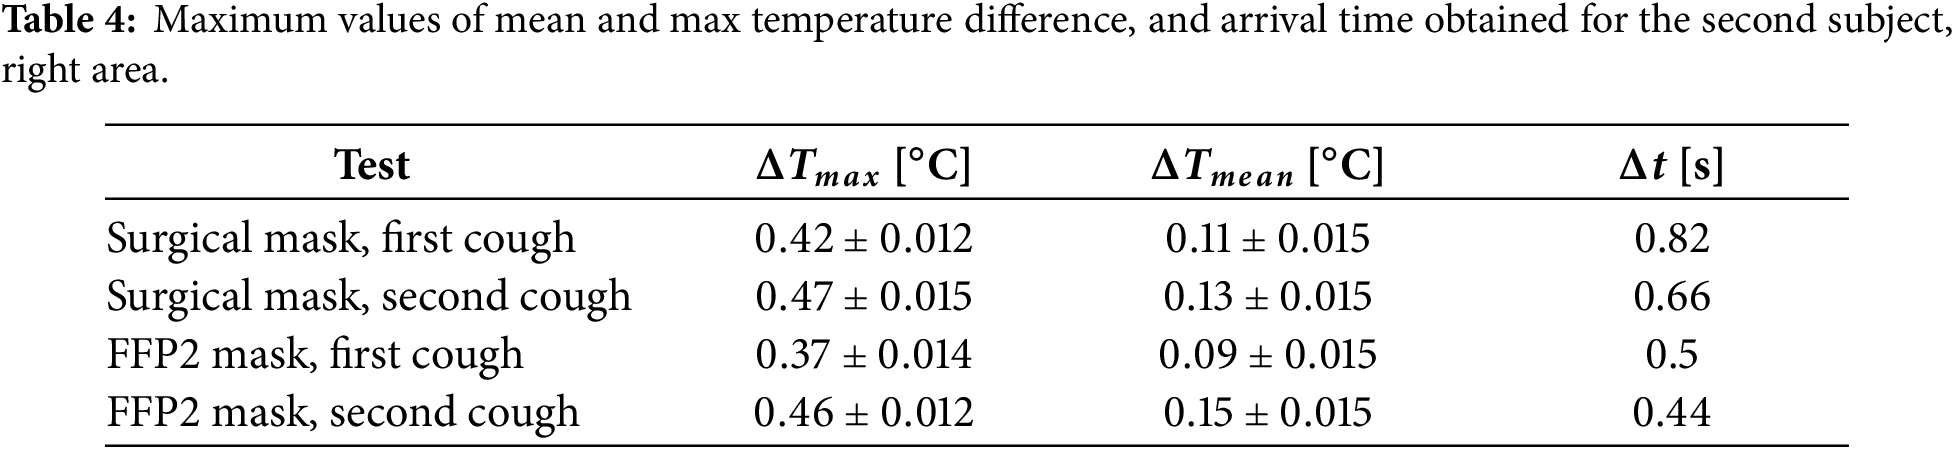
Due to the shape of the second subject’s thermal footprint, the maximum and mean temperatures were evaluated both on the left and right sides separately. Furthermore, the area of interest (Fig. 6b) has been selected to exclude the emission zone near the subject’s neck. Indeed, as already discussed, the emissions at head height are more relevant for infection risk than those near the neck. Therefore, the following quantitative analysis was performed, excluding the neck area, in order to highlight the effect of face masks in the head height area. Figs. 13 and 14 show the maximum and mean temperature time history measured in the left and right areas, respectively. Once again, the dashed lines indicate the time of coughs for the surgical mask, while the dash-dot lines indicate the time of coughs for the FFP2 mask.
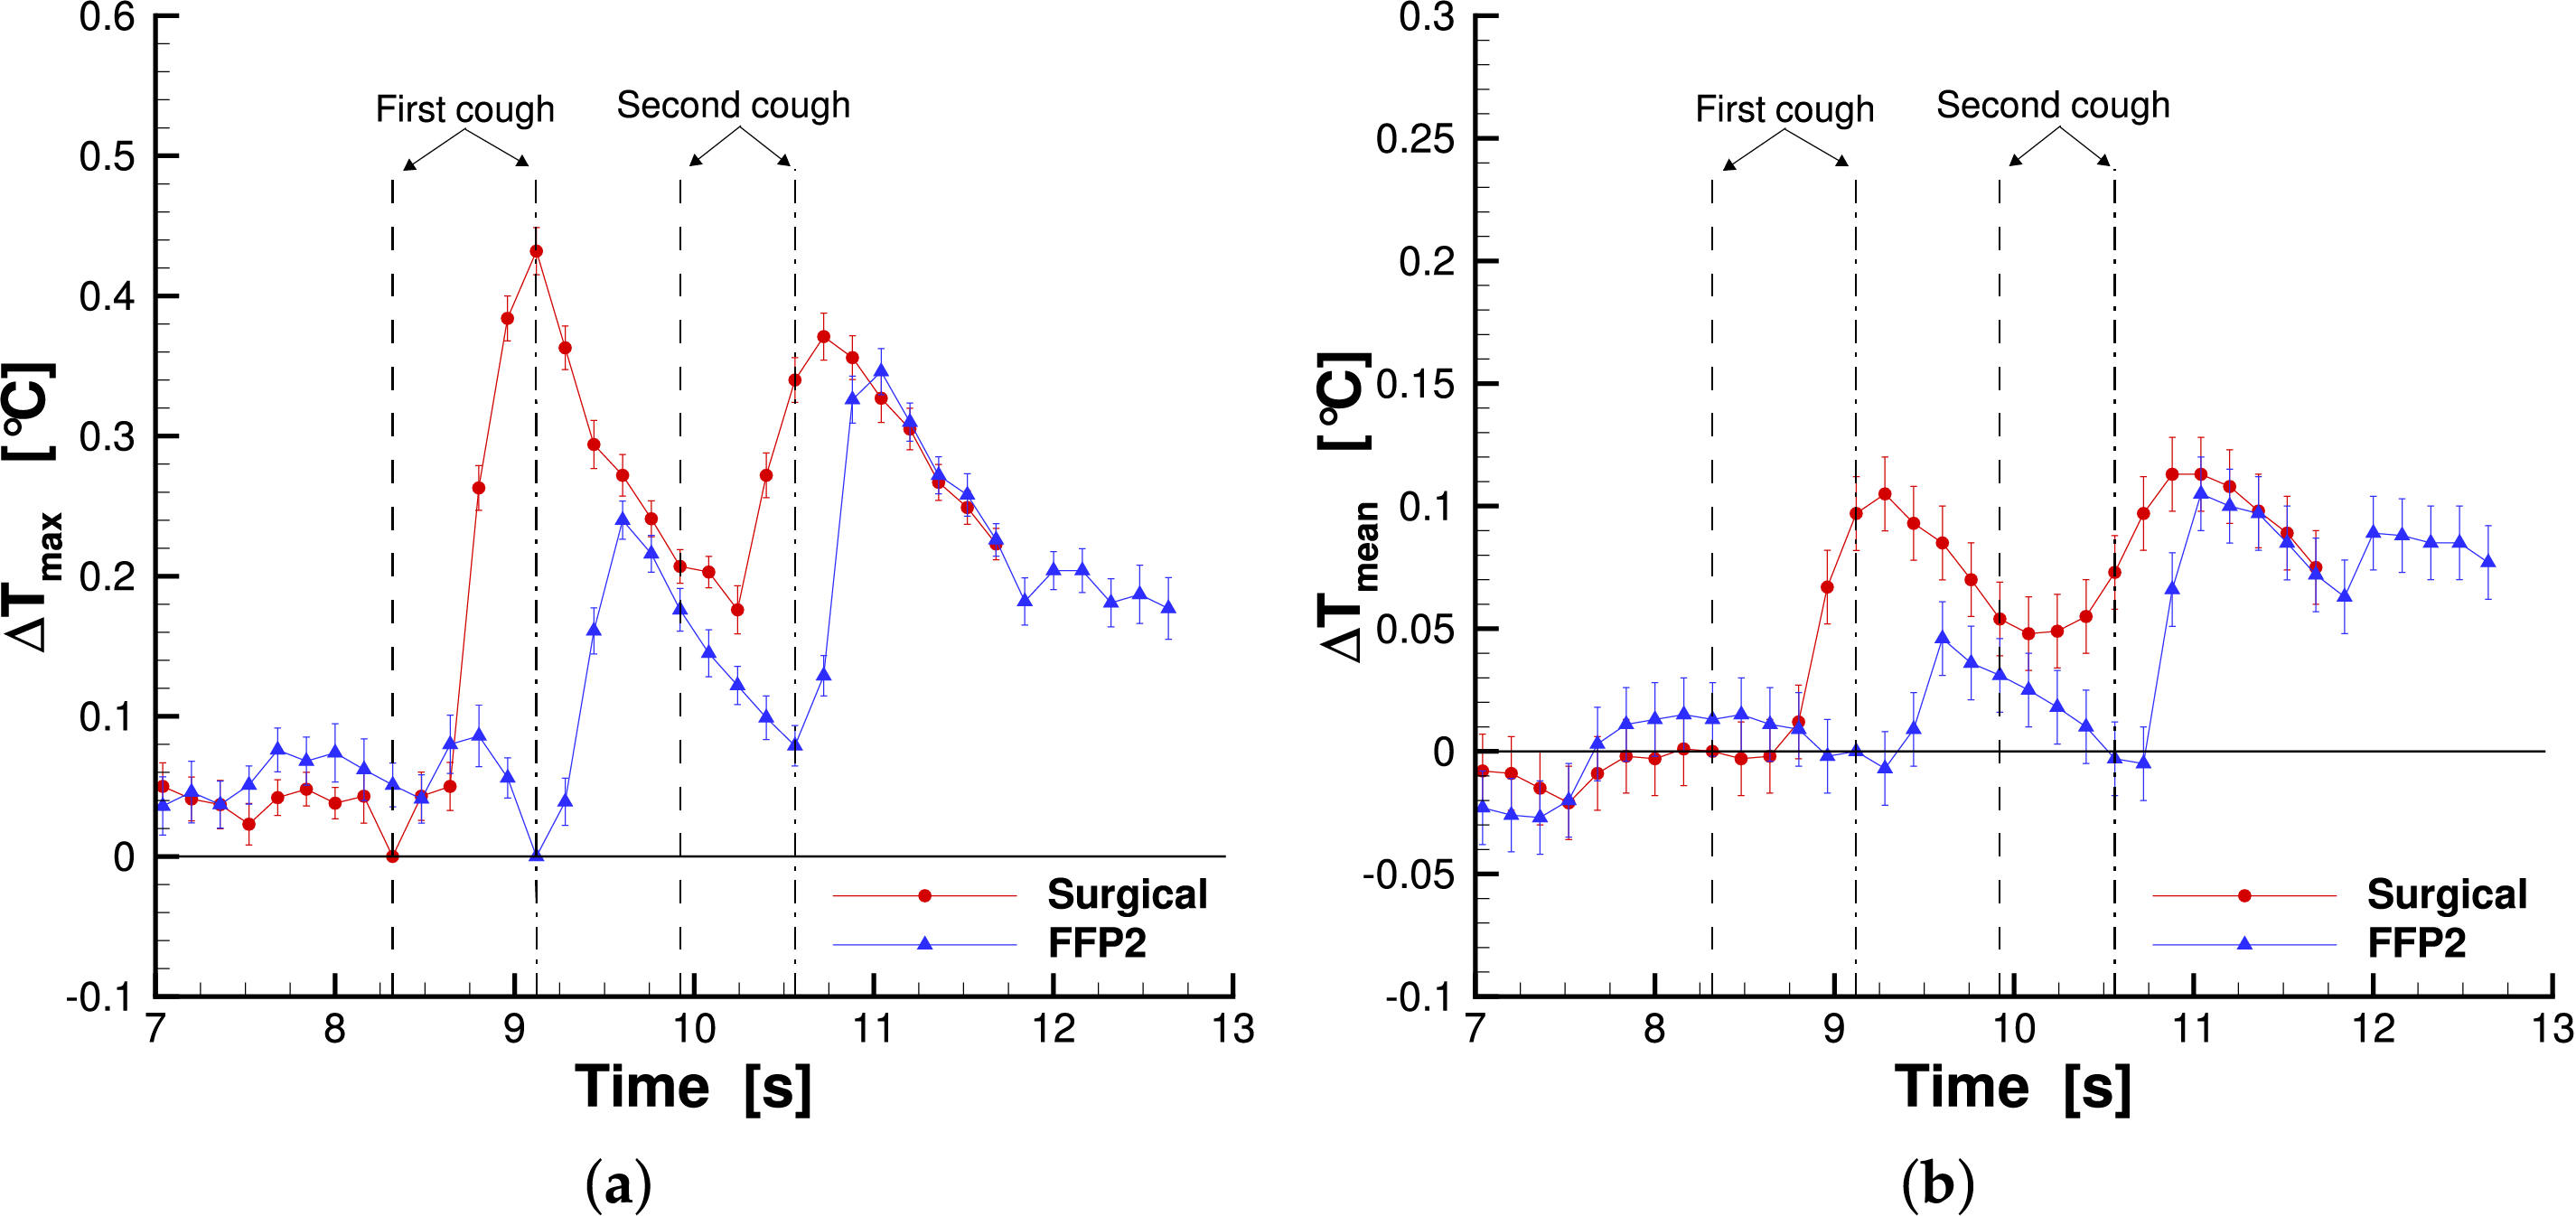
Figure 13: Maximum temperature (a) and mean temperature (b) measured in the left reference area for subject 2.
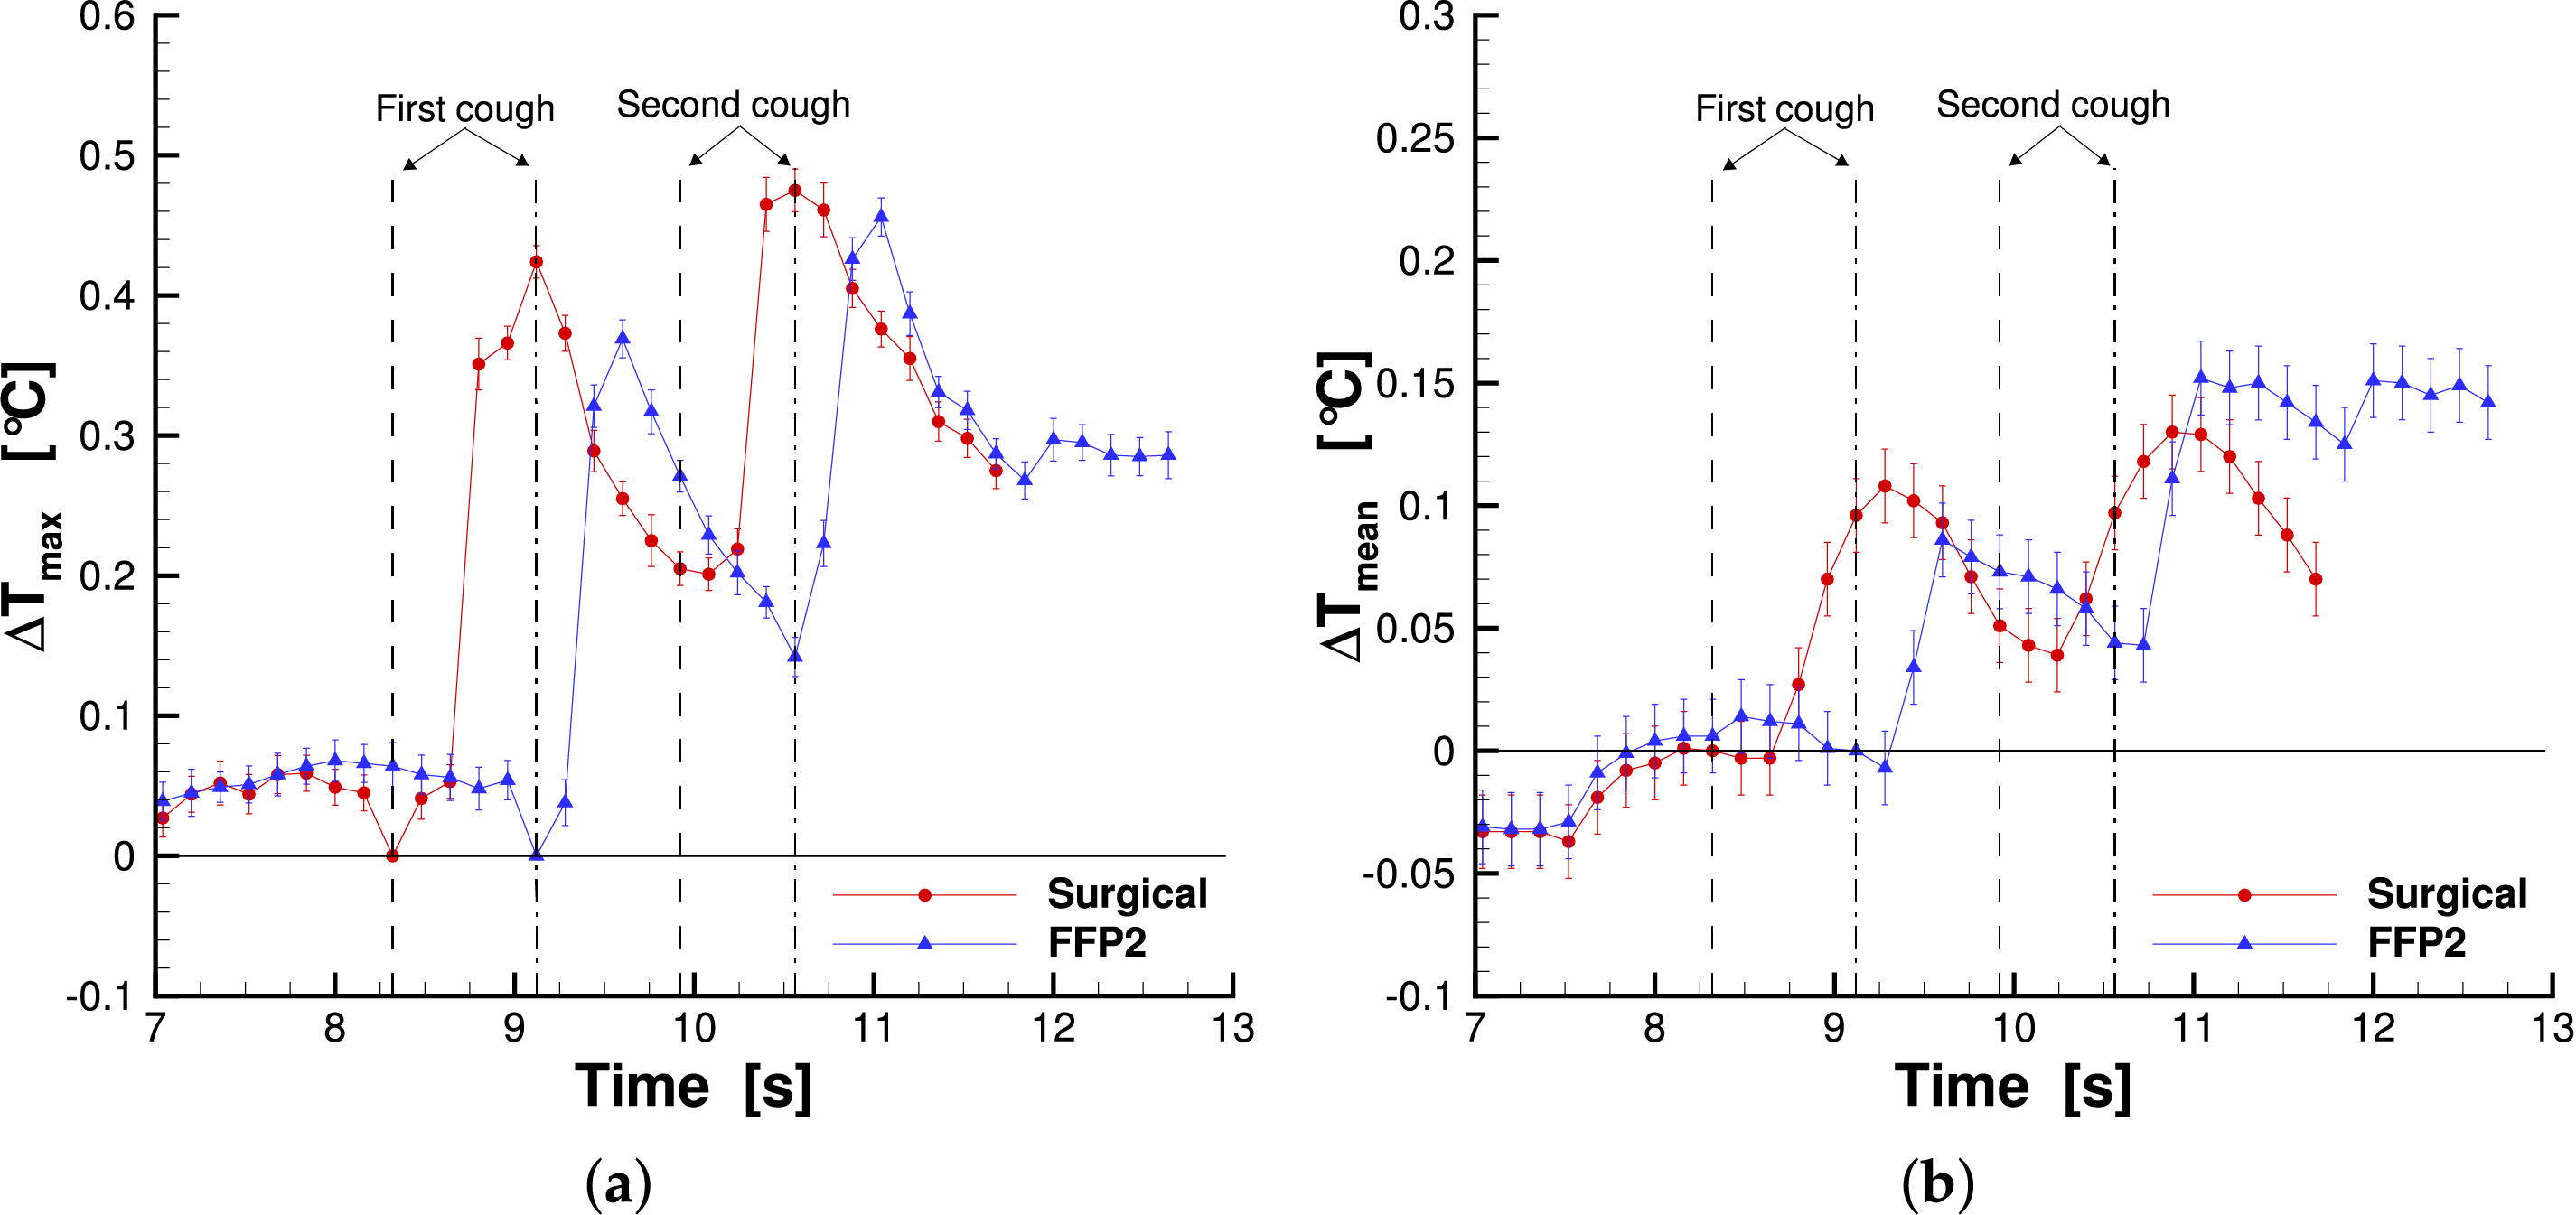
Figure 14: Maximum temperature (a) and mean temperature (b) measured in the right reference area for subject 2.
The maximum temperature behavior is similar to the first subject: after each cough there is a rapid increase that lead to a maximum value and a subsequent temperature decrease. This time the same trend was also detected for the FFP2 mask. The maximum temperature measured for the surgical mask was higher than that of the FFP2 mask. This difference is more evident for the left side (especially after the first cough) than the right one, where the maximum values are quite similar. Also in this case, there is a time delay between the coughs and the maximum value in the temperature plot. The time delays are reported in Tables 3 and 4 left and right sides, respectively. The FFP2 delays are shorter than the surgical mask ones, while between the left and right sides, the time delays are the same. Finally, looking at the mean temperature plot, it was found that the surgical mask has a larger area of interest for both the left and right sides after the first cough. However, for the second cough, this is true only for the left side, although the values are really close, while on the right side, the area interested by the saliva droplet is larger for the FFP2 case. Tables 3 and 4 summarize the main findings for the second subject, left and right areas, respectively. In the tables, the maximum values and the corresponding measurement uncertainties are reported.
In this study, a novel non-invasive method was applied to investigate saliva droplet diffusion behind subjects during ordinary and extraordinary respiratory activities. The detection of the rearward leakage due to face masks is important to reduce the infection risk, especially for the emission in the head height zone. Specifically, the phenomenon was detected by measuring the thermal footprint left by saliva droplets on a screen positioned behind the subject. Infrared thermography was used to capture the thermal footprint. Furthermore, surgical and FFP2 protective face masks were tested to evaluate the influence of these two common types of masks on saliva droplet emission. The tests were performed with two subjects, one male and one female, who were asked to carry out a standard sequence consisting of two deep breaths and two coughs.
The results demonstrated the feasibility of the proposed method to detect the thermal footprint of saliva droplets and to address the leakage on the back of the subjects due to mask wearing. The behavior of particle emission was strongly influenced by the facial conformation of the subjects and the mask fit, as the shape and position of the thermal footprints differ significantly between the two individuals. The findings highlight that the surgical mask exhibits a greater saliva droplet emission and a larger affected area than the FFP2 mask. This is especially true in the head height area, while the FFP2 mask shows a leakage in the zone near the neck, which was not detected for the surgical mask case. It is important to remark that the nature of the phenomenon under investigation is inherently influenced by individual-specific characteristics. In this study the sample size is limited to two subjects, so the comparison between masks and subjects is only partially generalizable.
The thermography approach proposed in the paper could be a promising method to detect rearward leakage during ordinary and extraordinary respiratory activities, without any potential risk for the individual due to the non-invasive nature of the measurement technique.
Acknowledgement: Not applicable.
Funding Statement: The authors received no specific funding for this study.
Author Contributions: The authors confirm contribution to the paper as follows. Luca Giammichele, Valerio D’Alessandro, Matteo Falone and Renato Ricci: conceptualization, methodology, formal analysis, investigation, data curation, writing—original draft preparation, writing—review and editing, visualization, supervision. All authors reviewed and approved the final version of the manuscript.
Availability of Data and Materials: The data that support the findings of this study are available from the Corresponding Author, Luca Giammichele, upon reasonable request.
Ethics Approval: This paper was conducted in accordance with the Declaration of Helsinki. Informed consent was obtained prior to performing the measurement, including permission for publication of all images included in the paper.
Conflicts of Interest: The authors declare no conflicts of interest.
References
1. WHO. COVID-19 dashboard [Internet]. [cited 2025 Jul 24]. Available from: https://data.who.int/dashboards/covid19. [Google Scholar]
2. Mittal R, Ni R, Seo JH. The flow physics of COVID-19. J Fluid Mech. 2020;894:F2. doi:10.1017/jfm.2020.330. [Google Scholar] [CrossRef]
3. Xiao L, Li K, Wei J, Cao Z, Cheng Y, Gao N. Cough airflow dynamics and droplet transmission: methods, characteristics, and implications. Build Environ. 2025;278:112974. doi:10.1016/j.buildenv.2025.112974. [Google Scholar] [CrossRef]
4. Brooks JT, Butler JC. Effectiveness of mask wearing to control community spread of SARS-CoV-2. JAMA. 2021;325(10):998–9. doi:10.1001/jama.2021.1505. [Google Scholar] [PubMed] [CrossRef]
5. Leech G, Rogers-Smith C, Monrad JT, Sandbrink JB, Snodin B, Zinkov R, et al. Mask wearing in community settings reduces SARS-CoV-2 transmission. Proc Natl Acad Sci. 2022;119(23):e2119266119. doi:10.1073/pnas.2119266119. [Google Scholar] [PubMed] [CrossRef]
6. D’Alessandro V, Falone M, Giammichele L, Ricci R. A multi-scale approach for modelling airborne transport of mucosalivary fluid. Appl Sci. 2022;12:12381. doi:10.3390/app122312381. [Google Scholar] [CrossRef]
7. D’Alessandro V, Falone M, Giammichele L, Ricci R. Eulerian-Lagrangian modeling of cough droplets irradiated by ultraviolet-C light in relation to SARS-CoV-2 transmission. Phys Fluids. 2021;33:031905. doi:10.1063/5.0039224. [Google Scholar] [PubMed] [CrossRef]
8. Khosronejad A, Santoni C, Flora K, Zhang Z, Kang S, Payabvash S, et al. Fluid dynamics simulations show that facial masks can suppress the spread of COVID-19 in indoor environments. AIP Adv. 2020;10:125109. doi:10.1063/5.0035414. [Google Scholar] [CrossRef]
9. Pendar MR, Páscoa JC. Numerical modeling of the distribution of virus carrying saliva droplets during sneeze and cough. Phys Fluids. 2020;32:083305. doi:10.1063/5.0018432. [Google Scholar] [PubMed] [CrossRef]
10. Jia Z, Ai Z, Yang X, Mak CM, Wong HM. Towards an accurate CFD prediction of airflow and dispersion through face mask. Build Environ. 2023;229:109932. doi:10.1016/j.buildenv.2022.109932. [Google Scholar] [CrossRef]
11. He F, Wu J, Li Y, Fu M, He S, Weng W. The impact of leak gap size and position on surgical mask performance of source control: a numerical study. Build Environ. 2025;267(Pt C):112241. doi:10.1016/j.buildenv.2024.112241. [Google Scholar] [CrossRef]
12. Morris S, McAtee W, Capecelatro J, Raghav V. Influence of expiratory flow pulsatility on the effectiveness of a surgical mask. J Expo Sci Environ Epidemiol. 2022;32:697–705. doi:10.1038/s41370-022-00416-x. [Google Scholar] [PubMed] [CrossRef]
13. Kähler CJ, Hain R. Fundamental protective mechanisms of face masks against droplet infections. J Aerosol Sci. 2020;148:105617. doi:10.1016/j.jaerosci.2020.105617. [Google Scholar] [PubMed] [CrossRef]
14. Wang H, Li Z, Zhang X, Zhu L, Liu Y, Wang S. The motion of respiratory droplets produced by coughing. Phys Fluids. 2020;32:125102. doi:10.1063/5.0033849. [Google Scholar] [PubMed] [CrossRef]
15. Alvarez-Herrera C, Murillo-Ramirez JG. Airflow detailed analysis through a face mask using the schlieren technique. Heliyon. 2024;10(12):e33384. doi:10.1016/j.heliyon.2024.e33384. [Google Scholar] [PubMed] [CrossRef]
16. Viola IM, Peterson B, Pisetta G, Pavar G, Akhtar H, Menoloascina F, et al. Face coverings, aerosol dispersion and mitigation of virus transmission risk. IEEE Open J Eng Med Biol. 2021;2:26–35. doi:10.1109/OJEMB.2021.3053215. [Google Scholar] [PubMed] [CrossRef]
17. Staymates M. Flow visualization of an N95 respirator with and without an exhalation valve using schlieren imaging and light scattering. Phys Fluids. 2020;32:111703. doi:10.1063/5.0031996. [Google Scholar] [PubMed] [CrossRef]
18. Arumuru V, Pasa J, Samantaray SS. Experimental visualization of sneezing and efficacy of face masks and shields. Phys Fluids. 2020;32:115129. doi:10.1063/5.0030101. [Google Scholar] [PubMed] [CrossRef]
19. Verma S, Dhanak M, Frankenfield J. Visualizing the effectiveness of face masks in obstructing respiratory jets. Phys Fluids. 2020;32(6):061708. doi:10.1063/5.0016018. [Google Scholar] [PubMed] [CrossRef]
20. Luximon Y, Anne Sheen K, Luximon A. Time dependent infrared thermographic evaluation of facemasks. Work. 2016;54(4):825–35. doi:10.3233/WOR-162353. [Google Scholar] [PubMed] [CrossRef]
21. Scarano A, Inchingolo F, Lorusso F. Facial skin temperature and discomfort when wearing protective face masks: thermal infrared imaging evaluation and hands moving the mask. Int J Environ Res Public Health. 2020;17(13):4624. doi:10.3390/ijerph17134624. [Google Scholar] [PubMed] [CrossRef]
22. Du W, Iacoviello F, Fernandez T, Loureiro R, Brett DJL, Shearing PR. Microstructure analysis and image-based modelling of face masks for COVID-19 virus protection. Commun Mater. 2021;2:69. doi:10.1038/s43246-021-00160-z. [Google Scholar] [CrossRef]
23. Fragoso-Mandujano JA, Pérez-Patricio M, Camas-Anzueto JL, Vázquez-Delgado HD, Chandomí-Castellanos E, Gonzalez-Baldizón Y, et al. Towards an approach for filtration efficiency estimation of consumer-grade face masks using thermography. Appl Sci. 2022;12:2071. doi:10.3390/app12042071. [Google Scholar] [CrossRef]
24. Koroteeva E, Shagiyanova A. Infrared-based visualization of exhalation flows while wearing protective face masks. Phys Fluids. 2022;34(1):011705. doi:10.1063/5.0076230. [Google Scholar] [PubMed] [CrossRef]
Cite This Article
 Copyright © 2026 The Author(s). Published by Tech Science Press.
This work is licensed under a Creative Commons Attribution 4.0 International License , which permits unrestricted use, distribution, and reproduction in any medium, provided the original work is properly cited.
 Downloads
 Citation Tools