
 Submit a Paper
 Propose a Special lssue
 Open Access
ARTICLE

Research on Fuzzy-Proportional-Integral-Derivative Control Strategy Improved by Artificial Bee Colony algorithm for Thermal Management of Hybrid Fuel Cell
1 COMAC Beijing Aircraft Technology Research Institute, Beijing, China
2 College of Energy and Power Engineering, Nanjing University of Aeronautics and Astronautics, Nanjing, China
3 Key Laboratory of Thermal Management and Energy Utilization of Aircraft, Ministry of Industry and Information Technology, Nanjing, China
* Corresponding Author: Zhenzong He. Email:
Frontiers in Heat and Mass Transfer 2026, 24(1), 4 https://doi.org/10.32604/fhmt.2026.075846
Received 10 November 2025; Accepted 20 January 2026; Issue published 28 February 2026
 View Full Text
 Download PDF
Abstract
The proton exchange membrane fuel cell (PEMFC) and the hydrogen hybrid power system are studied by the fuzzy-PID (FPID) control method and the fuzzy-PID control method by Artificial Bee Colony algorithm (ABC-FPID), respectively. The results reveal that compared with the FPID control method, the temperature overshoot of the PEMFC stack under the ABC-FPID control method is decreased by 0.6%. Moreover, the circulating water flow rate within the full operating envelope (about 3 min) is reduced by 19.46 L, which means the ABC-FPID control method is more effective in regulating the stack temperature. Then, the ABC-FPID control method is proposed to study the hydrogen hybrid power system, and the system output power matching, operating characteristic curve of the fuel cell, state of charge (SOC) of the lithium battery, system efficiency and hydrogen demand are obtained. The results indicate that the maximum system efficiency reaches 46.3%, the average system efficiency is 33.8%, and the average hydrogen demand is 0.192 kg/s. Overall, the ABC-FPID control method can efficiently ensure the stability of the fuel cell’s output power, and actively prompt the lithium battery to fulfill the function of “peak shaving and valley filling” under variable load power conditions.Keywords
According to statistics from the International Energy Agency (IEA), fossil fuels still dominated the global primary energy mix with a share of approximately 80% as of 2024 [1]. Of note, energy-related carbon emissions accounted for 85% of the world’s total carbon emissions, while the bulk of global electricity generation remained heavily dependent on traditional energy sources including coal, oil, and natural gas. This underscores that humanity stands at a critical crossroads of energy transition, confronted with the dual pressures of global climate change and surging energy consumption [2]. Against this policy backdrop, developing renewable energy and establishing a clean, efficient, and secure energy system has evolved into an imperative priority for the global community to pursue sustainable development, as well as a pivotal strategy for China to drive energy structure optimization and materialize its “carbon peaking and carbon neutrality” (dual-carbon) goals [3].
The hydrogen as an energy carrier offers significant advantages, including zero carbon emissions at the point of use, high energy density per unit mass, high calorific value, and high conversion efficiency. Consequently, hydrogen-powered system is widely regarded as a next-generation frontier in green propulsion technologies [4]. This momentum is driven in large part by the rapid expansion of renewable energy under the global decarbonization agenda, which has accelerated the production of green hydrogen. Notably, China’s national ‘dual carbon’ strategy—which aims to achieve peak carbon emissions before 2030 and carbon neutrality before 2060—provides strong policy impetus for the development and adoption of hydrogen energy. Among hydrogen utilization pathways, the hydrogen fuel cell represents a key energy conversion device that directly converts chemical energy from hydrogen into electricity. It is characterized by high power density and low environmental impact [5]. As documented in the literature, fuel cell technology exhibits multiple features that align with the requirements of green power systems, such as high energy conversion efficiency, high specific energy, low noise and infrared signature, reliable operation, zero operational emissions, and long service life [6]. Moreover, compared with conventional internal combustion engines, a fuel cell system operating on the same mass of fuel can extend power supply duration by two to three times. When configured for combined heat and power applications, the overall fuel utilization efficiency can exceed 80% [7].
Although the hydrogen fuel cell has many advantages mentioned above, the problems of long start-up time and slow power response speed of the stack are outstanding due to the thermal inertia of the stack and the complexity of gas transport, diffusion and electrochemical reaction processes [6]. Therefore, when hydrogen fuel cells are employed as power sources in diverse engineering fields, they are typically paired with fast-response power devices (e.g., power batteries, lithium batteries, turbine engines, and supercapacitors). By virtue of an optimized power allocation strategy, such hybrid power systems can ultimately achieve optimal regulation of output power while satisfying the dynamically varying load power requirements. Peng et al. [8] designed a hybrid power system integrating a proton exchange membrane fuel cell (PEMFC), a lithium-ion battery (Li-battery), and a supercapacitor. García et al. [9] evaluated the application of a novel hybrid power system composed of fuel cells, battery packs, and ultra-capacitors in tramway operations. Wang et al. [10] investigated the power management strategy for a 6 kW stationary PEMFC hybrid power system. Experimental validation demonstrated that the proposed power matching strategy effectively enhances the stability, performance, and energy conversion efficiency of the system under steady-state operating conditions.
Moreover, the thermal management strategy is of equal importance to the energy management system. It primarily encompasses the regulation of the temperature field within the fuel cell stack as well as the temperature control of associated components. In practice, the energy management system and thermal management system should be considered in an integrated manner. Xing et al. [11] studied the thermal management system of fuel cell hybrid vehicles and proposed a PID control strategy for regulating the cooling water flow rate. This strategy successfully stabilized the stack temperature at 350 K under actual driving conditions. Additionally, Xing et al. [12] proposed a new topology for a water-cooled fuel cell stack used in automotive cooling systems. The cooling system model considers both stack cooling and the cooling of compressed air through an intercooler, among which the stack loop cooling consumes 98.5% of the cooling water. Chen et al. [13] applied the Ultrathin Vapor Chamber (UVC) heat dissipation technology to the cooling of PEMFCs. Both simulation and experimental results indicated that the UVC improved the temperature distribution of the fuel cell: the maximum temperature inside the stack decreased by 9°C, and the temperature of the proton exchange membrane was significantly reduced at a current of 35 A. Wang et al. [14] proposed an integrated energy system consisting of a PEMFC, an Organic Rankine Cycle (ORC) system, and a Metal Hydride (MH) hydrogen storage system. The results demonstrated that compared with a single PEMFC, the overall performance of the integrated system was significantly improved. At the system’s maximum power point, the output power, electrical efficiency, energy efficiency, and exergy efficiency increased by 15.0%, 4.3%, 14.1%, and 4.9%, respectively.
From above reports, it can be found that there exist various approaches and methodologies to enhance the thermal management performance of hydrogen energy hybrid power systems. In fact, the thermal management system for fuel cell/lithium battery hybrid power is a highly nonlinear system, and researchers at home and abroad have conducted extensive studies on the control strategies of this system. So, the control method is also very important to improve the thermal management performance of hydrogen energy hybrid power systems. Yun and Han [15] employed rule-based control, state machine control, and fuzzy logic control strategies to study the thermal management performance, hydrogen consumption and fuel cell efficiency of Urban Air Mobility (UAM) systems, and found that the fuzzy logic control strategy performed best. Jia et al. [16] employed a comprehensive control framework for energy and thermal coupling by constructing the electro-thermal coupling lifespan models of batteries and fuel cell systems, as well as the dynamic thermal load model of the cabin. This framework optimizes vehicle energy consumption and achieves the optimal balance among fuel economy, cabin comfort, and energy system durability. Ju et al. [17] presented an integrated design and optimization approach for energy management strategy (EMS) and thermal management strategy (TMS) in fuel cell-powered heavy-duty trucks, and designed an integrated optimization scheme with 82 parameters. Then, with the help of an advanced hybrid population optimization algorithm, the optimal performance in both energy efficiency and temperature regulation were obtained. Saygili et al. [18] established a semi-empirical stack temperature management system; under the premise of minimizing the operation of the cooling fan, the study found that proportional-integral-derivative (PID) control applied to the water pump yields favorable results. Yu and Jung [19] compared the performance of the traditional control algorithm and feedback control based on the stack temperature management system, and the results indicated that feedback control can better reduce the power consumption of auxiliary equipment and improve system efficiency. Chatrattanawet et al. [20] integrated predictive control with the stack temperature management system, and the findings demonstrated that this method can effectively stabilize the stack temperature at the target value. Fang et al. [21] investigated the causes of stack temperature fluctuations based on an experimental platform and simulation model, and found that the combination of extended Kalman filtering (EKF) and sliding mode control (SMC) can achieve excellent control over the stack temperature. Li et al. [22] designed an active disturbance rejection controller (ADRC) to ensure the stability of the stack temperature; the results showed that the controller can effectively maintain a slight variation in the stack temperature under the interference of multiple internal and external factors. Hu et al. [23] proposed a two-dimensional incremental fuzzy controller and applied it to the bypass valve, and the simulation results verified that this method enables real-time and accurate control of the stack temperature. There exist various approaches and methodologies to enhance the thermal management performance of hydrogen energy hybrid power systems. Among these, fuzzy logic control has demonstrated favorable performance in both fuel cell stack temperature regulation and hydrogen consumption control. Nevertheless, existing research has not adequately addressed or analyzed the optimization of relevant parameters in fuzzy control, which is crucial for further achieving the optimal regulation of thermal management systems.
The effective energy management and control strategy can significantly improve the performance of the hybrid power system, so that the system changes from “available” to more “friendly” under the condition of complex power demand rapid change. In general, fuel cell stacks can be cooled by two methods: air cooling and liquid cooling. Air cooling has the advantage of not requiring the carrying of coolant, but at the same time, its cooling effect is relatively poor, and it can only cool low-power stacks. Liquid cooling, on the other hand, offers a better cooling effect; however, the need to carry coolant makes the system more complex and bulkier. Therefore, for liquid-cooled stacks, how to minimize the amount of coolant carried, reduce system complexity, and accurately regulate the stack temperature are key challenges hindering the large-scale promotion and application of this technology—especially the challenge of dynamic temperature control under variable load conditions [24]. Based on the above reasons, the ABC-FPID method proposed in this paper aims to optimize the traditional FPID algorithm through the Artificial Bee Colony (ABC) algorithm, thereby improving the cooling efficiency of the fuel cell stack, reducing stack overshoot, and making up for the shortcomings of the liquid cooling method. Firstly, four kinds of fuel cell and lithium battery hybrid power system architecture are analyzed and compared, and the optimal architecture model is determined. Then, the characteristics of fuel cell stack, such as stack temperature and cooling water flow, are analyzed based on traditional fuzzy-PID (FPID) control method and the fuzzy-PID control method with artificial bee colony algorithm (ABC-FPID), and the optimal control method is determined. Finally, the research on energy management and control of fuel cell hybrid power system is carried out, and the changes of system power distribution, lithium battery SOC control, system energy conversion efficiency and hydrogen consumption rate under the full working envelope of the hybrid power system are analyzed, which provides the model and method support for the application of fuel cell technology in hydrogen-powered system.
2 PEMFC/Battery Hybrid System Architecture and Model
Fig. 1a–d illustrates four typical topologies [6]. The primary distinctions among them lie in the placement and quantity of DC/DC converters. The subsequent content will analyze the merits and demerits of these four structures sequentially.
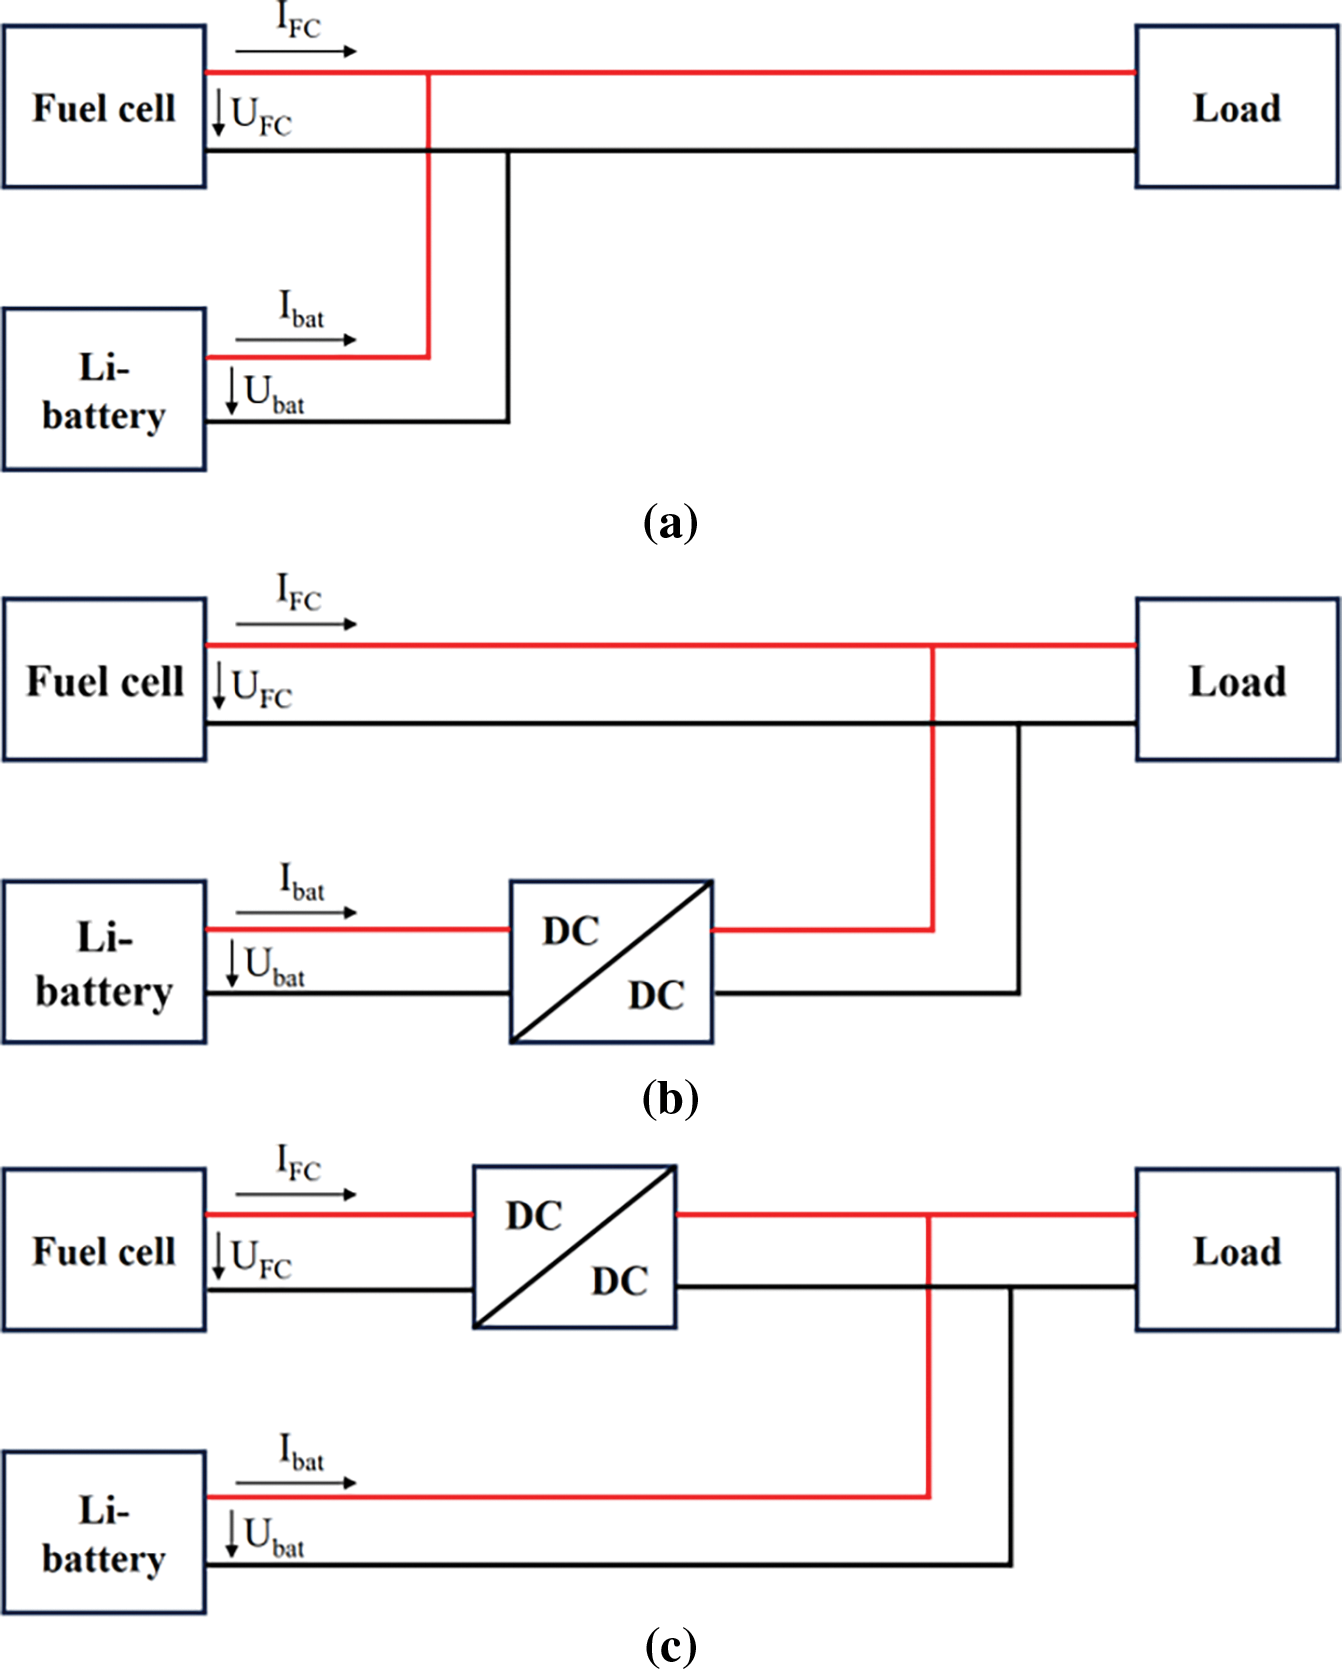
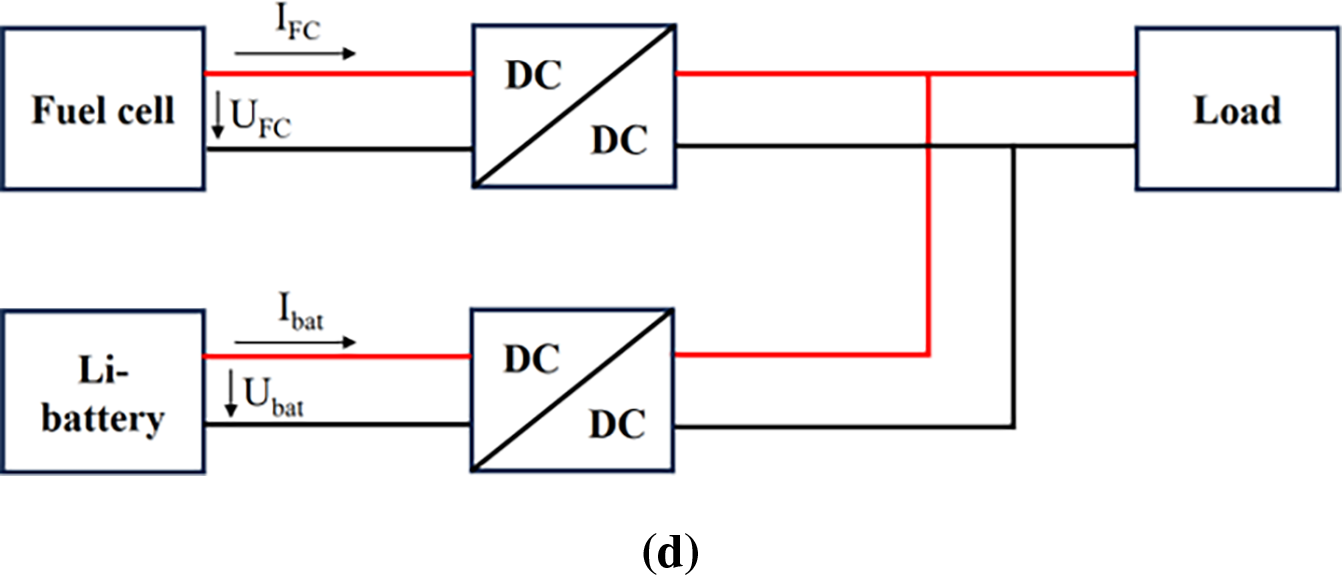
Figure 1: Four topology diagrams of a fuel cell/lithium battery hybrid system: (a) system without DC/DC, (b) only Li-battery with DC/DC, (c) only fuel cell with DC/DC, (d) fuel cell and Li-battery all with DC/DC.
In the topology illustrated in Fig. 1a, the fuel cell and lithium battery directly supply the load motor in parallel without DC/DC converter. This configuration requires precise voltage matching between the fuel cell and battery outputs. However, practical implementation reveals three critical limitations: First, inherent voltage instability in fuel cell operation creates current backflow risks through the bus. Second, the absence of DC/DC-based regulation eliminates real-time current control capability for both power sources. Third, this architecture fundamentally restricts active power allocation, resulting in suboptimal passive power distribution determined solely by the intrinsic voltage-current characteristics of the energy sources.
As depicted in Fig. 1b, a bidirectional DC/DC converter is interfaced with the output terminal of the lithium battery. Following the series connection of the lithium battery and the DC/DC converter, the converter is then connected in parallel with the fuel cell to power the load motor. Under normal operating conditions, the DC/DC converter regulates the load bus voltage to match the output voltage of the fuel cell. Nevertheless, the output voltage of the fuel cell is inherently coupled with its output current, rendering it unstable. Such frequent voltage fluctuations not only compromise the operational efficiency of the fuel cell but also significantly shorten its service life. To address this issue in this topology, a diode is typically incorporated at the output of the fuel cell to ensure unidirectional current flow, safeguarding the fuel cell from reverse current damage. Moreover, when the power demand of the load motor experiences a sudden surge, the output power capacity required from the lithium battery expands accordingly. This necessitates an increase in the power regulation range of the DC/DC converter, ultimately leading to higher costs for both the lithium battery and the converter. Consequently, the overall system cost escalates, and its economic viability diminishes.
The configuration illustrated in Fig. 1c ensures that the bus voltage remains constantly aligned with the output voltage of the lithium battery. Additionally, it enables precise control over the DC/DC converter to regulate the output current of the fuel cell, allowing both the fuel cell and the lithium battery to operate stably within their normal ranges. Since the lithium battery is directly connected to the load bus, power losses associated with intermediate components are minimized, thereby enhancing the overall energy utilization efficiency of the system. As the fuel cell stack functions solely as a power-outputting source, it can be connected in series with a unidirectional DC/DC converter. This obviates the need for the bidirectional DC/DC converter employed in the structure of Fig. 1b, resulting in a reduction in costs. Moreover, given that the maximum output power of the fuel cell is fixed, selecting an appropriate DC/DC converter based on this value further optimizes cost-effectiveness. In this study, the structure depicted in Fig. 1c is selected as the system’s topological configuration, and all subsequent research is conducted with this structure as the foundation.
The configuration presented in Fig. 1d offers notable advantages. It allows for highly flexible adjustment of the output power from the two power sources. By precisely controlling the duty ratios of the two DC/DC converters, the output powers of both the fuel cell and the lithium battery can be effectively regulated. This control mechanism is straightforward to implement and ensures excellent operational stability. Nevertheless, its drawbacks are equally pronounced. The concurrent utilization of two DC/DC converters elevates the system’s structural complexity to a considerable degree. This increased complexity not only amplifies energy losses during the power transmission process but also diminishes the overall operational efficiency of the system. Additionally, it leads to a substantial surge in costs. Consequently, this topological design is only a viable option when there are extremely stringent requirements for maintaining the stability of the load bus voltage.
A low temperature PEMFC is typically operated at a temperature of 60°C–80°C. Air and hydrogen are supplied to the cathode and anode sides of a PEMFC, respectively, and hydrogen atoms are split into protons and electrons by means of a catalyst layer. The protons permeate through the membrane and reach the cathode while the electrons, and oxygen molecules generate water and waste heat at the cathode. The output voltage of a single fuel cell can be defined as follows [25]:
where
where Tst is the stack temperature; R is the gas constant, generally 8.314 J/(kg·K);
To simplify the model, the temperature distribution inside the stack is assumed to be uniform, and the calculation of the heat generation model of the fuel cell stack can be described as follows [26]:
where Qtot represents the total energy generated by the electrochemical reaction; Qin and Qout represent the energy of the input and output gas, respectively; Qcl represents the heat taken away by the cooling water; Qamb represents the heat exchange between the surface of the stack and the environment; Pst represents the electric power of the stack; mst represents the mass of the stack; cp,st represent the average specific heat capacity at constant pressure of the stack; Tst represents the temperature of the stack.
The total energy Qtot generated by the electrochemical reaction can be calculated by multiplying the molar flow rate of hydrogen participating in the reaction and the enthalpy of hydrogen by the following formula:
where ΔH represents the enthalpy of hydrogen combustion;
To verify the accuracy of the fuel cell voltage model, the polarization curve obtained from the voltage model under steady-state conditions is compared with the experimental results in [27], as shown in Fig. 2. The PEM fuel cell with active surface area of 7:2 × 7:2 cm was used for all experiments, and the details of cathode, anode, membrane materials as well as the fuel cell test process and steps, can be referred to in Ref. [27]. Moreover, the details of the parameters of the PEMFC model for simulation is also available in Ref. [28], and not repeated here. As can be seen from the figure, the average error between the simulation result and the experimental result is 1.33%, so it can be considered that the fuel cell model has sufficient accuracy.
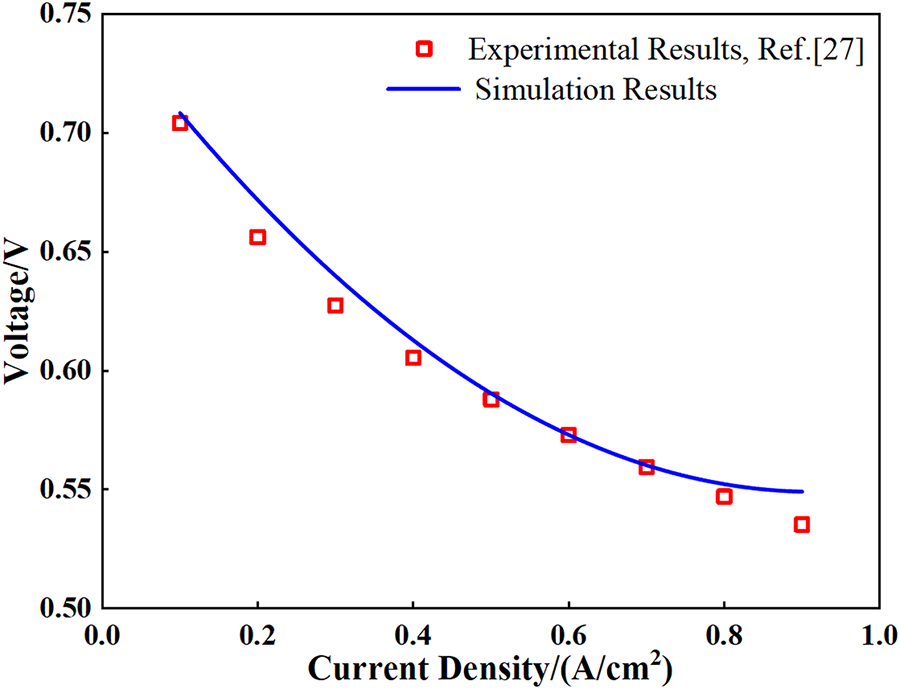
Figure 2: Polarization curve for fuel cell model validation [27].
Li-battery is regarded as the main power source for its high energy and power density, long life and environmental protection. It is widely used in many industries, especially in portable electronic equipment, electric vehicle and battery energy storage equipment. Considering that the equivalent circuit can realize the identification experiment of model parameters and is convenient to analyze the mathematical model, the equivalent circuit model is used to simulate the characteristics of lithium battery in this paper.
The open-circuit voltage (Vocv) and the resistance (Rint) of the lithium battery are determined by the experimental data and are applied to the model by interpolation. The working current and working voltage of lithium battery can be expressed as [29]:
where Vocv is the open-circuit voltage of the lithium battery; Ibat is the current of the lithium battery;
The open-circuit voltage (Vocv) and the resistance (Rint) of the lithium battery are related to the state of charge (SOC) of the battery. The specific determination is based on the characteristic data of the lithium battery measured in the experiment.
where Rch represents the lithium battery charge resistance; Rdis represents the lithium battery discharge resistance; SOC represents the state of charge of the lithium battery.
The state of charge (SOC) and lithium battery efficiency η can be expressed as [29]:
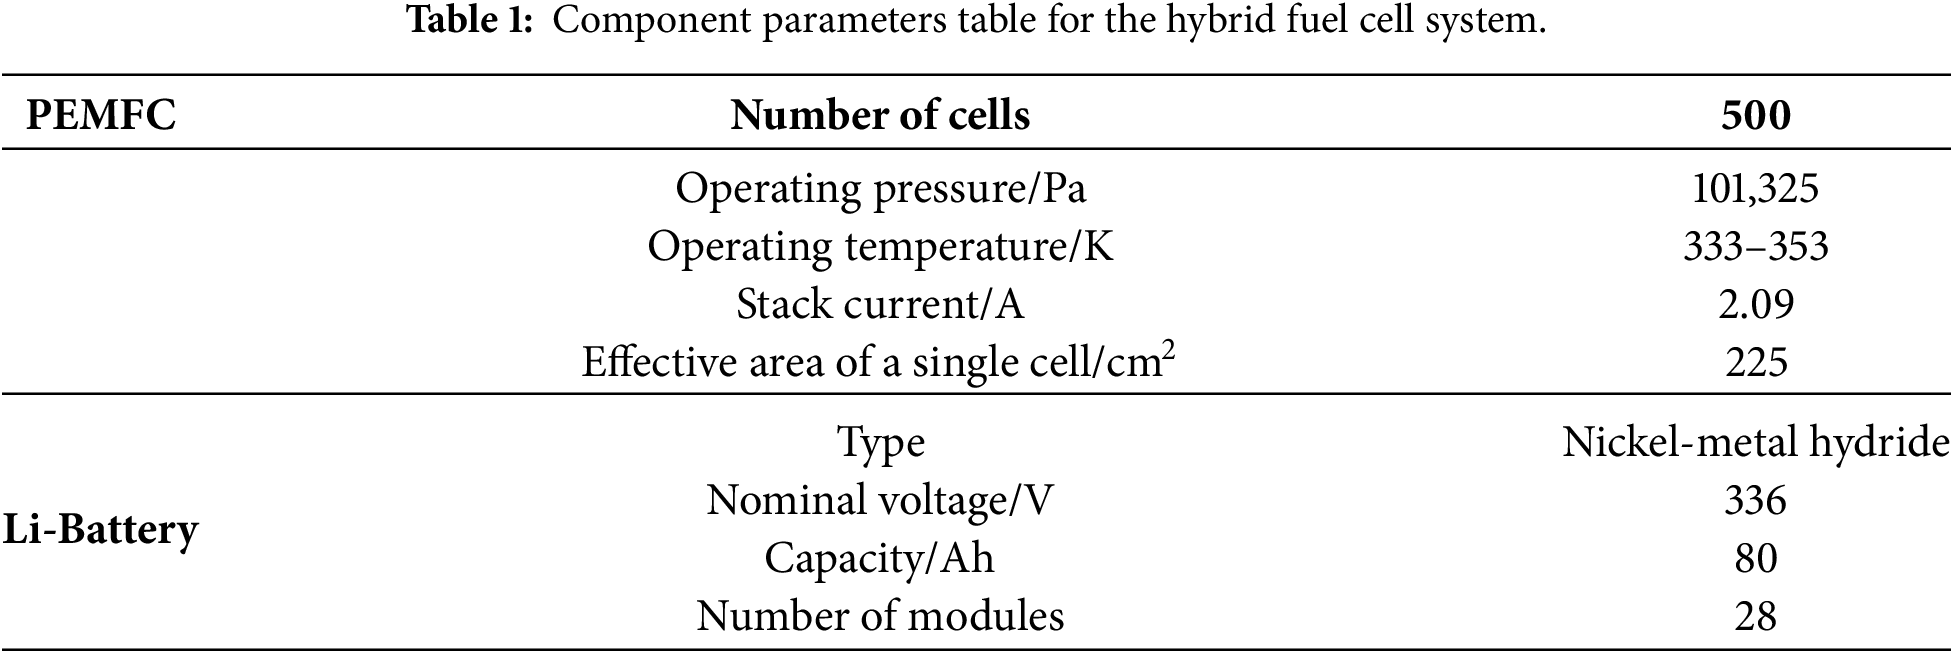
where SOCini represents the initial state of charge of the battery, i.e., the initial electric quantity of the battery; Q represents the battery capacity; η represents the charging and discharging efficiency of the lithium battery. The details of the lithium battery model can be found in Ref. [17]. The details parameters of the hybrid fuel cell system can be found in Table 1.
Because the output voltage of the fuel cell varies greatly with the current and may not match the bus voltage when used with lithium battery, it is necessary to connect a DC/DC converter at the back end of the fuel cell to stabilize the voltage of the fuel cell and regulate the output power of the stack. There are various types of DC/DC converters, which can be divided into boost type, buck type and buck/boost type. According to the voltage change relationship, and can be divided into isolated type and non-isolated type according to the input/output relationship. since the fuel electricity herein. The pool output voltage is approximately 500 V, whereas the DC motor is rated at 220 V, so a Buck-type DC/DC converter is required to reduce the output voltage for normal operation of the motor.
The lithium battery needs to determine the charging and discharging state according to the required power. When discharging, the lithium battery outputs power to the outside, and when charging, the fuel cell inputs power to the lithium battery, so the lithium battery needs to be connected to the bidirectional DC/DC converter. Since the voltage of the lithium battery is related to the SOC of the battery, if the SOC of the battery is small, the voltage may be lower than the rated voltage of the DC motor, so the buck-boost DC/DC converter is selected.
3 Different Control Models and Control Effect
The PID control algorithm is an algorithm that combines proportional control with additional integral and derivative responses to help the system automatically compensate for variations, reading the sensor information and controlling the actuator output, tuning the PID controller at different Kp, Ki and Kd to obtain the best results for the system. Traditional PID controller is widely used in industrial process control because of its simple structure, high efficiency, and suitability for linear and nonlinear systems. The structure diagram of PID controller is shown in Fig. 3.
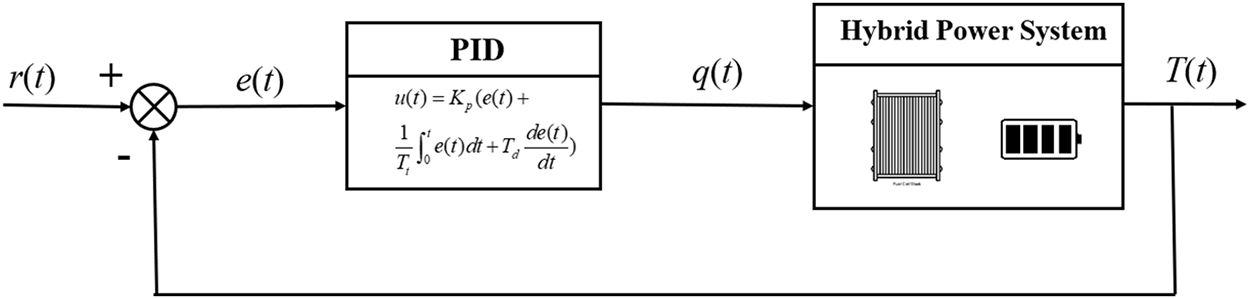
Figure 3: Heat management PID control schematic diagram of hybrid powertrain.
In Fig. 3, e(t) represents the error between the measured value and the given value, and its calculation formula is:
where T(t) represents a time-varying value of the battery temperature; r(t) represents a temperature set value.
In an industrial process, the governing equation of an ideal PID controller for a continuous control system is:
where Kp is the proportional gain; Tt is the integral time constant; Td is the differential time constant; u(t) is the output signal of the PID controller.
The above equation can be converted to:
where the expression of the integral coefficient and the differential coefficient is:
where Ki is the integral coefficient; Kd is the differential coefficient.
The PID controller is one of the simplest and most effective controllers, but it is not always applicable in practical industrial process. For example, for nonlinear system, the internal parameters of nonlinear system vary with the operating state of the system, and the control result of traditional PID cannot keep the system running in a relatively stable state. If the PID parameters are set by the internal parameters of the original system, the control result can meet the requirements when the internal parameters of the system change relatively little; otherwise, the originally set PID parameters will no longer meet the system control, and the most common case is that the control result has a steady-state error. How to solve this problem is an obstacle in the industrial process.
The fuzzy control is different from the traditional quantitative mathematical model. It is based on fuzzy mathematics and uses fuzzy theory to tune the three parameters of the PID controller, namely KP, KI and KD, to enable the system to achieve good control effects,
where KP0, KI0 and KD0 are the PID gains before adjustment; ΔKP, ΔKI and ΔKD are the calculated gain changes. The control principle of hybrid power system based on FPID control in this paper is shown in Fig. 4. It can be found that the FPID controller includes three parts, the fuzzifier, the fuzzy inference engine and the defuzzifier blocks. Compared with the traditional PID controller, the FPID controller has many advantages.
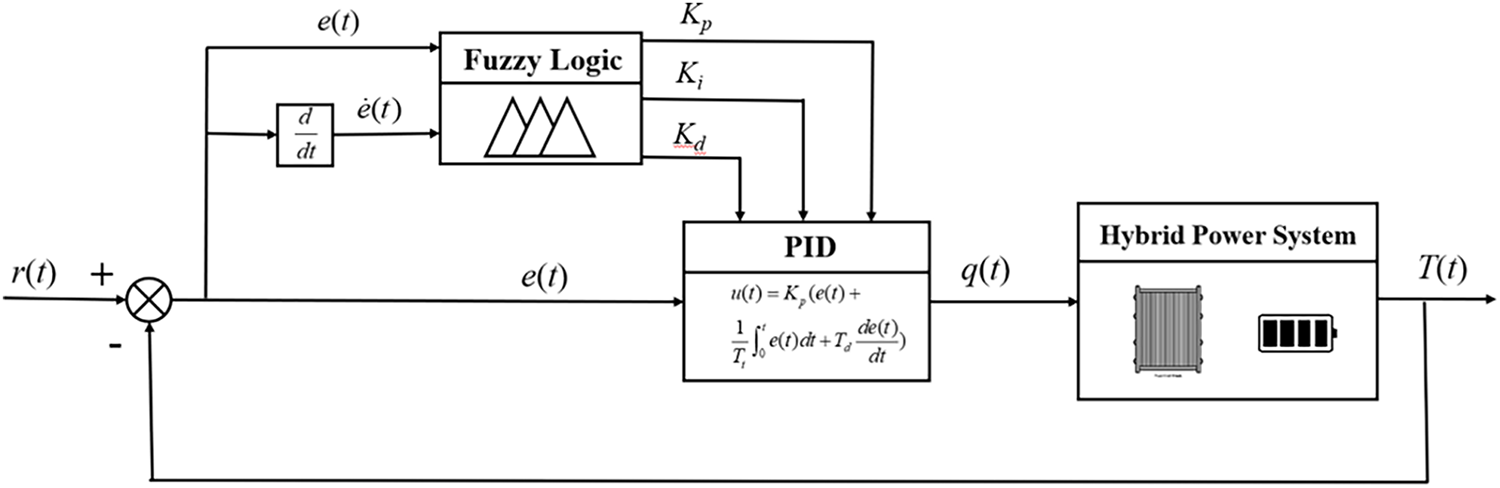
Figure 4: Hybrid system thermal management with the FPID control schematic.
For the FPID controller, it not only calculates the error
The working principle of FPID controller is easy to understand, and the detailed working principle is as follows: (1) when
The optimum operating temperature of the fuel cell is 60°C–80°C, i.e., 333–353 K, and the stack temperature usually does not exceed 90°C, i.e., 363 K. According to experience, the fuzzy variation domain of temperature error the error
Although fuzzy controllers can achieve good control effects, their design is highly challenging due to the large number of parameters involved and the lack of effective tuning methods. As an excellent optimization algorithm, the artificial bee colony (ABC) has been proven to better accuracy and robustness, and it can efficiently tune fuzzy controllers. Based on this, this section will adopt the ABC algorithm to optimize the parameters of the fuzzy controller, so that the fuzzy-PID control method with artificial bee colony algorithm (ABC-FPID) can better maintain the stability of the stack temperature. The ABC algorithm had been used to study the aerosol particle size distribution in our previous work [30]. For PEMFC system, the ABC algorithm is used to optimize the five parameters of the fuzzy controller: the quantification factor of error
During the algorithm, each food source represents a possible solution to the concerned problem and the abundant degree of the corresponding nectar implies the quality of the solution represented by the fitness value. So, the bee colony usually divides to two equal parts. One half is the employed bees whose number is the same as the number of food source, which make sure exactly one employed bee for every food source. The other half is the onlooker bees. At first, the food source positions
where SN denotes the number of food source; Nn denotes the dimension of unsolved problem;
where
where
where
Comparing the
If a position of food source cannot be improved further after a predetermined number limit of cycles, the food source will be abandoned. Assume that the abandoned source is
where
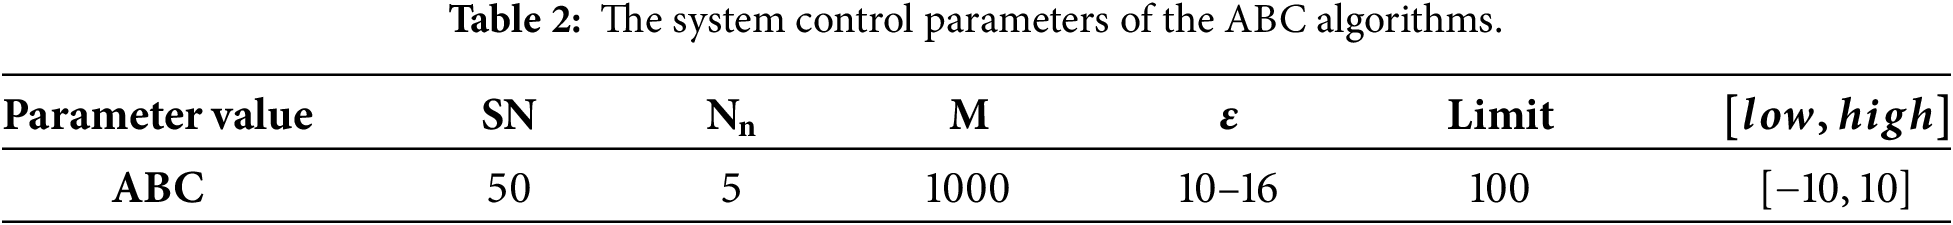
Table 2 lists the system control parameters for ABC algorithms. The SN denotes the number of food source in the algorithm. The Nn denotes the dimension of unsolved problem in the algorithm. The M denotes the maximum iterative number in the algorithm. The e denotes the tolerance of the fitness function in the algorithm. The limit denotes the limit number for employed bee in the algorithm. The
3.4 Control Effect of Different Control Methods on Performance of Fuel Cell Stack
3.4.1 Dynamic Temperature Responses of the Stack
To compare the dynamic characteristics of fuel cell stacks under different control methods, the stack temperature changes regulated by different control methods during power variations are studied. Fig. 5 bellow show the dynamic temperature responses of the stack with FPID and ABC-FPID control methods under model parameters change. It can be observed that during the current variation process, when the target temperature set at 343 K, the maximum overshoot obtained by FPID control method is about 1.5 K and the time to reach stability is approximately 25 s. The maximum overshoot obtained by ABC-FPID control method is about 0.3 K and the time to reach stability is approximately 10 s. The ABC-FPID control method shows satisfactory dynamic regulation effect.
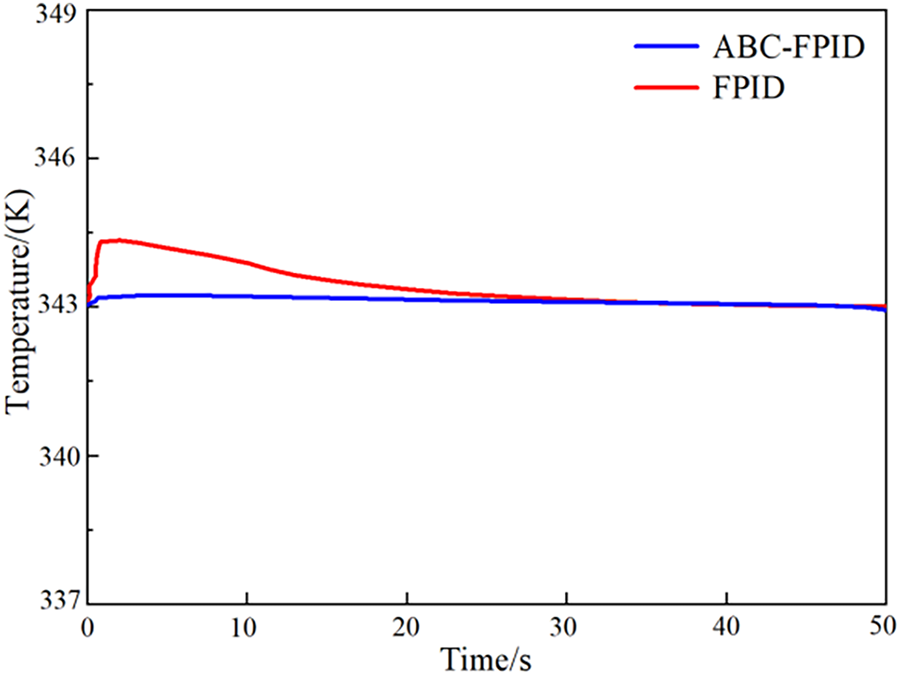
Figure 5: The dynamic temperature responses of the stack with FPID and ABC-FPID control methods under model parameters change.
3.4.2 Performance of Fuel Cell Stack under Load Power
One of the keys to ensure the stable operation of the fuel cell is to ensure that the fuel cell works within a proper temperature range, and the catalyst of the stack will not lose activity or even damage the stack due to the temperature rise of the stack. During the working process of fuel cell, the heat dissipation requirement of the stack is not constant, and usually changes with the change of the load power of the stack, so how to dissipate the heat generated by the electrochemical reaction of the stack in time so that the working temperature of the stack does not change greatly is particularly important for maintaining the stable operation of the stack. In this paper, the characteristics of FPID control method and ABC-FPID control method on stack temperature are analyzed when the load power demand changes. Fig. 6a shows the load power demand curve for the simulation time of 1800 s.
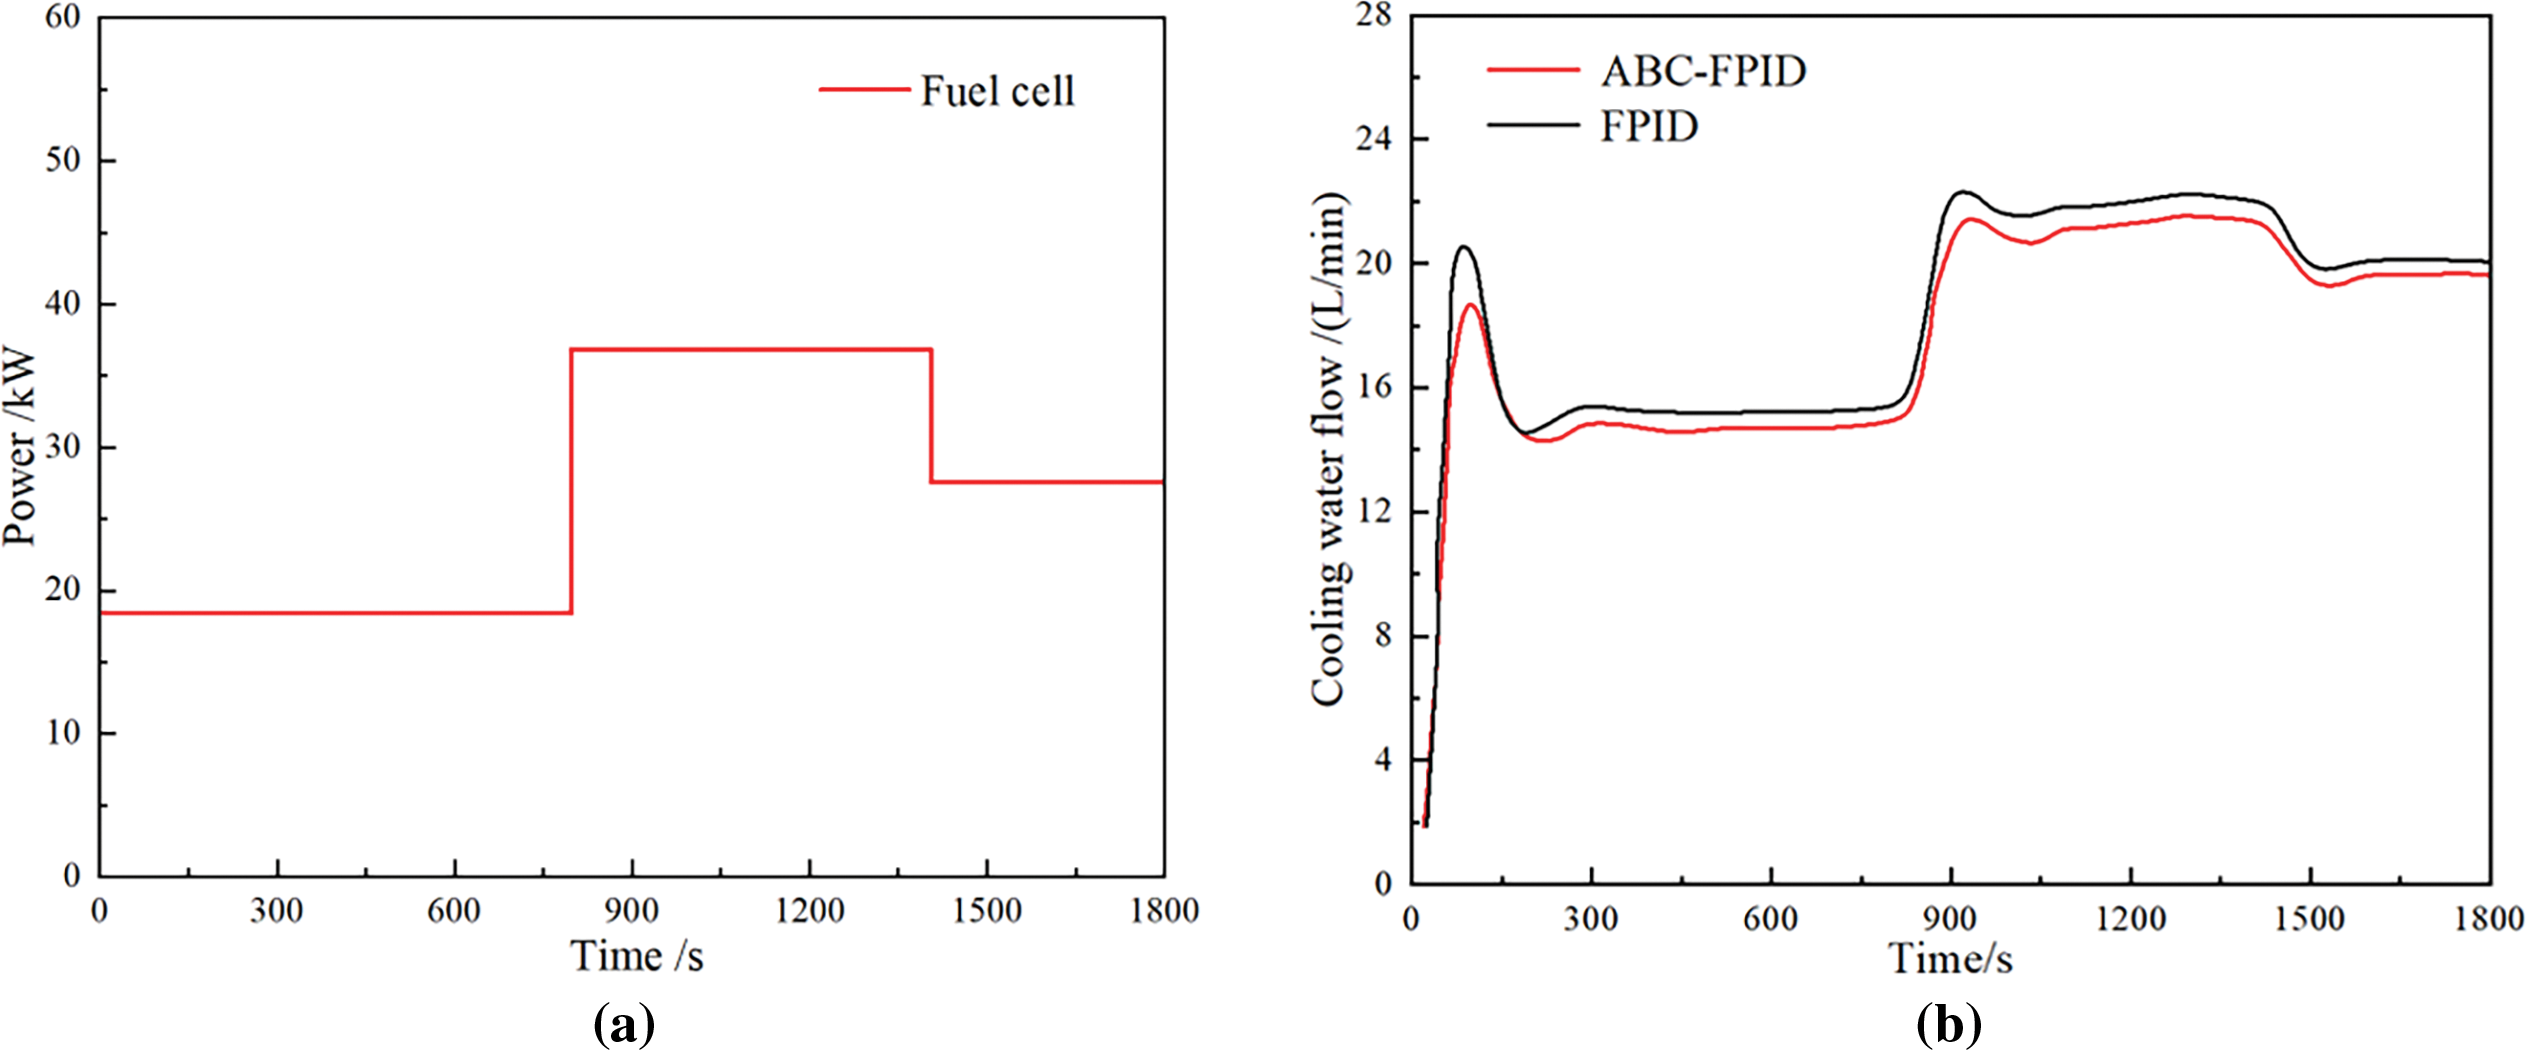
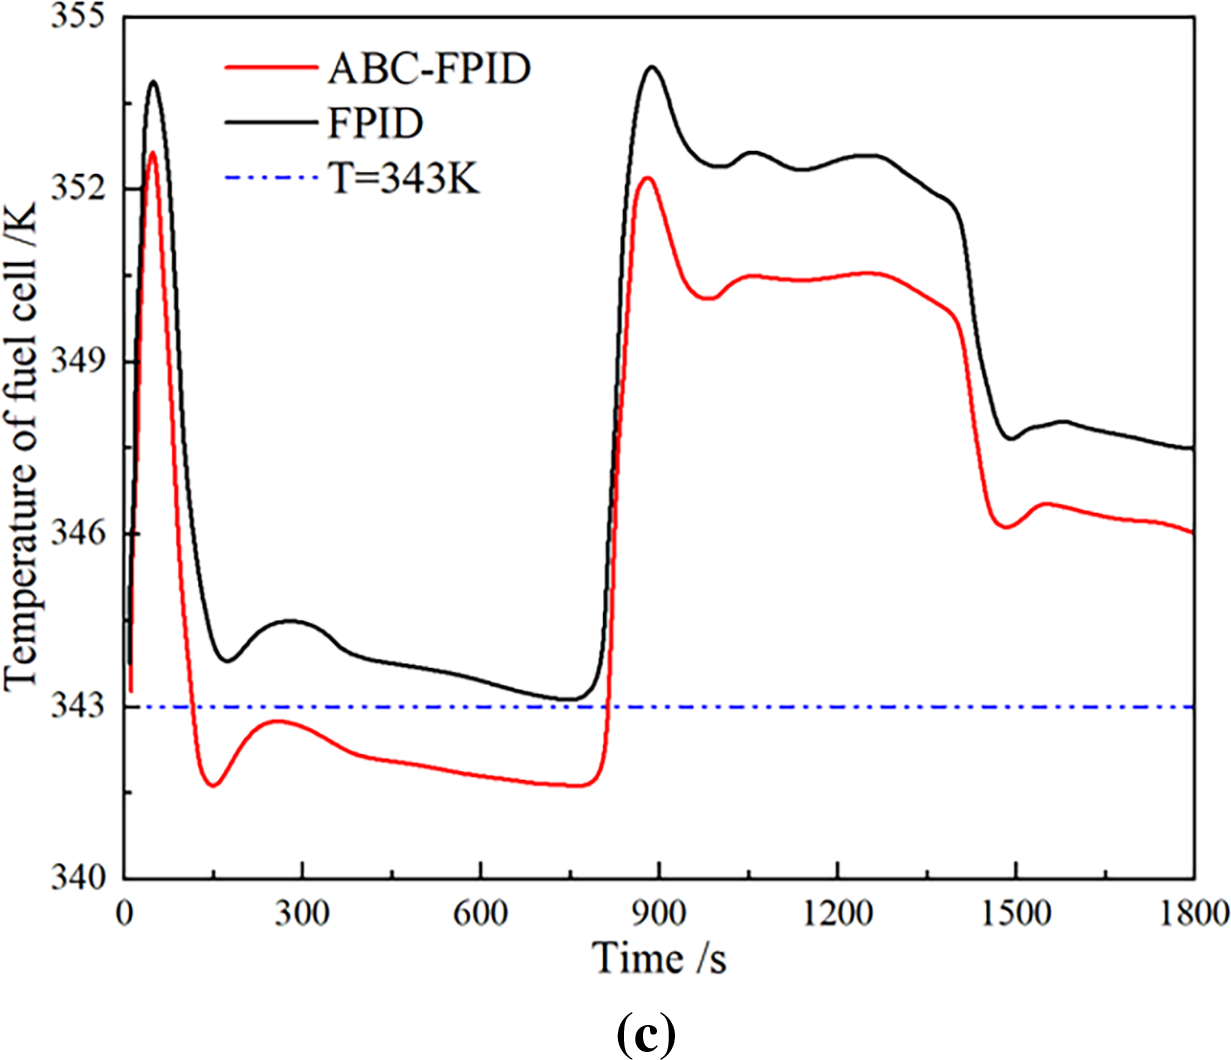
Figure 6: The performance of fuel cell stack under load power by different control methods: (a) Variation curve of fuel cell load power, (b) variation curve of cooling water flows, (c) fuel cell temperature under abrupt load obtained
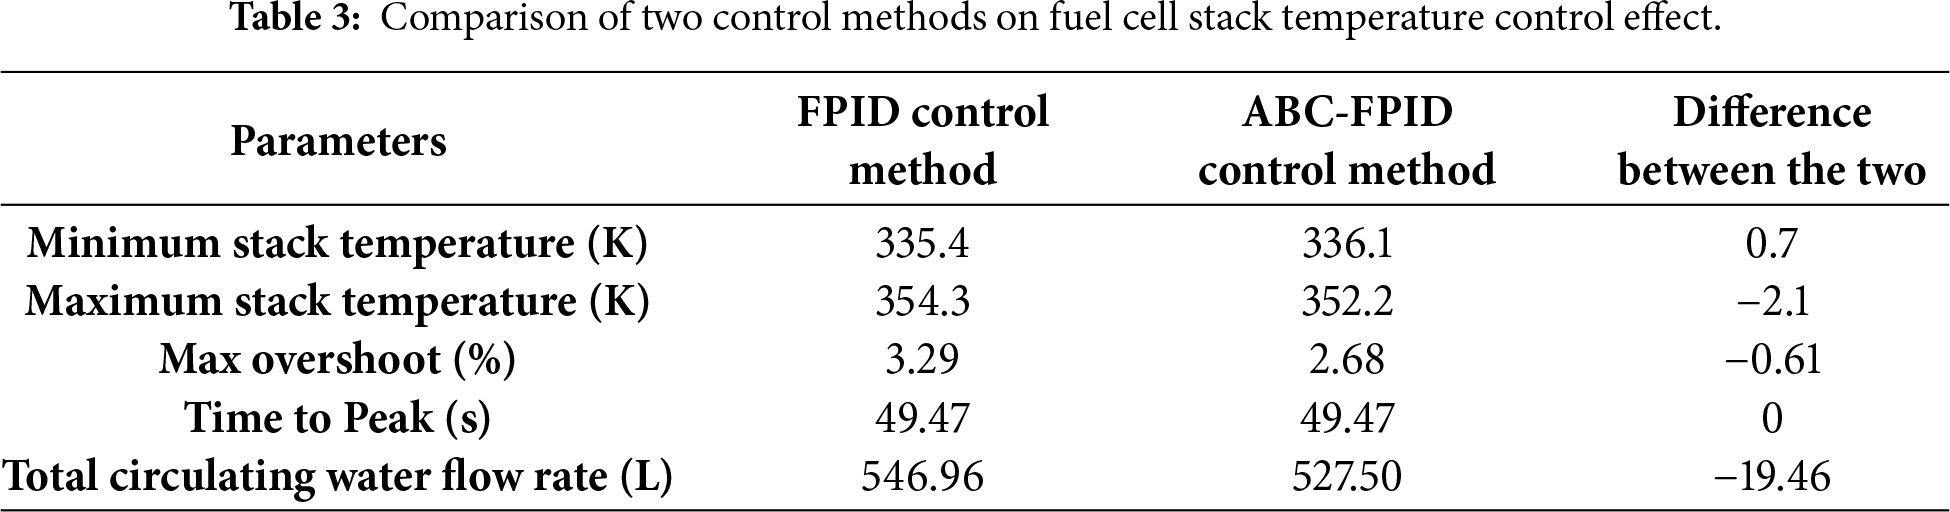
Fig. 6b is the change curve of cooling water flows under FPID control method and ABC-FPID control method. Fig. 6c is the change of fuel cell temperature with time under the two control methods. The black line represents cooling water flow and stack temperature under FPID control method, and the red line represents cooling water flow and stack temperature under ABC-FPID control method. Table 3 shows the results of fuel cell stack temperature regulation under two control models which are shown in Fig. 6. The fuel cell stack temperature varies from 335.4 to 354.3 K under the FPID control model, and the maximum temperature exceeds 353 K (80°C). The stack temperature varies from 336.1 to 352.2 K under ABC-FPID control method, and the stack temperature under ABC-FPID control method is lower than that under FPID control method. Within the entire operating envelope of the fuel cell, when using FPID control, the maximum overshoot of the control model is 3.29%, while that of the ABC-FPID control model stands at 2.68%—a reduction of approximately 0.6% compared to the former. At the same time, by comparing the usage of cooling water, it is found that the applicable amount of cooling water under ABC-FPID control model is less than that under FPID control model. From the whole working envelope, the circulating water flow rate under ABC-FPID control strategy is 19.46 L (about 3.6%) less than that under FPID control measurement, which indicates that ABC-FPID control method is more beneficial to the utilization of cooling water resources at this stage. To sum up, the ABC-FPID control method is superior to FPID control method in the stack average temperature, temperature control range and reasonable utilization cooling water.
4.1 Power Load Curve and Evaluation Index
This paper assumes multiple instantaneous high-power changes in power demand during a flight cycle with start-stop midway, as shown in Fig. 7. The maximum load power is about 60 kW, and the maximum SOCmax and minimum SOCmin of the lithium battery SOC are set to 0.8 and 0.2, respectively. To further assess the control performance of the ABC-FPID control method, the hybrid system efficiency is defined as the ratio of the load power and the heat value produced by hydrogen consumption to the output power of the lithium battery. The system efficiency calculation formula is as follows:
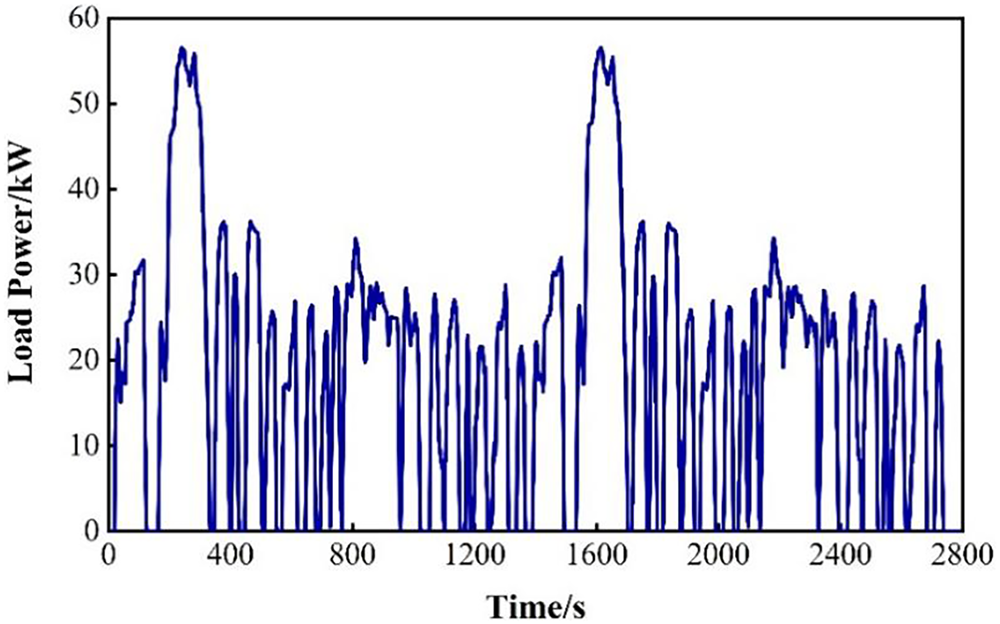
Figure 7: Demand load power curve.
where
4.2 Power Matching Strategy of Hybrid Power System
In this paper, the PEMFC is taken as the main power source of the hybrid power system, and the Li-battery is taken as the auxiliary power. The energy balance of the system can be expressed as:
where Pfc represents the output power of the fuel cell; Pbat represents the output power of the Li-battery; Pload represents the load power; Ploss represents the power loss, and the heat carried away by the cooling water in the fuel cell and the balance of plant (BOP) are considered here.
Pfc and Pbat need to meet
Fuel cell output power Pfc is calculated by Li-battery SOC and power demand Pload, and the calculation formula is as follows [29]:
where SOCref is the reference state of charge of the lithium battery; SOCmax and SOCmin signify the peak and trough values of the state of charge for the Li-battery, which are set as 0.2 and 0.8, respectively; Pfc_fuzzy represents the fuel cell power controlled by the fuzzy logic.
Fig. 8 is a block diagram of the energy management process. To avoid inefficient operating conditions and make the hybrid system operate more efficiently. The maximum value
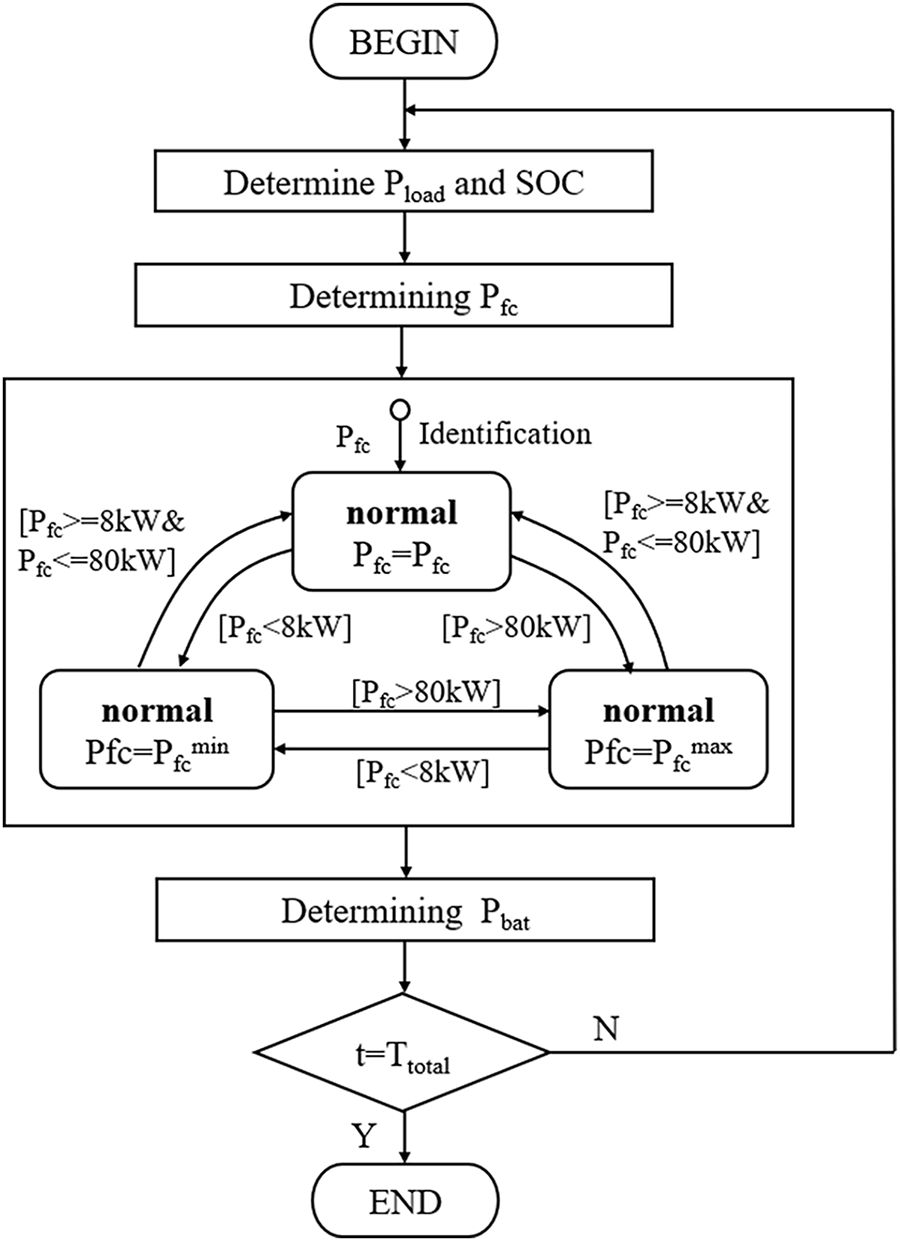
Figure 8: Flowchart of energy management processes.
The procedure for simulation is as follows: (1) the power demand, energy management and control strategy, and fuel cell stack temperature control requirements are determined; (2) with the goals of optimizing the stack temperature and stabilizing the fuel cell output power, the ABC-FPID control method is finally adopted to realize the regulation of the hybrid power system under variable working conditions, thereby achieving the optimization of fuel cell output performance, system power, hydrogen consumption rate, and other indicators. The varied parameters were the output power of the fuel cell, the output power and SOC of the lithium battery, the hydrogen consumption status, the actual temperature of the stack, etc. The fixed parameters were the power demand, energy management and control strategy, fuel cell stack temperature control requirements.
The numerical simulation results of power matching of fuel cell hybrid powertrain based on ABC-FPID control method are shown in Fig. 9. Fig. 9 shows the simulation curve of ABC-FPID control method, mainly including the curves of power distribution, lithium battery SOC and system efficiency. Fig. 9a is a power distribution curve in which the blue line represents the required power, the red line represents the fuel cell output power, and the green line represents the lithium battery output power. The fuel cell output power varies in the range of 20–40 kW, and the two peak values respectively correspond to the high load in the required power. That is, when the required power is high, the fuel cell can increase the output power by increasing the amount of hydrogen entering, to meet the load demand. During these two peaks, the fuel cell output increased to 40 kW. In the rest of the time except the two peaks, the fuel cell power fluctuates up and down around 19 kW, and the floating curve also corresponds to the actual output power.
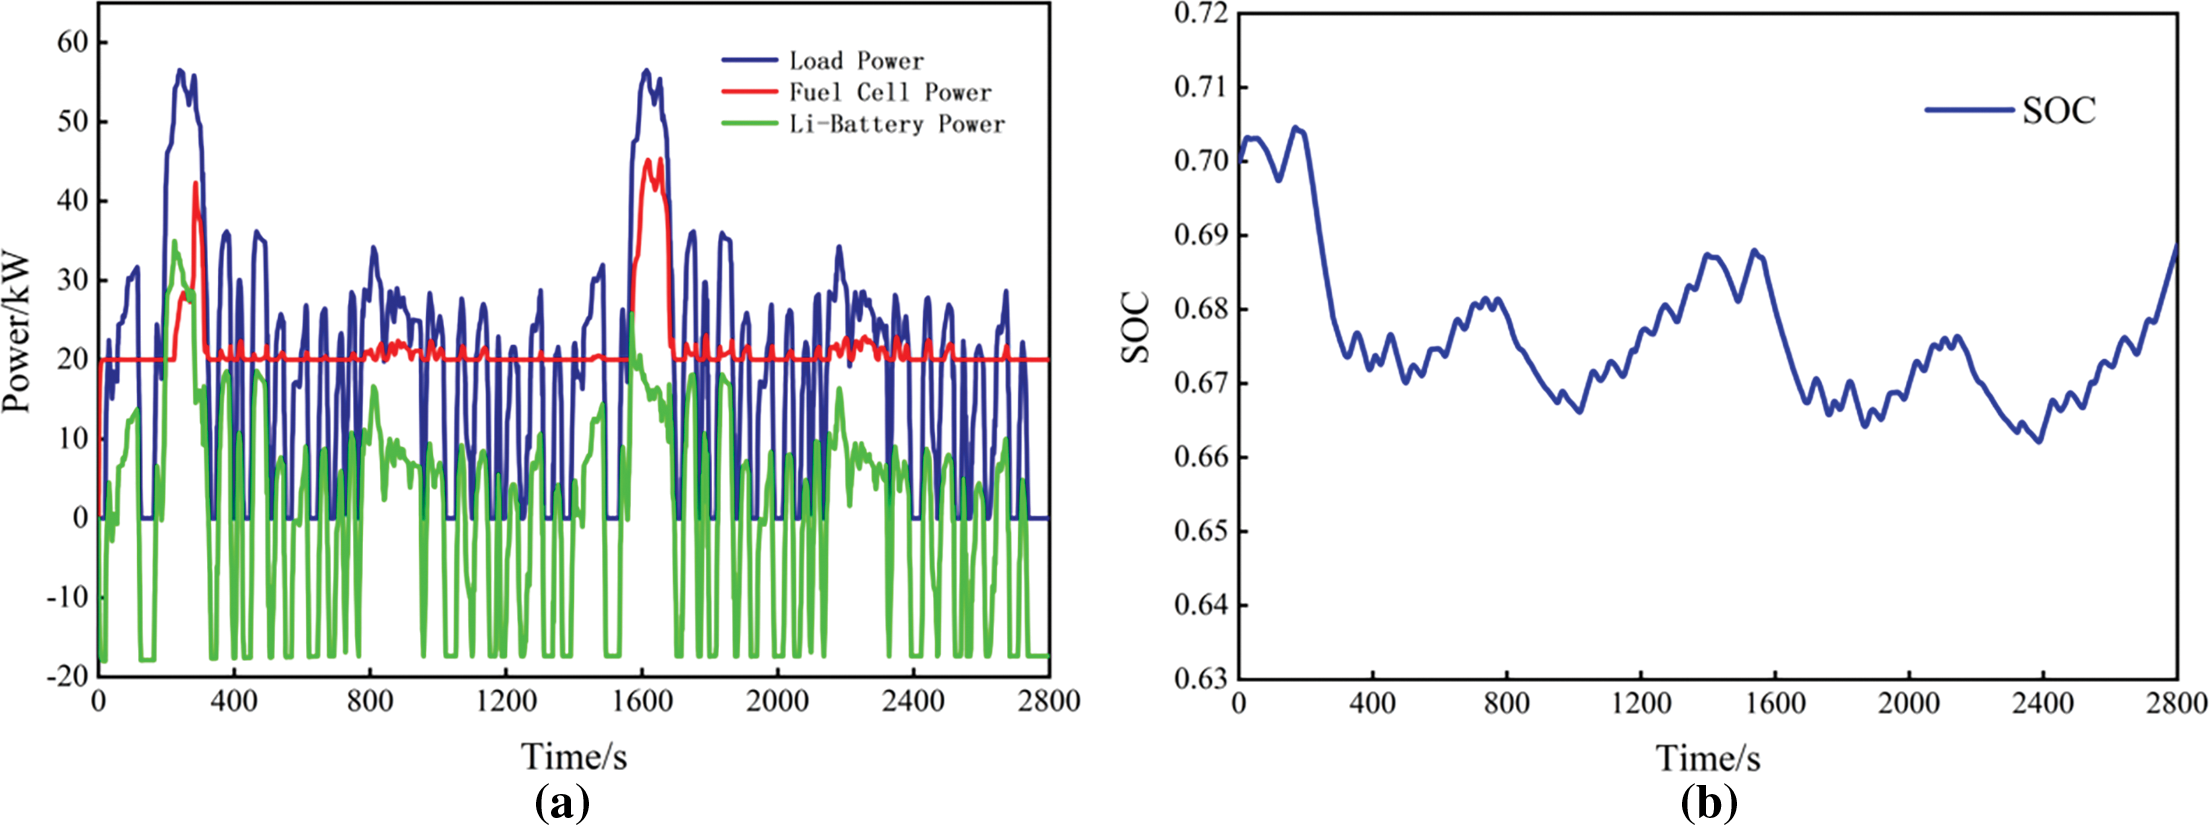
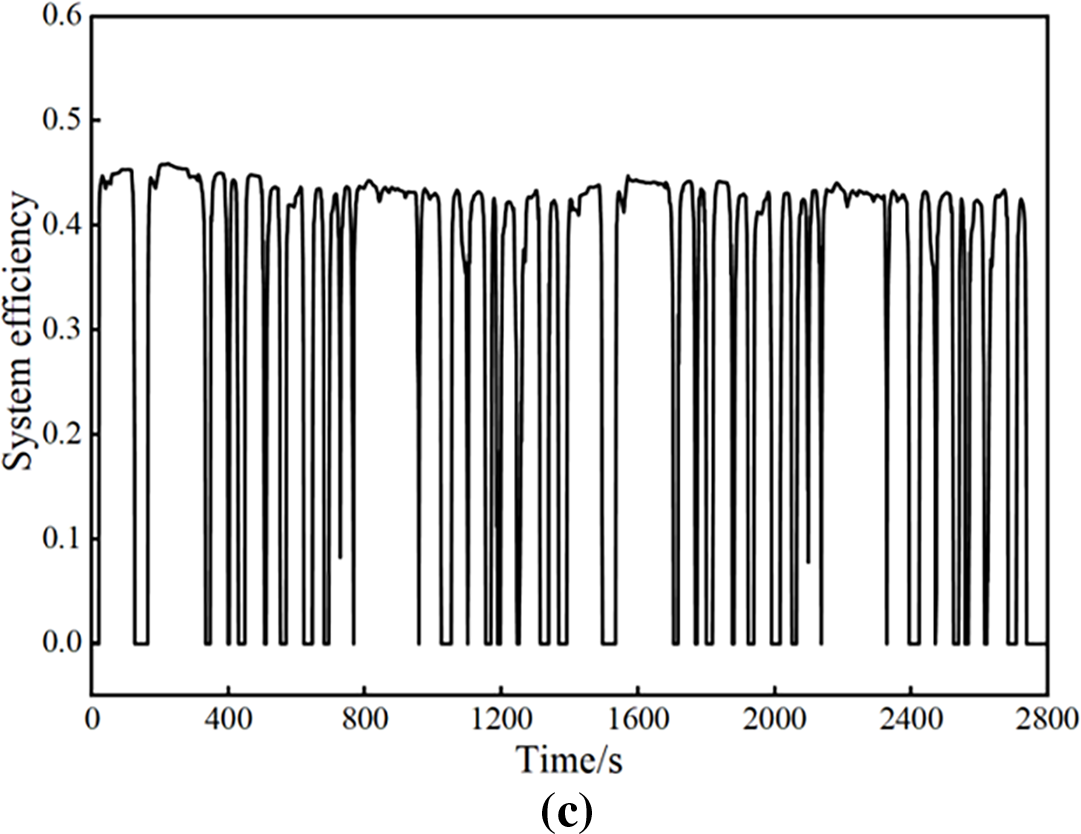
Figure 9: Simulation results of hybrid power system by ABC-FPID control method: (a) curve of power distribution, (b) curve of SOC of Li-battery, (c) curve of system efficiency.
The power of lithium battery varies from −20 to 35 kW. The fuel cell power is stable in most cases. The difference between the power and the required power needs to be supplemented by the output power of the lithium battery. At the same time, when the required power is large, the power of the fuel cell increases slowly and the dynamic response is poor, while the dynamic response of the lithium battery is faster, which can supplement this deficiency and play the role of “peak clipping and valley filling”. For example, under two peak powers, the output power of the lithium battery needs to be increased quickly to meet the load demand in a short time. When the output power of the fuel cell reaches the maximum, the output power of the lithium battery can be gradually reduced, and the excess power of the fuel cell can also be used for charging the lithium battery. Therefore, the power conversion of the lithium battery in the figure is fast, and the fluctuation is large, and the purpose is to meet the change demand of the load power.
Fig. 9b shows the SOC curve of the lithium battery. The SOC of the lithium battery varies within the range of 0.65 to 0.71, which meets the optimal operating range of the lithium battery. When the SOC of the lithium battery decreases, it means outward discharge. For example, it is about 250 s. Currently, it is the first load peak, and the demand power is large. The lithium battery is discharged outwards to meet the load power. Therefore, the SOC of the lithium battery decreases, and the SOC reaches the first trough near 400 s. Subsequently, the load power decreases, and the output power of the fuel cell can meet the load demand, so the lithium battery shifts to a state of charge, and the SOC gradually increases. A second load peak also occurs at 1600 s, where the lithium battery also needs to be discharged and the SOC decreases. Finally, after the load power demand is reduced, the fuel cell output power is greater than the load power demand, the excess power is stored in the lithium battery, and the SOC gradually increases. The results also verify the finding in Ref. [31] that accurately clarifying the correlation between the state of charge (SOC) and temperature of lithium-ion batteries is of great significance for ensuring the safe operation of lithium-ion batteries and improving the robustness of “peak shaving and valley filling” strategies.
Fig. 9c is a fuel cell hybrid system efficiency curve where the efficiency varies between 0 and 1, with an efficiency of 0 representing a load power of 0. It can be seen from the figure that the maximum efficiency of the hybrid system can reach 46.3%, and the average efficiency is 33.8%.
Fig. 10a shows the change curve of cooling water flow in the fuel cell hybrid power system under the ABC-FPID control method, and Fig. 10b shows the corresponding change curve of fuel cell temperature. When the stack is started, the heat dissipation of the stack is increased due to the sudden increase of the load demand, and at this time, due to the inertia of the system itself, the response of the cooling water flow is delayed, and the temperature of the stack has an increasing trend. The flow of cooling water reaches a large value at 50 s, and the temperature of the stack is well controlled. At 1580 s, the output power of the fuel cell is increased due to the increase of the load power demand. At this time, the electrochemical reaction in the stack will lead to more heat dissipation requirements. It is also necessary to increase the flow rate of cooling water to ensure the stable working temperature of the stack. However, due to the thermal inertia of the system, the cooling water is also delayed to reach the maximum value after a period. In general, although the thermal inertia problem of the hybrid power system cannot be avoided, the ABC-FPID control method proposed in this paper can still reasonably control the cooling water flow to ensure that the temperature of the fuel cell stack is within a reasonable range. The average temperature of the fuel cell is 345.4 K, and the average overshoot is 0.7%, meeting the operating temperature requirement of the fuel cell.
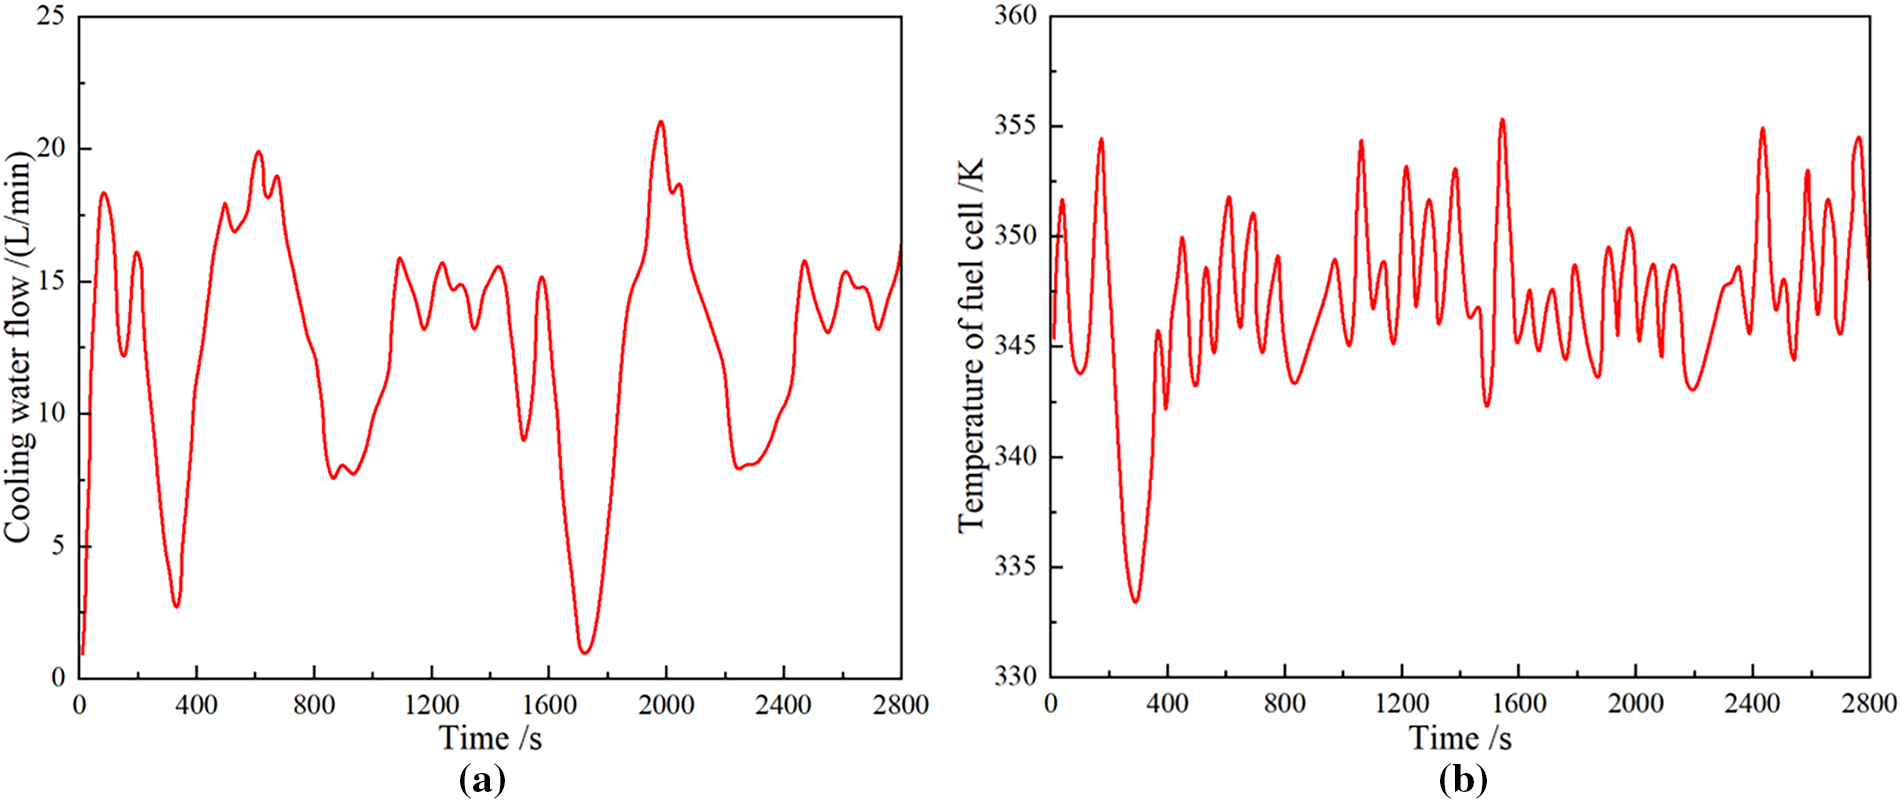
Figure 10: Simulation results of cooling water flow of hybrid power system by ABC-FPID control method: (a) curve of cooling water flow, (b) curve of fuel cell stack temperature change.
Fig. 11 shows the output results of fuel cell and lithium battery by ABC-FPID control method, including fuel cell voltage and current and lithium battery voltage and current. Fig. 11a shows the fuel cell voltage, which varies from 450–720 V. In 0–600 s, the fuel cell voltage gradually decreases from 720 to 480 V. After 600 s, the output voltage is stable at about 480 V. At 1600 s, the output voltage increases to 500 V to meet the load demand due to the increased power demand, and then the voltage gradually decreases and stabilizes at 480 V.
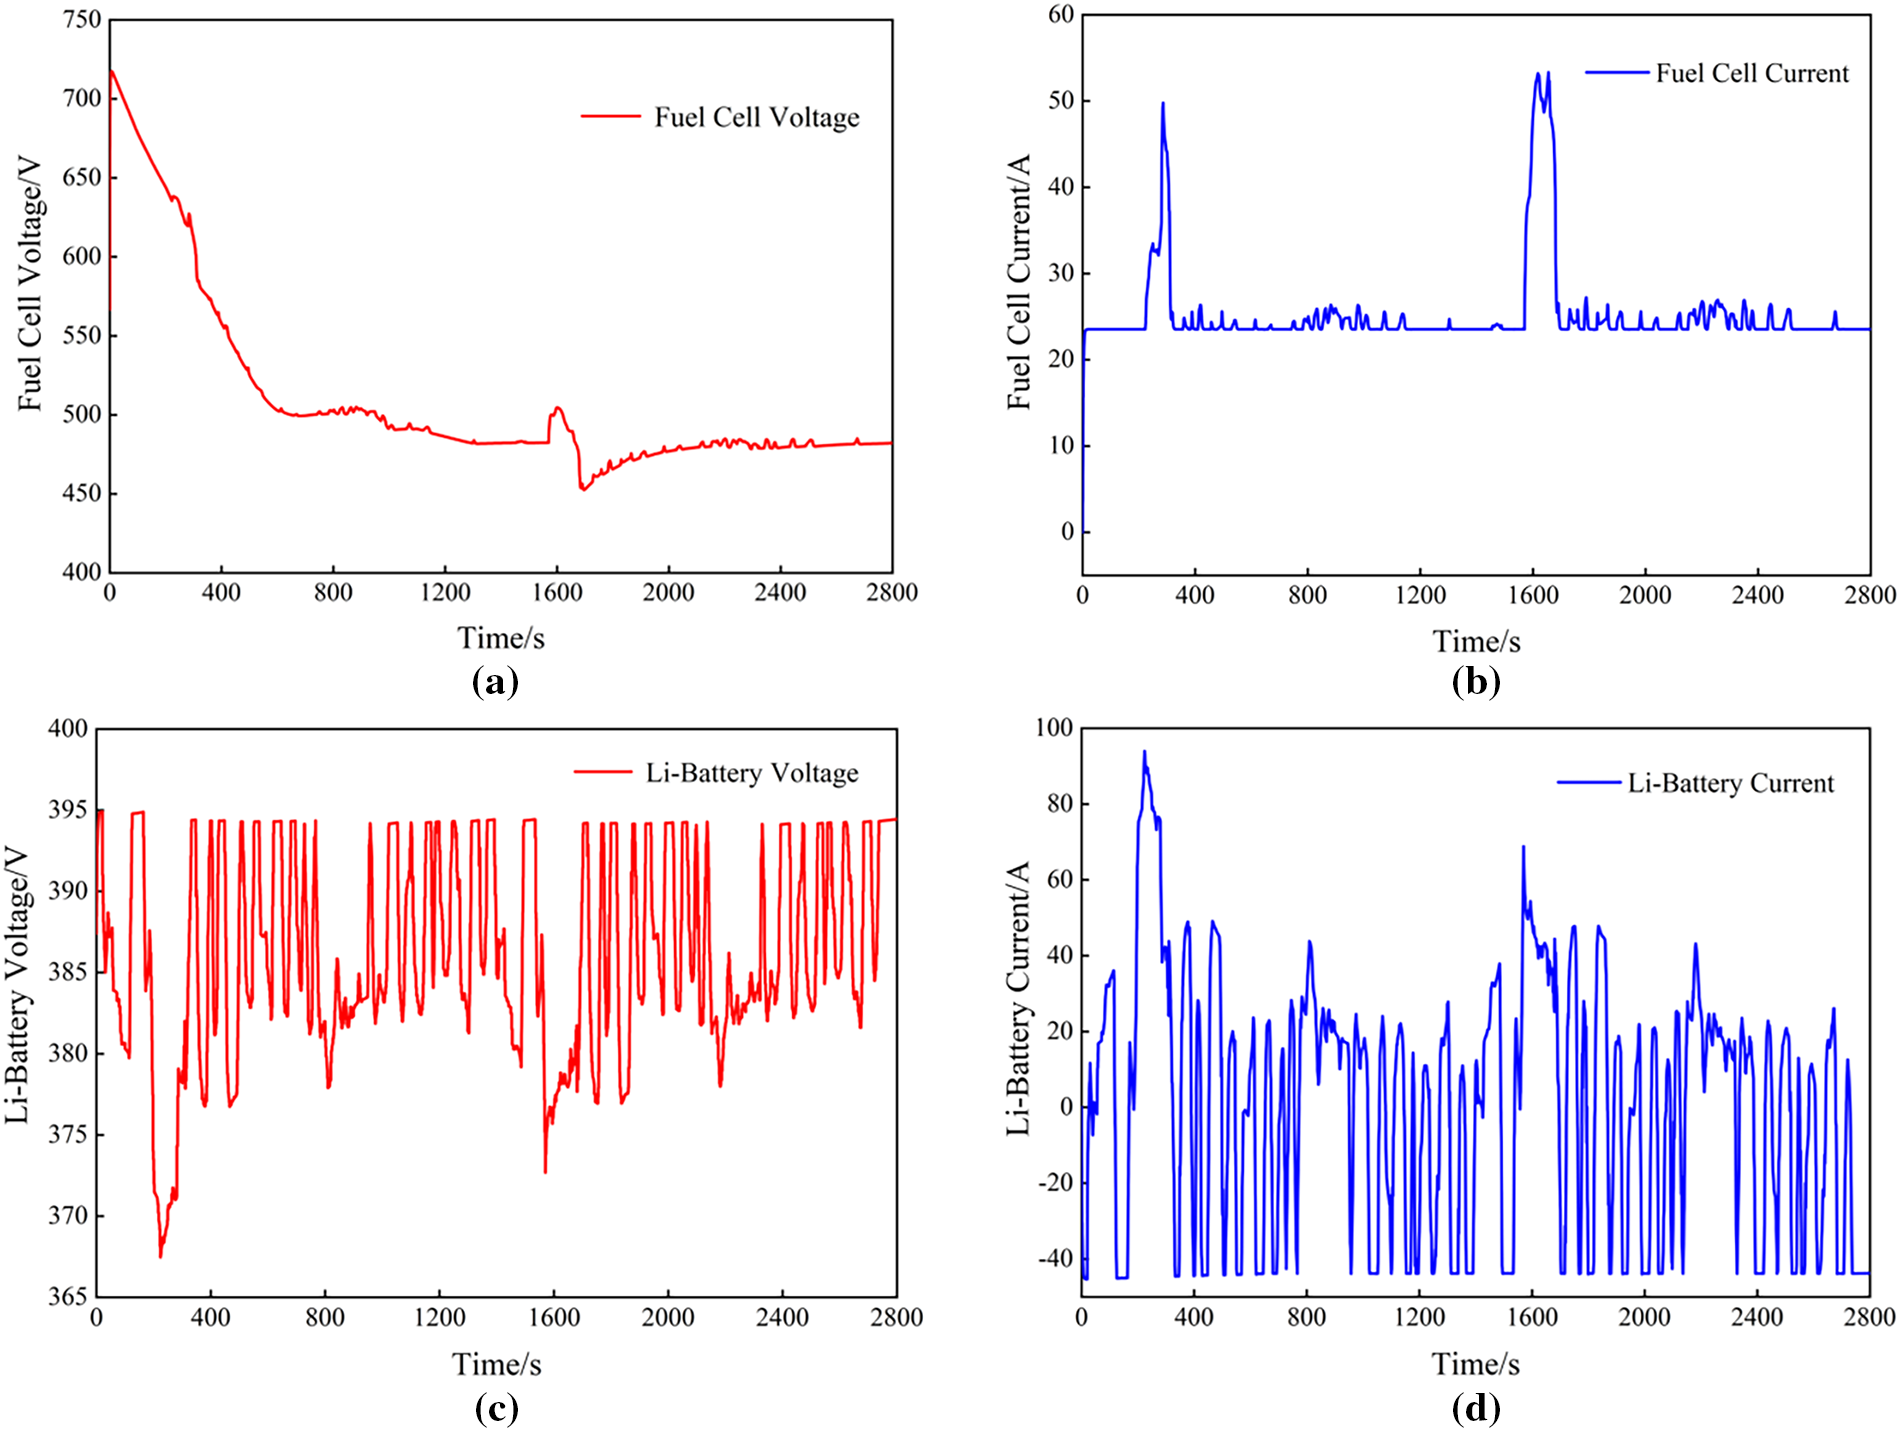
Figure 11: Simulation results of fuel cell and lithium battery by ABC-FPID control method: (a) fuel cell output voltage (b) fuel cell output current (c) Li-Battery output voltage (d) Li-Battery output current.
Fig. 11b shows the fuel cell current, which varies in the range of 20–55 A and stabilizes at about 23 A most of the time, where two peaks are experienced, corresponding to the peaks of 300 and 1600 s in the required power. At the same time, the change trend of the fuel cell current is the same as the change of the output power, because the control strategy of the fuel cell in this paper takes the current as the input and the voltage and the power as the output, so the output power is regulated according to the change of the current.
Fig. 11c is the lithium battery voltage, which varies from 365 to 395 V, and Fig. 11d is the lithium battery current, which varies from −50 to 100 A. Comparing the voltage and current variations of a lithium battery, they are almost symmetrical about the horizontal axis. This is because the voltage of the lithium battery is calculated according to the open-circuit voltage, current and impedance. The open-circuit voltage of the lithium battery is obtained according to the SOC state. The open-circuit voltage varies within the range of 370–395 V. The impedance can be divided into charge resistance and discharge resistance, which are also related to SOC. According to the formula, the current increases and the voltage decreases. The lithium battery part takes the power of the load required by the lithium battery as the input parameter, and takes the voltage and current as the output parameter, so the current is calculated according to the formula. Therefore, the lithium battery current is related to open-circuit voltage, power, and resistance, both of which are related to the SOC state. If the SOC does not change, the open-circuit voltage and resistance do not change, and the current of lithium battery is only related to power, so it can be seen from the figure that the change trend of current and output power is the same.
Fig. 12 shows the hydrogen demand of hybrid power system by ABC-FPID control method. The figure shows that the hydrogen demand of the fuel cell is kept at 0.18 kg/s for most time, and the average hydrogen demand is 0.192 kg/s in the whole working period, but two maximum values occur at 300 and 1600 s, respectively, and the maximum hydrogen demand is about 0.38 kg/s. The maximum values of the two hydrogen demand amounts correspond to two peak values in the required power, because the load power of the fuel cell is increased, and the amount of hydrogen gas introduced into the cell needs to be increased to meet the increase of the output power of the fuel cell, so the time corresponding to the negative power peak value is the time when the maximum hydrogen demand amount of the fuel cell appears. The output power of the fuel cell can be increased by increasing the amount of hydrogen introduced into the fuel cell, to meet the sudden change of load power, so the maximum hydrogen demand occurs at 300 and 1600 s.
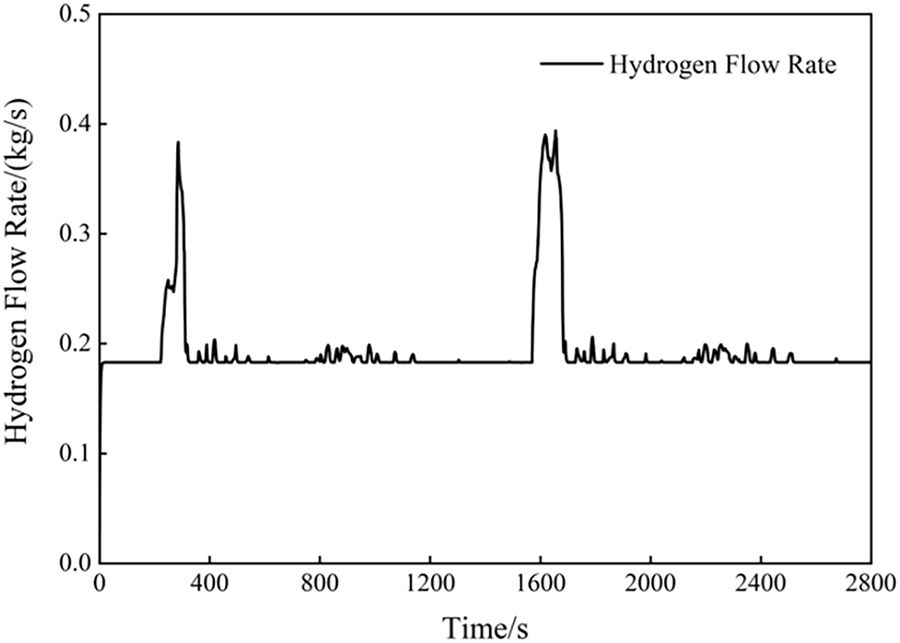
Figure 12: Hydrogen demand of hybrid power system by ABC-FPID control method.
The research objective of this article is to optimize the power matching of fuel cell hybrid power systems. The effects of the FPID control method and the ABC-FPID control method on the temperature control of the fuel cell stack are analyzed and compared. The main conclusions of this paper are as follows:
(1) Compared with the FPID control method, the fuel cell stack temperature overshoot under the ABC-FPID control method is reduced by about 0.6%, and the circulating water flow rate is reduced by 19.46 L.
(2) The research results of power matching of a fuel cell hybrid power system based on the ABC-FPID control method show that the output power of the fuel cell and lithium battery can be regulated within a reasonable range. The SOC of the lithium battery varies from 0.65 to 0.71.
(3) The maximum system efficiency of the hybrid electric propulsion system can reach 46.3%, the average system efficiency is 33.8%, and the average hydrogen demand is 0.192 kg/s.
(4) In addition to the large variation of local power demand, the ABC-FPID control method can effectively keep the output power of the fuel cell stable in the whole working profile range (meeting the demand of slow response of fuel cell power), and actively mobilize the lithium battery to fulfill the function of “peak clipping and valley filling” under variable load power. Therefore, the ABC-FPID control method can well regulate and match the fuel cell hybrid power output.
Acknowledgement: Not applicable.
Funding Statement: This project is supported by the Natural Science Foundation of Jiangsu Province (BK20231445); Aeronautical Science Foundation of China (20230028052001).
Author Contributions: All authors have contributed equally to this work. Wei Dong, Xuqing Feng, Taoxiang Mei, Xiang Li, Zhenzong He conceived the structure of paper; Methodology, Wei Dong and Zhenzong He; investigation, Xiang Li and Xuqing Feng; writing-original draft preparation, Wei Dong and Xuqing Feng. All authors reviewed and approved the final version of the manuscript.
Availability of Data and Materials: The authors confirm that the data used in this study is available on request.
Ethics Approval: Not applicable.
Conflicts of Interest: The authors declare no conflict of interest.
Nomenclature
| Vcell | Cell voltage |
| ENerst | Nernst potential |
| Vact | Cell activation polarization loss |
| Vohm | Cell ohmic polarization loss |
| Vcon | Cell concentration polarization loss |
| Tst | Stack temperature |
| R | Gas constant, 8.314 J/(kg·K) |
| Partial pressure of hydrogen | |
| Pan | Anode pressure |
| Oxygen partial pressure | |
| mst | Represents the mass of the stack |
| cp,st | Represent the average specific heat capacity at constant pressure of the stack |
| Qtot | Total energy generated by the electrochemical reaction |
| Qin | Represent the energy of the input |
| Qout | Represent the energy of the output |
| Qcl | Represents the heat taken away by the cooling water |
| Qamb | Represents the heat exchange between the surface of the stack and the environment |
| Pst | Represents the electric power of the stack |
| Represents the molar flow rate of hydrogen participating in the reaction | |
| ΔH | Represents the enthalpy of hydrogen combustion |
| Ibat | The current of the lithium battery |
| The internal resistance of the lithium battery | |
| Vocv | The open-circuit voltage of the lithium battery |
| Vbat | The lithium battery voltage |
| Rch | Represents the lithium battery charge resistance |
| Rdis | Represents the lithium battery discharge resistance |
| SOCini | Represents the initial state of charge of the battery |
| Kp | The proportional gain |
| Tt | The integral time constant |
| Td | The differential time constant |
| u(t) | The output signal of the PID controller |
| Ki | Integral coefficient |
| Kd | Differential coefficient. |
| ΔKP | The calculated gain changes |
| ΔKI | The calculated gain changes |
| ΔKD | The calculated gain changes |
| SN | Denotes the number of food source |
| Nn | Denotes the dimension of unsolved problem |
| The upper limits of the search space | |
| The lower limits of the search space | |
| The uniformly distributed random number in the range of [0, 1] | |
| The employed bee produces a candidate food source position | |
| The food source positions | |
| The corresponding fitness value | |
| The cost value of the food source position | |
| Represent the peak time for the system to stabilize | |
| Represent the setting time for the system to stabilize | |
| Represent the time required for the system to stabilize | |
| The calculation result obtained at the peak time | |
| The calculation result obtained at the setting time | |
| The calculation result obtained after those results tend to be stable | |
| A uniformly distributed random number in the range of [0, 1] | |
| Personal best position of each food source | |
| Corresponding fitness value of each food source | |
| Global best position of all the food sources | |
| Corresponding fitness value of all the food sources | |
| Pload | Represents the load power |
| Pfc | Represents the output power of the fuel cell |
| Ploss | Represents the power loss |
| Pbat | Output power of the Li-battery |
| SOCref | Reference state of charge of the lithium battery |
| SOCmax | The peak values of the state of charge for the Li-battery |
| SOCmin | The trough values of the state of charge for the Li-battery |
| Pfc_fuzzy | Represents the fuel cell power controlled by the fuzzy logic |
| Greek symbols | |
| A uniformly distributed real random number in the range of [0, 1] | |
| ρ | Density of cooling water |
| η | Represents the charging and discharging efficiency of the lithium battery |
| Represents the system efficiency | |
| Subscripts | |
| cell | Refer to battery |
| Nerst | Refer to Nernst |
| act | Refer to activation |
| ohm | Refer to ohmic |
| H2 | Refer to hydrogen |
| an | Refer to anode |
| O2 | Refer to oxygen |
| tot | Refer to total energy |
| cl | Refer to cooling water |
| st | Refer to stack |
| ocv | Refer to open-circuit voltage |
| bat | Refer to battery |
| fc | Refer to fuel cell |
| min | Refer to minimum |
| max | Refer to maximum |
References
1. He ZZ, Li X, Mao JK, Liang FL, Hu JY, Fu Y, et al. Multi-objective optimization research on fuel cell/turbine engine hybrid thermal management system considering waste heat cascade utilization. J Propulsion Technology. 2025;46(11):202410072. (In Chinese). doi:10.3724/1001-4055.202410072. [Google Scholar] [CrossRef]
2. He Z, Zhao W, Jian H, Mao J, Wang Z, Dong W. Performance improvement of solid oxide fuel cell by neural network and multi-objective optimization algorithm. J Renew Sustain Energy. 2025;17(6):064702. doi:10.1063/5.0283265. [Google Scholar] [CrossRef]
3. Xu D. Technologies and challenges of hydrogen powered aviation. J Phys Conf Ser. 2023;2608(1):012003. doi:10.1088/1742-6596/2608/1/012003. [Google Scholar] [CrossRef]
4. Jian H, He Z, Mao J, Liang F, Wang Z, Fu Y. Comparison and optimization of electrochemical and thermal performances of SOFC with different configurations of a metal foam flow field. J Renew Sustain Energy. 2024;16(5):054702. doi:10.1063/5.0223633. [Google Scholar] [CrossRef]
5. Liang S, Mao J, He Z, Liang F, Kang L, Jiang X. Multi-objective optimization of power matching for aviation SOFC-GT hybrid power system based on neural network. Gas Turbine Exp Res. 2025;38(2):119–32. doi:10.3724/j.gter.20250024. [Google Scholar] [CrossRef]
6. Pukrushpan JT, Stefanopoulou AG, Peng H. Control of fuel cell power systems: principles, modeling, analysis, and feedback design. Berlin/Heidelberg, Germany: Springer; 2004. [Google Scholar]
7. He ZZ, Wang HY, Zhang JW, Mao JK, Liang FL, Wang ZX, et al. Energy management strategy for small hydrogen fuel cell/lithium battery hybrid electric propulsion system. J Propuls Technol. 2026;47(3):202411008. (In Chinese). doi:10.3724/1001-4055.202411008. [Google Scholar] [CrossRef]
8. Peng F, Zhao Y, Li X, Liu Z, Chen W, Liu Y, et al. Development of master-slave energy management strategy based on fuzzy logic hysteresis state machine and differential power processing compensation for a PEMFC-LIB-SC hybrid tramway. Appl Energy. 2017;206(C):346–63. doi:10.1016/j.apenergy.2017.08.128. [Google Scholar] [CrossRef]
9. García P, Torreglosa JP, Fernández LM, Jurado F. Viability study of a FC-battery-SC tramway controlled by equivalent consumption minimization strategy. Int J Hydrogen Energy. 2012;37(11):9368–82. doi:10.1016/j.ijhydene.2012.02.184. [Google Scholar] [CrossRef]
10. Wang FC, Kuo PC, Chen HJ. Control design and power management of a stationary PEMFC hybrid power system. Int J Hydrogen Energy. 2013;38(14):5845–56. doi:10.1016/j.ijhydene.2013.03.021. [Google Scholar] [CrossRef]
11. Xing L, Xiang W, Zhu R, Tu Z. Modeling and thermal management of proton exchange membrane fuel cell for fuel cell/battery hybrid automotive vehicle. Int J Hydrogen Energy. 2022;47(3):1888–900. doi:10.1016/j.ijhydene.2021.10.146. [Google Scholar] [CrossRef]
12. Xing L, Chang H, Zhu R, Wang T, Zou Q, Xiang W, et al. Thermal analysis and management of proton exchange membrane fuel cell stacks for automotive vehicle. Int J Hydrogen Energy. 2021;46(64):32665–75. doi:10.1016/j.ijhydene.2021.07.143. [Google Scholar] [CrossRef]
13. Chen Y, Jian Q, Huang Z, Zhao J, Bai X, Li D. Improvement of thermal management of proton exchange membrane fuel cell stack used for portable devices by integrating the ultrathin vapor chamber. Int J Hydrogen Energy. 2021;46(74):36995–7006. doi:10.1016/j.ijhydene.2021.08.185. [Google Scholar] [CrossRef]
14. Wang Y, Zhang H, Qi J, Han K, He S, Guo C, et al. Thermodynamic and exergy analysis of a novel PEMFC-ORC-MH combined integrated energy system. Energy Convers Manag. 2022;264(7):115709. doi:10.1016/j.enconman.2022.115709. [Google Scholar] [CrossRef]
15. Yun S, Han J. Optimization of thermal management and power management system for hydrogen fuel cell-battery hybrid UAM system. Therm Sci Eng Prog. 2025;66(1):103893. doi:10.1016/j.tsep.2025.103893. [Google Scholar] [CrossRef]
16. Jia C, Liu W, He H, Chau KT. Health-conscious energy management for fuel cell vehicles: an integrated thermal management strategy for cabin and energy source systems. Energy. 2025;333:137330. doi:10.1016/j.energy.2025.137330. [Google Scholar] [CrossRef]
17. Ju F, Jiang Y, Zhuang W, Li B, Dai J. Integrated optimization of energy management and thermal control strategies for fuel-cell heavy truck. Int J Hydrogen Energy. 2025;145(8):928–41. doi:10.1016/j.ijhydene.2025.05.388. [Google Scholar] [CrossRef]
18. Saygili Y, Eroglu I, Kincal S. Model based temperature controller development for water cooled PEM fuel cell systems. Int J Hydrogen Energy. 2015;40(1):615–22. doi:10.1016/j.ijhydene.2014.10.047. [Google Scholar] [CrossRef]
19. Yu S, Jung D. A study of operation strategy of cooling module with dynamic fuel cell system model for transportation application. Renew Energy. 2010;35(11):2525–32. doi:10.1016/j.renene.2010.03.023. [Google Scholar] [CrossRef]
20. Chatrattanawet N, Hakhen T, Kheawhom S, Arpornwichanop A. Control structure design and robust model predictive control for controlling a proton exchange membrane fuel cell. J Clean Prod. 2017;148:934–47. doi:10.1016/j.jclepro.2017.02.033. [Google Scholar] [CrossRef]
21. Fang C, Xu L, Cheng S, Li J, Jiang H, Ouyang M. Sliding-mode-based temperature regulation of a proton exchange membrane fuel cell test bench. Int J Hydrogen Energy. 2017;42(16):11745–57. doi:10.1016/j.ijhydene.2017.03.070. [Google Scholar] [CrossRef]
22. Li D, Li C, Gao Z, Jin Q. On active disturbance rejection in temperature regulation of the proton exchange membrane fuel cells. J Power Sources. 2015;283(6861):452–63. doi:10.1016/j.jpowsour.2015.02.106. [Google Scholar] [CrossRef]
23. Hu P, Cao GY, Zhu XJ, Hu M. Coolant circuit modeling and temperature fuzzy control of proton exchange membrane fuel cells. Int J Hydrogen Energy. 2010;35(17):9110–23. doi:10.1016/j.ijhydene.2010.06.046. [Google Scholar] [CrossRef]
24. Song K, Hou T, Jiang J, Grigoriev SA, Fan F, Qin J, et al. Thermal management of liquid-cooled proton exchange membrane fuel cell: a review. J Power Sources. 2025;648:237227. doi:10.1016/j.jpowsour.2025.237227. [Google Scholar] [CrossRef]
25. Yan C, Chen J, Liu H, Lu H. Model-based fault tolerant control for the thermal management of PEMFC systems. IEEE Trans Ind Electron. 2020;67(4):2875–84. doi:10.1109/TIE.2019.2912772. [Google Scholar] [CrossRef]
26. Wang Z, Mao J, He Z, Liang F. Fuzzy control based on IQPSO in proton-exchange membrane fuel-cell temperature system. J Energy Eng. 2020;146(5):04020044. doi:10.1061/(asce)ey.1943-7897.0000691. [Google Scholar] [CrossRef]
27. Wang L, Husar A, Zhou T, Liu H. A parametric study of PEM fuel cell performances. Int J Hydrogen Energy. 2003;28(11):1263–72. doi:10.1016/S0360-3199(02)00284-7. [Google Scholar] [CrossRef]
28. Awan A, Saleem M, Basit A. Simulation of proton exchange membrane fuel cell by using ANSYS fluent. In: IOP Conference Series: Materials Science and Engineering; 2018 Apr 2–3; Quetta, Pakistan. [Google Scholar]
29. Li X, Xu L, Hua J, Lin X, Li J, Ouyang M. Power management strategy for vehicular-applied hybrid fuel cell/battery power system. J Power Sour. 2009;191(2):542–9. doi:10.1016/j.jpowsour.2009.01.092. [Google Scholar] [CrossRef]
30. He ZZ, Mao JK, Han XS, Liu ZY. Determination of aerosol particle size distribution by a novel artificial bee colony-differential evolution hybrid algorithm. Therm Sci. 2019;23(2 Part B):1161–72. doi:10.2298/tsci170330064h. [Google Scholar] [CrossRef]
31. Zhang R, Li X, Sun C, Yang S, Tian Y, Tian J. State of charge and temperature joint estimation based on ultrasonic reflection waves for lithium-ion battery applications. Batteries. 2023;9(6):335. doi:10.3390/batteries9060335. [Google Scholar] [CrossRef]
Cite This Article
 Copyright © 2026 The Author(s). Published by Tech Science Press.
This work is licensed under a Creative Commons Attribution 4.0 International License , which permits unrestricted use, distribution, and reproduction in any medium, provided the original work is properly cited.
 Downloads
 Citation Tools