
 Submit a Paper
 Propose a Special lssue
 Open Access
ARTICLE
SVM Algorithm for Vibration Fault Diagnosis in Centrifugal Pump
1 School of Electrical Engineering, Vellore Institute of Technology, Vellore, TamilNadu, India
2 ESAB India Limited, Chennai, India
* Corresponding Author: Palanisamy Kaliannan. Email:
Intelligent Automation & Soft Computing 2023, 35(3), 2997-3020. https://doi.org/10.32604/iasc.2023.028704
Received 16 February 2022; Accepted 05 May 2022; Issue published 17 August 2022
 View Full Text
 Download PDF
Abstract
Vibration failure in the pumping system is a significant issue for industries that rely on the pump as a critical device which requires regular maintenance. To save energy and money, a new automated system must be developed that can detect anomalies at an early stage. This paper presents a case study of a machine learning (ML)-based computational technique for automatic fault detection in a cascade pumping system based on variable frequency drive (VFD). Since the intensity of the vibrational effect depends on which axis has the most significant effect, a three-axis accelerometer is used to measure it in the pumping system. The emphasis is on determining the vibration effect on different axes. For experiment, various ML algorithms are investigated on collected vibratory data through Matlab software in x, y, z axes and performances of the algorithms are compared based on accuracy rate, prediction speed and training time. Based on the proposed research results, the multiclass support vector machine (MSVM) is found to be the best suitable algorithm compared to other algorithms. It has been demonstrated that ML algorithms can detect faults automatically rather than conventional methods. MSVM is used for the proposed work because it is less complex and produces better results with a limited data set.Keywords
Flow in a pumping system has random frequency characteristics generally. It is determined by various fluid machinery components such as a pump, compressor, impeller, valves, pipes and their interaction with flow rate may cause the frequency component to vary. The oscillations in the flow can be seen when the acoustic frequency component matches a specific frequency. Vibration in the pumping system occurs for various reasons, including cavitation, water hammering, pressure pulsation, bearing fault, impeller breaking and various electrical faults. Lightweight materials and a high-speed pump unit increase vibration excitation sources, resulting in severe vibration issues. So, vibration analysis is necessary to detect pumping system faults. As a result of hydraulic, mechanical, electrical and structural issues in the system, excessive vibration can occur. These results in significant energy loss, system damage, reduced pump performance and increased operational costs. In general, the centrifugal pump operates at a constant flow rate, and the pipeline remains stable during operation. One of the pump’s characteristics is the periodic fluctuation of flow rate. The frequency components of centrifugal pump pressure fluctuations are measured using the fast Fourier transformation (FFT) method [1]. These frequency components are rotation frequency, blade passing frequency and harmonic frequency under operating conditions [2]. Normal FFT analysis fails to collect all of the harmonic data resulting in noise in the system.
Because of the change in impeller rotational speed at the time of valve closure, the pump’s pressure rapidly rises [3]. For the rapid change in rotational speed of the impeller at the beginning stage, the pump’s flow rate gradually decreases at the time of valve closing. The flow rate of the pump gradually increases during the valve opening stage and the fluid flow is complex because it changes quickly and becomes unstable during the operating condition. The relationship between monitoring data and machine health is essential for fault diagnosis and is a source of great concern. Fault detection is possible based on abnormal machine sounds or using advanced signal processing methods and sometimes by vibration analysis. With the application of artificial intelligence (AI) techniques, fault diagnosis is expected to be intelligent. Because of the pipeline’s nonlinear stability, it aids in the automatic detection of faults in the pumping system and fluid transients can receive extensive transients.
Based on the AI method, classification algorithms are used to identify faults in the pumping system, and four faults such as bearing fault, seal, impeller breaking and cavitation, are detected by classification algorithms such as support vector machine (SVM), k-Nearest Neighbor (K-NN), Naive Bayes, Bayes Net and Decision Tree.
Previous studies have used various automatic technologies, but each technology has some drawbacks. To address these shortcomings, the MSVM algorithm is used in the proposed research for simple binary classification, and it is compared to other ML algorithms to demonstrate that MSVM is more suitable than other ML algorithms. MSVM requires less computational time and generally performs well in small and large datasets. The proposed research focuses on which axis vibration effect is more significant by collecting vibration data in three axes; then ML algorithms are applied to the collected vibration data through Matlab, from which the best suited algorithm MSVM is chosen based on performance and the performances of other algorithms are compared, as well as comparisons between existing researches and the proposed method have been done.
The entire paper is framed on related existing works where various researches on fault detection both in the conventional way and automated way have been discussed, theoretical background where basic mathematical equations used in the proposed research have been discussed, discussion on proposed method, statistical feature extraction where all kinds of statistical formulae which are used for ML application in the work, experimental procedures, result and discussion where experimental data collections and both hardware and simulation results are discussed, comparison is made with existing works with proposed work followed by conclusion.
Various works on anomaly detection in various machineries have been done by researchers using both traditional and automated computational methods. This section focuses on the background research on existing works on fault detection and identification methods. Vibrational faults can occur due to bearing damage, an electrical fault, or an abrupt valve closing. Among these, the operation of the pump’s valve plays an important role in creating a fault [4]. Unbalanced rotating components, damaged impellers, non-concentric shaft sleeve, bent or wrapped shaft, pump and driver misalignment, thermal growth of various components, poor foundations and loose bearings are mechanical causes of vibration problems [5]. The hydraulic problems that cause excessive vibration are pump operation beyond the best efficiency point, water hammer, fluid vaporization, impeller vane running too close to pipeline, volute tongue, internal recirculation and turbulence in the system. The vibration problem is visible if the pump operates at the critical speed [6]. Multiple frequencies can be seen with the rotating and blade passing frequencies if the pump has an excessive vibration problem [7]. The primary tools for analyzing vibration data are FFT analysis, motor current signature analysis and vibration analysis [8]. An expert system was considered for designing a simulation model based on a fuzzy logic regulator to control the system and maintain a definite delay in service. However, fuzzy logic has the limitation of dealing with imprecise data and inherited human thinking inference [9]. Using an intelligent system, a software-defined network system was introduced to support future network functions. The lion optimization algorithm (LOA) evaluated the offline system through packet optimization software, the system’s performance, and computational time. Since the LOA is a bio-inspired algorithm, it does not tolerate cooperative interaction and can sometimes make the problem more robust. LOA will not function properly if the data size is insufficient [10]. The system’s diagnosis and analysis were carried out using a genetic algorithm (GA) and case-based reasoning (CBR). Evaluation criteria of CBR shell is better than numerical models, and GA is less expensive and applicable to complex solutions. Since GA requires more computational time, it is generally used in a hybrid fashion [11]. The internet of drone vehicle things (IoDv) was introduced to improve traffic conditions in urban areas. The research showed that the workload assigned is 15% more optimal than the existing model. The research goal was to reduce response time, which was a combination of network, computation security and fault tolerant delay. Adopting various communication technologies was a significant challenge for IoDv, and it occasionally encountered issues due to limited energy resources [12]. Based on the application of various soft computing techniques, an adaptive-network-based fuzzy inference system (ANFIS) model was used to determine the induction motor fault. The discrete wavelet transform function was used to detect the stator inter-turn fault. Discrete wavelet transformation has the limitations of shift sensitivity, poor directionality and a lack of proper information, whereas the ANFIS model is complex and lacks dimension [13]. The basic toolkit assistance software failed to diagnose the car’s malfunction and the location of the fault. As a result, the automated car failure diagnosis assistance (ACFDA) had been used to achieve maximum efficiency in locating the fault and used as a separate gadget to assist car drivers in detecting car failure. The limitation of ACFDA is that it is only applicable to specific cars and that users must first learn the car’s structure [14]. A convolutional neural network (CNN) was used for the investigation based on multiresolution analysis and images were obtained using Deep Learning (DL) and wavelet tools. CNN fails to identify faults if the data set is insufficient and it takes a long time due to its complexity and a lack of a good graphics processing unit (GPU) in the computer [15]. The layered adjustable autonomy (LAA) model was used to manage humans and agents. Unnamed arial vehicle (UAV) system performed various experimental scenarios to develop a suitable test plan for making the system more automatic. The layers and duplication of data processing are the greater risks for LAA [16]. Case based reasoning (CBR) is one of the fault diagnosis systems by which several mobile phone faults can be identified combined with GA. The GA and CBR (GCBR) showed the highest accuracy for mobile phone anomaly detection. The algorithm only works in the same hierarchy [17], which is a limitation of this study. Vibration analysis was performed with the help of a three-axis accelerometer to monitor cutting tool wear and an automatic detector was also introduced to detect the cutting tool’s lifespan. The research employed an evaluation system for automatic fault detection, which employed a mean power system for analysis; however, this mean power system is an old and time-consuming method [18]. The K-NN classifier employed a single simple face recognition technique that exploited multiple features and identified vectors based on distance measurement to assess its relevance. K-NN is a better choice for face recognition than the current state-of-the-art method. If the data set is larger, K-NN fails to detect anomalies, it struggles with high-dimensional data, and K-NN is sensitive to noise and requires feature scaling [19]. Various optimization algorithms, such as particle swarm optimization (PSO), Cat swarm optimization (CSO), Bat, Cuckoo search algorithm and Whale optimization (WOA), were used for balancing load, energy efficiency and an efficient cloud environment that computed and manipulated data online over the web. WOA was used in the study, but it had some limitations, such as slow convergence speed, low accuracy and easy failure of local optimum [20]. The conventional approaches for fault detection are FFT analysis and vibration analysis using the motor current signature method [21]. It is possible to consider a deep statistical feature learning method for fault diagnosis of rotating machinery using vibration measurements. The signals of the actuators were analysed using time domain analysis, vibration analysis and both were compared. It is clear that vibration analysis is a cost-effective solution for fault detection and system monitoring [22]. Classification algorithms are common methods for automatic fault detection and there are many previous fault detection techniques of which the classification method is the more accurate method for fault detection [23].
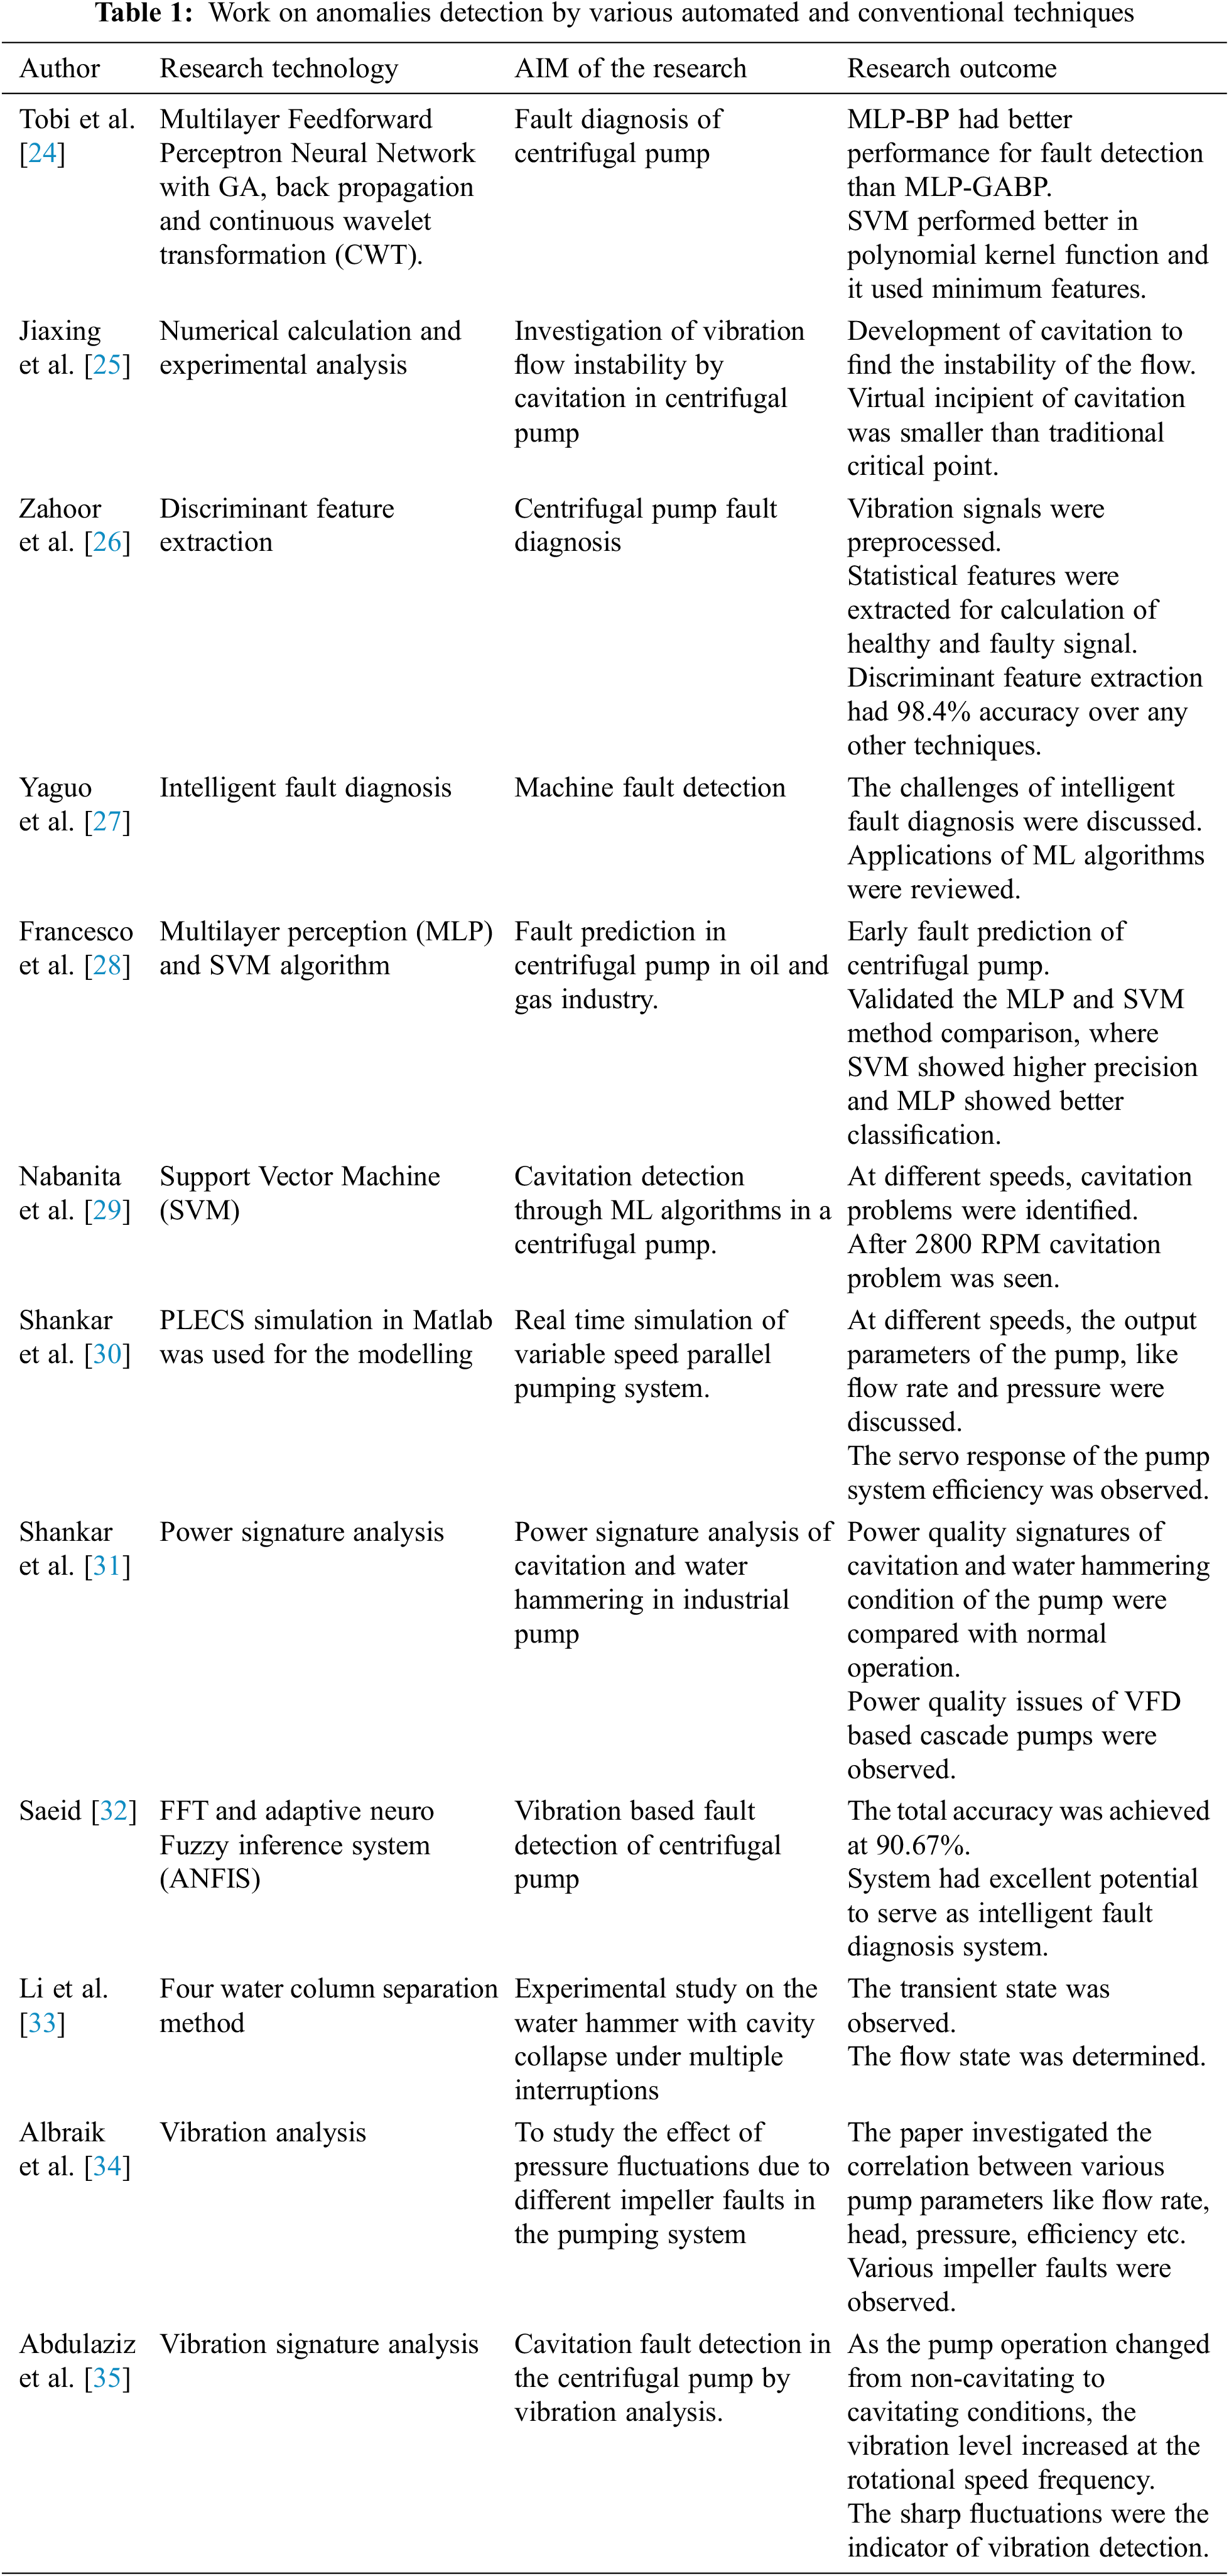
Various researchers have published numerous papers on fault detection in machines and automated fault detection systems. Tab. 1 describes some related works on fault detection and automated systems and the outcomes of those works.
The kinetic energy of the liquid that comes out from the impeller is utilized to create resistance to the flow. In this way the pump volute, casing functions and the resistance of the flow of the liquid are controlled. According to the Bernoulli’s principle, the discharge nozzle also operates and the velocity is converted to the pressure [36].
The head value of the pump can be expressed as.
Here H is the total head measured in meter and velocity is represented by v (m/s) and the acceleration gravity is g which is 9.81 m/s^2. The peripheral velocity can be expressed as
In this case v is the velocity of the fluid and N is the speed of the pump measured in RPM, D is the impeller diameter measured in meter. By the spring mass damper system a simple machine vibration can be expressed and the source of vibration must be detected [37,38]. The relationship between frequency and period of time is
Here f is the frequency measured in Hz and period of time t is measured in second.
Time waveform is the simplest method for representing raw data of the vibration signal. For analysis purposes, the FFT method and power spectral density (PSD) can be used for better representation.
The current research is based on a VFD-based cascade pumping system in which two pumps are operated at different speeds in hands-on mode, and a valve is suddenly closed to create a fault for testing the faulty condition within 10 to 15 s. The entire experiment is conducted as a case study. The paper investigates the performance of various ML algorithms such as MSVM, K-NN, Naive Bayes and Decision Tree. It determines the best algorithm for detecting faults in a pumping system [39,40]. Excessive vibration damages the pump, VFD, the pipelines and electric motor. When the flow rate changes abruptly due to a sudden valve closing, the power flow in the motor and drives is also impacted. If the flow rate decreases, the power and current will decrease. So identification of excess vibration due to hydraulic, mechanical and electrical fault is important. Continuous monitoring is problematic in various industrial areas where pumps are operated manually, but it is possible where the system is operated via remote control automatic system [41]. So condition based ML is required to predict the fault situation at the early stage and to predict the lifetime of the pumping system. In this study, an experiment has been conducted, followed by an analysis to determine the performances of ML algorithms. The proposed study is divided into three sections. The entire procedure has been carried out in steps.
Step 1: Vibration data have been collected healthily by running the pump at different speeds and using an accelerometer to collect three axes vibratory data. The same procedure is used to create a fault by closing the valve abruptly in a fraction of second and vibratory data are collected at various speeds.
Step 2: This is a hardware experiment that has been used as a case study to analyse and plot the frequency spectrum curve using FFT analysis.
Step 3: ML algorithms are applied to vibratory data, and their results are compared.
Step 4: The best-suited algorithm has been chosen based on the results.
Step 5: Then testing data in different speeds have been applied on MSVM to classify the faulty and no faulty points through Matlab simulation. Confusion matrix, evaluation matrix and receiver operating characteristic (ROC) have been formed for overall performance analysis of the MSVM.
The proposed research has chosen MSVM algorithm for pump fault detection based on its performance and it has several steps from data collection to data evaluation. The whole process has been described in Fig. 1.

Figure 1: The process of MSVM through flow chart
Fig. 2 represents the basic flow chart of the fault detection of the pump. One part of the research is to find that in which axis intensity of the vibration is more. Some statistical steps have been taken in the other part of the research where ML algorithms are used. Fig. 3 shows the generic diagram of ML algorithm for fault detection which is followed by data collection, feature extraction, data cleaning and data evaluation by training and testing way and lastly data modelling.

Figure 2: The basic flow chart for fault detection in centrifugal pump

Figure 3: Generic diagram of ML algorithm for fault detection
The predictive control technique will determine whether or not a pump fault occurs and whether or not there is future possibility of failure. The failure prediction is performed to determine the machine’s remaining useful life. This prediction is possible using the classification technique. Two classes are typically chosen for this prediction: one positive and one negative. In general, the positive class denotes the failure prediction class chosen for 240 time steps and in this experiment, the positive class is denoted as −1.
In contrast, the negative class denotes the normal operating condition, denoted as 1. The predicted attributes will be used to build the model and evaluation will be done through the training and testing process. In the data splitting per 100 samples, 70% of the value is used for training and 30% for testing. Data cleaning, also known as rule-based filter mode, is also essential. The ML model is optimised using k-fold cross validation. This is done to avoid the overfitting problem. The k parameter defines the excellent representation of the input dataset by training and validation groups. In this experiment, the value of k is set to 30. To avoid an unbalanced dataset, the number of minor class samples is chosen in proportion to the number of samples from the major class.
5 Statistical Feature Extraction
The primary function of the ML algorithm is feature extraction. The extraction of features is an important step that aids in classifying training and testing data for analysis. The most hybrid features are root mean square (RMS), kurtosis value (KV), root amplitude, peak-to-peak value (PPV), standard deviation (SD), skewness value (SV), clearance factor, crest factor (CF), impulse factor (IF), shape factor (SF) and mean value (MV). These statistical features assist in the analysis of vibrational signals, allowing users to gain a clear picture of the effect of vibration on the system. Fig. 4 depicts the feature extraction classification process. The proposed model has done most of the feature extraction in class 0, making it easy to classify faulty points and thus increasing accuracy.
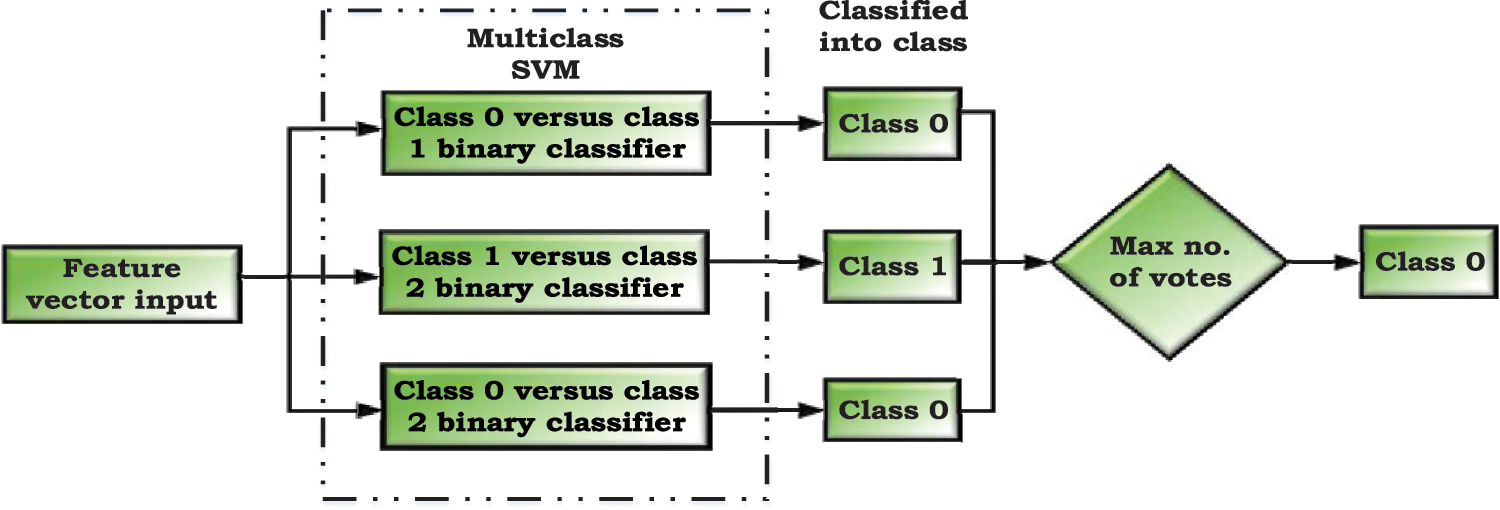
Figure 4: Classification process of feature extraction
The experiment uses a VFD-based cascade pumping system connected to the Siemens test bed supervisory control and data acquisition (SCADA) for vibration data collection. The pump has been operated at different speeds, once in a healthy state and in a faulty state by sudden valve closure. The sudden vibration has been created to test the faulty situation. Two cascade pumps are used, and an accelerometer mounted on each pump is connected to the SCADA system. The centrifugal pump system consists of a motor (415 volt, 2 poles, 50 Hz AC induction motor), a flow meter with a maximum flow rate of 2000 lph, a pressure gauge with a maximum set pressure of 2 bar and a control panel with speed controller (Danfoss model VFD with speed controller and display screen, switch (OFF/ON) and emergency shutdown). The pump head has a maximum length of 25 meters, a power of 0.55 kW, a speed of 2800 RPM, a pipe diameter of 25 mm and a current of 1.7 A. Accelerometers have sensitivity values of 10.12 and 9.84 mV/g respectively and a frequency range of 1.5 to 25 kHz. The vibration signals are measured in both normal and abnormal conditions. Vibration data in the form of acceleration have been collected with respect to time. Initially, a signal of normal condition is acquired without any fault condition of the pump. The sudden closing of the valve creates a faulty condition. Water hammering and cavitation fault may be created as a result of this. The proposed research mainly focuses on water hammering fault as through MSVM hydraulic fault not has been tested before. The data are then further analysed using Matlab simulation and ML algorithms. Fig. 5 depicts the test setup block diagram, while Fig. 6 depicts the hardware setup test bed.
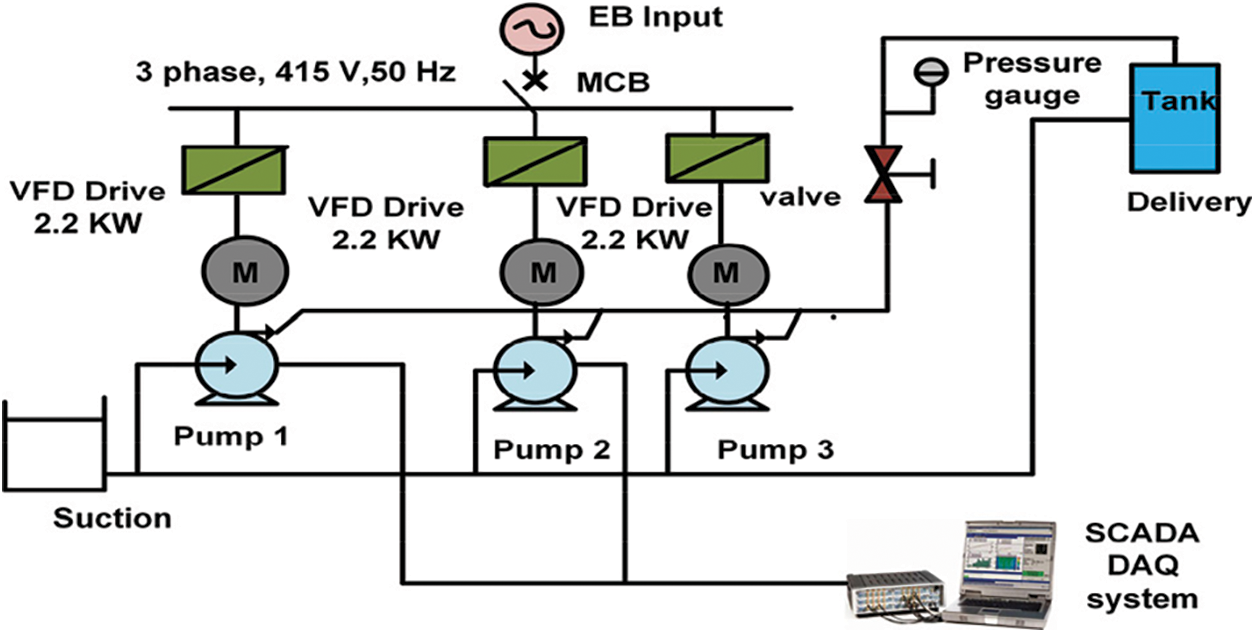
Figure 5: Block diagram of test setup
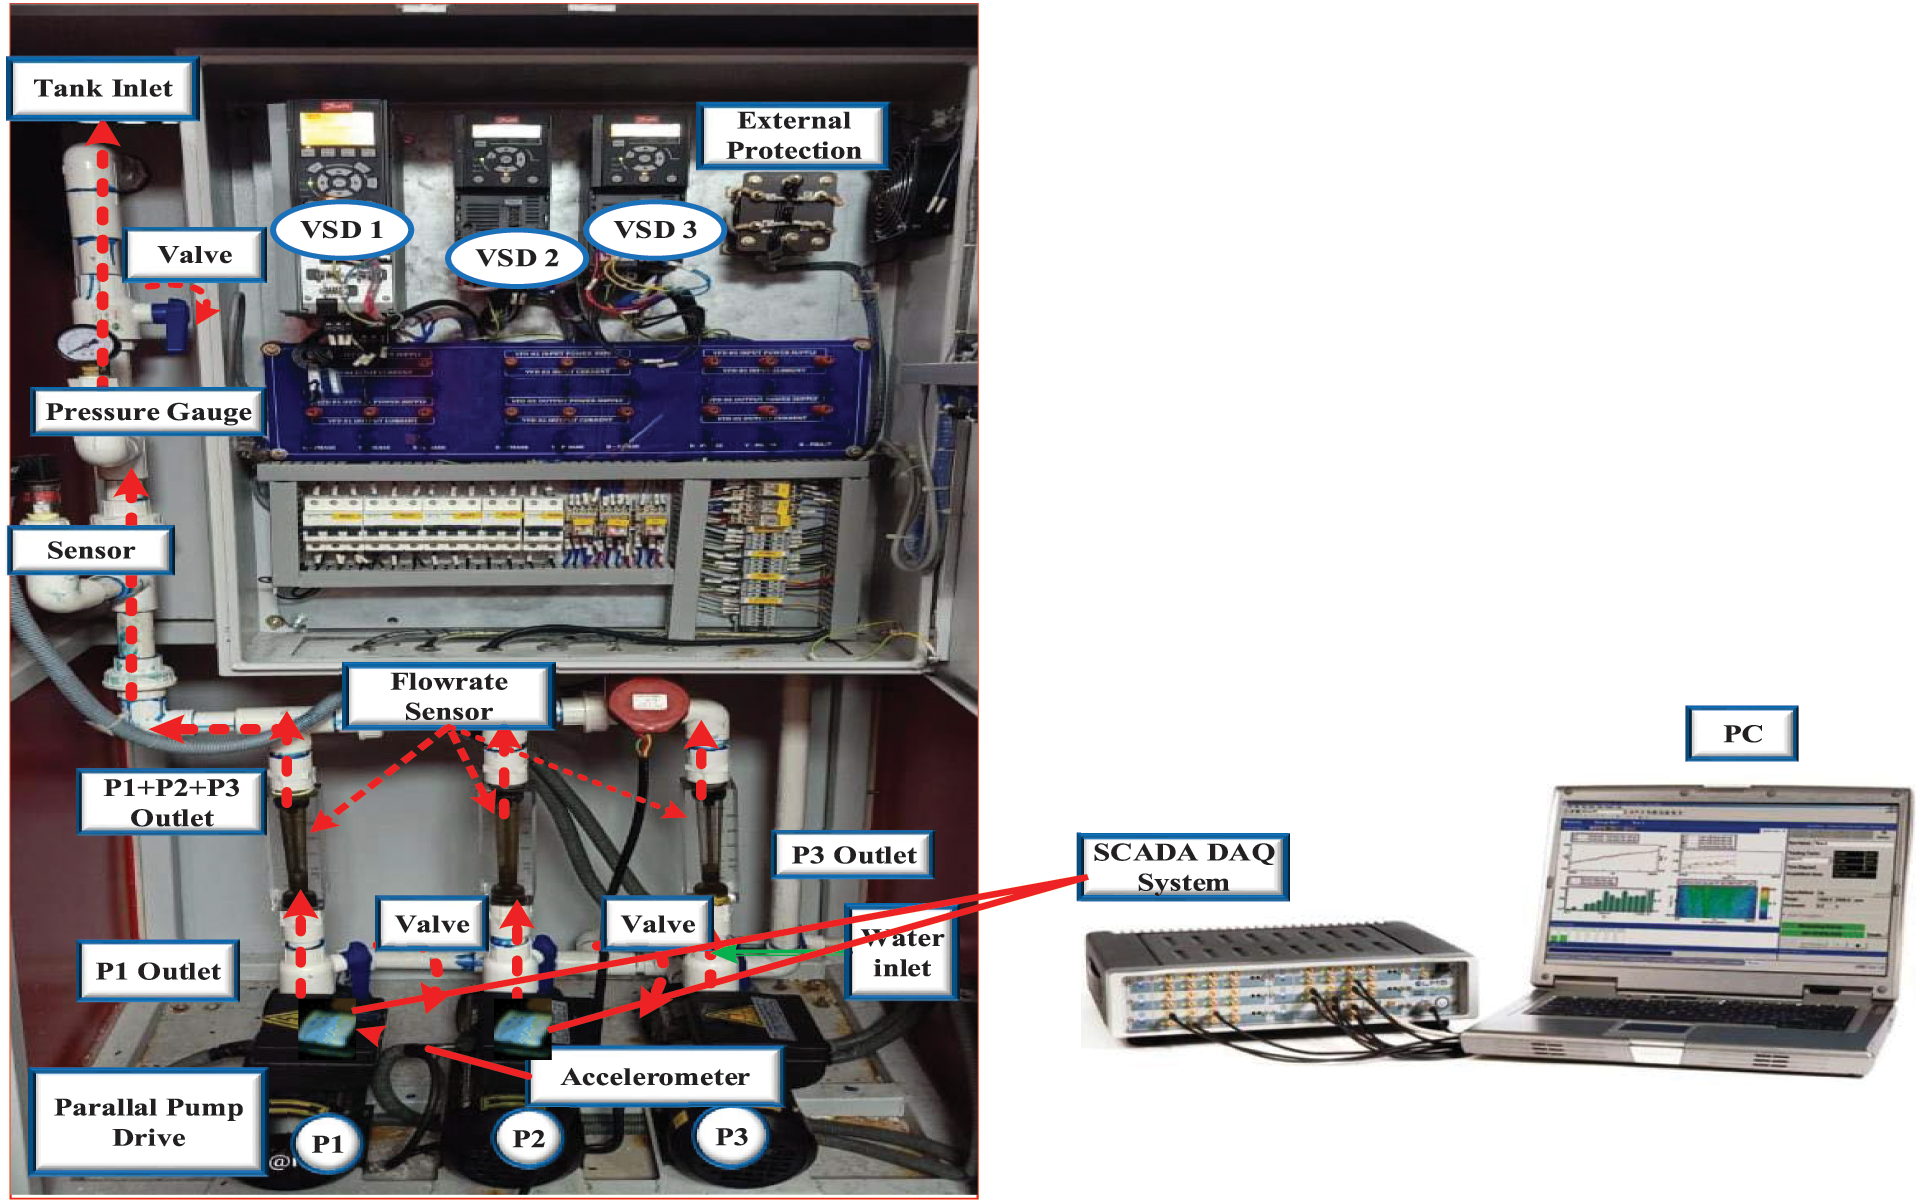
Figure 6: Hardware setup test bed
7.1 Experimental Data Collection
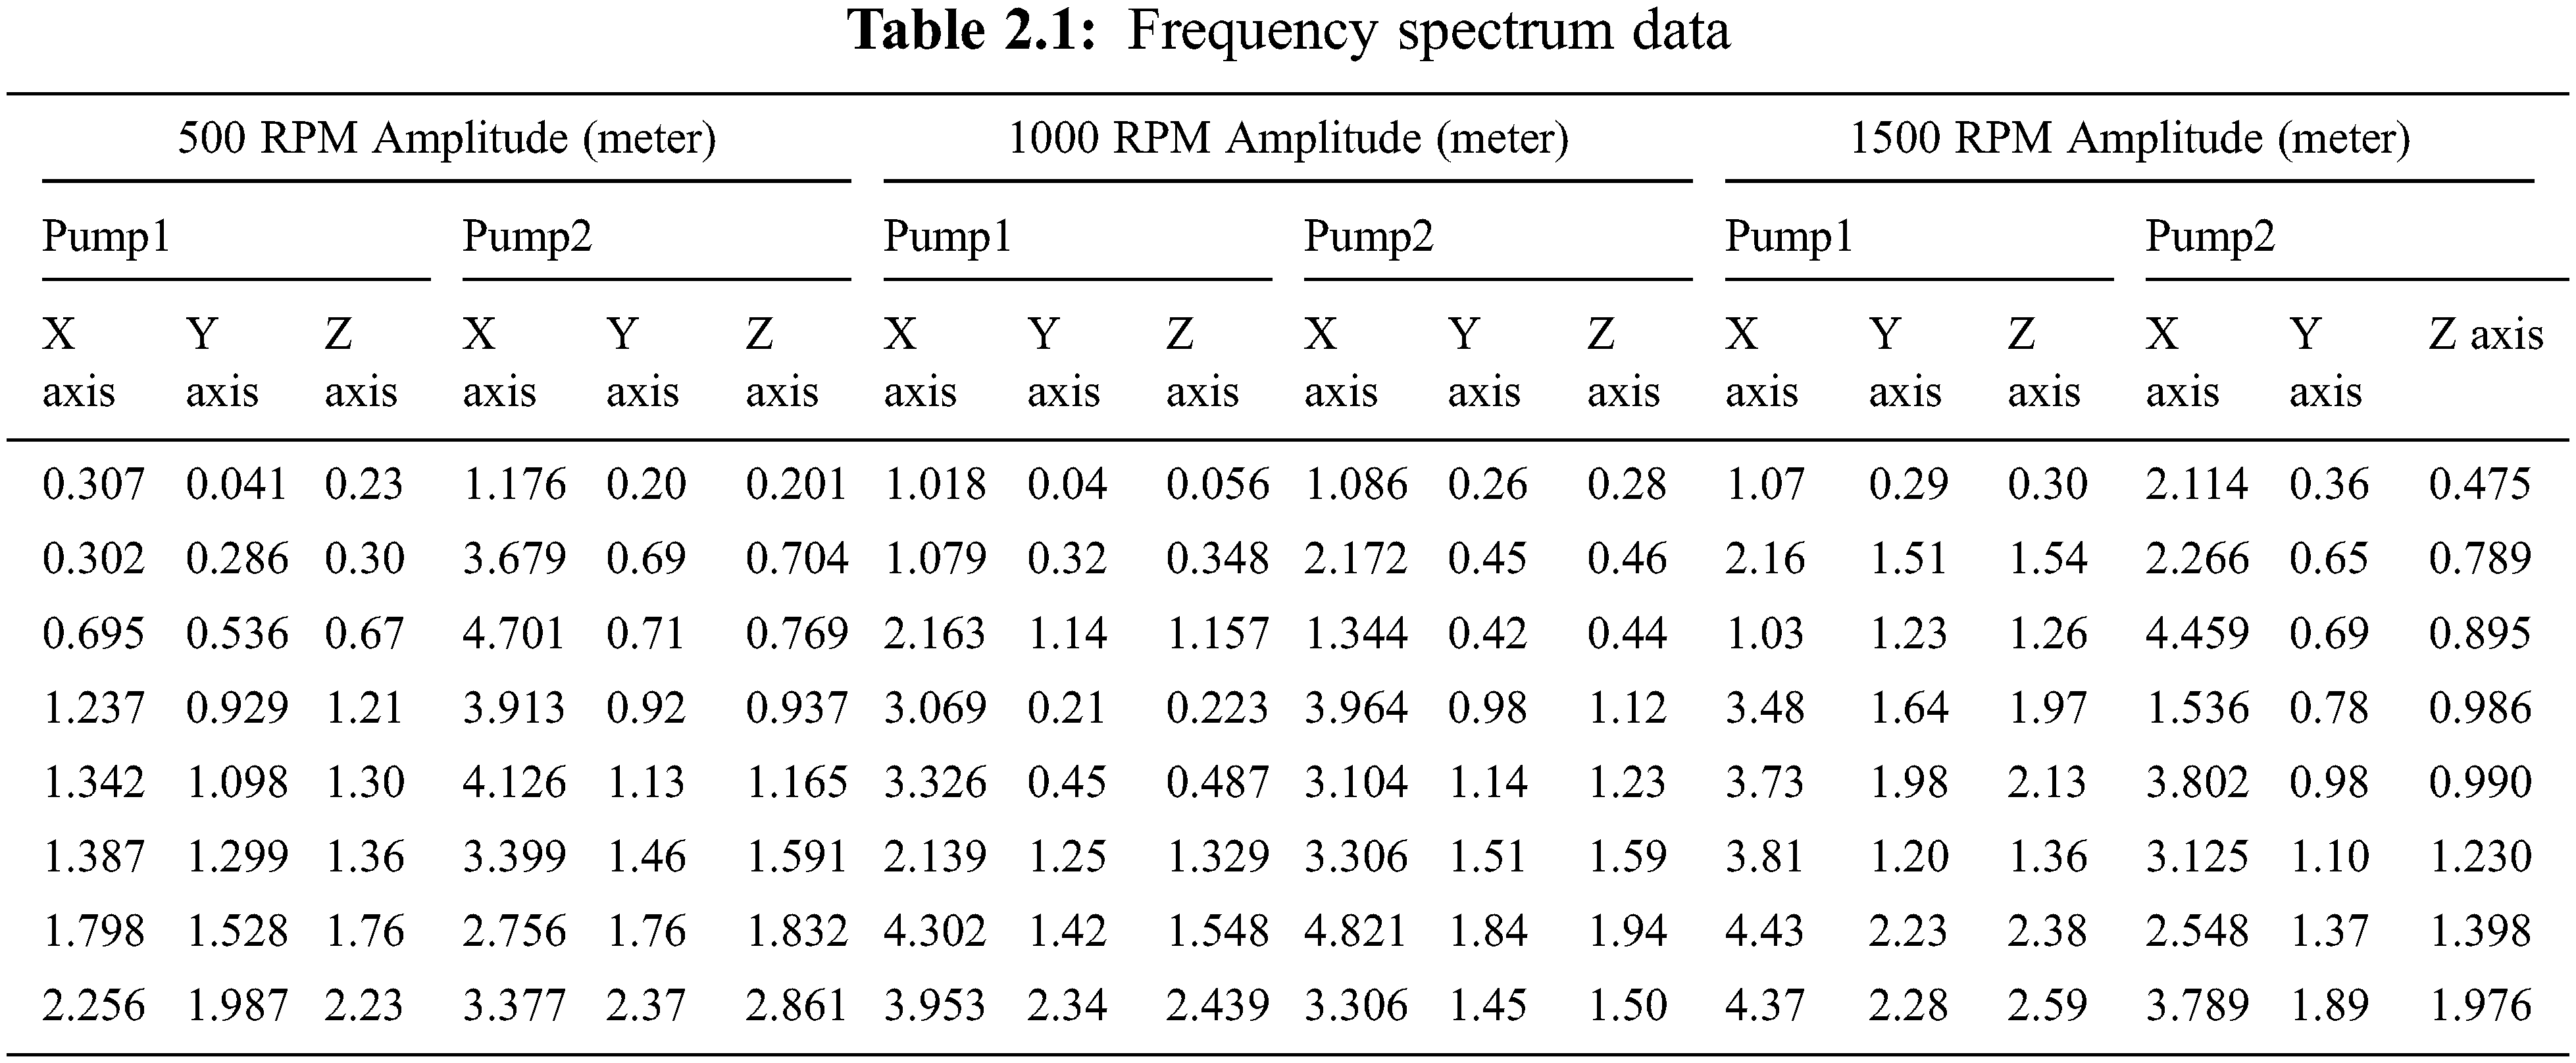
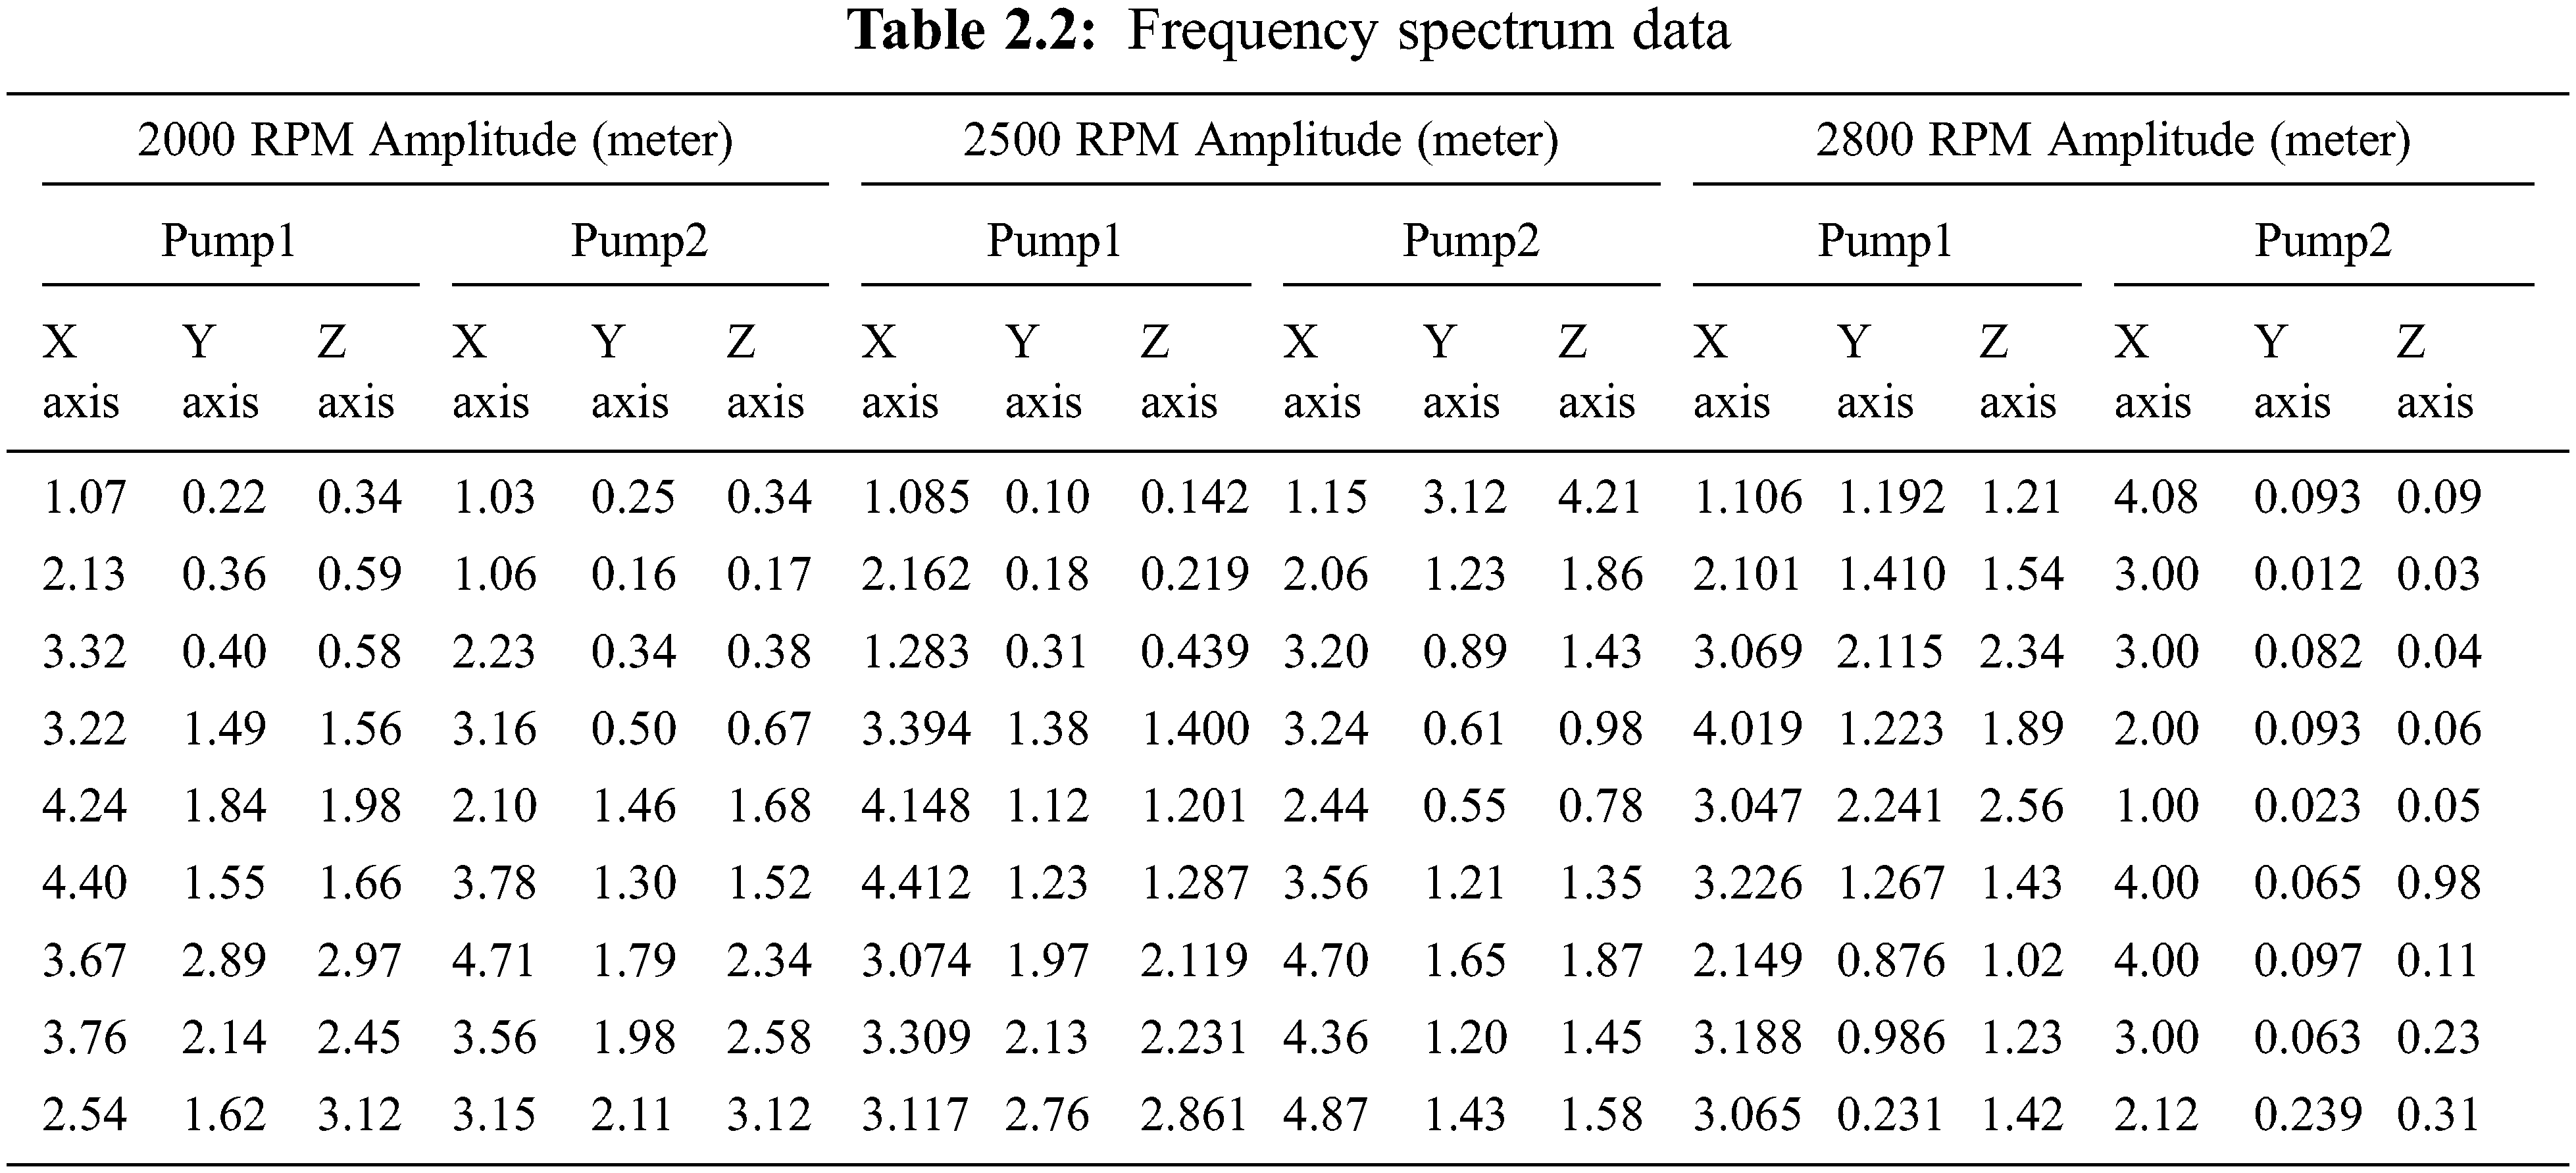
From 500 to 2800 RPM at six different speeds, vibration data are collected with respect to time in both the healthy and faulty conditions. Generally, the pump operates normally, but within 10 to 15 s, the valve has been closed to create the fault for each speed condition. Excessive vibration has been generated in this situation, implying that the intensity of vibrational amplitude is greater. The pressure value rises abruptly, and thus the flow rate falls abruptly. After data collection, a frequency spectrum analysis has been performed and a graph of frequency and amplitude has been plotted. The graphs show that for most of the cases in every speed condition, the amplitude of pump 1 is high in the frequency range of 1 to 1.5 Hz and the amplitude of pump 2 is high in the frequency range of 1 to 1.5 Hz, as well as for 0.5 Hz [Figs. 7a–7c]. The horizontal measurement has a higher amplitude than the vertical measurement in the majority of cases. The vibration data have been collected in the x, y and z axes, among which the x-axis amplitude is greater than the y and z axes (Tabs. 2.1–2.2). It indicates that the system is becoming more unbalanced. In general, the pump performs well with low vibration levels. Since the accelerometer scale range is 10 points, any experimental values taken are scaled down. When a valve closes suddenly, water hammering occurs, and if the pressure head falls below the vapour pressure head, cavitation occurs. The frequency spectrum data of the vibration signal at different speeds are shown in Tab. 2.1 and 2.2. Figs. 7a–7c show the frequency spectrum of the signal in different speed conditions which are experimental results. The proposed work contributes by using a three-axis accelerometer to measure the vibration and effect of the pumping system, applying ML algorithms to find the appropriate algorithm for fault detection and comparing the performances of the ML algorithms with related works. Almost all of the feature extractions are seen in class 0, and they are compared to those in class 1 using precision, F1 score and recall where the accuracy rate is high. In addition to the overall accuracy rate, training time and prediction speed are considered when determining which algorithm is best suited for this experiment. The entire project is statistically evaluated.

Figure 7a: Frequency spectrum for 500 and 1000 RPM speed
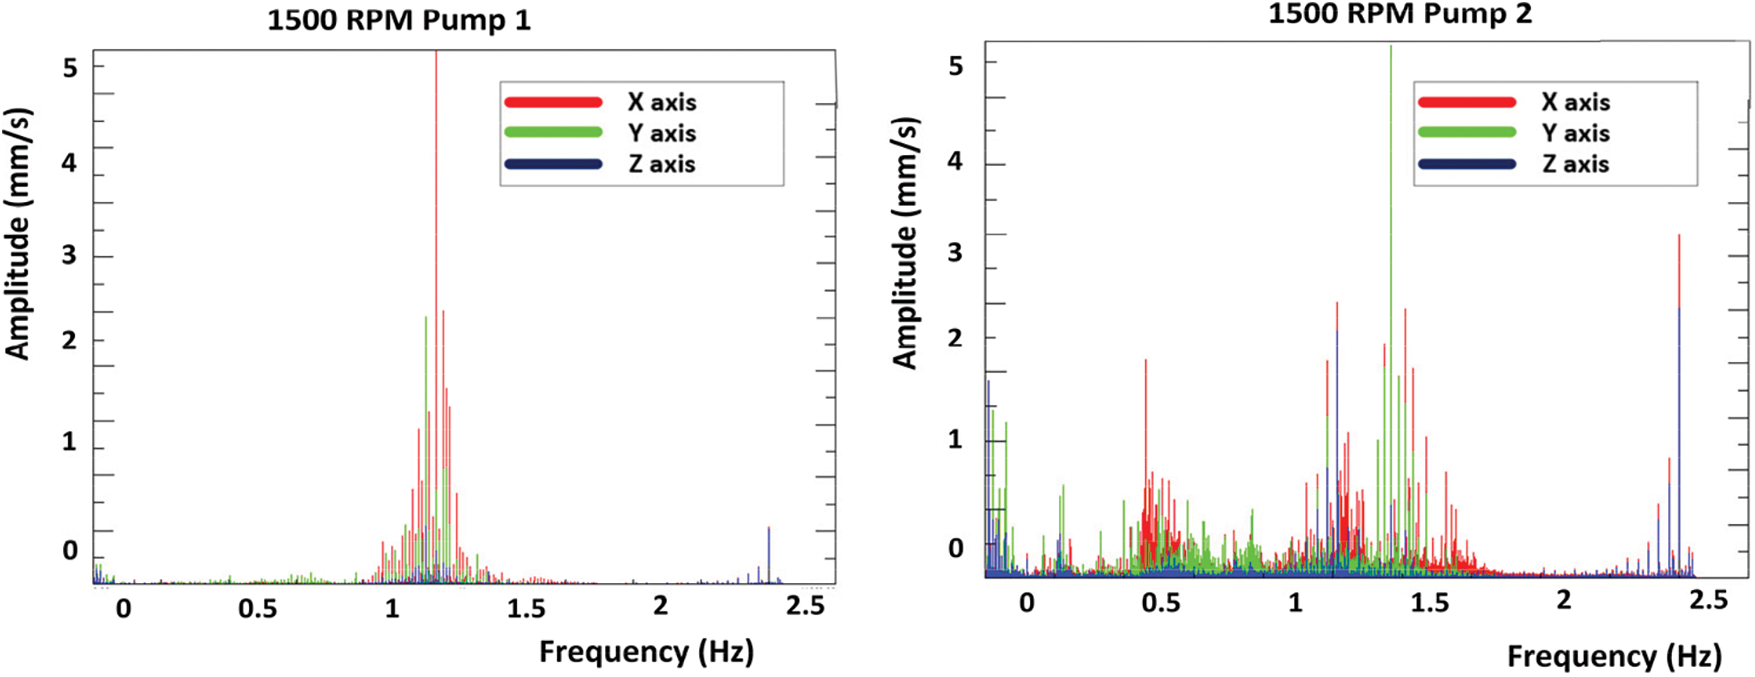

Figure 7b: Frequency spectrum for 1500 and 2000 RPM speed

Figure 7c: Frequency spectrum for 2500 and 2800 RPM speed
7.2 Experimental Result and Discussion
Another method of research performance validation is continuous wavelet transformation (CWT) which is similar to FFT but uses the number of wavelets as a function rather than the sine and cosine functions. The wavelet is composed of two parameters, scale and translation, and the signal is displayed in a two-dimensional time scale plane rather than a one-dimensional plane. The CWT function is
Here Wx is the wavelet transform linked with two parameters like a is the scale parameter and b shows as time parameter. ∅ is wavelet function, and x (t) is the original signal. In this experiment, vibration data have been collected under six different speed conditions. The wavelet transform produces 60 features in each case. For each feature, 480 features for the signal from each case are computed. These features are used to train classification algorithms such as MSVM, K-NN, Naive Bayes and the Decision Tree. ML algorithms are used to classify fault and no-fault points based on high and low vibration rates. Tab. 3 displays the real-time pressure, flow rate and current value at various speeds in healthy and faulty conditions. The table shows that pressure increases in the faulty condition, and flow rate and current value decrease as pressure increases. Figs. 8a–8f depict the classification results of fault and no fault points at various speeds. The red points are faulty, while the green points are not faulty. This classification’s goal is to successfully predict the label of unknown data or a test data instance consisting of only attributes. This aids in determining the system’s fault position.
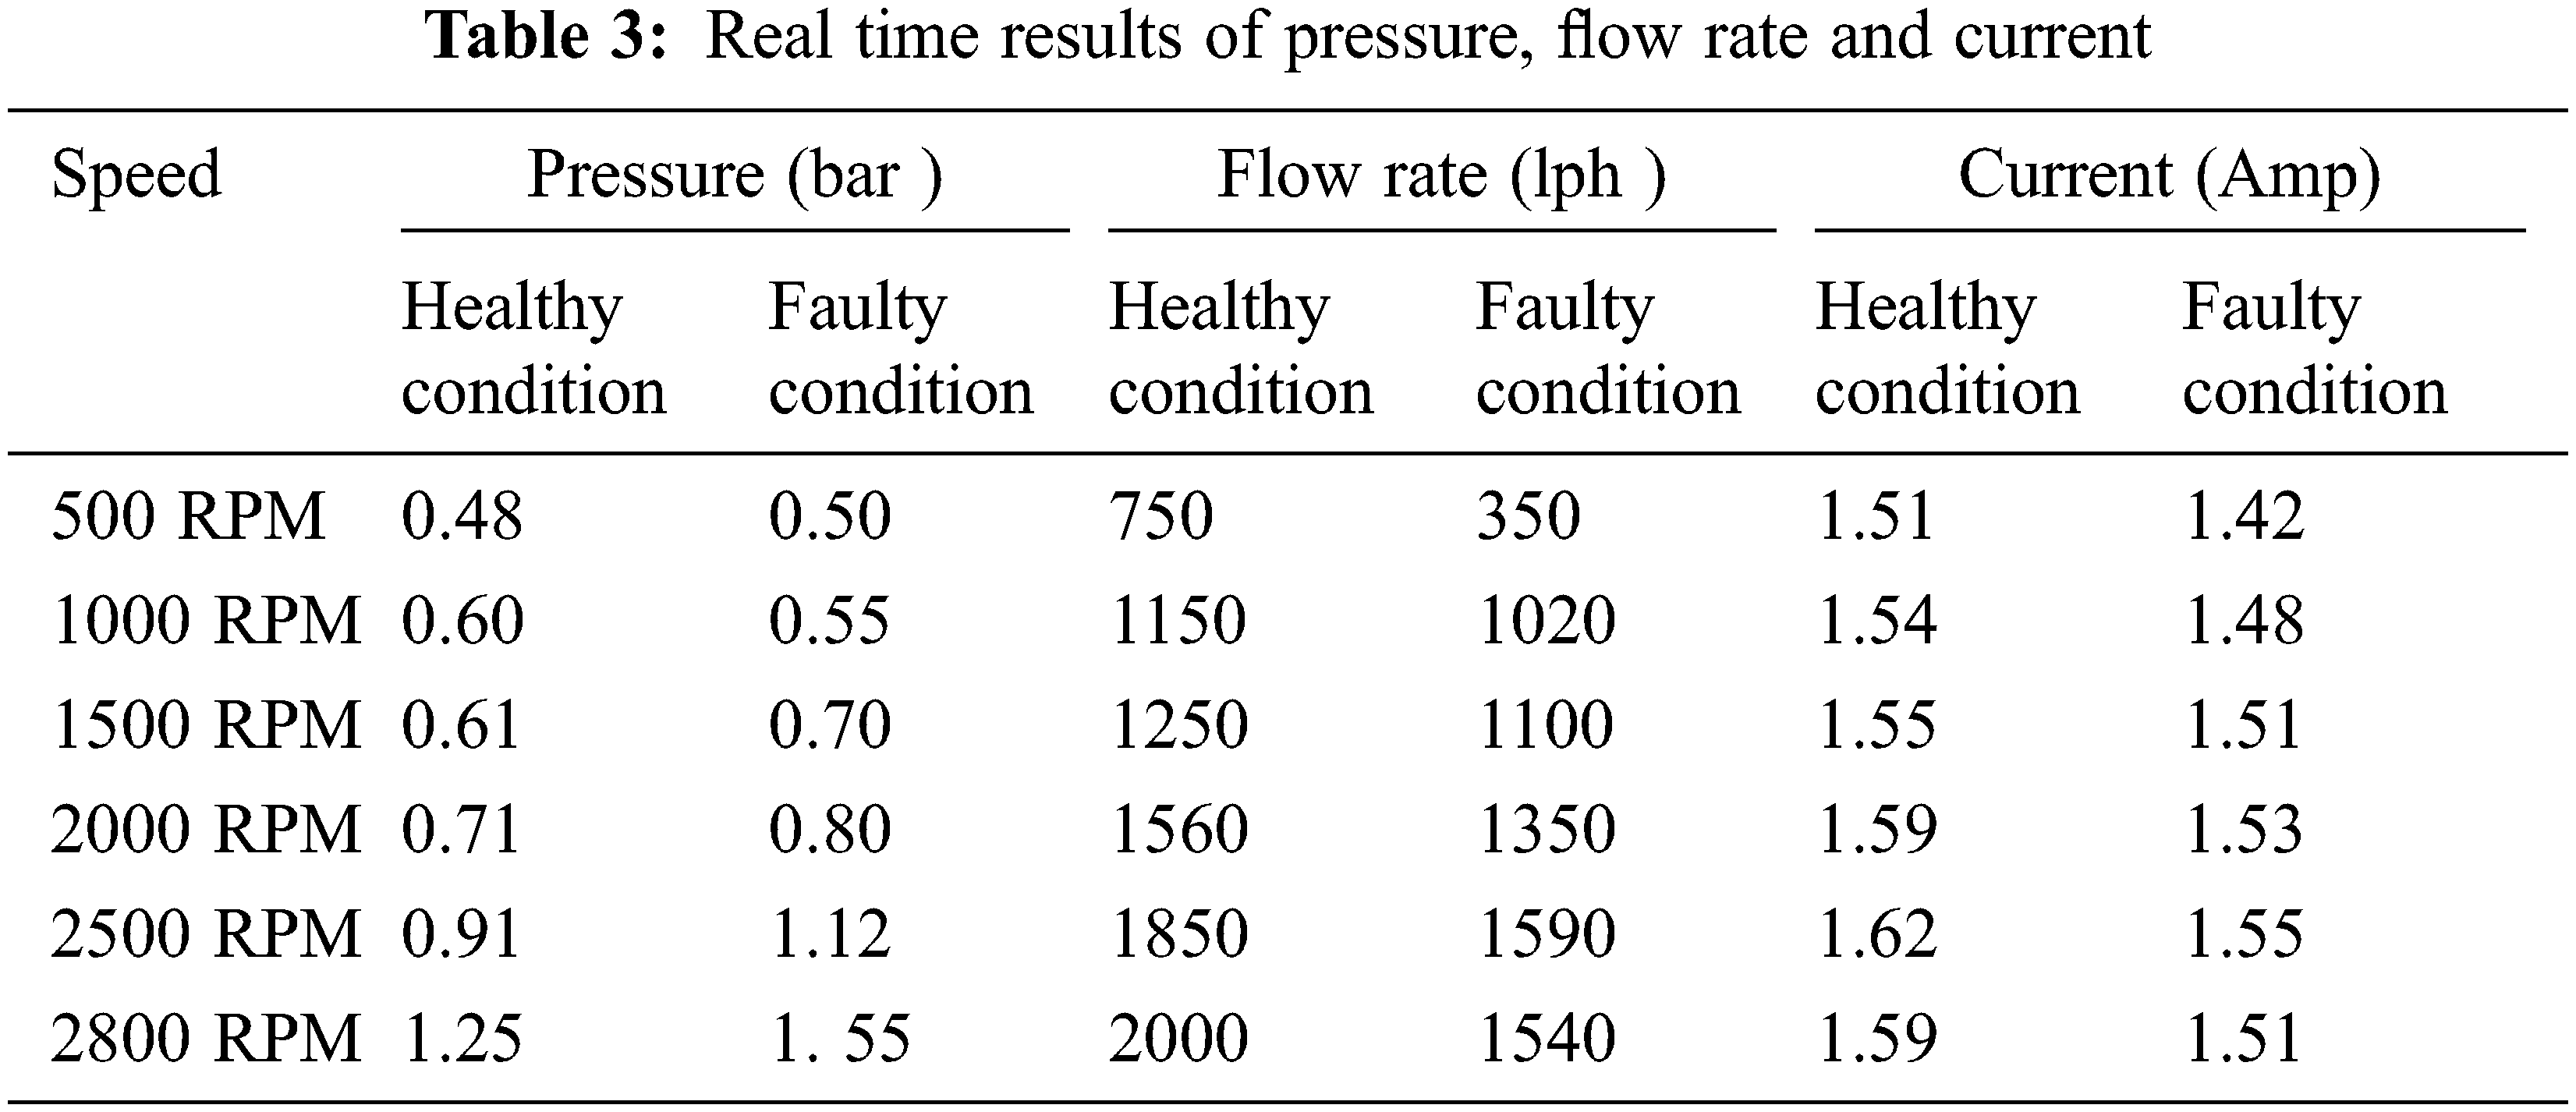

Figure 8: (a) Classification of faulty and no faulty points for 500 RPM speed (b) Classification of faulty and no faulty points for 1000 RPM speed (c) Classification of faulty and no faulty points for 1500 RPM speed (d) Classification of faulty and no faulty points for 1500 RPM speed(e) Classification of faulty and no faulty points for 2500 RPM speed (f) Classification of faulty and no faulty points for 2800 RPM speed
MSVM classification has been applied using three cases which are 480 features (normalized and non-normalized), 80-normalized features and 60 non-normalized features. These are extracted using CWT. The MSVM has been investigated using three kernels: linear, polynomial and radial basis function (RBF). K-NN also extracts 480 features and three neighbour distances like Hamming, Euclidian and Chebychev. Similarly Naïve Bayes and Decision Tree methods also extract 480 features. Here for the K-NN k value has been chosen by number of data points in training set.
There are some conventional methods that can be used for fault detection in pumping systems, such as the characteristics method, column separation method, model predictive control, time frequency analysis, and wave characteristics method [42], which can be compared to ML-based technologies. Most conventional methods cannot predict anomalies until the system is completely damaged. They are incapable of handling the continuous monitoring process and most algorithms have complex mathematical models.
Each algorithm’s accuracy rate, prediction speed, and training time have now been analysed and compared using the classifier learner app. It is seen from the Tabs. 4.1 and 4.2 that with the increment of speed value the training time of each algorithm increases and prediction speed also increases in most of the cases. Accuracy rates of MSVM in almost all the cases are high.
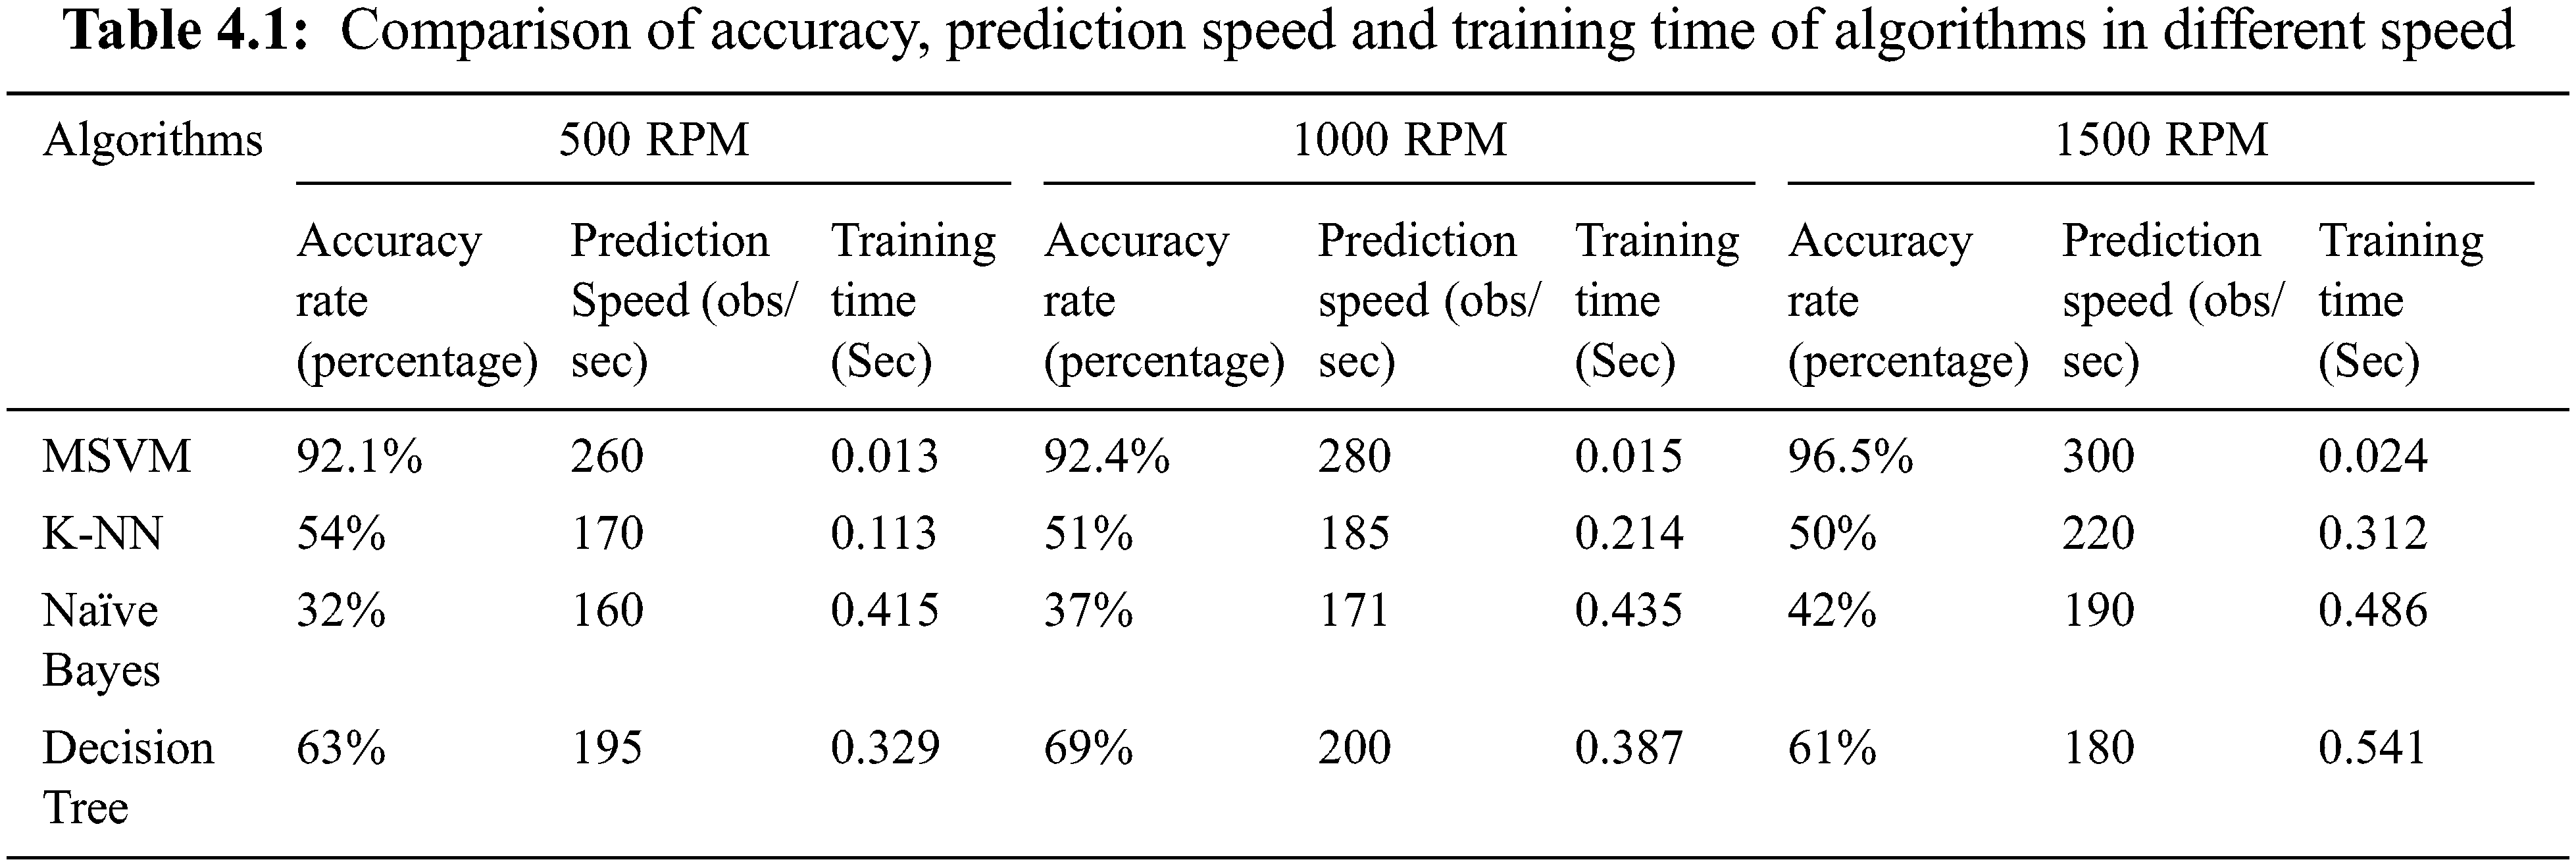
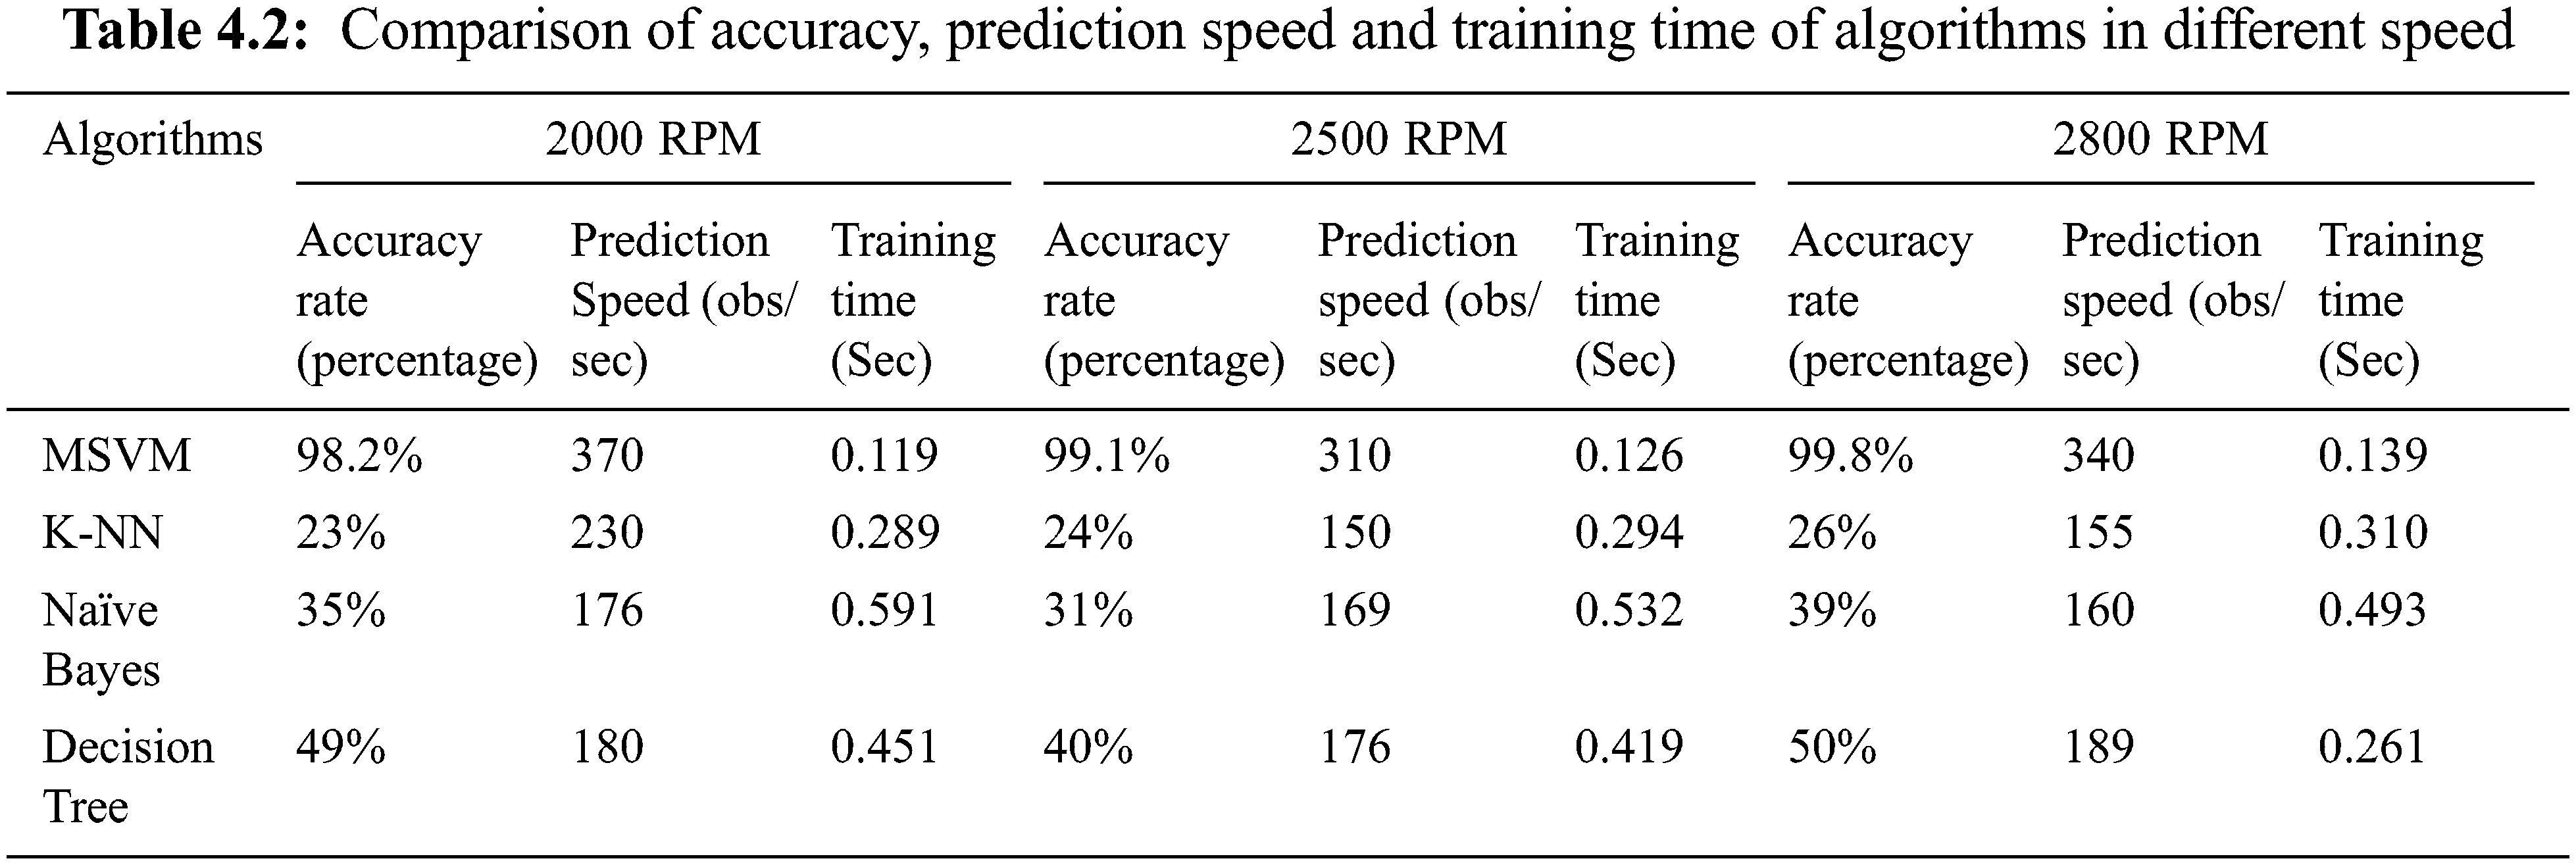
Table 5 discusses the advantages and limitations of various ML algorithms which are used for this experiment and Fig. 9 shows the comparison of overall accuracy of different algorithms.
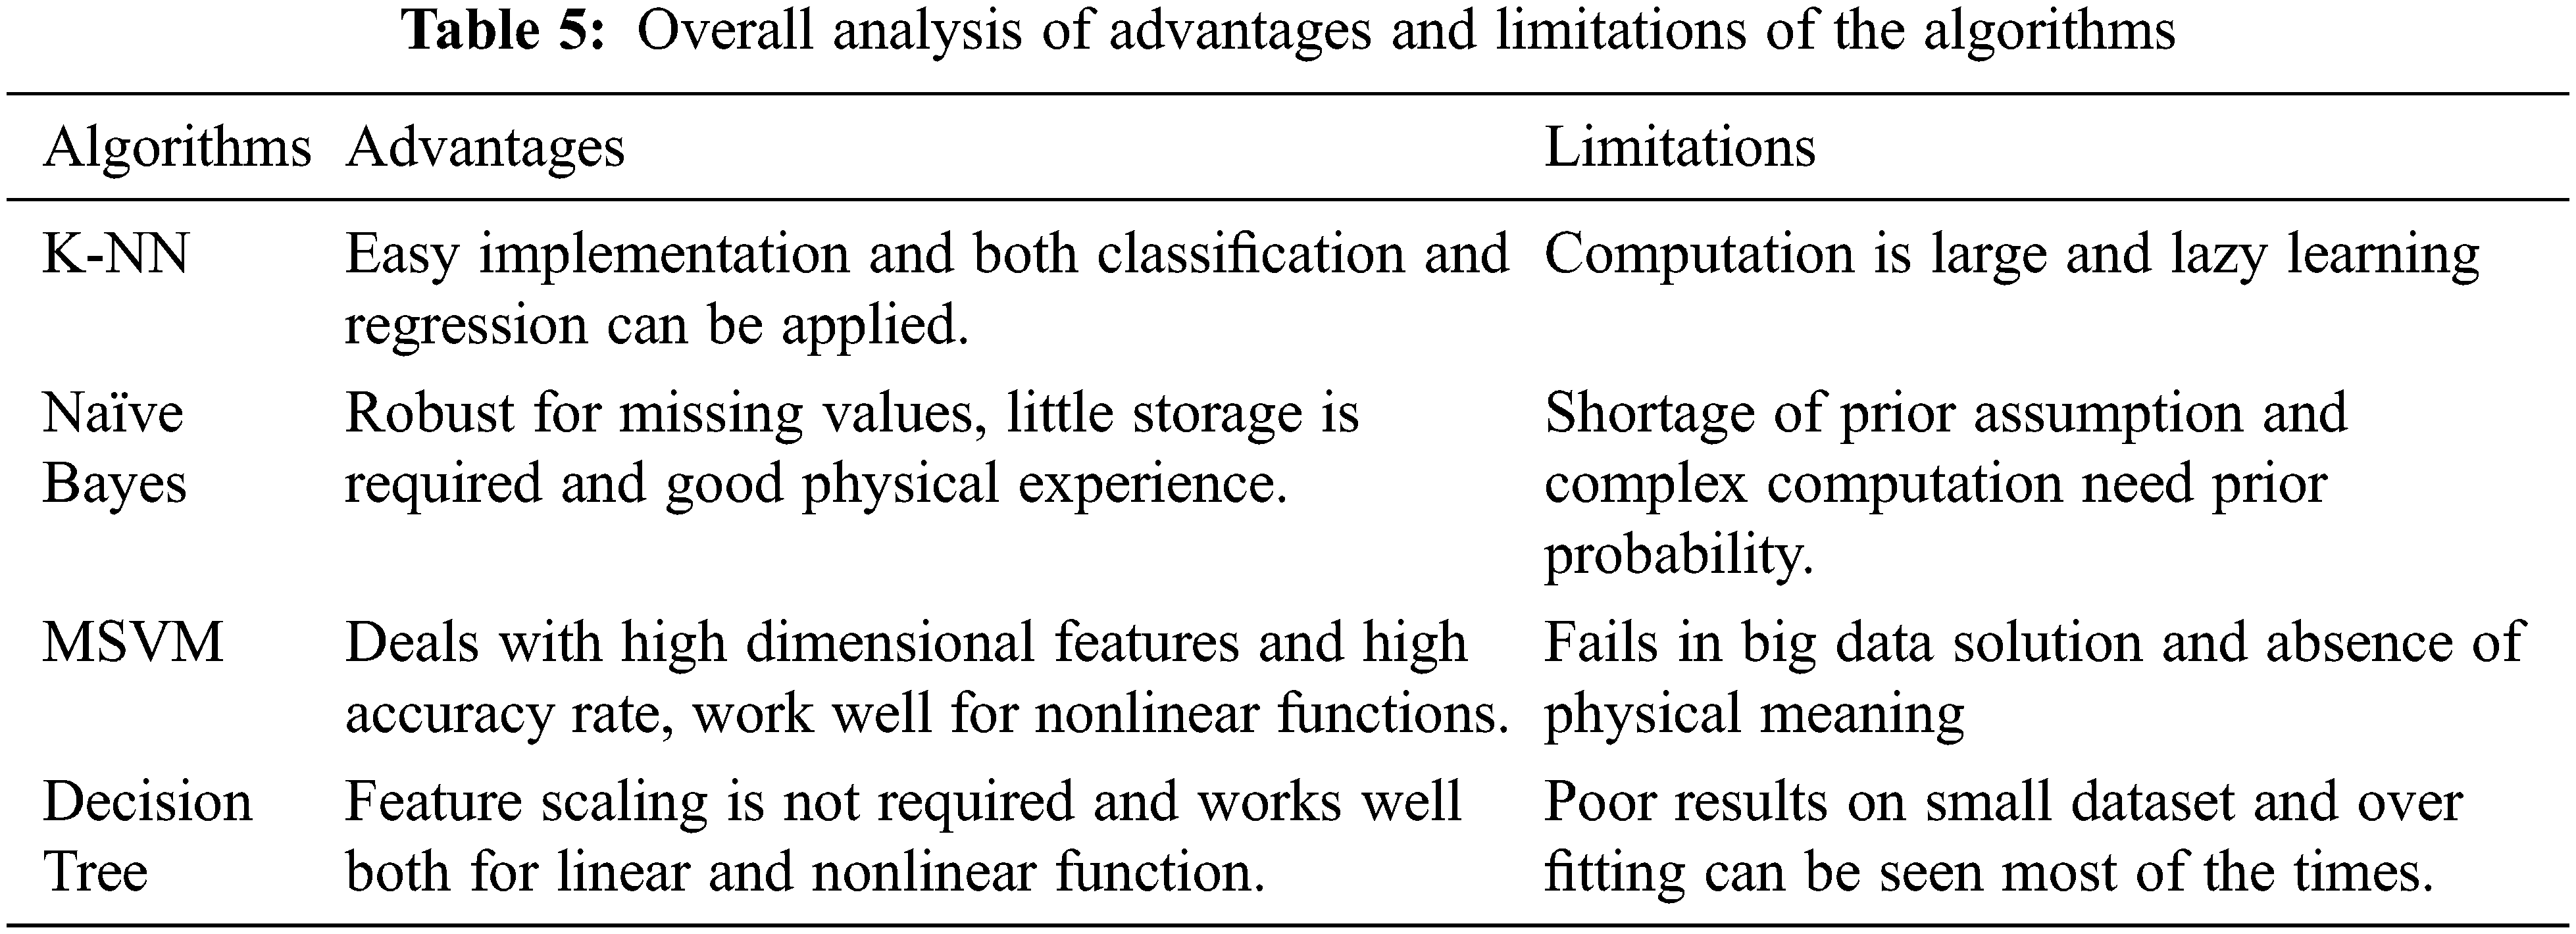
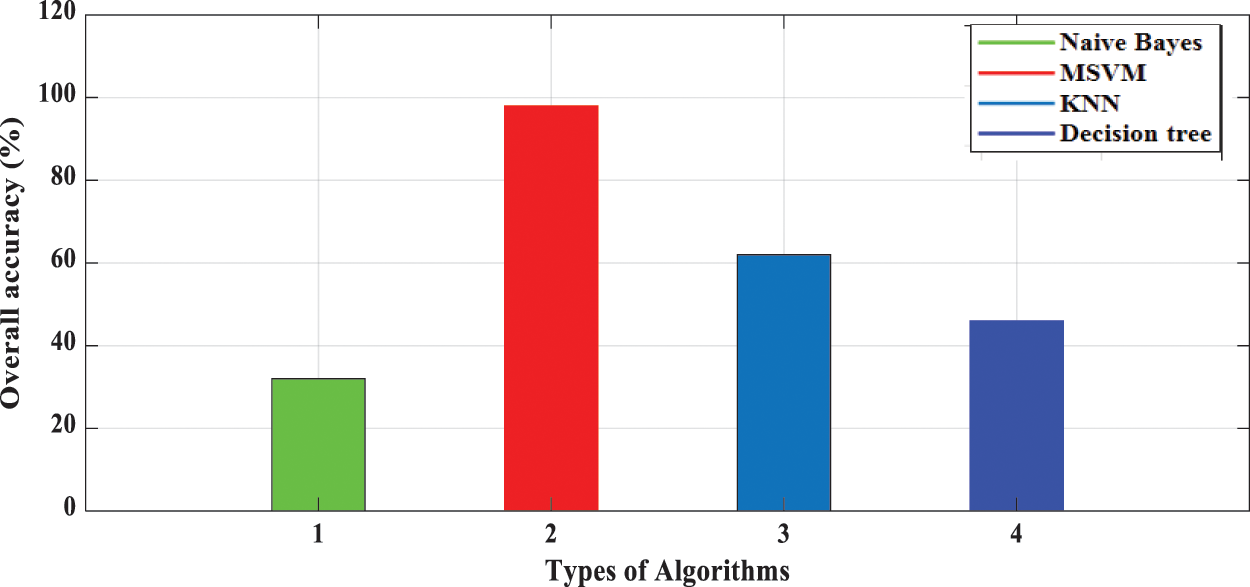
Figure 9: Comparison of overall accuracy of performance of different algorithms
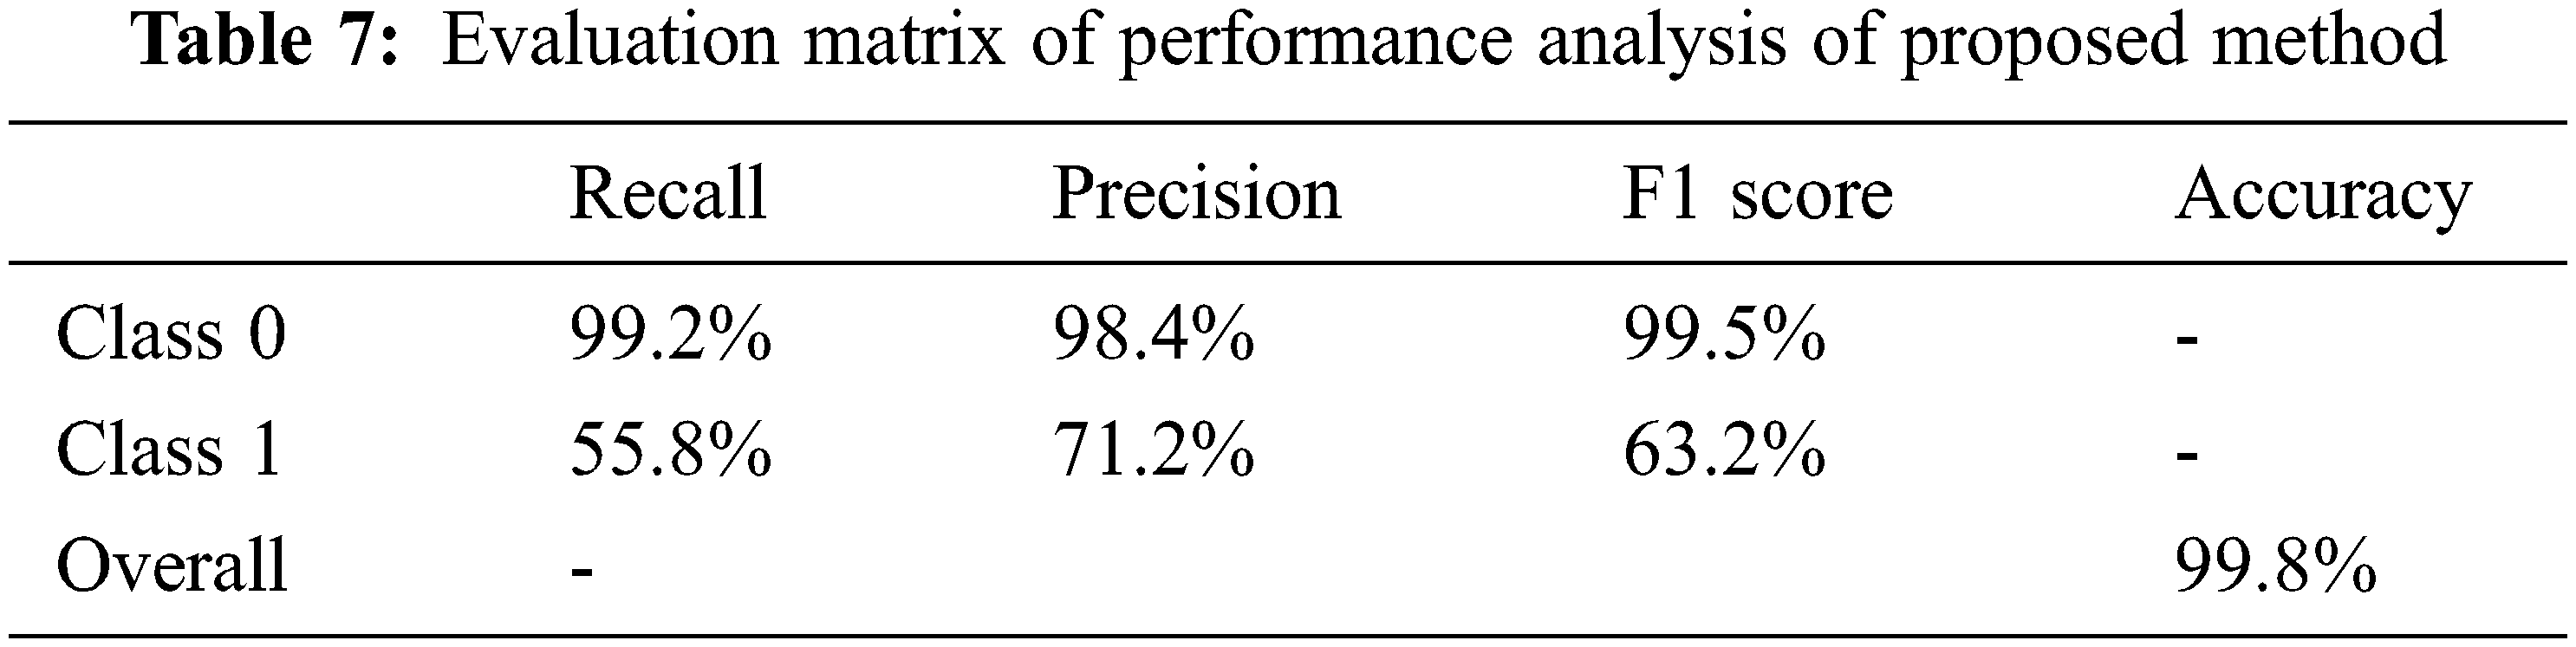
The proposed method evaluates true positive and true negative classes, and the MSVM algorithm achieves 98.3% accuracy for class 0% and 100% accuracy for class 1 based on confusion matrix scores. The scorer node outputs confusion matrix and evaluation matrix statistics have been shown in Tabs. 6 and 7. The columns represent the predicted class in Tab. 6, and the actual class is represented by the rows. According to Tab. 7, MSVM can accurately predict the fault for this experimental analysis. The MSVM’s overall accuracy is 99.8% which is nearly 100%. Through experimental analysis, recall, F1 score and precision are also obtained from this table. MSVM is used for binary classification and in this paper radial basis function (RBF) is used. In MSVM, optimal separating hyperplane is used that creates maximum distance between the plane and the nearest data. Here RBF kernel hyper parameter γ and SVM penalty parameter C have been chosen optimally for better performance. In this research C is chosen as 65 and γ is 0. High value of precision over class 0 to class 1 has been achieved for actual value of true positive and true negative class. Again value of recall is higher for class 0 over class 1. Similarly F1 score also is higher for class 0.

Another option for judging the ML model is the area under the curve (AUC) of the ROC curve. The ROC curve is a popular tool for evaluating binary classification performance. The ROC curve has been obtained in this result at different speeds, and the average value 1 of the AUC shows that the ROC curve of MSVM is the best classifier for this proposed work [Fig. 10]. As the data is limited, even if the synthetic minority oversampling technique (SMOTE) is applied, the class 1 result is not achieved satisfactorily as class 0.
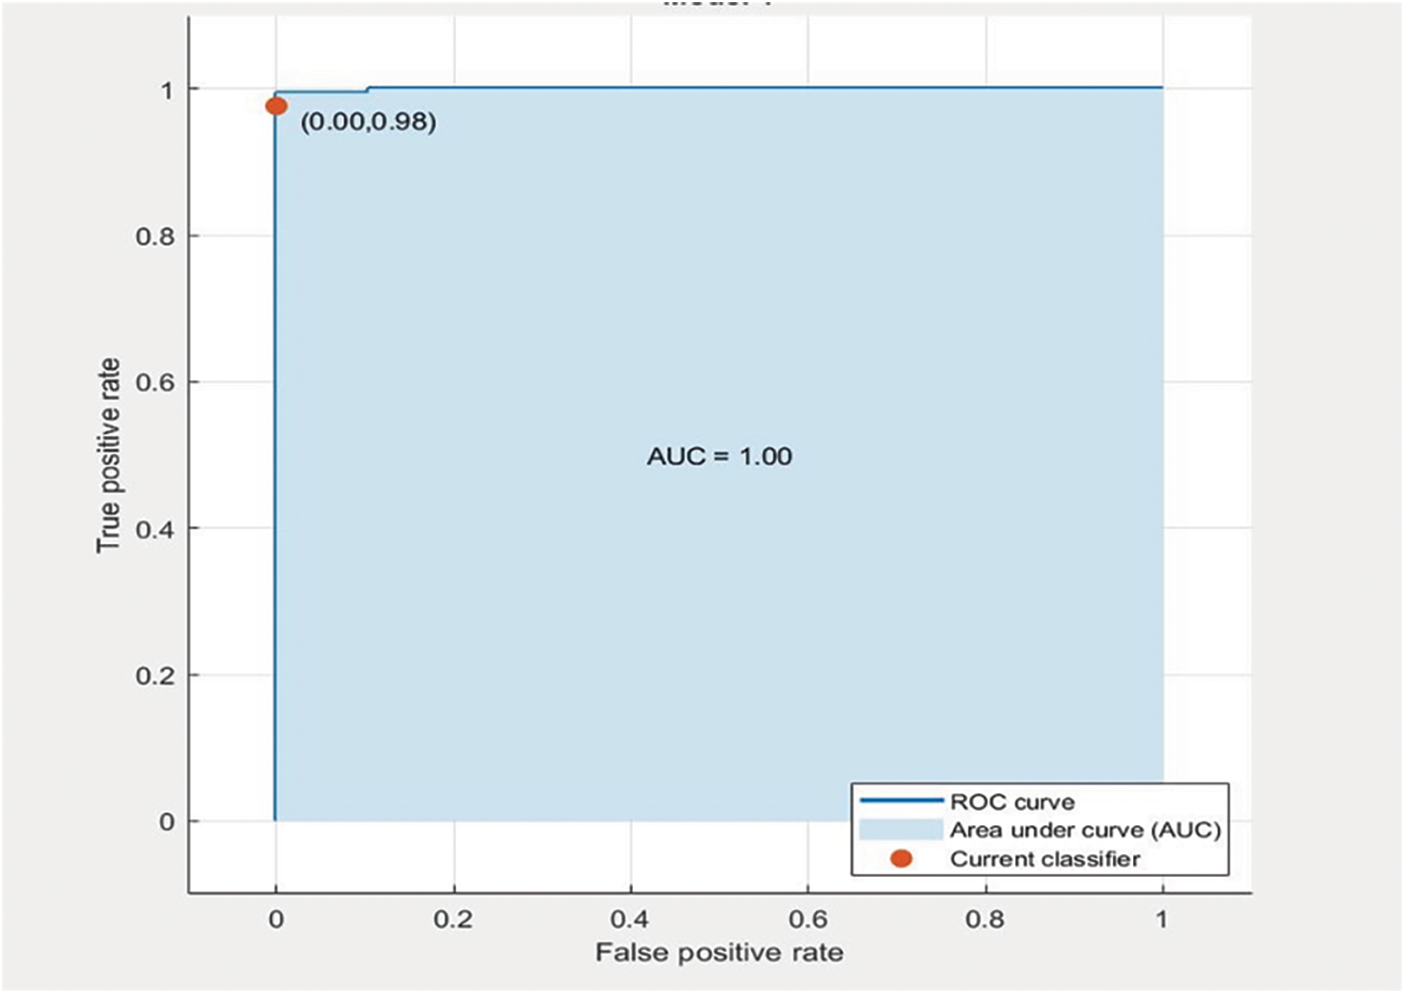
Figure 10: ROC curve of the proposed MSVM algorithm
The ROC curve shows that the AUC value is 1, which helps to reduce the number of false-positive (FP) without affecting true-positive (TP). All of the failure events are incomplete. The dataset contains three non-ambiguous fault events that are very small, and if there is a data imbalance between the classes during training, it can be corrected using the SMOTE. The quality of synthetic data is not as high as that of real-time data. If the amount of data is large, the sampling frequency can be set to a high value.
8 Comparison of Related Work and Proposed Work
Previously, various studies on pump fault detection using ML algorithms were conducted. Those studies are also based on various parameters for selecting the best algorithm. Centrifugal pump fault diagnosis was possible using discriminant feature extraction. In that experiment, single axis vibration data were collected in the time and frequency domains to identify mechanical seal failure. The principal component analysis (PCA) algorithm was used to predict the pump fault. The experiment was conducted using a 20-times random comparison of training and testing data. In this case, the MSVM method was compared to the PCA method. MSVM is used in the proposed experiment and it is compared to SVM and PCA analysis done in previous work. Only one axis vibration data were collected in the feature extraction experiment. In the proposed experiment, three axes vibration data are collected and performances for fault detection have been prominently compared. In another research, the best-suited algorithm was chosen. The performances of other algorithms were compared using the discriminant feature extraction method with the help of a confusion matrix, standard deviation and average true-positive rate [43]. The experiment did not cover the hydraulic fault, whereas in the proposed experiment, the hydraulic fault is detected via vibration fault, and the experiment has been done to create a water hammering problem for analysis of pump fault detection. Though confusion matrix and k-fold cross validation techniques have been used in the proposed experiment, accuracy rate, prediction speed, training time, precision, F1 score, and recall are also considered to determine the best-suited algorithm.
In the oil and gas industry, ML algorithms were used to detect faults in centrifugal pumps and the best suited algorithm was chosen for the experiment based on F1 score, recall, precision and Cohen kappa value. However, in the proposed method, parameters such as accuracy rate, prediction speed, training time, F1 score, recall and precision are considered to obtain a more accurate result. In the previous research by comparing SVM and MLP based on true-positive and true-negative values and accuracy rates, it was seen that accuracy of MLP was better than SVM for that experiment. Similarly, MSVM is chosen as the best suited algorithm among various ML algorithms in the proposed method. The ANFIS model was also used in another research, and MLP was used to detect stator inter turn faults. However, the algorithm is less sensitive and more complex. The proposed study is simpler and has a high sensitivity. Cavitation and water hammering faults were detected by collecting vibration data for a centrifugal pump and using power signature analysis. Only the parameter changes for three pumps with varying pressures were examined in this study [44]. In the proposed method, vibration data have been collected by Siemens test lab SCADA system at different speeds, and ML algorithms have done fault prediction with the changes of parameters. Although vibration analysis was performed to detect cutting tool wear, the use of mean power analysis is an old technique, whereas the proposed research employs high statistical features for the detection of pump fault.
Vibration data were collected at different pressures using the vibsensor app, and a linear regression algorithm was used to predict the water hammering fault in the VFD-based cascade pump. The Vibsensor app failed to record a large amount of data whereas in the proposed experiment, a data acquisition system (DAQ) has been used and sufficient data have been recorded for better analysis. In another study, pump fault was detected using SVM, MLP and GA and hidden layer features were extracted and compared using a confusion matrix. GA necessitates computational time, which is insufficient for all researches.
With the help of adaptive neuro fuzzy system and Fourier transformation, pump fault was identified in a research. ANFIS model was built to find out the accuracy of the model.
SVM and K-NN algorithms were compared in a work and it was identified that for small amount of data K-NN worked well and when the data size was large SVM performed better than K-NN. K-NN is a lazy learner and fails to work in high dimensions and with a large data set.
In the proposed experiment the classification accuracy has been computed for each class as
Here TPR is true positive rate, k represents number of cross validation of k-fold,
The proper way to judge a matrix is to use precision, recall, F1 score value.
The proposed work is compared to other reference works based on accuracy rate, F1 score, training time, prediction speed, precision and recall. It is seen that the prediction speed is faster in the DL-based method, and MSVM also works well for fault classification and all statistical values in the proposed method are better than those in the reference works. Fig. 11 depicts the comparison.
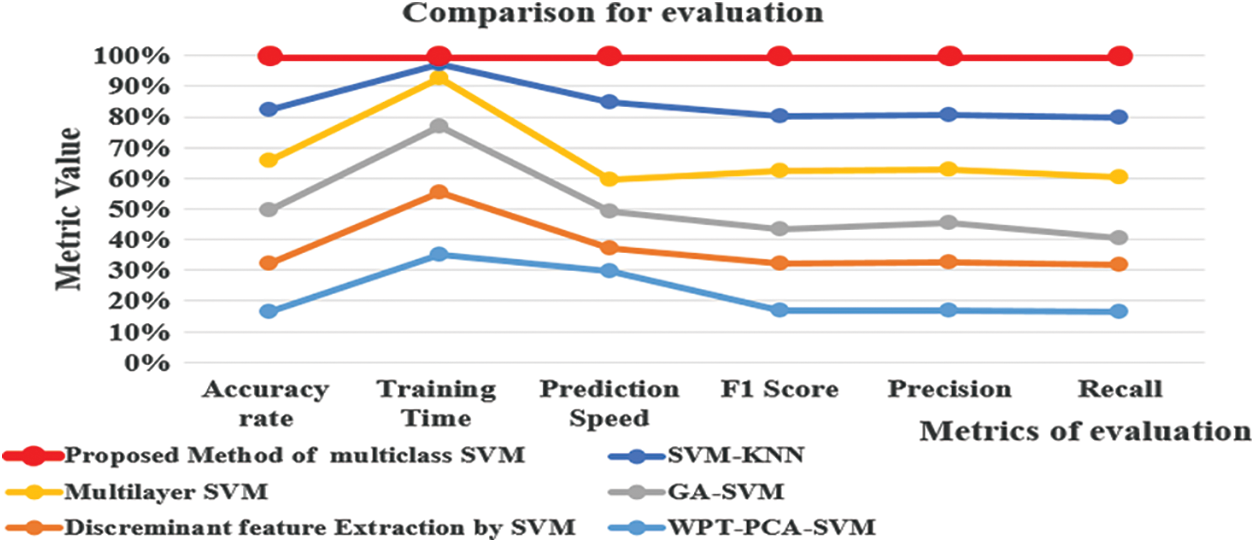
Figure 11: Comparison for evaluation of proposed work with reference works
To evaluate the performance of the MSVM algorithm in proposed work and other algorithms used in reference works a comparison of performances have been discussed in Tab. 8 and in Fig. 12.
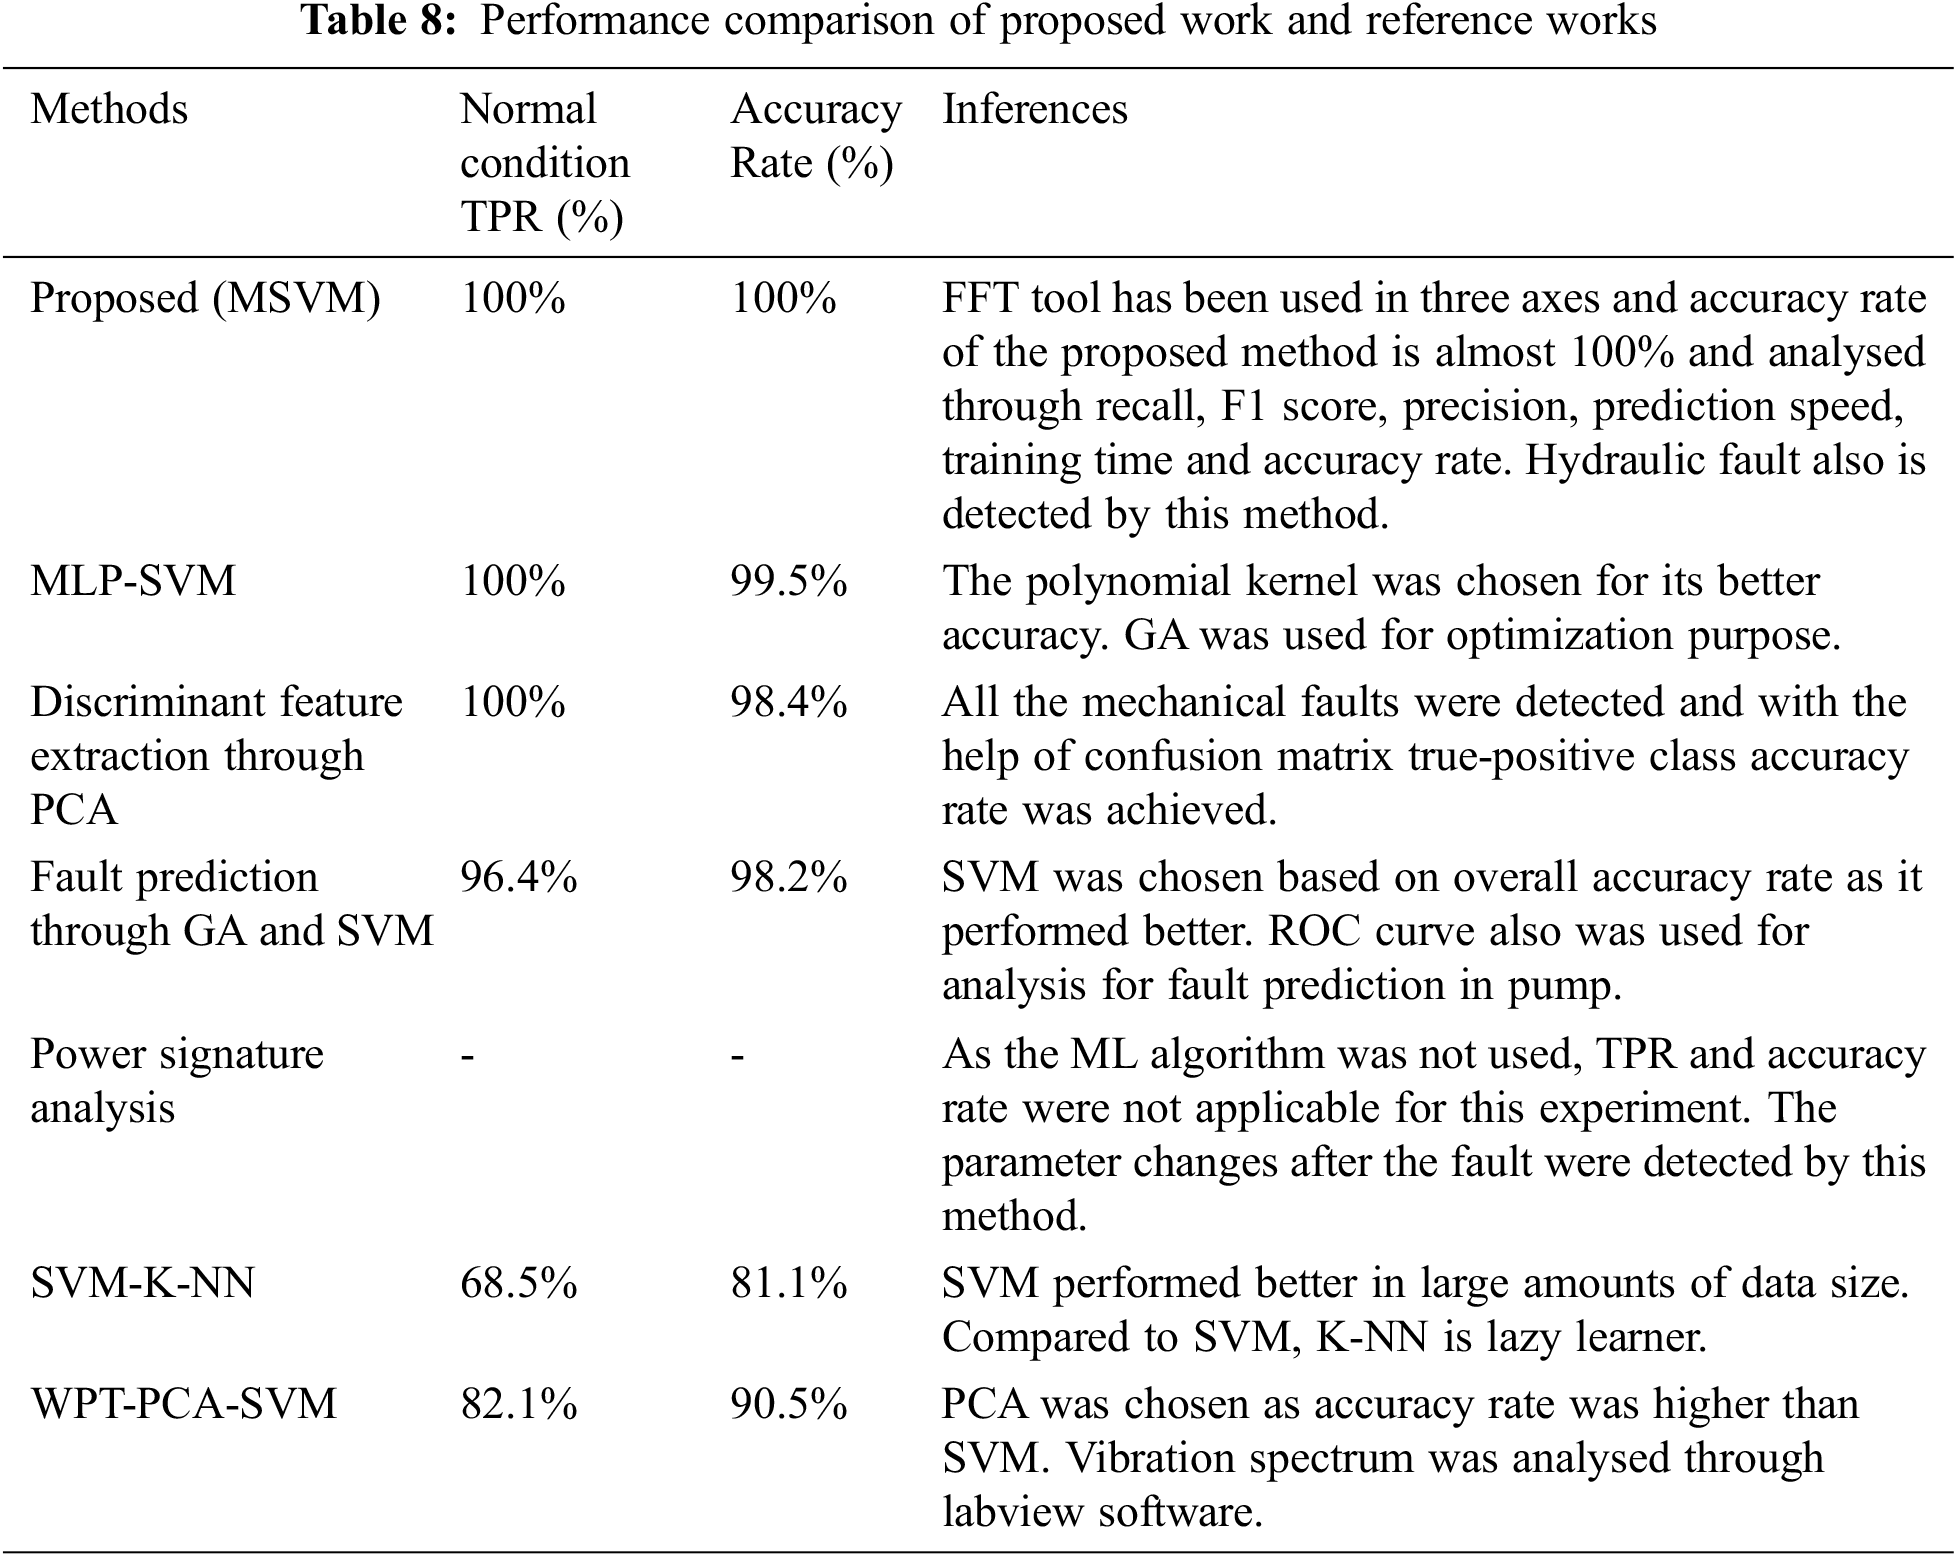

Figure 12: Performance analysis of proposed method and reference works
The present research is the experimental-based hardware setup for vibration analysis during fault condition of the VFD-based master follower centrifugal pump. It focuses on various angles of the research.
a) Verification of parameter changes has been done during a fault condition. For fault detection, ML algorithms such as MSVM, K-NN, Decision Tree and Naive Bayes are used and their performances are compared using Matlab based on accuracy rate, prediction speed and training time.
b) The frequency spectrum data and graph show that the amplitude of the x-axis is greater than that of the y and z axes in different speed conditions. As a result, the system appears to be more unbalanced. The graph shows that the excess vibration is more noticeable in pump 2 than pump 1 at different speeds.
c) The primary goal of the work is to examine the changes caused by vibrational effects in the master follower pump when it is in a faulty state. In a faulty condition, the pressure value increases, the flow rate decreases and the current decreases.
d) Another objective of this research is to compare the performances of ML algorithms used to detect vibration faults in pumping systems and to determine the best algorithm for each experiment.
e) The proposed method has been compared to reference works, and the proposed MSVM algorithm has been compared to other ML algorithms. Based on the performance analysis results, MSVM is found to be more appropriate for this experiment than the other algorithms.
f) The MSVM algorithm’s accuracy rate is high in most of the speed conditions, and its prediction speed is also high. MSVM requires less time to compute the training of the features.
g) The performance of the proposed method of the MSVM algorithm has also been evaluated using the ROC curve. Vibration analysis is essential for monitoring the performance and conditions of centrifugal pumps due to the assembly of the pump’s various components. Vibration analysis can be used to detect general faults and be used as a predictive measure for future faults that the pumps may encounter.
There are some limitations to the proposed research. It fails to work with large amounts of data like DL and sometimes the performances of the classes are poor due to a lack of data. As a case study, the research only focuses on the industrial pump application and is not cross-checked with other types of pump applications. The proposed work’s practical implementation is that it can detect anomalies in industrial multistage pumps that require continuous water supply. Later on, the algorithm can be tested in other types of pump fault detection as well as in other machineries. In the near future, authors will focus more on data management in order to conduct further research and improve performance.
Author Contributions: All authors have equally contributed to articulate the research work for its final depiction as a full research paper.
Acknowledgement: The authors like to express sincere gratitude to Danfoss Advanced Drives Laboratory, VIT Vellore, for making this research work for execution and technical implementation in real-time. This is the industry-academic joint collaborative project for industrial pumping solution. The collaboration is between VIT Vellore and Danfoss Pvt Ltd. industry, Chennai as well as Denmark.
Funding Statement: No funding was received for the preparation of this manuscript.
Conflicts of Interest: The author declare that they have no conflicts of interest to report regarding the present study.
References
1. D. Nabanita, K. Palanisamy, S. Umashankar, S. Padmanaban, F. Blaabjerg et al., “Identification of water hammering for centrifugal pump drive systems,” Applied Sciences, vol. 10, no. 8, pp. 2683, 2020. [Google Scholar]
2. N. R. Sakthivel, B. B. Nair, M. Elangovan, V. Sugumaran and S. Saravanmurugan, “Comparison of dimensionality reduction techniques for the fault diagnosis of mono block centrifugal pump using vibration signals,” Engineering Science and Technology, an International Journal, vol. 17, no. 1, pp. 30–38, 2014. [Google Scholar]
3. V. K. A. Shankar, S. Umashankar, S. Paramasivam and N. Hanigovszki, “A comprehensive review on energy efficiency enhancement initiatives in centrifugal pumping system,” Applied Energy, vol. 181, pp. 495–513, 2016. [Google Scholar]
4. S. Umashankar, D. Nabanita, S. Padmanaban, D. Almakhles, K. Kyslan et al., “Identification of sludge in water pumping system using support vector machine,” in 2019 Int. Conf. on Electrical Drives & Power Electronics (EDPE), Tatras, Slovakia, IEEE, pp. 403–408, 2019. [Google Scholar]
5. A. Tobi, M. A. Saud, G. Bevan, P. Wallace, D. Harrison et al., “Centrifugal pump condition monitoring and diagnosis using frequency domain analysis,” in Int. Conf. on Condition Monitoring of Machinery in Non-Stationary Operation, Springer, Cham, pp. 122–131, 2018. [Google Scholar]
6. F. Saeid, H. Ahmadi, A. Jaefari, M. R. A. A. Abad and M. R. Kohan, “897. Artificial neural network based classification of faults in centrifugal water pump,” Journal of Vibroengineering, vol. 14, no. 4, pp. 1734–1744, 2012. [Google Scholar]
7. J. A. B. C. Haylock, A. Mecrow, G. Jack and D. J. Atkinson, “Operation of a fault tolerant PM drive for an aerospace fuel pump application,” IET Journal, vol. 145, pp. 133–137, 1997. [Google Scholar]
8. S. Umashankar, D. Nabanita, S. Padmanaban, S. C. Bharadwaj, Z. Leonowicz et al., “Comparative study of cavitation problem detection in pumping system using SVM and K-nearest neighbour method,” in 2020 IEEE Int. Conf. on Environment and Electrical Engineering and 2020 IEEE Industrial and Commercial Power Systems Europe (EEEIC/I&CPS Europe), Madrid, Spain, IEEE, pp. 1–6, 2020. [Google Scholar]
9. M. K. Ghani, A. Mazin, S. Mohammed, S. Ibrahim, A. Mostafa et al., “Implementing an efficient expert system for services center management by fuzzy logic controller,” Journal of Theoretical & Applied Information Technology, vol. 95, no. 13, pp. 3127–3135, 2017. [Google Scholar]
10. J. Kaur, A. Shakeel, K. Yogesh, A. Alaboudi, N. Jhanjhi et al., “Packet optimization of software defined network using lion optimization,” Cmc-Computers Materials & Continua, vol. 69, no. 2, pp. 2617–2633, 2021. [Google Scholar]
11. M. A. Mohammed, A. I. Belal, K. Dheyaa and I. Ahmed, “Case based reasoning shell frameworks decision support tool,” Indian Journal of Science and Technology, vol. 9, no. 42, pp. 1–8, 2016. [Google Scholar]
12. A. Lakhan, M. Elhoseny, M. A. Mohammed and M. M. Jaber, “SFDWA: Secure and fault-tolerant aware delay optimal workload assignment schemes in edge computing for internet of drone things applications,” Wireless Communications and Mobile Computing, vol. 2022, pp. 1–11, 2022. [Google Scholar]
13. R. N. Dash, “Fault diagnosis in induction motor using soft computing techniques,” PhD Diss, pp. 1–129, 2010. [Google Scholar]
14. S. A. Mostafa, A. Mustapha, A. A. Hazeem, S. H. Khaleefah and M. A. Mohammed, “An agent-based inference engine for efficient and reliable automated car failure diagnosis assistance,” IEEE Access, vol. 6, no. 83, pp. 22–31, 2018. [Google Scholar]
15. A. Arbaoui, A. Ouahabi, S. Jacques and M. Hamiane, “Concrete cracks detection and monitoring using deep learning-based multiresolution analysis,” Electronics, vol. 15, pp. 1772, 2021. [Google Scholar]
16. S. A. Mostafa, M. S. Ahmad, A. Mustapha and M. A. Mohammed, “Formulating layered adjustable autonomy for unmanned aerial vehicles,” International Journal of Intelligent Computing and Cybernetics, vol. 10 no. 4, pp. 430–450, 2017. [Google Scholar]
17. M. A. Mohammed, A. M. K. Ghani, N. A. Arunkumar, O. I. Obaid, S. A. Mostafa et al., “Genetic case-based reasoning for improved mobile phone faults diagnosis,” Computers & Electrical Engineering, vol. 71, pp. 212–22, 2018. [Google Scholar]
18. W. Rmili, A. Ouahabi, R. Serra and R. Leroy, “An automatic system based on vibratory analysis for cutting tool wear monitoring,” Measurement, vol. 77, no. 1, pp. 17–23, 2016. [Google Scholar]
19. I. Adjabi, A. Ouahabi, A. Benzaoui and S. Jacques, “Multi-block color-binarized statistical images for single-sample face recognition,” Sensors, vol. 3, no. 7, pp. 28, 2021. [Google Scholar]
20. S. Goyal, S. Bhushan, Y. Kumar, A. U. Rana, M. R. Bhutta et al., “An optimized framework for energy-resource allocation in a cloud environment based on the whale optimization algorithm,” Sensors, vol. 21, no. 5, pp. 1583, 2021. [Google Scholar]
21. W. Huaqing and P. Chen, “Intelligent method for condition diagnosis of pump system using discrete wavelet transform, rough sets and neural network,” in 2007 Second Int. Conf. on Bio-Inspired Computing: Theories and Applications, Zhengzhou, China, IEEE, pp. 24–28, 2007. [Google Scholar]
22. D. Nabanita, K. Palanisamy and S. Umashankar, “Effect of motor vibration problems on power quality of water pumping at residency,” In IOP Conference Series: Materials Science and Engineering, IOP Publishing, vol. 937, no. 1, pp. 012019, 2020. [Google Scholar]
23. A. Neway, R. Foster and A. Ellis, “Renewable Energy for Water Pumping Applications In Rural Villages,” Period of Performance: April 1, 2001--September 1, 2001, No. NREL/SR-500-30361, National Renewable Energy Lab. (NRELGolden, CO (United States2003. [Google Scholar]
24. A. Tobi, M. A. Saud, G. Bevan, P. Wallace, D. Harrison et al., “Fault diagnosis of a centrifugal pump using MLP-GABP and SVM with CWT,” Engineering Science and Technology, an International Journal, vol. 22, no. 3, pp. 854–861, 2019. [Google Scholar]
25. L. Jiaxing, S. Yuan, S. Parameswaran, J. Yuan, X. Ren et al.,“ “Investigation on the vibration and flow instabilities induced by cavitation in a centrifugal pump,” Advances in Mechanical Engineering, vol. 9, no. 4, pp. 1687814017696225, 2017. [Google Scholar]
26. A. Zahoor, A. Rai, A. S. Maliuk and J. -M. Kim, “Discriminant feature extraction for centrifugal pump fault diagnosis,” IEEE Access, vol. 8, pp. 165512–165528, 2020. [Google Scholar]
27. L. Yaguo, B. Yang, X. Jiang, F. Jia, N. Li et al., “Applications of machine learning to machine fault diagnosis: A review and roadmap,” Mechanical Systems and Signal Processing, vol. 138, pp. 106587, 2020. [Google Scholar]
28. O. P. Francesco, A. Zoccheddu, L. Sassu, C. Mattia, R. Cozza et al., “Machine learning approach using MLP and SVM algorithms for the fault prediction of a centrifugal pump in the oil and gas industry,” Sustainability, vol. 12, no. 11, pp. 4776, 2020. [Google Scholar]
29. D. Nabanita, S. Umashankar, V. K. A. Shankar, S. Padmanaban, Z. Leonowicz et al., “Centrifugal pump cavitation detection using machine learning algorithm technique,” in 2018 IEEE Int. Conf. on Environment and Electrical Engineering and 2018 IEEE Industrial and Commercial Power Systems Europe (EEEIC/I&CPS Europe), Madrid, Spain, IEEE, pp. 1–6, 2018. [Google Scholar]
30. V. K. A. Shankar, S. Umashankar, S. Paramasivam and N. Hanigovszki, “Real time simulation of variable speed parallel pumping system,” Energy Procedia, vol. 142, pp. 2102–2108, 2017. [Google Scholar]
31. V. K. A. Shankar, S. Umashankar, S. Paramasivam, S. Padmanaban, F. Blaabjerg et al., “Experimental investigation of power signatures for cavitation and water hammer in an industrial parallel pumping system,” Energies, vol. 12, no. 7, pp. 1351, 2019. [Google Scholar]
32. F. Saeid, “Vibration based fault detection of centrifugal pump by fast Fourier transform and adaptive neuro-fuzzy inference system,” Journal of Mechanical Engineering and Technology, vol. 1, no. 3, pp. 82–87, 2013. [Google Scholar]
33. Z. Li, Y. Yang, T. Wang, W. Han, R. Wu et al., “An experimental study on the water hammer with cavity collapse under multiple interruptions,” Water, vol. 12, no. 9, pp. 2566, 2020. [Google Scholar]
34. A. Albraik., F. Althobiani, G. Fengshou and A. Ball, “Diagnosis of centrifugal pump faults using vibration methods,” In Journal of Physics: Conference Series, IOP Publishing, vol. 364, no. 1, pp. 012139, 2012. [Google Scholar]
35. A. M. Abdulaziz and A. Kotb, “Detection of pump cavitation by vibration signature,” Australian Journal of Mechanical Engineering, vol. 15, no. 2, pp. 103–110, 2017. [Google Scholar]
36. A. Raheem, F. Khalid and W. A.-Karem, “Rolling bearing fault diagnostics using artificial neural networks based on laplace wavelet analysis,” International Journal of Engineering, Science and Technology, vol. 2, no. 6, pp. 278–290, 2010. [Google Scholar]
37. A. Obaidi and A. Ramadhan, “Investigation of effect of pump rotational speed on performance and detection of cavitation within a centrifugal pump using vibration analysis,” Heliyon, vol. 5, no. 6, pp. e01910, 2019. [Google Scholar]
38. C. Luis and A. Akan, Signals and Systems Using MATLAB, Elsevier, London: Academic Press, 2018. [Google Scholar]
39. L. Jing and Q. Liangsheng, “Feature extraction based on morlet wavelet and its application for mechanical fault diagnosis,” Journal of Sound and Vibration, vol. 234, no. 1, pp. 135–148, 2000. [Google Scholar]
40. N. Saravanan and K. I. Ramachandran, “Incipient gear box fault diagnosis using discrete wavelet transform (DWT) for feature extraction and classification using artificial neural network (ANN),” Expert Systems with Applications, vol. 37, no. 6, pp. 4168–4181, 2010. [Google Scholar]
41. D. Nabanita, K. Palanisamy and S. Umashankar, “Application of Machine Learning Algorithm for Anomaly Detection for Industrial Pumps,” in Machine Learning Algorithms for Industrial Applications, Cham: Springer, pp. 237–263, 2021. [Google Scholar]
42. S. Mouleeswaran, M. Yuvaraja and M. Kok, “Fault Diagnosis of Centrifugal Pump and Vibration Control Using Shape Memory Alloy Based ATDVA,” in Applied Mechanics and Materials, Switzerland: Trans Tech Publications Ltd, vol. 787, pp. 927–931, 2015. [Google Scholar]
43. N. R. Sakthivel., B. B. Nair and V. Sugumaran, “Soft computing approach to fault diagnosis of centrifugal pump,” Applied Soft Computing, vol. 12, no. 5, pp. 1574–1581, 2012. [Google Scholar]
44. B. Gerrit, S. Thul, M. Baranski and D. Müller, “Real-world application of machine-learning-based fault detection trained with experimental data,” Energy, vol. 198, no. 117, pp. 323, 2020. [Google Scholar]
Cite This Article
 Copyright © 2023 The Author(s). Published by Tech Science Press.
This work is licensed under a Creative Commons Attribution 4.0 International License , which permits unrestricted use, distribution, and reproduction in any medium, provided the original work is properly cited.
 Downloads
 Citation Tools