
 Submit a Paper
 Propose a Special lssue
 Open Access
ARTICLE
A Novel Fusion System Based on Iris and Ear Biometrics for E-exams
Department of Computer Science, Faculty of Specific Education, Mansoura University, Egypt
* Corresponding Author: S. A. Shaban. Email:
Intelligent Automation & Soft Computing 2023, 35(3), 3295-3315. https://doi.org/10.32604/iasc.2023.030237
Received 22 March 2022; Accepted 25 May 2022; Issue published 17 August 2022
 View Full Text
 Download PDF
Abstract
With the rapid spread of the coronavirus epidemic all over the world, educational and other institutions are heading towards digitization. In the era of digitization, identifying educational e-platform users using ear and iris based multimodal biometric systems constitutes an urgent and interesting research topic to preserve enterprise security, particularly with wearing a face mask as a precaution against the new coronavirus epidemic. This study proposes a multimodal system based on ear and iris biometrics at the feature fusion level to identify students in electronic examinations (E-exams) during the COVID-19 pandemic. The proposed system comprises four steps. The first step is image preprocessing, which includes enhancing, segmenting, and extracting the regions of interest. The second step is feature extraction, where the Haralick texture and shape methods are used to extract the features of ear images, whereas Tamura texture and color histogram methods are used to extract the features of iris images. The third step is feature fusion, where the extracted features of the ear and iris images are combined into one sequential fused vector. The fourth step is the matching, which is executed using the City Block Distance (CTB) for student identification. The findings of the study indicate that the system’s recognition accuracy is 97%, with a 2% False Acceptance Rate (FAR), a 4% False Rejection Rate (FRR), a 94% Correct Recognition Rate (CRR), and a 96% Genuine Acceptance Rate (GAR). In addition, the proposed recognition system achieved higher accuracy than other related systems.Keywords
Coronavirus (COVID-19) is a communicable disease that began spreading in December 2019 in Wuhan, China. Within a short time, this disease engulfed the whole world, infecting about 305 million people worldwide and claiming more than 5.48 million lives as of this writing. As a result, on March 11, 2020, the World Health Organization (WHO) declared COVID-19 a worldwide epidemic [1–3]. Most countries tried to implement restrictive measures to contain COVID-19, including physical distancing, preventing mass meetings and events, wearing face masks, stopping all unnecessary activities, and closing educational institutions. This led to denying approximately 89% of students in 188 countries access to education [4–6]. Hence, educational institutions have to apply the distance learning system to be able to continue providing educational activities for students [7].
E-exams are an important part of distance learning systems, which were adopted as the main student assessment tool in times of the pandemic [4]. No doubt, there are some challenges facing the security of the e-learning environment, especially the E-exams [7]. One of the major challenges is the authentication of the examinee’s identity in the E-exam environments [8,9], especially with wearing face masks as a precaution in the light of the spread of the COVID-19 pandemic that allows easy impersonation and unauthorized access to the exams.
Traditional personal authentication and identification techniques such as access cards and Personal Identification Numbers (PINs) are insufficient to achieve a high level of security because they can be stolen and lost, whereas passwords can be easily forgotten, copied, and shared [10–12]. Therefore, there was a need to use a more secure identification method called the biometric recognition system.
Biometric systems constitute a major branch of intelligent systems that aim for automatic identity recognition [13] by utilizing the pattern recognition technique [14]. Biometric systems are more secure, reliable, and successful than traditional personal identification techniques. They are classified into two kinds: unimodal and multimodal systems [15]. Unimodal biometric systems use a single biometric, whereas multimodal biometric systems integrate two or more biometrics [16,17]. Multimodal biometric systems have attracted more attention than unimodal ones, as they can enhance the security level and improve the overall recognition rate by fusion of multiple biometric sources together [18]. This fusion can take place at four different levels: sensor, feature, score, and decision [19,20]. At the sensor-fusion level, many images are obtained for the same biometric feature. Then, these images are combined to get a higher-quality image. At the feature-fusion level, the traits’ features are extracted and combined to form a single new vector. This makes the vector richer in information and may lead to performance improvement. At the score-fusion level, each biometric system applies the matching algorithm to its extracted features individually and then fuses the matching results. At the decision-fusion level, each single-mode biometric system outputs its autonomous decision. After that, individual decisions will be integrated to generate the final decision [19–23].
This study proposes a student identification system for e-exams based on iris and ear biometrics. Iris and ear biometrics are chosen in this present work because of certain advantages they have over other methods. Firstly, the mandatory wearing of face masks as a precautionary measure makes these biometrics more suitable. Secondly, iris biometric recognition is one of the best authentication methods [24,25] because it has several unique features. These include the impossibility of two irises matching in their mathematical detail, even among identical twins. Moreover, the iris is an externally visible internal organ and hence does not need closer touching to acquire its biometrics, unlike the hand, fingerprint, and other organs [26,27]. Thirdly, ear biometrics is the latest trend in biometric technology, gaining the interest of many researchers recently. In addition, the structure of the human ear is rich and stable and never changes. In addition, the ear is not affected by factors like using make-up, wearing glasses, or facial expressions. Moreover, the ear is apparent and exposed despite wearing face masks, and it is very easy to obtain an image of the ear, which can be imaged remotely and covertly without the intervention of the person himself.
Multimodal biometric recognition is a recent and necessary research trend in this digital age. Only a few multimodal biometric systems have been proposed with the use of different levels of fusion. Hamd et al. developed a multimodal system based on the fusion of iris and face traits for human identification. Features were extracted using four techniques. The Gray Level Co-occurrence Matrix (GLCM) and Local Binary Pattern (LBP) achieved an accuracy rate of 100%, whereas the Principal Component Analysis and Fourier Descriptors achieved only 97.5% [19]. Ammour et al. presented a multimodal biometric system for the face and iris. Iris features were extracted using a multi-resolution 2D Log-Gabor filter along with Spectral Regression Kernel Discriminant Analysis, whereas the features of the face were extracted using the SSA-NIG technique. The results showed that the suggested system enhances the performance of unimodal biometrics based on face or iris [28]. Byahatti et al. presented a multimodal biometric system based on the fusion of face and voice biometrics. The fusion of Log-Gabor and LBP occurred when extracting facial features. In addition, voice features were fused with the use of Mel-Frequency Cepstral Coefficients and Linear Predictive Coefficients. The similarity was computed using the Euclidian distance, whereas the K-Nearest Neighbor Classifier was utilized in decision-making. The results showed that feature level fusion is more accurate than other levels of fusion [29]. Vijay et al. proposed a model for multimodal biometric recognition that fused three traits: iris, ear, and finger vein. Texture features and BiComp features were extracted. The recognition score is computed individually for the three attributes using the Multi-Support Vector Neural Network classifier. The three scores were fed to the Deep Belief Neural Network. The results revealed that the suggested method achieved a maximum accuracy of 95.36%, a 95.85% sensitivity rate, and 98.79% specificity [16]. Xiong et al. developed an innovative multimodal biometric identification system to recognize the face and the iris. The 2D Log-Gabor and Curvelet transform are utilized to extract face features, whereas the Curvelet transform is used to extract iris features. Also, a modified chaotic binary particle swarm optimization algorithm for feature selection has been proposed. In comparison to the unimodal iris-face system, the proposed system improved recognition accuracy by 11.56% and 2% for iris and face, respectively [30].
3 The Proposed Multimodal Fusion System Description
In this study, a novel and secure multimodal biometric recognition system was developed to identify the identities of students in the E-exams during the COVID-19 pandemic. The proposed system was implemented in two main phases: training and testing. In the training phase, the students’ images were processed to extract feature vectors, then the feature vectors were fused to form the final fused feature vector and stored as templates in the database. In the testing phase, the query image was processed, and its features were extracted and fused to form the final test feature vector, which was then compared with the templates stored in the training phase using CTB. The proposed system was implemented using MATLAB (R 2021b). Fig. 1 shows the proposed multimodal fusion framework.
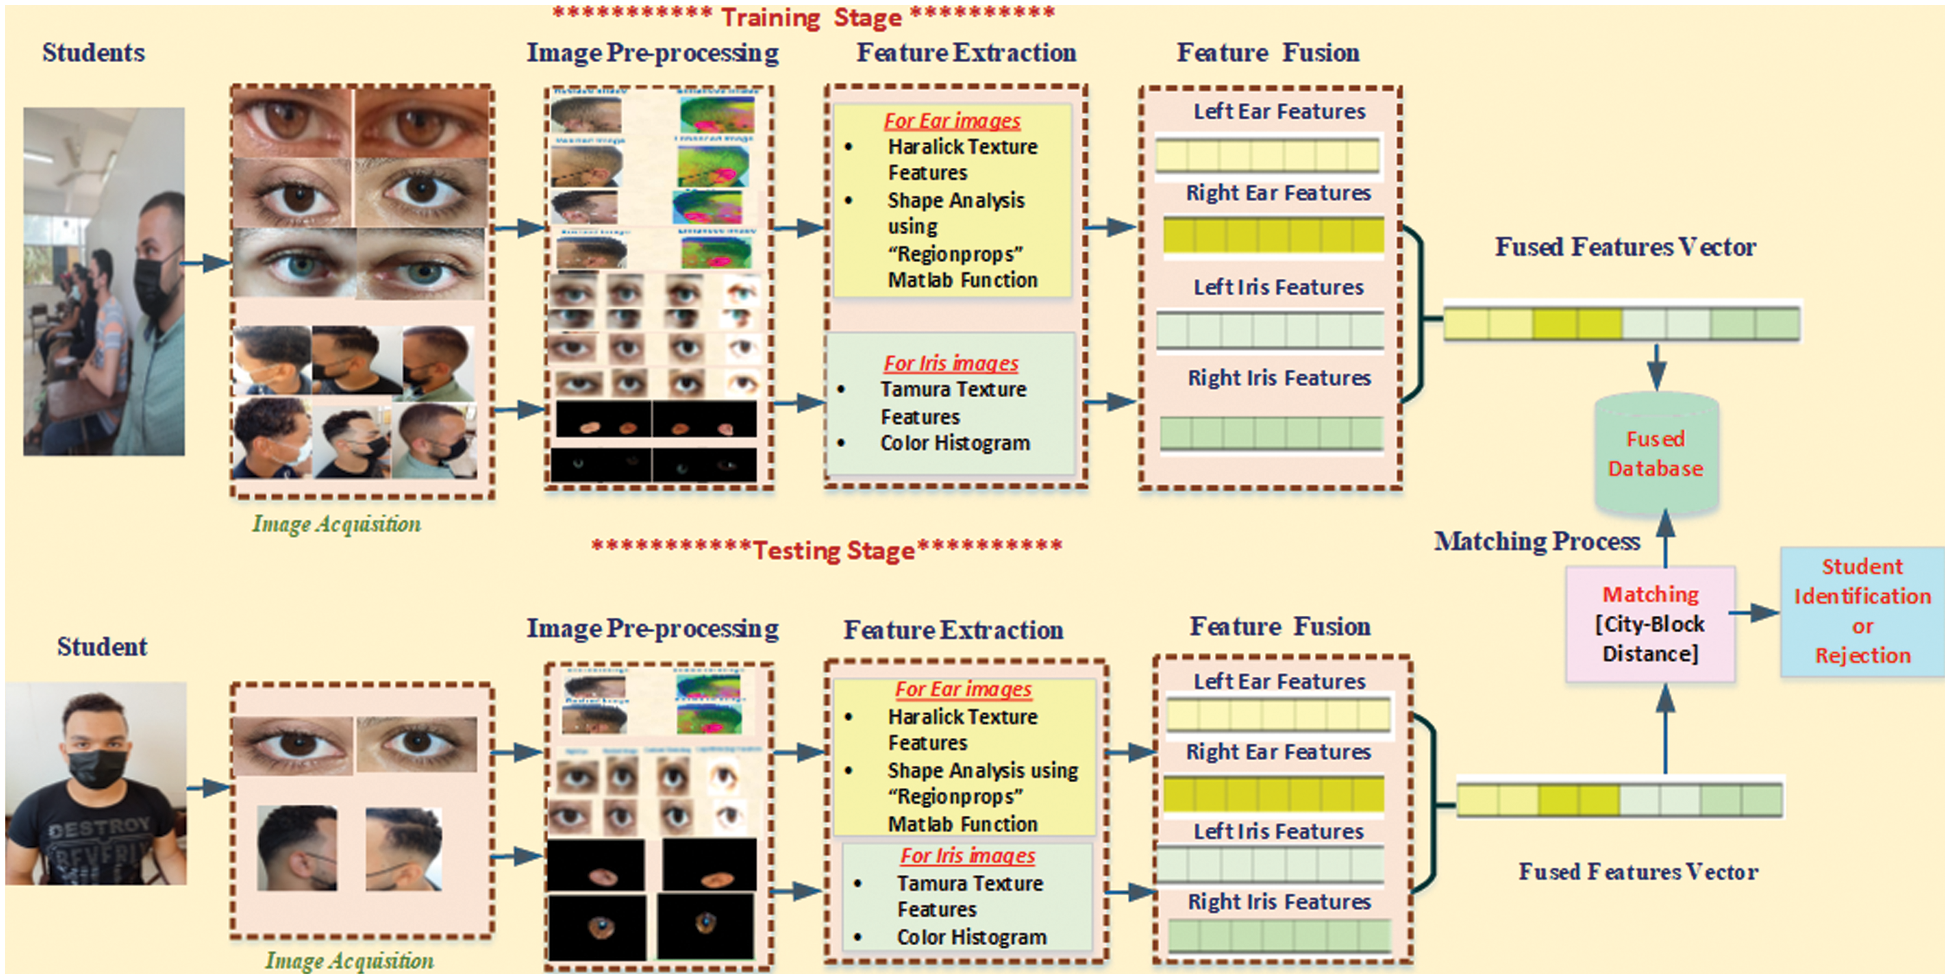
Figure 1: The proposed multimodal fusion framework
The proposed multimodal fusion framework can be illustrated in detail as follows:
A set of right and left ear area images and also right and left eye area images were captured to extract the ear and iris regions. Three types of cameras were used: a computer-connected camera, a digital camera (Nikon b600), and an internal smartphone camera (Redmi Note 10). These images were captured in the same lighting conditions with no change in luminosity from a distance of 20–25 cm from the face. These images were saved in JPEG file format. After that, preprocessing procedures were performed on these images to improve their quality, so the regions of interest could be extracted and adapted for the feature extraction phase, thereby improving the system’s performance, which can be described as follows:
This step aims to segment and extract the ear region only. This study presents a novel algorithm for processing and segmenting the ear, described in the following:
- Image Resizing: The original color ear image Fig. 2a is resized to the fixed size of [256 × 256] pixels. This is done using the imresize () function as shown in Fig. 2b.
- Image Enhancement: To further enhance the quality of the image, a decorrelation stretch method has been applied using the decorrstretch () function. This function improves image color separation with a significant band-band correlation. The exaggerated colors aid visual interpretation, allowing for easy feature discrimination [31–33] as illustrated in Fig. 2c.
- Extracting the Red Channel: The red channel offers comparatively better contrast and is less affected by light reflections compared with the green and blue channels of the image [26]. Therefore, only the red channel is extracted from the image as shown in Fig. 2d.
- Thresholding: Thresholding is a simple method that plays a major role in the processing and segmentation of digital images [34]. This step involves the production of a binary image with the use of a fixed threshold of >195, resulting in the best results, which were identified by a series of trial-and-error experiments.
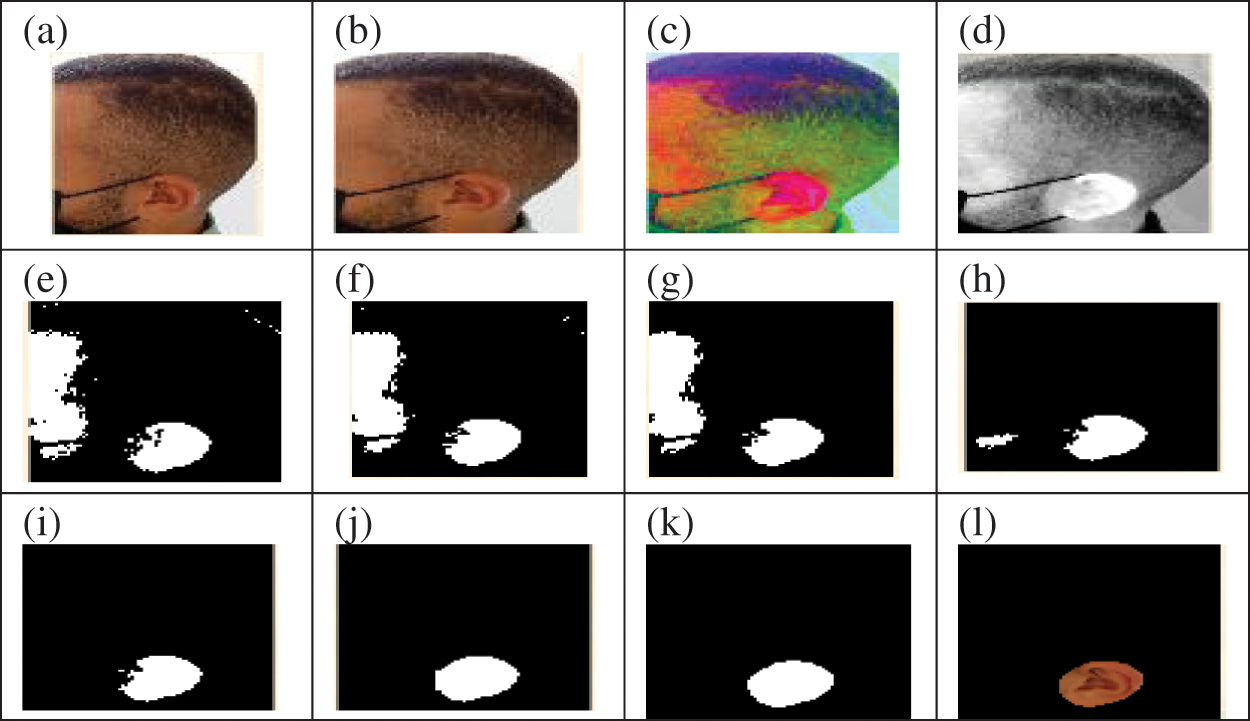
Figure 2: The results of preprocessing the left ear image
Based on Eq. (1), the red channel values of image A (i, j) are compared with the threshold value. Thus, all the pixels with a value higher than the threshold will be white, while all the other pixels will be black. In this way, a binary image can be obtained, and objects can be extracted from background images as shown in Fig. 2e.
- Image Filling: A thresholded binary image will have holes, and it is necessary to obtain the regions that potentially contain the ears. Therefore, the holes in the binary image will be filled using the imfill () function as shown in Fig. 2f.
- Removing Tiny Objects from the Binary Image: In this study, all connected components (objects) were removed from the ear binary image BW that had fewer than 300 pixels using the bwareaopen () function. This process is called “area opening.” The result after removing smaller objects is shown in Fig. 2g.
- Clearing the Borders of the Image: The image borders have been cleared using the imclearborder () function. This function removes all connected components of a binary image that touch any image border as shown in Fig. 2h.
- Extraction of the Binary Large Object (BLOB): The objective of BLOB extraction is to isolate the large object in a binary image [35]. The bwareafilt () function has been used to extract all connected components (objects) from the given image whose area is within the defined range and returns an output image that meets the criteria. In this study, the following command was used:
Here, the criterion is (1) which extracts the largest object from BW. Fig. 2i shows the output of extracting only the largest blobs.
- Closing Operation: It can fill in the narrow discontinuities and slender breaks in the contour line, removing small recesses and connecting fractures without changing their area [36]. Here, the morphological closing operation was implemented on the binary image using a disc Structuring Element (SE) whose size is 15 using the imclose () function and returns the closed image. This is shown in Fig. 2j.
- Smoothing Operation: The smoothing operation is important for reducing noise and blurring the false/stray contour fragments to improve the overall visual quality of the image [37,38]. Here, the image is smoothed by applying the conv2() function as shown in Fig. 2k. Finally, the masked image of only the ear region has been extracted, as shown in Fig. 2l.
3.1.2 Iris Image Preprocessing
The eye image consists of many components, such as the iris, sclera, upper and lower eyelids, and eyelashes. The most important and difficult task is to segment and extract the iris from the eye image. Iris segmentation is the automatic detection of the iris and pupil boundaries of an iris in an eye image to exclude the surrounding regions. The current study proposed a novel algorithm for processing and segmenting the iris region in an eye image. This algorithm is described as follows:
1. - Image Resizing: This step aims to resize the color eye image as shown in Fig. 3a to the size of [256 × 256] pixels. This is executed by applying the imresize () function as shown in Fig. 3b.
2. - Image Enhancing: Two approaches have been applied to increase the image’s quality as follows:
Contrast Stretching
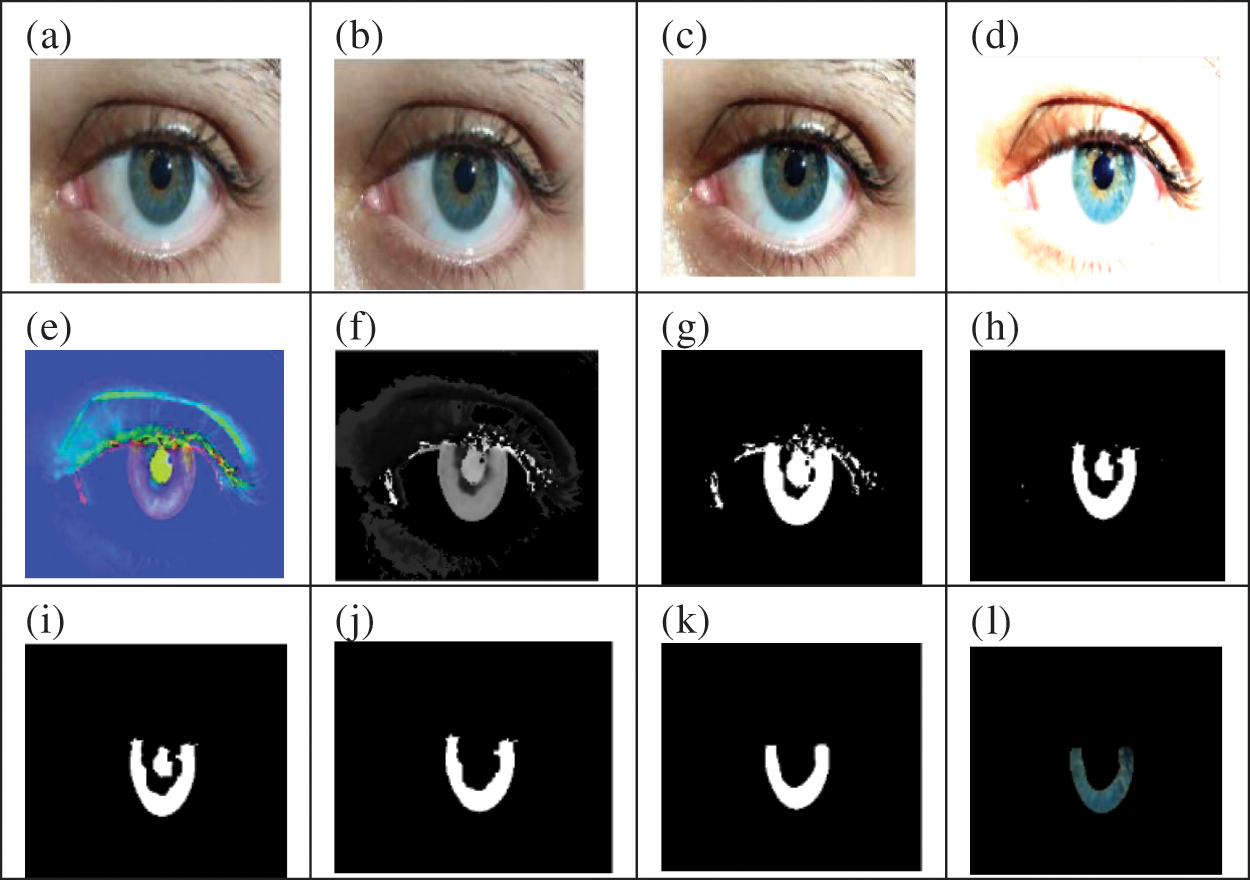
Figure 3: The results of preprocessing the left eye
It is a simple technique for enhancing image quality by stretching the range of intensity values. To perform the stretching, a new upper-and lower-pixel value for the normalized image must be specified [39–41]. This is done using the stretchlim () function, which computes the upper and lower limits that can be utilized for contrast stretching grayscale or RGB image, as shown in Fig. 3c.
2. Logarithmic (Log) Transform
Log transformations are among the basic image enhancing techniques in the spatial domain. This method can be used for the effective contrast enhancement of a dark image. When applying the log transformation to the image, all pixel values existing in the image will be replaced with their logarithmic values. Generally, the form of the log transform is in Eq. (2) [42,43]:
where s refers to the output gray level, r refers to the input gray level, c refers to a constant and r is assumed to be greater than or equal to zero. Fig. 3d shows the result of the log transform.
- Conversion to HSV Color Space: The RGB eye image was converted into HSV color space using the rgb2hsv () function. Colors are represented by HSV as 3 components: Hue (H), saturation (S), and value (V). H prescribes a pure color, S determines the amount of the pure color that is diluted with white light, and V indicates color brightness [44]. The HSV color space was chosen for this study because it is the most commonly used color space in digital image processing, computer vision, and image analysis. It is also ideal for segmentation [45]. Fig. 3e shows the HSV image.
- Getting Hue Value: After conversion into the HSV color space, only the H component is gotten from the image as shown in Fig. 3f using the following command:
Here, H_V is the value of the H component, and hsvValues is the value of converting the RGB eye image into HSV.
- Thresholding: OTSU’s method was applied to implement automatic image thresholding. It may be viewed as a method for distinguishing target objects or Regions of Interest (ROIs) from the background by identifying the threshold value T using the imbinarize () function [46]. According to the OTSU method, if the intensity value at point (i, j) is larger than the threshold value T, it is regarded as an object; otherwise, it is considered the background. Eq. (3) defines the threshold function [47,48]. The thresholding result was presented as a binary image as shown in Fig. 3g.
- Erosion Operation: The erosion operation is a process that causes an object to lose its size via removing pixels from the edges of the object. The count of pixels removed from an image’s objects is based on the size and form of the SE used to process the image. The mathematical description of the morphological erosion process is as follows in Eq. (4) [49–51]:
Eroding the binary image X with the use of SE will result in a set of all the points z where the SE as translated by z will become a subset of the image. Here, this method was implemented with the use of a disc SE whose size is 3 using the imerode () function. This is shown in Fig. 3h.
- Removing Tiny Objects from Binary Image: In this step, all connected objects were removed from the eye binary image that had fewer than 300 pixels using the bwareaopen () function. The result after removing smaller objects is shown in Fig. 3i.
- Extraction of the largest BLOB: The largest BLOB object was isolated in the binary image using the bwareafilt () function as shown in Fig. 3j.
- Smoothing Operation: In this step, the largest BLOB object is smoothed by applying the conv2 () function as shown in Fig. 3k. Finally, the masked image of only the iris region was extracted as shown in Fig. 3l.
Feature extraction is the most vital phase of any biometric recognition system. The successful recognition rate and reduction of recognition time mostly depend on the efficiency of the feature extraction technique [45,52]. The feature extraction methods used in this study are described as follows:
Two approaches to extract the features from both ears were used. These approaches are Haralick’s textural features and shape features. These methods will be explained as follows:
– Haralick Texture Features
Haralick texture features are popular texture descriptors in image analysis and allow the quantification of a texture. This method generates 14 types of statistical features that are based on GLCM. In this study, all these 14 features were extracted from the right and left ear images. See references [53–55] for more information on the mathematical definitions of the various Haralick features.
– Shape Features
Object shape features produce powerful and effective information about objects that can be used to recognize them [56]. In this study, five geometric features for ear shape representation were extracted using the regionprops () function. Regionprops is an image processing toolbox function available in MATLAB that allows users to extract a set of properties from an image [57]. These features are explained as follows:
1. Area: is one of the important geometrical properties of a region inside a closed curve. Eq. (5) expresses it mathematically as follows [58,59]:
2. Perimeter: is the sum of the lengths of the chords connecting points pn and pn+1 of a polygon, Eq. (6) expresses it mathematically [59].
where
3. Circularity: reflects the degree of similarity of a closed region’s shape to a circle, which is expressed in Eq. (7) as follows [59]:
The relationship between the area and the perimeter of a closed curve can be elucidated as the compactness of its shape.
4. Eccentricity: measures the aspect ratio between the length of the major axis and the minor axis of a closed curve. The formula used to calculate eccentricity is as follows in Eq. (8) [58]:
The result is a measure of object eccentricity, given as a value between 0 and 1.
5. Orientation: denotes the direction of the principal axis of a closed curve that runs through the centroid. Eq. (9) shows the mathematical representation used to calculate an orientation angle. The length of the major axis is computed from the coordinates of the point of intersection between the major axis and the closed curve [58].
where
Two approaches to extract the features from both irises were used. These approaches are the Tamura texture features and the color histogram features. These methods will be explained as follows:
– Tamura Texture Features
Tamura features describe texture on a global level and are also crucial in image comparison. Tamura et al. suggested texture features that conform to human visual perception. Iris has rich and unique texture information, and it is almost impossible for two irises to have the same texture [60,61]. Therefore, in this study, five Tamura texture features of the iris image have been extracted. The mathematical definitions of the different Tamura features have been summarized as follows [60,62,63]:
1. Coarseness: its objective is to determine the greatest size at which a texture exists, even where a smaller micro-texture exists. Coarseness can be computed as follows in Eq. (10):
Eq. (11) computes the difference between two averages corresponding to non-overlapping neighborhoods.
2. Contrast: is a metric that quantifies the distribution of different grey levels in an image as well as the degree to which these levels are biased toward black or white. Eq. (12) can be used to calculate contrast.
3. Directionality: is a measure of the distribution of the frequency of local edges directed against directional angles. It is a global property over a region. This feature does not differentiate between trends or patterns but calculates the generic degree of directionality in an image. Directionality can be computed as follows in Eq. (13).
4. Line-likeness: only refers to the shape of the texture primitives. A line-like texture has straight or wave-like primitives whose orientation may not be fixed. Frequently, the line-like texture is simultaneously directional. Eq. (14) can be used to calculate Line-likeness ().
5. Roughness: refers to the physical surface’s tactile differences. Roughness can be computed as follows in Eq. (15):
– Color Histogram Features
The color histogram is the most commonly used technique for obtaining an image’s color characteristics. It is used as a global color descriptor that analyses every statistical color frequency in an image. The provided iris color image’s color histogram is generated by discretizing the image colors and counting the number of times each discrete color appears in the image array [64–66]. In this study, color histogram-based features were extracted from iris images. The mathematical definitions of the different color histogram features are summarized as follows in Eqs. (16)–(18) [67]:
where: h is the histogram of the image.
where Pk denotes the probability of the kth gray level and n indicates the total gray level values [68]. Tab. 1 shows the type and the number of features extracted from the images of right and left ear and right and left iris.
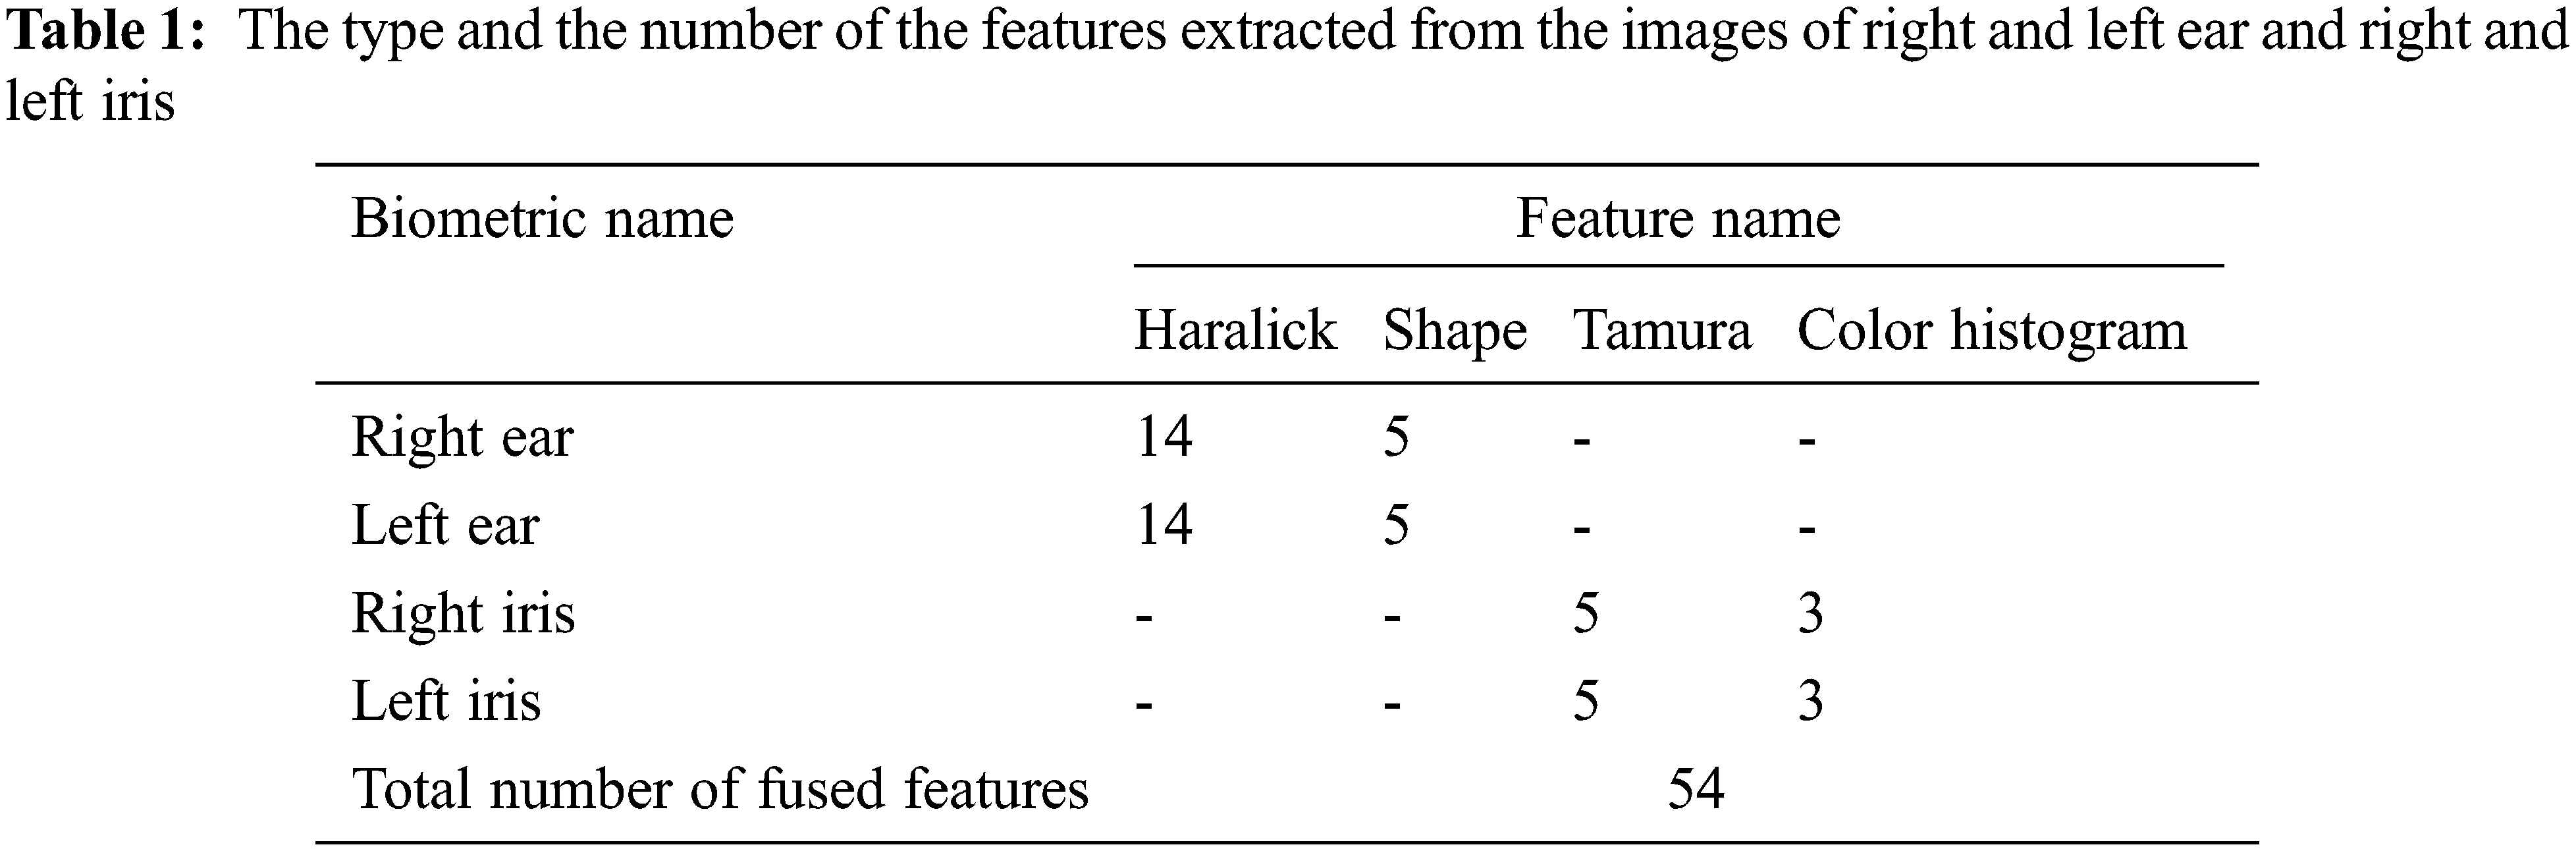
As shown in Tab. 1, 14 Haralick texture features and 5 shape features were extracted from each right and left ear, while 5 Tamura texture features and 3 color histogram features were extracted from each right and left iris. Thus, 54 fused features were extracted from the four biometrics proposed in this study.
3.3 Feature Fusion of Ear and Iris
Concatenation by a union is a common technique for data fusion at the feature level. So, this technique was used in this phase, where the final fused features vector is obtained by simply concatenating the left-and right-iris features vector and the left-and right-ear features vector into a new fused feature vector. This final vector has higher dimensions and contains more important information, which would improve the reliability of the system’s performance and identify the student more accurately.
Let REj = re1, re2, re3… ren, LEj = le1, le2, le3,… len, RIj = ri1, ri2, ri3,… rin, and LIj = li1, li2, li3,… lin be the feature vectors of both ears and both irises, respectively. The fused vector is represented as follows in Eq. (19):
After that, these fused vectors are stored in the database in the training phase.
Finally, the CTB algorithm is used for matching. It is commonly known as the Manhattan distance. It is calculated by adding the absolute differences between 2 image feature vectors. Let x and y be n-dimensional representations of the test and training image feature vectors, and xi and yi be the ith components of the vectors. Distances d (x, y) between these two vectors are mathematically expressed as follows in Eq. (20) [69,70]:
The following MATLAB command is used to calculate the CTB:
D = pdist2(x, y,‘ cityblock’)
The CTB is always larger than or equal to zero. For identical vectors, the measurement would be zero, and for vectors with little similarity, it would be high. According to the difference, two possible decisions can be made: accepting or rejecting the student’s entry to the E-exam. Figs. 4 and 5 present flowcharts for the training and testing stages of the proposed framework.
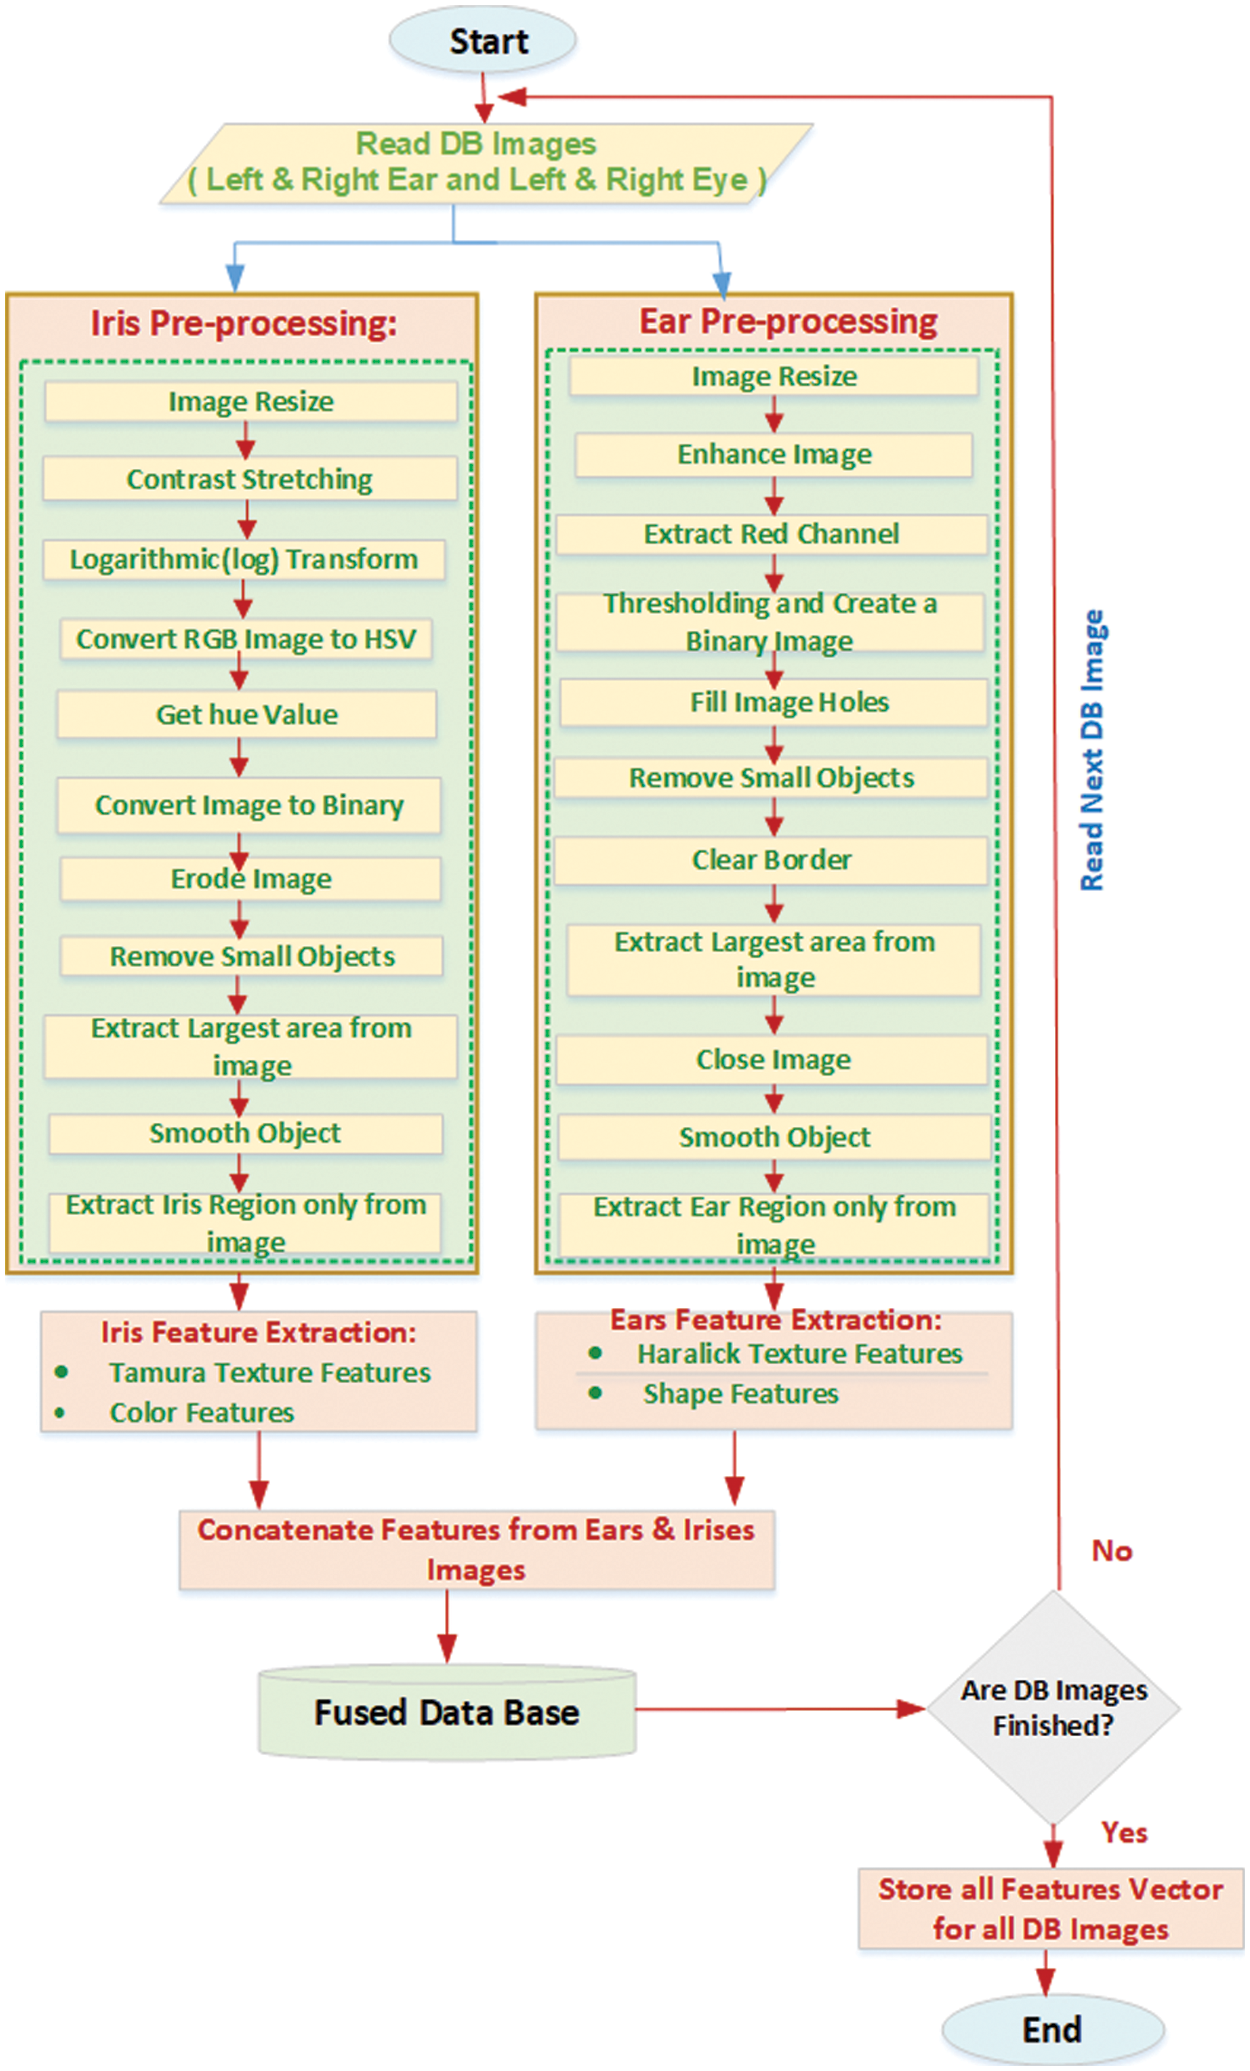
Figure 4: The training phase of the proposed framework
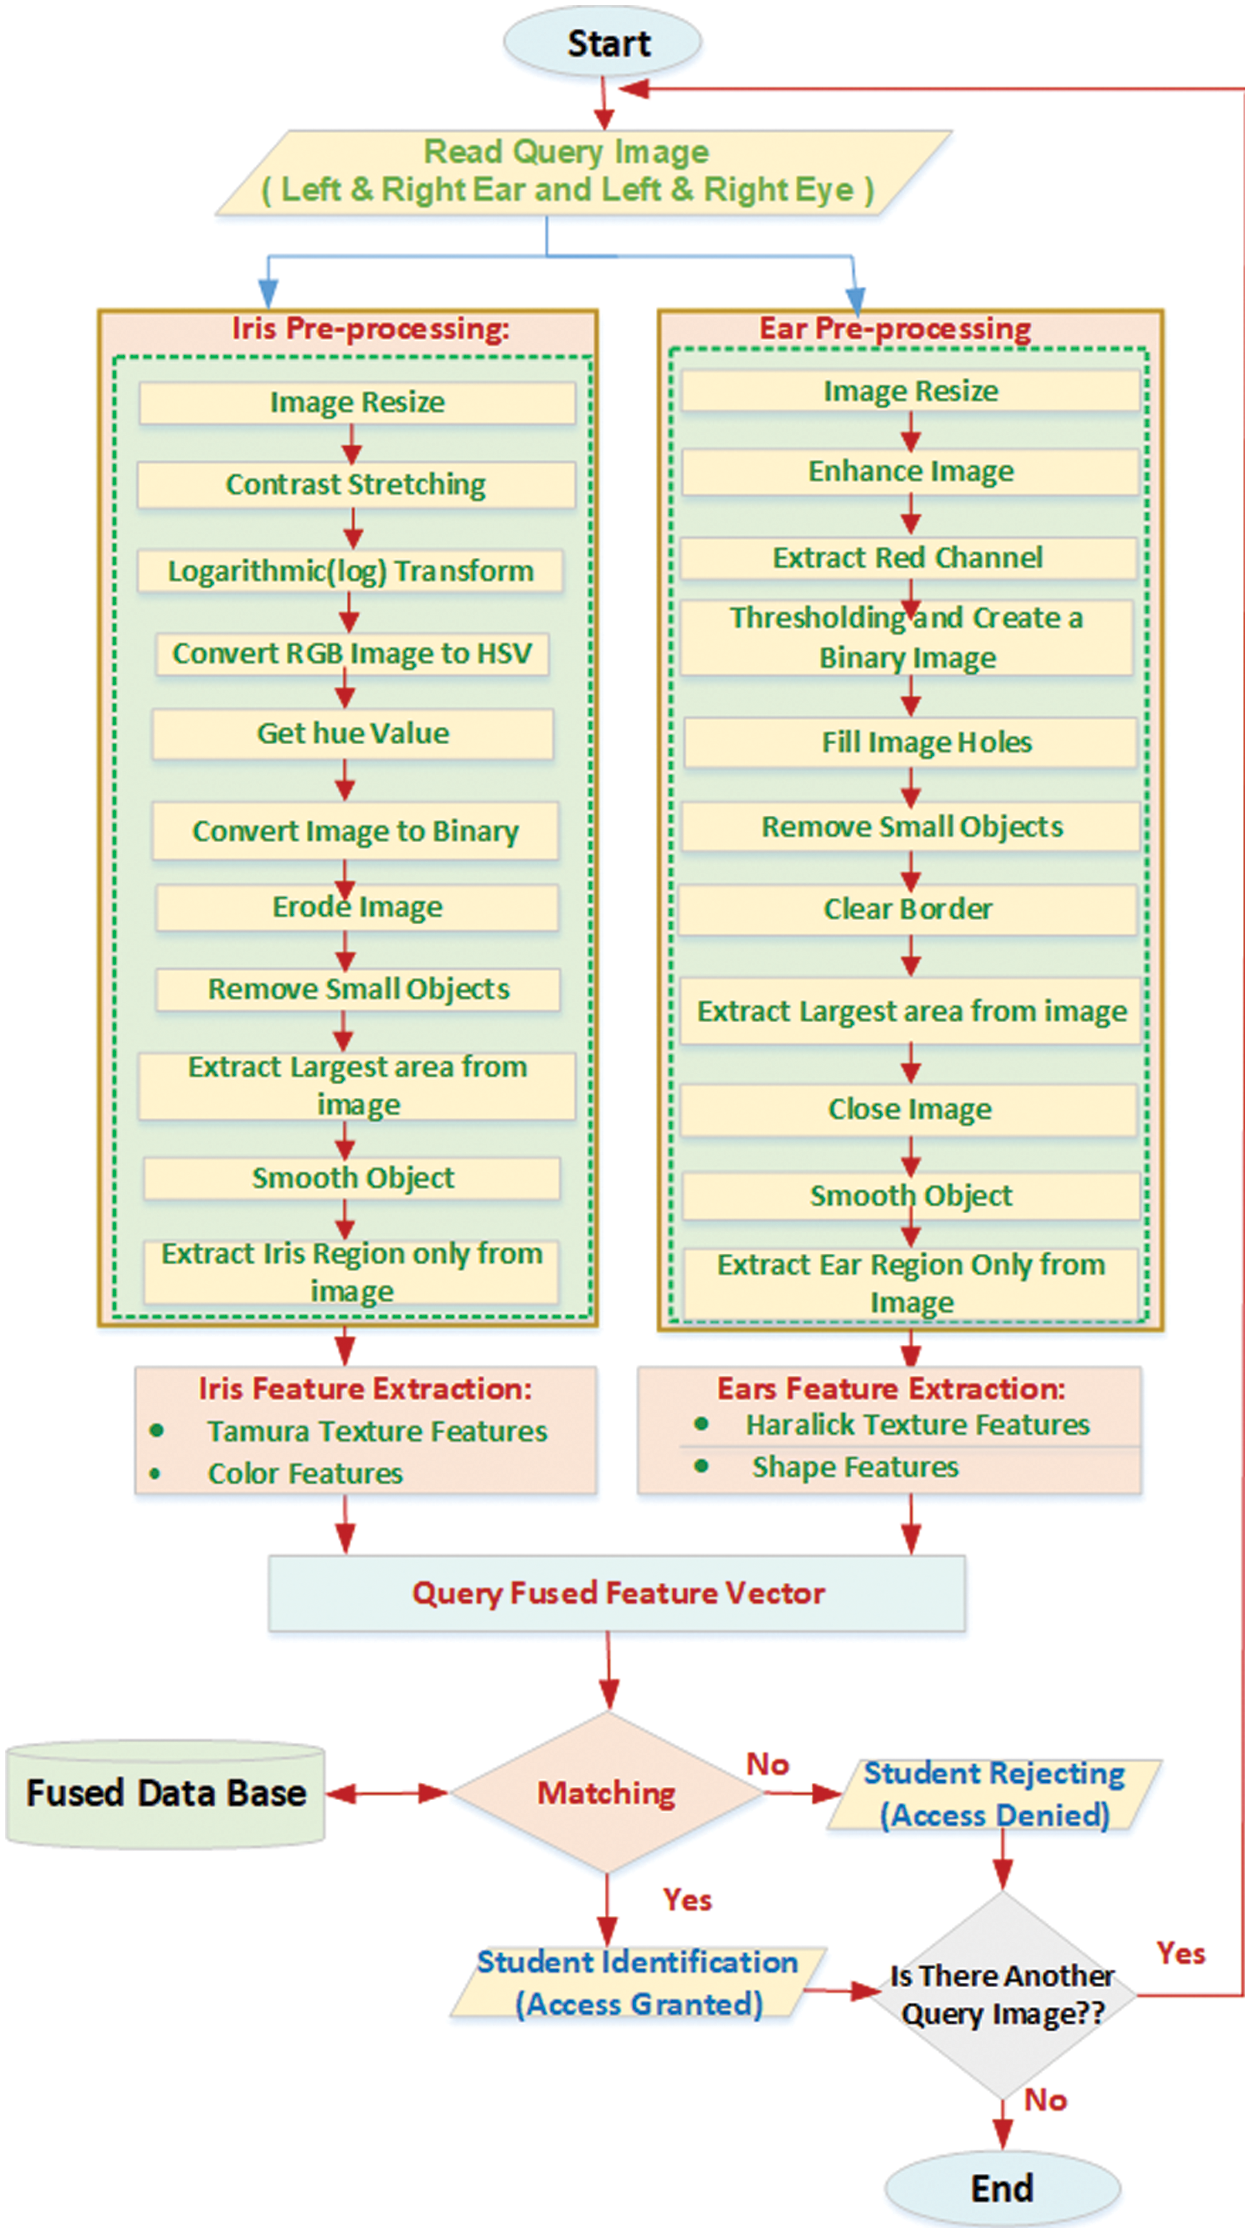
Figure 5: The testing phase of the proposed framework
4 Application and Experimental Results
This section presents the description of the dataset utilized to perform the study’s experiments, the assessment protocol applied for evaluating the proposed multimodal biometric system based on feature level fusion technique, and the obtained results, as well as related discussions.
The dataset which was used in the current study collected students (male and female) from the faculty of Specific Education at Mansoura University in the academic year 2021–2022 (in the age range of 18–22 years old). The size of the training set is 1800 images for 150 students (for each student, 3 images for the right eye and 3 images for the left eye, 3 images for the right ear, and 3 for the left ear). The size of the testing set is 200 images for 50 students (for each student, an image of the right eye and an image of the left eye, an image of the right ear, and an image of the left ear).
4.2 Performance Evaluation Measures
Performance evaluation of the proposed multimodal system has been carried out through the performance measures; FAR, FRR, CRR, GAR, and accuracy. These measures are calculated as follows in Eqs. (21)–(25) [19,29,71]:
4.3 Application and Discussion of Results
In this study, the students’ captured ear images were preprocessed as shown in Fig. 6c and the captured iris images were preprocessed as shown in Fig. 6e. Haralick’s texture and shape methods were used to extract the features from both ears. Also, Tamura texture and color histogram methods were used to extract iris features, as shown in Fig. 6g. Then, the obtained features were combined at the feature fusion level with the use of the serial rule to get a single fused vector. For matching, the CTB was used to calculate the differences and similarities, and accordingly, the final decision was made to determine whether the student’s identity is authentic (in this case, the student will be granted access to the E-exam) or an imposter (in this case, the student will be denied access to the E-exam), as shown in Fig. 6i. Tab. 2 indicates the values of the identification accuracy (with corresponding FAR, FRR, CRR, and GAR) of the proposed feature-level fusion system.
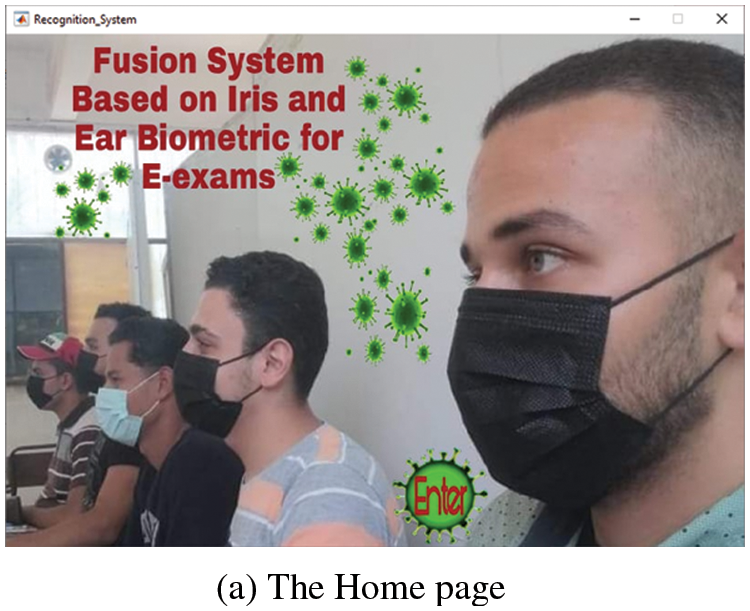
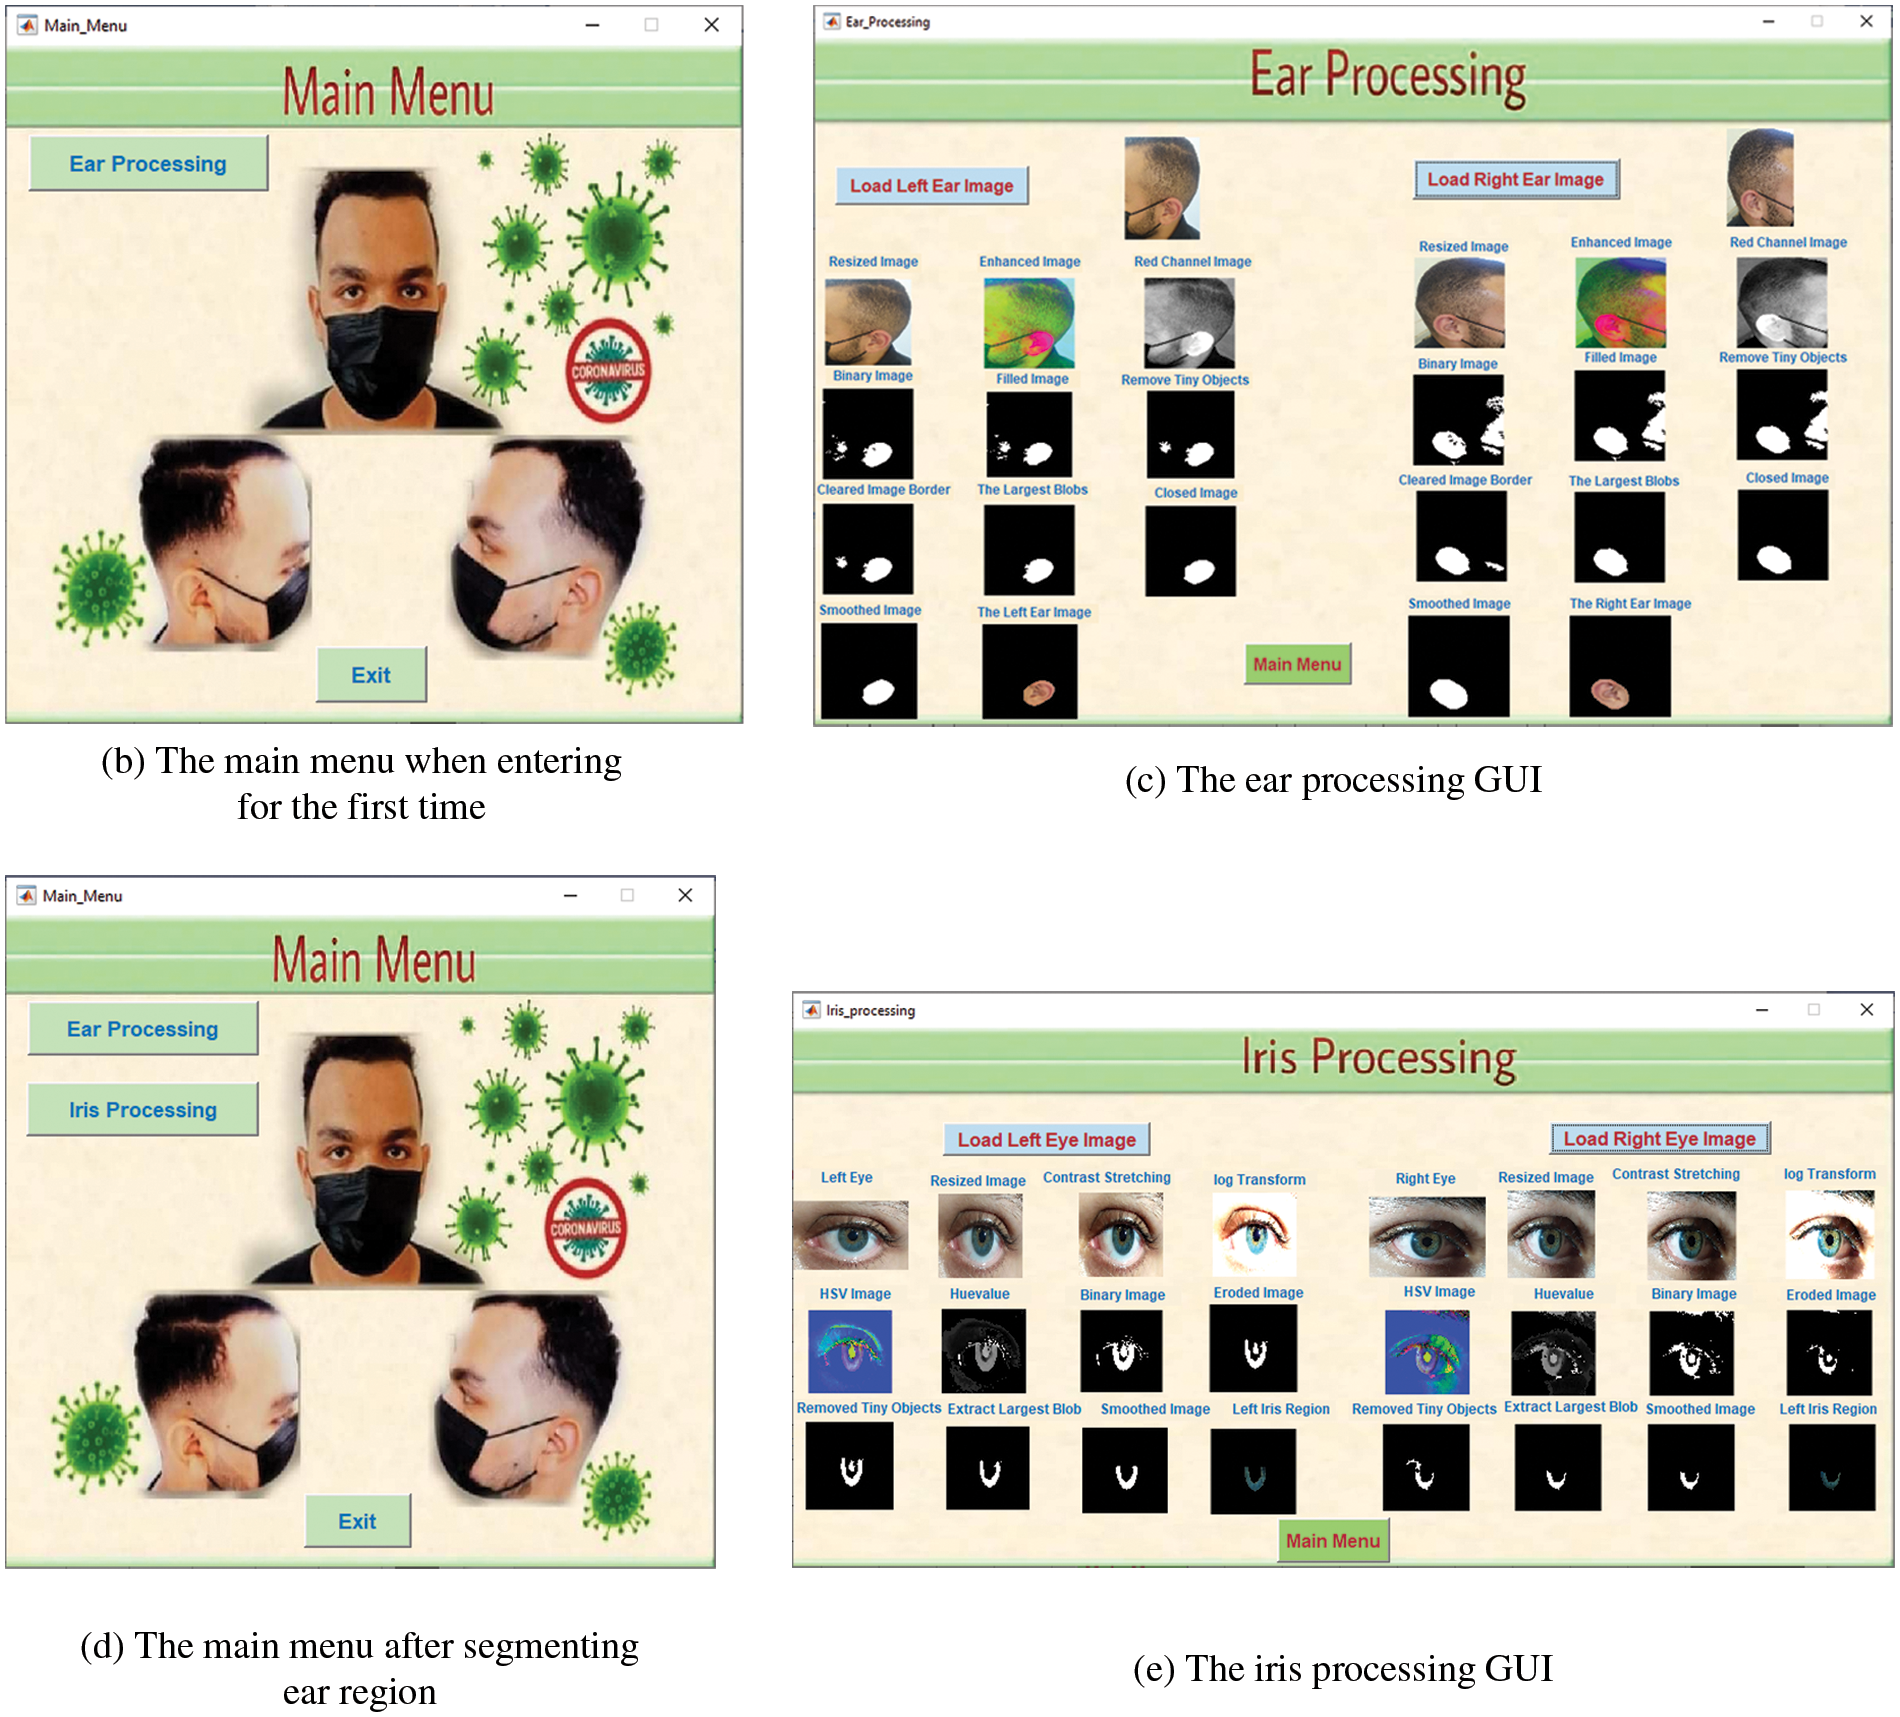
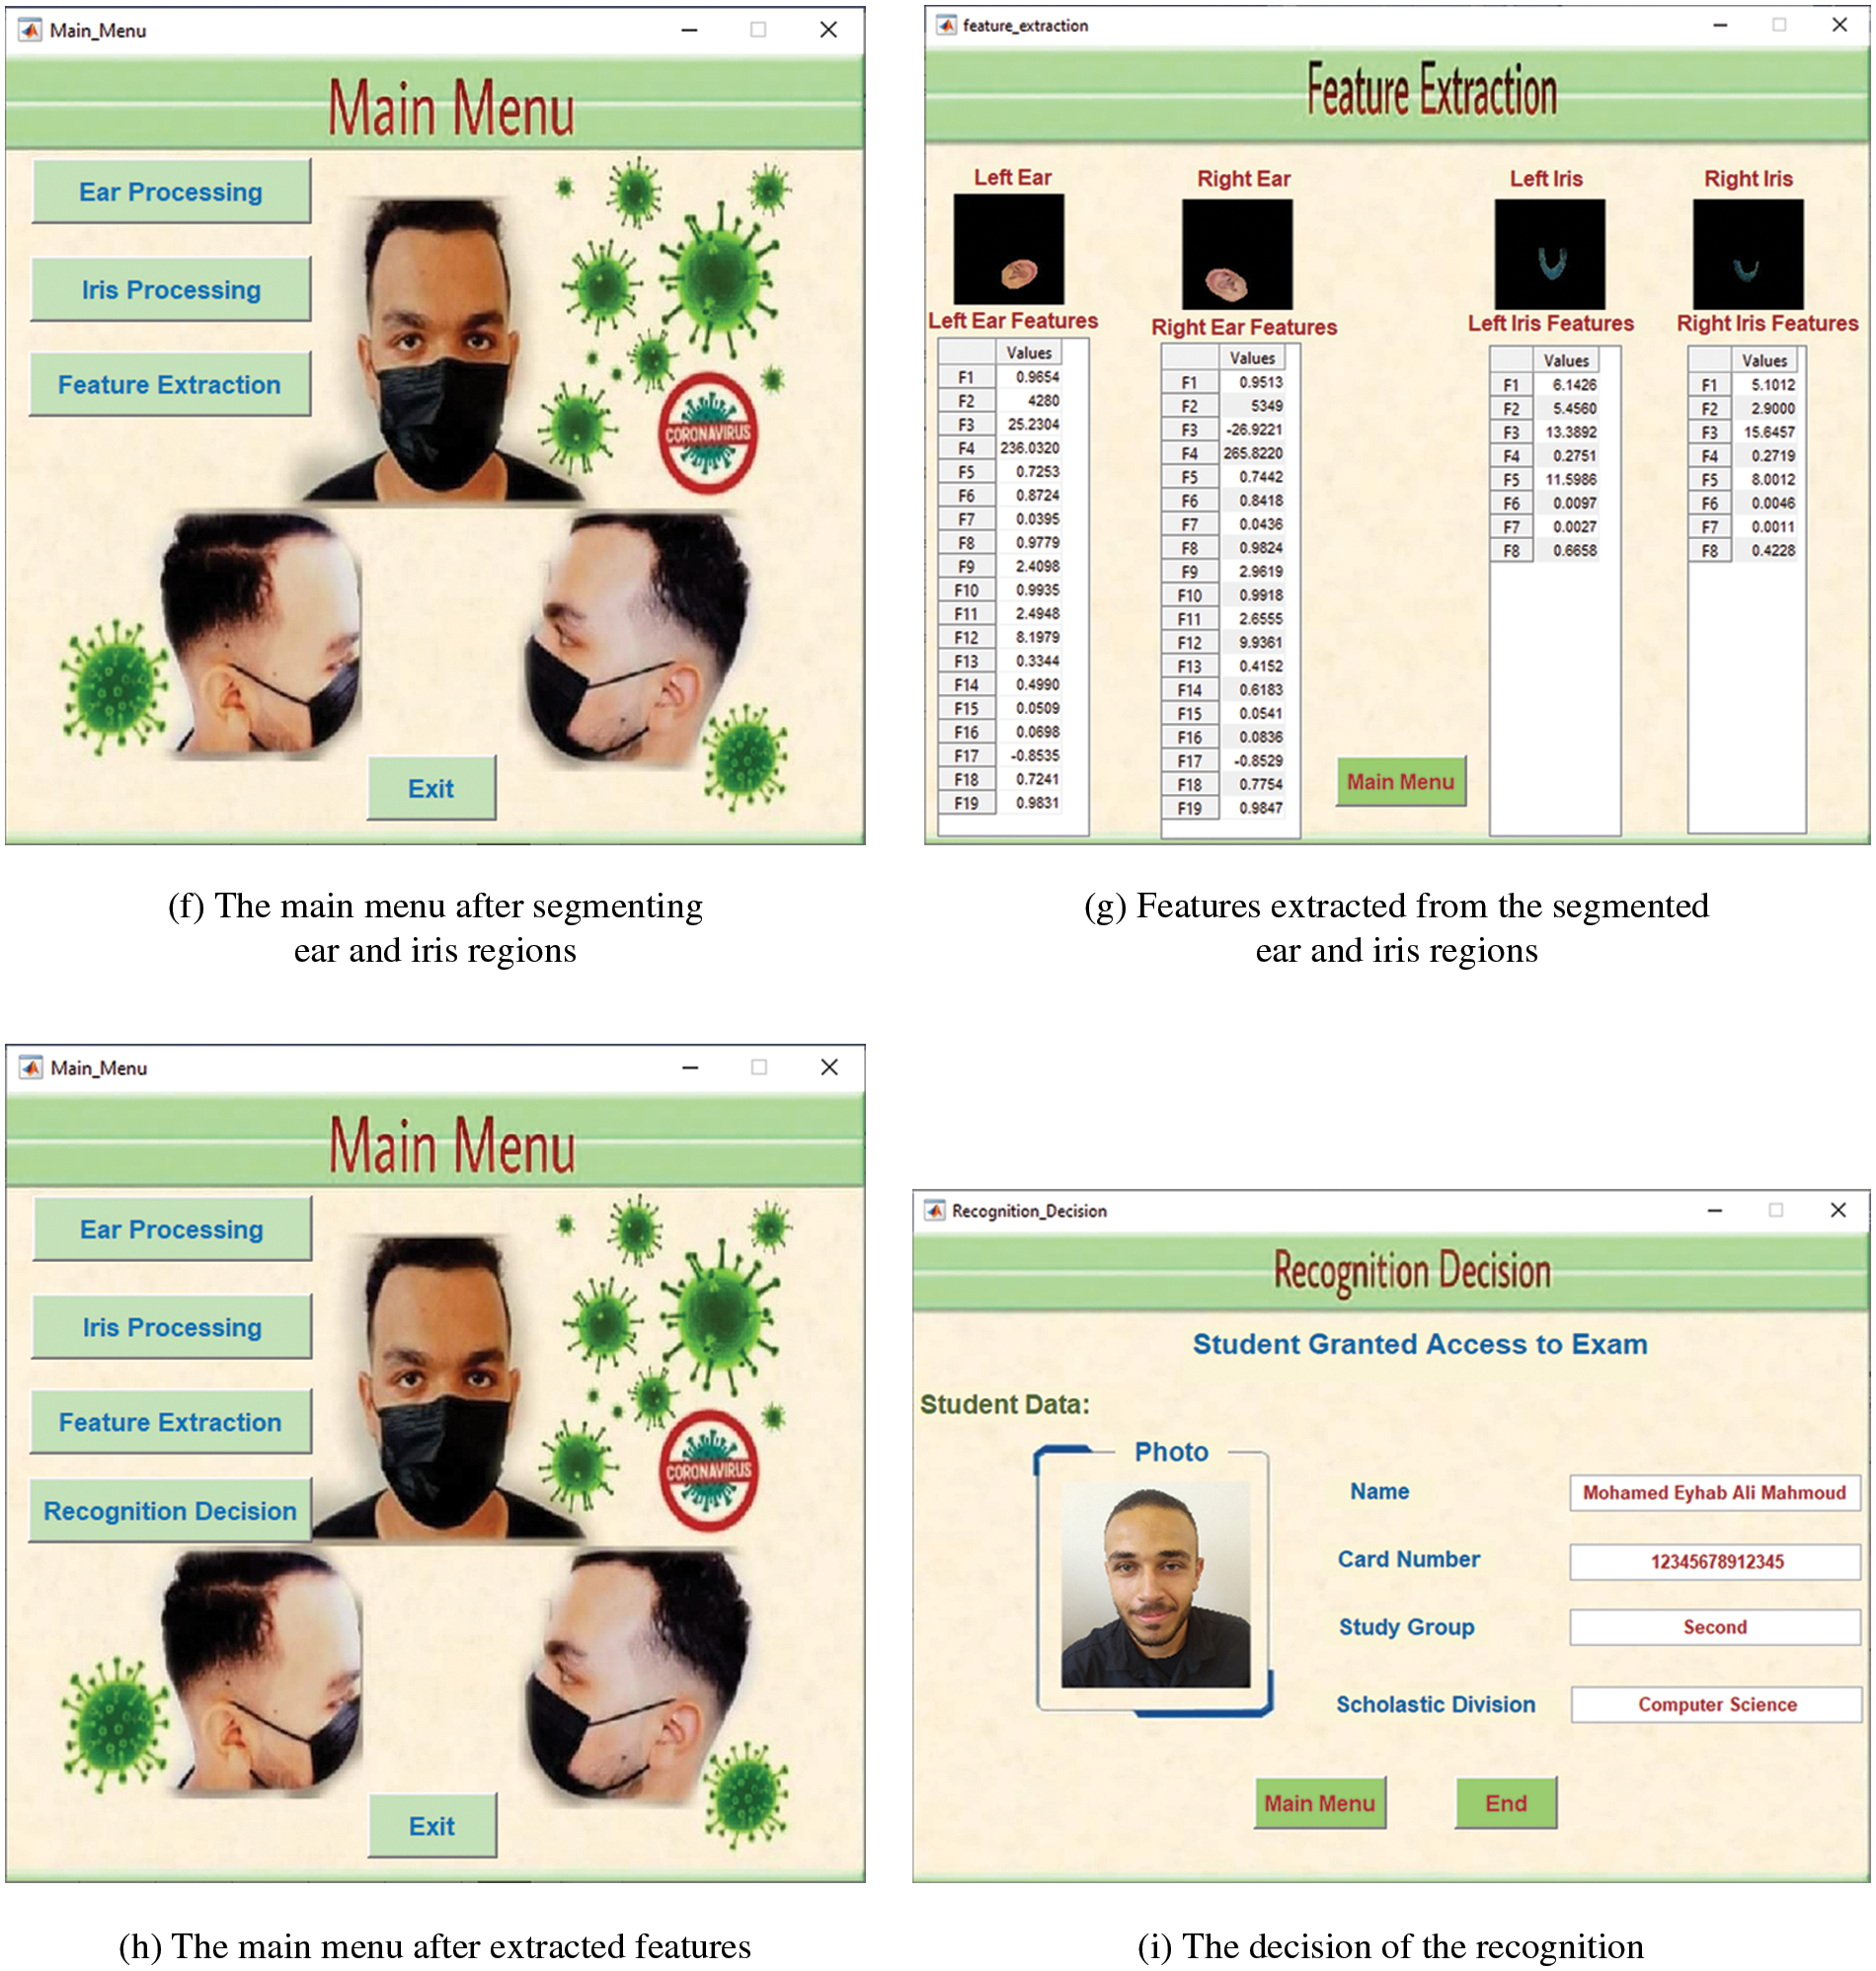
Figure 6: (a) The home page (b) The main menu when entering for the first time (c) The ear processing GUI (d) The main menu after segmenting ear region (e) The iris processing GUI (f) The main menu after segmenting ear and iris regions (g) Features extracted from the segmented ear and iris regions (h) The main menu after extracted features (i) The decision of the recognition
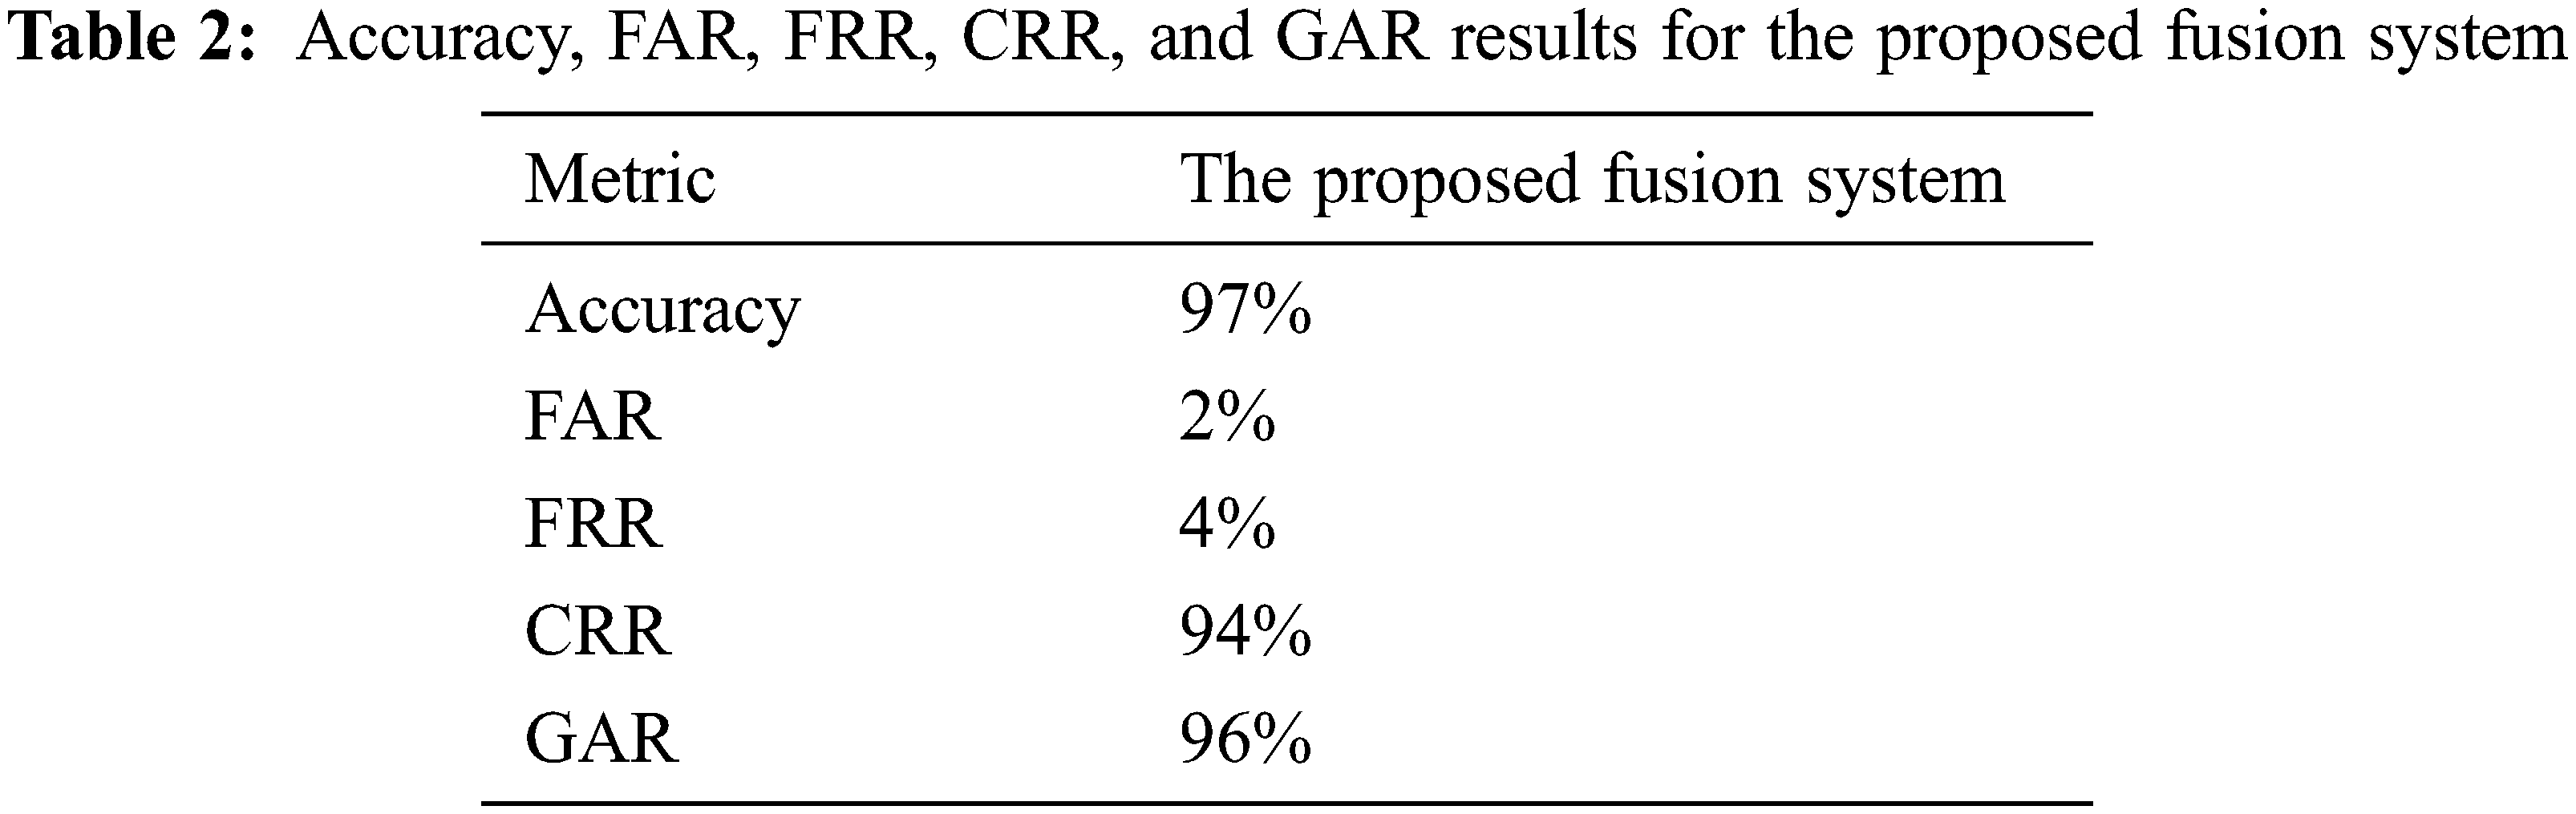
As shown in Tab. 2, the proposed system achieved 97% of accuracy with 2%, 4%, 94%, and 96% for (FAR), (FRR), (CRR), and (GAR), respectively. In light of these findings, it can be concluded that the fusion of the four biometric features (left ear, right ear, left iris, and right iris at feature level) can make many automatic identification systems in various environments (especially E-exam systems) more reliable.
On the other hand, to prove the efficiency of the proposed multimodal system, it was compared with other related multimodal recognition systems as shown in Tab. 3.
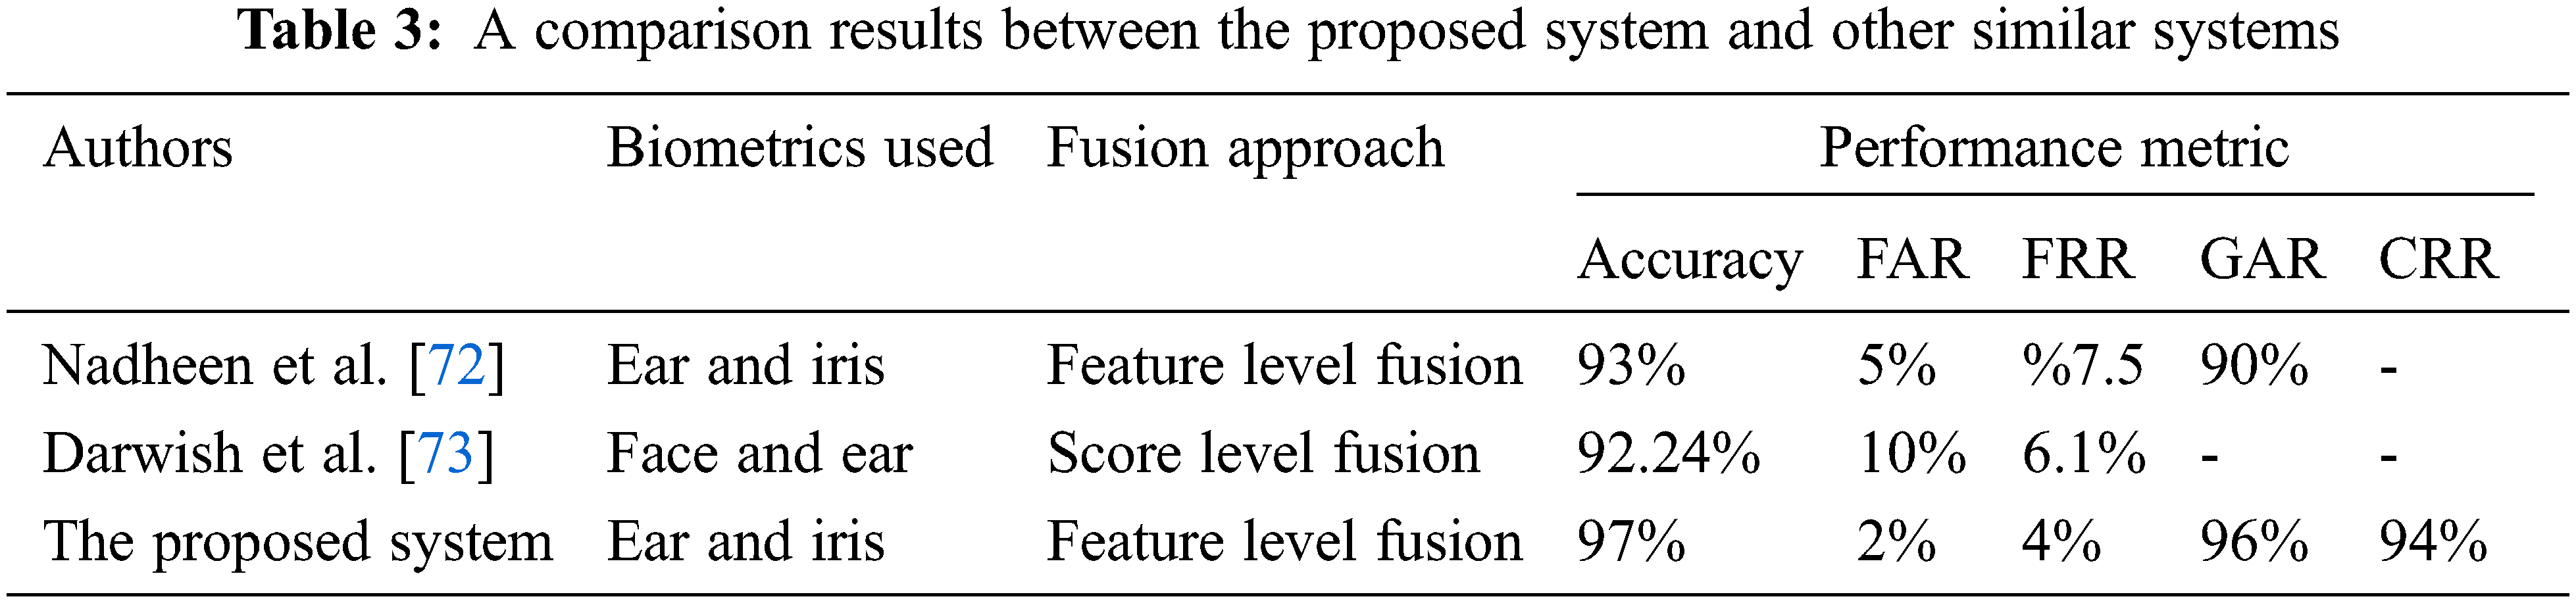
The results shown in Tab. 3 demonstrate that the proposed system achieved an identification accuracy of 97%, which was higher than the accuracy of the system in [72] (93%) and the system in [73] (92.24%). Also, it can be noticed that the proposed multimodal system achieved better results in terms of FAR, FRR, GAR, and CRR compared with the results in [72,73].
Biometric systems are used on a wide scale by educational institutions in various security applications in general, in authentication and human identification applications in particular. In this study, a multimodal biometric system was suggested to identify the identities of students in E-exams during the COVID-19 pandemic. The proposed recognition system fuses four biometrics: the right and left ears; the right and left irises at the feature level to form a single-fused feature vector. Moreover, this is the first study of its kind to use the CTB for a multimodal biometric model using these four modalities to identify students. The proposed multimodal biometric system achieved a recognition accuracy of 97%. The main limitation of this study is the increase in the recognition time. The future work will try to address this limitation using feature selection techniques, thus reducing recognition time, and improving system performance. The researchers seek to embed the proposed multi-biometric system into the e-learning platform so that students can be identified, not only for electronic exams but also for the rest of the e-learning activities. As for further research, the researchers intend to apply deep learning algorithms to identify humans with the use of different biometric modalities. In addition, the authors also intend to implement the system on smartphones.
Funding Statement: The authors received no specific funding for this study.
Conflicts of Interest: The authors declare that they have no conflicts of interest to report regarding the present study.
References
1. H. Polat, M. S. Ozerdem, F. Ekici and V. Akpolat, “Automatic detection and localization of covid-19 pneumonia using axial computed tomography images and deep convolutional neural networks,” International Journal of Imaging Systems and Technology, vol. 31, pp. 1–16, 2021. [Google Scholar]
2. A. Rachha, “Covid-19 chest x-ray detection: A transfer learning approach,” International Research Journal of Engineering and Technology (IRJET), vol. 07, no. 11, pp. 271–281, 2020. [Google Scholar]
3. E. Karasmanaki and G. Tsantopoulos, “Impacts of social distancing during covid-19 pandemic on the daily life of forestry students,” Children and Youth Services Review, vol. 120, pp. 1–7, 2021. [Google Scholar]
4. L. Elsalem, N. Al-Azzam, A. A. Jum’ah and N. Obeidat, “Remote e-exams during covid-19 pandemic: A cross-sectional study of students’ preferences and academic dishonesty in faculties of medical sciences,” Annals of Medicine and Surgery, vol. 62, pp. 326–333, 2021. [Google Scholar]
5. S. Pokhrel and R. Chhetri, “A literature review on impact of covid-19 pandemic on teaching and learning,” Higher Education for the Future SAGE, vol. 8, no. 3, pp. 1–9, 2021. [Google Scholar]
6. A. M. Moser, T. Wei and D. Brenner, “Remote teaching during covid-19: Implications from a national survey of language educators,” System, vol. 97, pp. 1–15, 2021. [Google Scholar]
7. R. Bashitialshaaer, M. Alhendawi and Z. Lassoued, “Obstacle comparisons to achieving distance learning and applying electronic exams during covid-19 pandemic,” Symmetry, vol. 13, no. 99, pp. 1–16, 2021. [Google Scholar]
8. Y. Khlifi and H. A. El-Sabagh, “A novel authentication scheme for e-assessments based on student behavior over e-learning platform,” International Journal Emerging Technologies in Learning, vol. 12, no. 4, pp. 62–89, 2017. [Google Scholar]
9. F. R. A. Ahmed, T. E. Ahmed, R. A. Saeed, H. Alhumyani, S. Abdel-Khalek et al., “Analysis and challenges of robust e-exams performance under covid-19,” Results in Physics, vol. 23, pp. 1–7, 2021. [Google Scholar]
10. S. Bharath, K. MuraliKrishnan, M. A. Padmanaban and B. M. Jenefer, “An innovative ear based recognition system for automatic attendance monitoring,” International Journal of Latest Trends in Engineering and Technology, Special Issue April-2018, pp. 037–042, 2018. [Google Scholar]
11. K. Mohanapriy and M. Babu, “Ear recognition by feature extraction using force field transformation,” International Journal of Engineering and Computer Science, vol. 6, no. 3, pp. 20742–20750, 2017. [Google Scholar]
12. S. D. Shirke and C. Rajabhushanam, “Iris recognition from an image at lengthy distance by using deep belief neural network (dbn),” International Journal of Engineering and Advanced Technology, vol. 8, no. 5S3, pp. 523–532, 2019. [Google Scholar]
13. I. Omara, F. Li, H. Zhang and W. Zuo, “A novel geometric feature extraction method for ear recognition,” Expert Systems With Applications, vol. 65, pp. 127–135, 2016. [Google Scholar]
14. D. B. Gore, S. S. Kawthekar and V. Y. Borole, “Ear recognition techniques for biometrics using digital image processing: A review,” in Int. Conf. on Recent Advances in Computer Science, Engineering and Technology, pp. 22–26, 2016. [Google Scholar]
15. T. V. Kandgaonkar, R. S. Mente, A. R. Shinde and S. D. Raut, “Ear biometrics: A survey on ear image databases and techniques for ear detection and recognition,” IBMRD’s Journal of Management and Research, vol. 4, no. 1, pp. 88–103, 2015. [Google Scholar]
16. ] M. Vijay and G. Indumathi, “Deep belief network-based hybrid model for multimodal biometric system for futuristic security applications,” Journal of Information Security and Applications, vol. 58, pp. 1–14, 2021. [Google Scholar]
17. K. R. Resmi and G. Raju, “Automatic 2D ear detection: A survey,” International Journal of Scientific & Technology Research, vol. 8, no. 11, pp. 3643–3647, 2019. [Google Scholar]
18. W. Kabir, M. O. Ahmad and M. N. S. Swamy, “A multi-biometric system based on feature and score level fusions,” IEEE Access, vol. 7, pp. 59437–59450, 2019. [Google Scholar]
19. M. H. Hamd and M. Y. Mohammed, “Multimodal biometric system based face-iris feature level fusion,” International Journal of Modern Education and Computer Science, vol. 11, no. 5, pp. 1–9, 2019. [Google Scholar]
20. G. Huo, Y. Liu, X. Zhu, H. Dong and F. Hed, “Face–iris multimodal biometric scheme based on feature level fusion,” Journal of Electronic Imaging, vol. 24, no. 6, pp. 063020-1–063020-8, 2015. [Google Scholar]
21. S. M. Sameh, H. E. Moustafa and F. W. Zaki, “Feature level fusion of iris and voice,” Mansoura Engineering Journal (MEJ), vol. 40, no. 4, pp. 55–61, 2015. [Google Scholar]
22. O. Sharifi and M. Eskandari, “Optimal face-iris multimodal fusion scheme,” Symmetry, vol. 8, no. 48, pp. 1–16, 2016. [Google Scholar]
23. M. Eskandaria and O. Toygarb, “Selection of optimized features and weights on face-iris fusion using distance images,” Computer Vision and Image Understanding, vol. 137, pp. 63–75, 2015. [Google Scholar]
24. A. A. M. Alhamrouni, “Iris recognition by using image preprocessing techniques,” A Master’s Thesis, in Computer Engineering Atilim University, 2017. [Google Scholar]
25. Z. Emeršic, V. Štruc and P. Peer, “Ear recognition: More than a survey,” Neurocomputing, vol. 255, pp. 26–39, 2017. [Google Scholar]
26. F. Jan, “Non-circular iris contours localization in the visible wavelength eye images,” Computers and Electrical Engineering, vol. 62, pp. 166–177, 2017. [Google Scholar]
27. K. K. Fasna, P. Athira and R. Krishna, “A review on iris feature extraction methods,” International Journal of Engineering Research and General Science, vol. 4, no. 2, pp. 663–667, 2016. [Google Scholar]
28. B. Ammour, L. Boubchir, T. Bouden and M. Ramdani, “Face–iris multimodal biometric identification system,” Electronics, vol. 9, no. 85, pp. 1–18, 2020. [Google Scholar]
29. P. Byahatti and M. S. Shettar, “Fusion strategies for multimodal biometric system using face and voice cues,” IOP Conference Series: Materials Science and Engineering, vol. 925, pp. 1–9, 2020. [Google Scholar]
30. Q. Xiong, X. Zhang, X. Xu and S. He, “A modified chaotic binary particle swarm optimization scheme and its application in face-iris multimodal biometric identification,” Electronics, vol. 10, no. 217, pp. 1–17, 2021. [Google Scholar]
31. K. Manjula, G. D. Devi and K. Vijayarekha, “Detection of dental diseases using classification algorithms,” International Journal of Recent Technology and Engineering (IJRTE), vol. 8, no. 3, pp. 4485–4489, 2019. [Google Scholar]
32. A. Sathesh and J. S. Manoharan, “De-correlation stretch filtering approach for effective poisson reduction in galaxy images,” International Journal of Computers & Technology, vol. 11, no. 9, pp. 2987–2993, 2018. [Google Scholar]
33. F. Gnädinger and U. Schmidhalter, “Digital counts of maize plants by unmanned aerial vehicles (UAVs),” Remote Sens., vol. 9, no. 544, pp. 2–15, 2017. [Google Scholar]
34. T. Kalaiselvi, P. Nagaraja and V. Indhu, “A comparative study on thresholding techniques for gray image binarization,” International Journal of Advanced Research in Computer Science, vol. 8, no. 7, pp. 1168–1172, 2017. [Google Scholar]
35. A. Singh, H. Goyal, Amar and A. Gautam, “Human identification based on hand dorsal vein pattern using BRISK & SURF algorithm,” International Journal of Engineering and Advanced Technology, vol. 9, no. 4, pp. 2168–2175, 2020. [Google Scholar]
36. M. Lei, L. Liu, C. Shi, Y. Tan, Y. Lin et al., “A novel tunnel-lining crack recognition system based on digital image technology,” Tunnelling and Undeground Space Technology, vol. 108, pp. 6–8, 2021. [Google Scholar]
37. X. Wang, W. Zhang, R. Li and R. Song, “The UDWT image denoising method based on the PDE model of a convexity-preserving diffusion function,” EURASIP Journal on Image and Video Processing, vol. 1, pp. 1–9, 2019. [Google Scholar]
38. N. Kak, N. R. Gupta and S. Mahajan, “Iris recognition system,” International Journal of Advanced Computer Science and Applications, vol. 1, pp. 34–40, 2010. [Google Scholar]
39. P. Kaur, B. S. Khehra and A. P. S. Pharwaha, “Color image enhancement based on gamma encoding and histogram equalization,” Materials Today: Proceedings, vol. 46, pp. 4025–4030, 2021. [Google Scholar]
40. S. Rajput and S. R. Suralkar, “Comparative study of image enhancement techniques,” International Journal of Computer Science and Mobile Computing, vol. 2, no. 1, pp. 11–21, 2013. [Google Scholar]
41. P. Nagelli, C. Reddy and B. Reddy, “Blurred image enhancement using contrast stretching, local edge detection and blind deconvolution,” International Journal of Information and Computation Technology, vol. 4, no. 3, pp. 247–252, 2014. [Google Scholar]
42. S. Chaudhury, S. Raw, A. Biswas and A. Gau-tam, “An integrated approach of logarithmic transformation and histogram equalization for image enhancement,” Advances in Intelligent Systems and Computing, vol. 335, pp. 1–12, 2015. [Google Scholar]
43. E. Nancy and E. S. Kaur, “Comparative analysis and implementation of image enhancement techniques using matlab,” International Journal of Computer Science and Mobile Computing, vol. 2, pp. 138–145, 2013. [Google Scholar]
44. A. Zarkasi, S. Nurmaini, D. Stiawan, F. Masdung, C. Amanda et al., “Implementation of fire image processing for land fire detection using color filtering method,” Journal of Physics Conference Series, vol. 1196, pp. 1–6, 2019. [Google Scholar]
45. A. F. M. Raffei, H. Asmuni, R. Hassan and R. M. Othman, “Frame detection using gradients fuzzy logic and morphological processing for distant color eye images in an intelligent iris recognition system,” Applied Soft Computing, vol. 37, pp. 363–381, 2016. [Google Scholar]
46. Q. Wang, N. Gui, Y. Liu, S. Peng, X. Yang et al., “A morphological image processing method for simultaneous scrutinization of particle position and velocity in pebble flow,” Annals of Nuclear Energy, vol. 148, pp. 1–10, 2020. [Google Scholar]
47. E. Suryani, E. I. Asmari and B. Harjito, “Image segmentation of acute myeloid leukemia using multi otsu thresholding,” Journal of Physics: Conference Series, vol. 1803, pp. 1–10, 2021. [Google Scholar]
48. S. L. Bangare, A. Dubal, P. S. Bangare and S. T. Patil, “Reviewing otsu’s method for image thresholding,” International Journal of Applied Engineering Research, vol. 10, no. 9, pp. 21777–21783, 2015. [Google Scholar]
49. S. Ravi and A. M. Khan, “Morphological operations for image processing: Understanding and its applications,” in National Conf. on VLSI, Signal Processing & Communications, vol. 2, pp. 16–19, 2013. [Google Scholar]
50. G. S. Rao, A. S. Krishna, S. M. Basha and C. J. Prakash, “Object-based image enhancement technique for gray scale images,” International Journal of Advanced Information Technology, vol. 4, no. 3, pp. 9–23, 2014. [Google Scholar]
51. S. Dalal and T. Sahoo, “A selective feature matching approach for iris recognition,” International Journal of Computer Applications, vol. 41, no. 20, pp. 34–39, 2012. [Google Scholar]
52. H. K. Rana, M. S. Azam, M. R. Akhtar, J. M. W. Quinn and M. A. Moni, “A fast iris recognition system through optimum feature extraction,” PeerJ Computer Science, San Diego, pp. 1–13, 2019. [Google Scholar]
53. S. S. Yasiran, S. Salleh and R. Mahmud, “Haralick texture and invariant moments features for breast cancer classification,” Advances in Industrial and Applied Mathematics, vol. 1750, pp. 1–6, 2016. [Google Scholar]
54. A. Müller, N. Karathanasopoulos, C. C. Roth and D. Mohr, “Machine learning classifiers for surface crack detection in fracture experiments,” International Journal of Mechanicals Sciences, vol. 209, pp. 1–14, 2021. [Google Scholar]
55. A. I. Korda, A. Ruef, S. Neufang, C. Davatzikos, S. Borgwardt et al., “Identification of voxel-based texture abnormalities as new biomarkers for schizophrenia and major depressive patients using layer-wise relevance propagation on deep learning decisions,” Psychiarty Research: Neuroimaging, vol. 313, pp. 1–12, 2021. [Google Scholar]
56. K. Iqba, M. O. Odetayo and A. James, “Content-based image retrieval approach for biometric security using colour, texture and shape features controlled by fuzzy heuristics,” Journal of Computer and System Sciences, vol. 78, pp. 1258–1277, 2012. [Google Scholar]
57. N. J. Shoumy, P. Ehkan, S. N. Yaakob, S. Ali and S. Khatun, “Feature extraction for neural network pattern recognition for bloodstain analysis,” International Journal of Applied Engineering, vol. 11, no. 15, pp. 8583–8589, 2016. [Google Scholar]
58. S. E. Jeroa, K. D. Bharathia, P. A. Karthickb and S. Ramakrishnan, “Muscle fatigue analysis in isometric contractions using geometric features of surface electromyography signals,” Biomedical Signal Processing and Control, vol. 68, pp. 1–11, 2021. [Google Scholar]
59. S. Vinothini, N. Punitha, P. A. Karthick and S. Ramakrishnan, “Automated detection of preterm condition using uterine electromyography based topological features,” Biocybernetics and Biomedical Engineering, vol. 41, no. 1, pp. 293–305, 2021. [Google Scholar]
60. A. H. Heurtier, “Texture feature extraction methods: A survey,” IEEE Access, vol. 7, pp. 8975–9000, 2019. [Google Scholar]
61. E. Alreshidi, R. A. Ramadan, H. Sharif, O. Faruk and I. Furkan, “A comparative study of image descriptors in recognizing human faces supported by distributed platforms,” Electronics, vol. 10, no. 915, pp. 1–33, 2021. [Google Scholar]
62. N. Bagri and P. K. Johari, “A comparative study on feature extraction using texture and shape for content based image retrieval,” International Journal of Advanced Science and Technology, vol. 80, pp. 41–52, 2015. [Google Scholar]
63. W. K. Mutlag, S. K. Ali, Z. M. Aydam and B. H. Taher, “Feature extraction methods: A review,” Journal of Physics: Conference Series, vol. 1591, pp. 1–10, 2020. [Google Scholar]
64. D. Srivastava, R. Wadhvani and M. Gyanchandani, “A review: Color feature extraction methods for content based image retrieval,” International Journal of Computational Engineering & Management, vol. 18, no. 3, pp. 9–13, 2015. [Google Scholar]
65. D. S. Kalel, P. M. Pisal and R. P. Bagawade, “Color, shape and texture feature extraction for content based image retrieval system: A study,” International Journal of Advanced Research in Computer and Communication Engineering, vol. 5, no .4, pp. 303–306, 2016. [Google Scholar]
66. M. N. Patel and P. Tandel, “A survey on feature extraction techniques for shape based object recognition,” International Journal of Computer Applications, vol. 137, no. 6, pp. 16–20, 2016. [Google Scholar]
67. S. R. Kodituwakku and S. Selvarajah, “Comparison of color features for image retrieval,” Indian Journal of Computer Science and Engineering, vol. 1, no. 3, pp. 207–211, 2014. [Google Scholar]
68. K. Mayathevar, M. Veluchamy and S. Bharath, “Fuzzy color histogram equalization with weighted distribution for image enhancement,” International Journal for Light and Electron Optics, vol. 216, pp. 1–10, 2020. [Google Scholar]
69. S. N. Borade, R. Deshmukh and P. Shrishrimal, “Effect of distance measures on the performance of face recognition using principal component analysis,” Advances in Intelligent Systems and Computing, vol. 384, pp. 569–577, 2016. [Google Scholar]
70. F. Malik and B. Baharudin, “Analysis of distance metrics in content-based image retrieval using statistical quantized histogram texture features in the DCT domain,” Journal of King Saud University-Computer and Information Sciences, vol. 25, pp. 207–218, 2013. [Google Scholar]
71. M. S. Moussa and O. M. Ali, “Comparing feature and matching score fusion levels of multimodal biometrics recognition system using particle swarm optimization,” International Journal of Applied Engineering Research, vol. 14, no. 20, pp. 3828–3834, 2019. [Google Scholar]
72. M. F. Nadheen and S. Poornima, “Feature level fusion in multimodal biometric authentication system,” International Journal of Computer Applications (0975–8887), vol. 69, no. 18, pp. 36–40, 2013. [Google Scholar]
73. A. A. Darwish, R. Abd Elghafar and A. F. Ali, “Multimodal face and ear images,” Journal of Computer Science, vol. 5, no. 5, pp. 374–379, 2009. [Google Scholar]
Cite This Article
 Copyright © 2023 The Author(s). Published by Tech Science Press.
This work is licensed under a Creative Commons Attribution 4.0 International License , which permits unrestricted use, distribution, and reproduction in any medium, provided the original work is properly cited.
 Downloads
 Citation Tools