
 Submit a Paper
 Propose a Special lssue
 Open Access
ARTICLE
Arithmetic Optimization with Deep Learning Enabled Churn Prediction Model for Telecommunication Industries
SSN School of Management, Kalavakkam, Chennai, 603110, India
* Corresponding Author: Vani Haridasan. Email:
Intelligent Automation & Soft Computing 2023, 35(3), 3531-3544. https://doi.org/10.32604/iasc.2023.030628
Received 30 March 2022; Accepted 08 June 2022; Issue published 17 August 2022
 View Full Text
 Download PDF
Abstract
Customer retention is one of the challenging issues in different business sectors, and various firms utilize customer churn prediction (CCP) process to retain existing customers. Because of the direct impact on the company revenues, particularly in the telecommunication sector, firms are needed to design effective CCP models. The recent advances in machine learning (ML) and deep learning (DL) models enable researchers to introduce accurate CCP models in the telecommunication sector. CCP can be considered as a classification problem, which aims to classify the customer into churners and non-churners. With this motivation, this article focuses on designing an arithmetic optimization algorithm (AOA) with stacked bidirectional long short-term memory (SBLSTM) model for CCP. The proposed AOA-SBLSTM model intends to proficiently forecast the occurrence of CC in the telecommunication industry. Initially, the AOA-SBLSTM model performs pre-processing to transform the original data into a useful format. Besides, the SBLSTM model is employed to categorize data into churners and non-churners. To improve the CCP outcomes of the SBLSTM model, an optimal hyperparameter tuning process using AOA is developed. A widespread simulation analysis of the AOA-SBLSTM model is tested using a benchmark dataset with 3333 samples and 21 features. The experimental outcomes reported the promising performance of the AOA-SBLSTM model over the recent approaches.Keywords
The globalization and developments of telecommunication industries significantly increase the number of workers in the marketplace, intensifying competition [1]. In this competitive period, it is compulsory to maximize the revenues occasionally, for which several approaches have been offered, i.e., obtaining new clients, retaining the prevailing consumers, and raising the retaining duration of prevailing clients [2]. Amongst every strategy, the maintenance of present clients is cheaper when compared to others. Given the implementation of the 3rd policy, businesses need to decrease the significant customer churn (CC), that is, consumer shifts from one service provider to another service provider. The foremost cause for churn is the disappointment in customer services and support structures. The only way to solve this problem is to predict the clients who are at the risk of churning [3,4].
Nowadays, the challenging environment and cost-cutting stress initiated the organizations to increase the customer relationship management (CRM) module. The subsequent behavior of the clients has to be varied from unfamiliar to familiar ones. However, the estimation of the user’s conclusion is very complicated, and earlier findings help prevent the churn prediction [5]. In CRM, user maintenance is a key task that openly affects the company’s revenue and production units. For example, a partial raise in the retaining rate has led to the maximization of profits to a greater level. The modification costs relate to users switching nature which is earned by customers, companies, or both. Customers’ churn is the primary concern in service-oriented sectors with excellent competitive services [6]. In addition, forecasting the consumers who are probably to terminate the firm will denote a potentially huge additional income source if it is performed at the initial stage. Several researchers assured that machine learning (ML) knowledge effectively forecasts this condition. This technique is practiced by learning from existing data [7].
The existence of digital systems arrangement, information technology, ML, statistical, and existing methods provide improved chances for telecommunication companies to study the user necessities that are necessary to show proficient CRM [8]. The financial state is affected by the users in the telecommunication industries, so even a minor alteration in financial objective has to be keenly watched and scrutinized. Here, CC is caused by the changes made in user behavior. However, identifying client opinions is impossible even by implementing tactics and systematic concepts [9]. It is mandatory to execute a novel study to learn consumer characteristics to identify the new aspects of CC. Employing CRM becomes an advantage in efficiently reducing the churn rate. ML has verified itself as a highly effective approach for predicting information based on earlier captured data [10] to overcome this issue.
The researcher in [10] executes the customer churn prediction (CCP) based on the assumption that the influencer has passionate support from the follower. The information gathered by the influencer marketing agency in Korea from August 2018 to October 2020 comprises the purchase details: purchase item, payment amount, and customer information. To forecast the churning customer, we employ the Decision Tree (DT) approach. Zhao et al. [11] analyzed the causes and trends of CC via a data mining algorithm. They provided the answer to this question as to how enterprises win back churned customers, how the CC takes place, and the influencing factors of CC. The experimental result serves the practice of CRM better in the telecom industry and references the telecom industry to recognize higher-risk churned customers.
In [12], a class-dependent cost-sensitive boosting approach, AdaBoostWithCost, is presented to reduce the churn cost. It illustrates the empirical evaluation of the proposed method that reliably outperforms the discrete AdaBoost approach concerning telecom churn prediction. Zhang et al. [13] attempted to develop a churn prediction method for predicting telecom client churn via customer segmentation. Information is gathered from three Chinese telecom corporations, and Fisher discriminatory equation and logistic regression analysis have been utilized for building a telecom CCP method [14]. Based on the outcomes, it could be concluded that the telecom CC method built by regression analysis had a high prediction performance.
This article focuses on designing an arithmetic optimization algorithm (AOA) with stacked bidirectional long short-term memory (SBLSTM) model for CCP. The proposed AOA-SBLSTM model intends to proficiently forecast the occurrence of CC in the telecommunication industry. Initially, the AOA-SBLSTM model performs pre-processing to transform the original data into a useful format. Besides, the SBLSTM model is employed to categorize data into churners and non-churners. To improve the CCP outcomes of the SBLSTM model, an optimal hyperparameter tuning process using AOA is developed. A widespread simulation analysis of the AOA-SBLSTM model is tested using a benchmark dataset with 3333 samples and 21 features.
In this study, a novel AOA-BLSTM model has been designed to proficiently forecast the occurrence of CC in the telecommunication industry. Initially, the AOA-SBLSTM model performs pre-processing to transform the original data into a useful format. Besides, the SBLSTM model is employed to categorize data into churners and non-churners. To improve the CCP outcomes of the SBLSTM model, an optimal hyperparameter tuning process using AOA is developed. Fig. 1 demonstrates the overall process of the AOA-BLSTM technique.
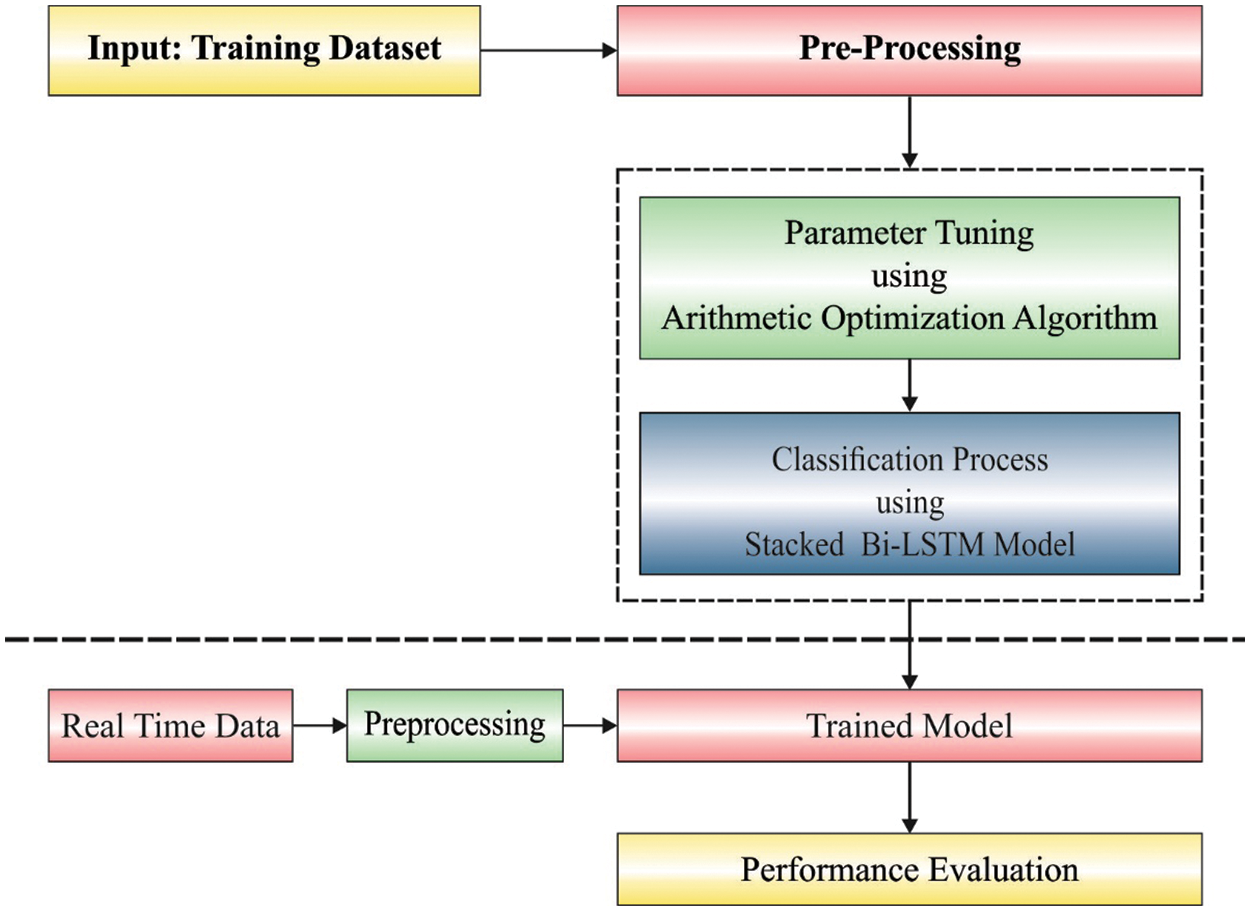
Figure 1: The overall process of the AOA-SBLSTM technique
Firstly, the AOA-SBLSTM model follows z-score normalization-based pre-processing to transform the original data into a useful format. The
whereas
At this stage, the SBLSTM model is employed to categorize data into churners and non-churners. The normal structure of LSTM efficiently resolves the gradient vanishing problems and transports valuable data within the LSTM network [15]. The Recurrent Neural Network (RNN) failed to capture long-term dependency amongst feature vectors. The LSTM cell comprises of input gate
• Forget gate: it can be utilized for determining the number of data from a preceding layer
whereas
• Input gate: it can be utilized for determining the number of the network’s input
In which
• Output gate: it can be utilized for determining the number of data transported to the LSTM in the cell state
whereas
The last output of the LSTM cell is the cell output state
The intermediate cell input is denoted as
Here
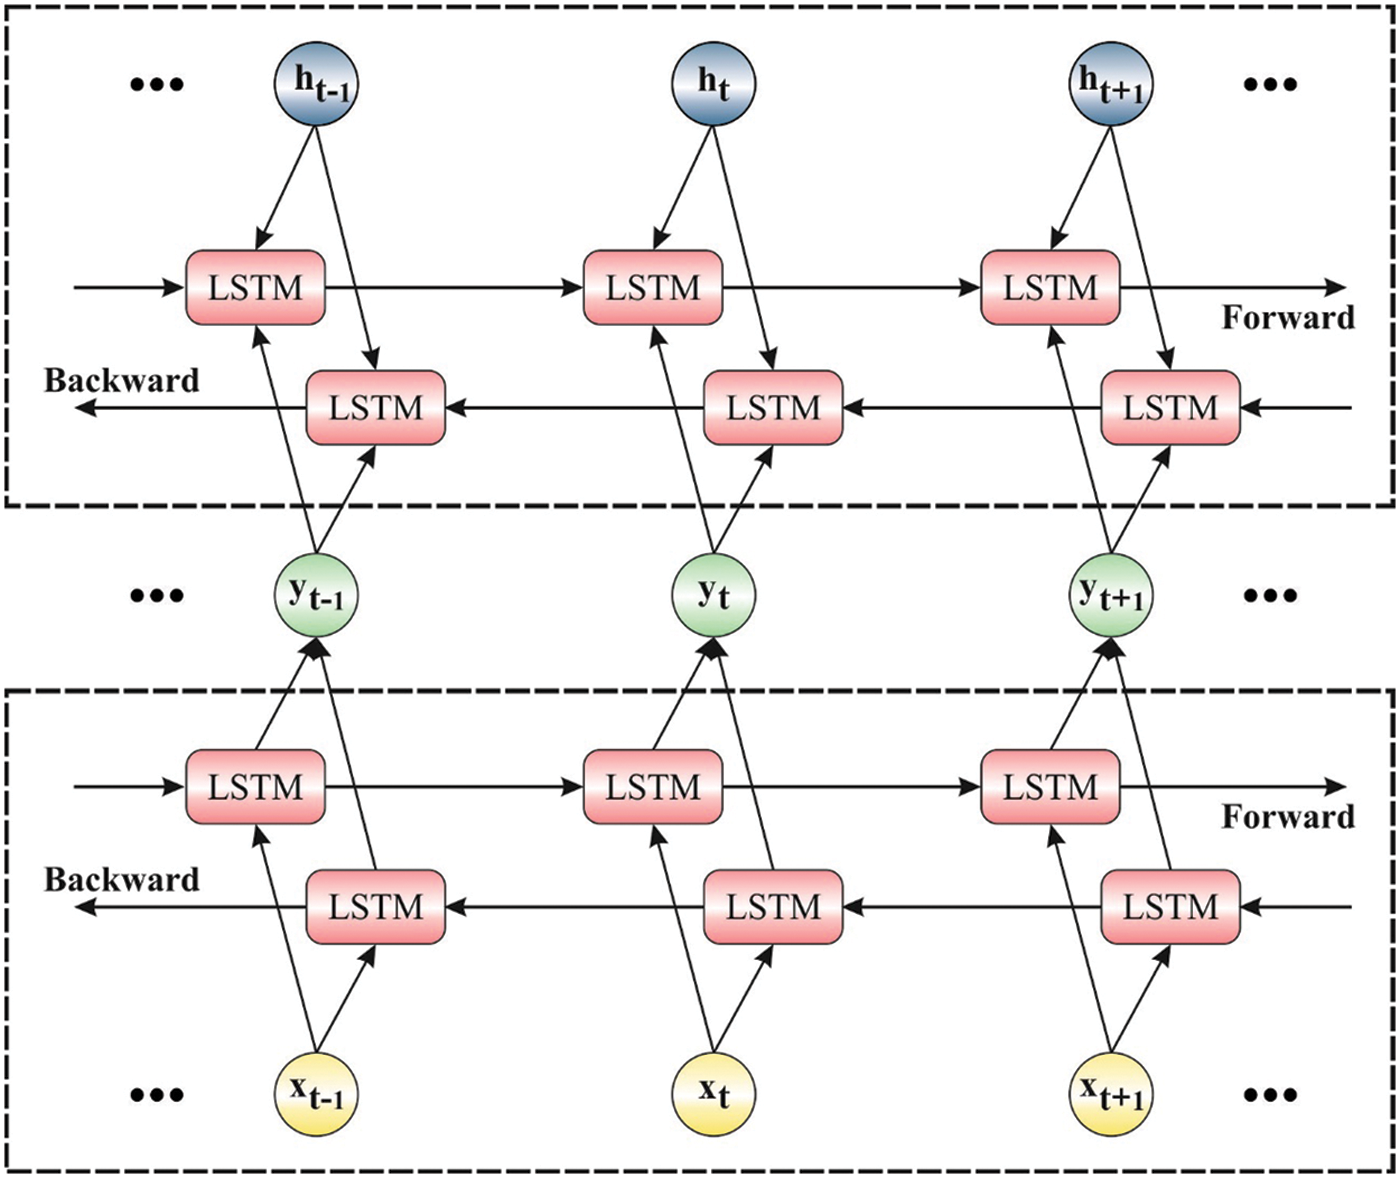
Figure 2: Structure of stacked BilSTM
The LSTM is employed by fruit fly optimization for NN3 information for time series analysis. Alternatively, LSTM was utilized [16] in a fully varied field to forecast the lifetime of equipment in the mechanical broadcast scheme. A BiLSTM encompasses two distinct LSTMs that combine data from two directions. Then, the data attained as word annotation from the customer data is combined. The forward LSTM process uses the input from left to right and estimates the hidden layer
Further, the deep hierarchical method improves the accuracy of the classification. But the stacked BiLSTM is very effective in the shallow learning method. Hence the presented method determines a stacking BiLSTM to employ the local context and latent symmetry complex data. The output of the low layer becomes the input of the upper layer in a Stacked BiLSTM.
2.3 AOA Based Hyperparameter Tuning
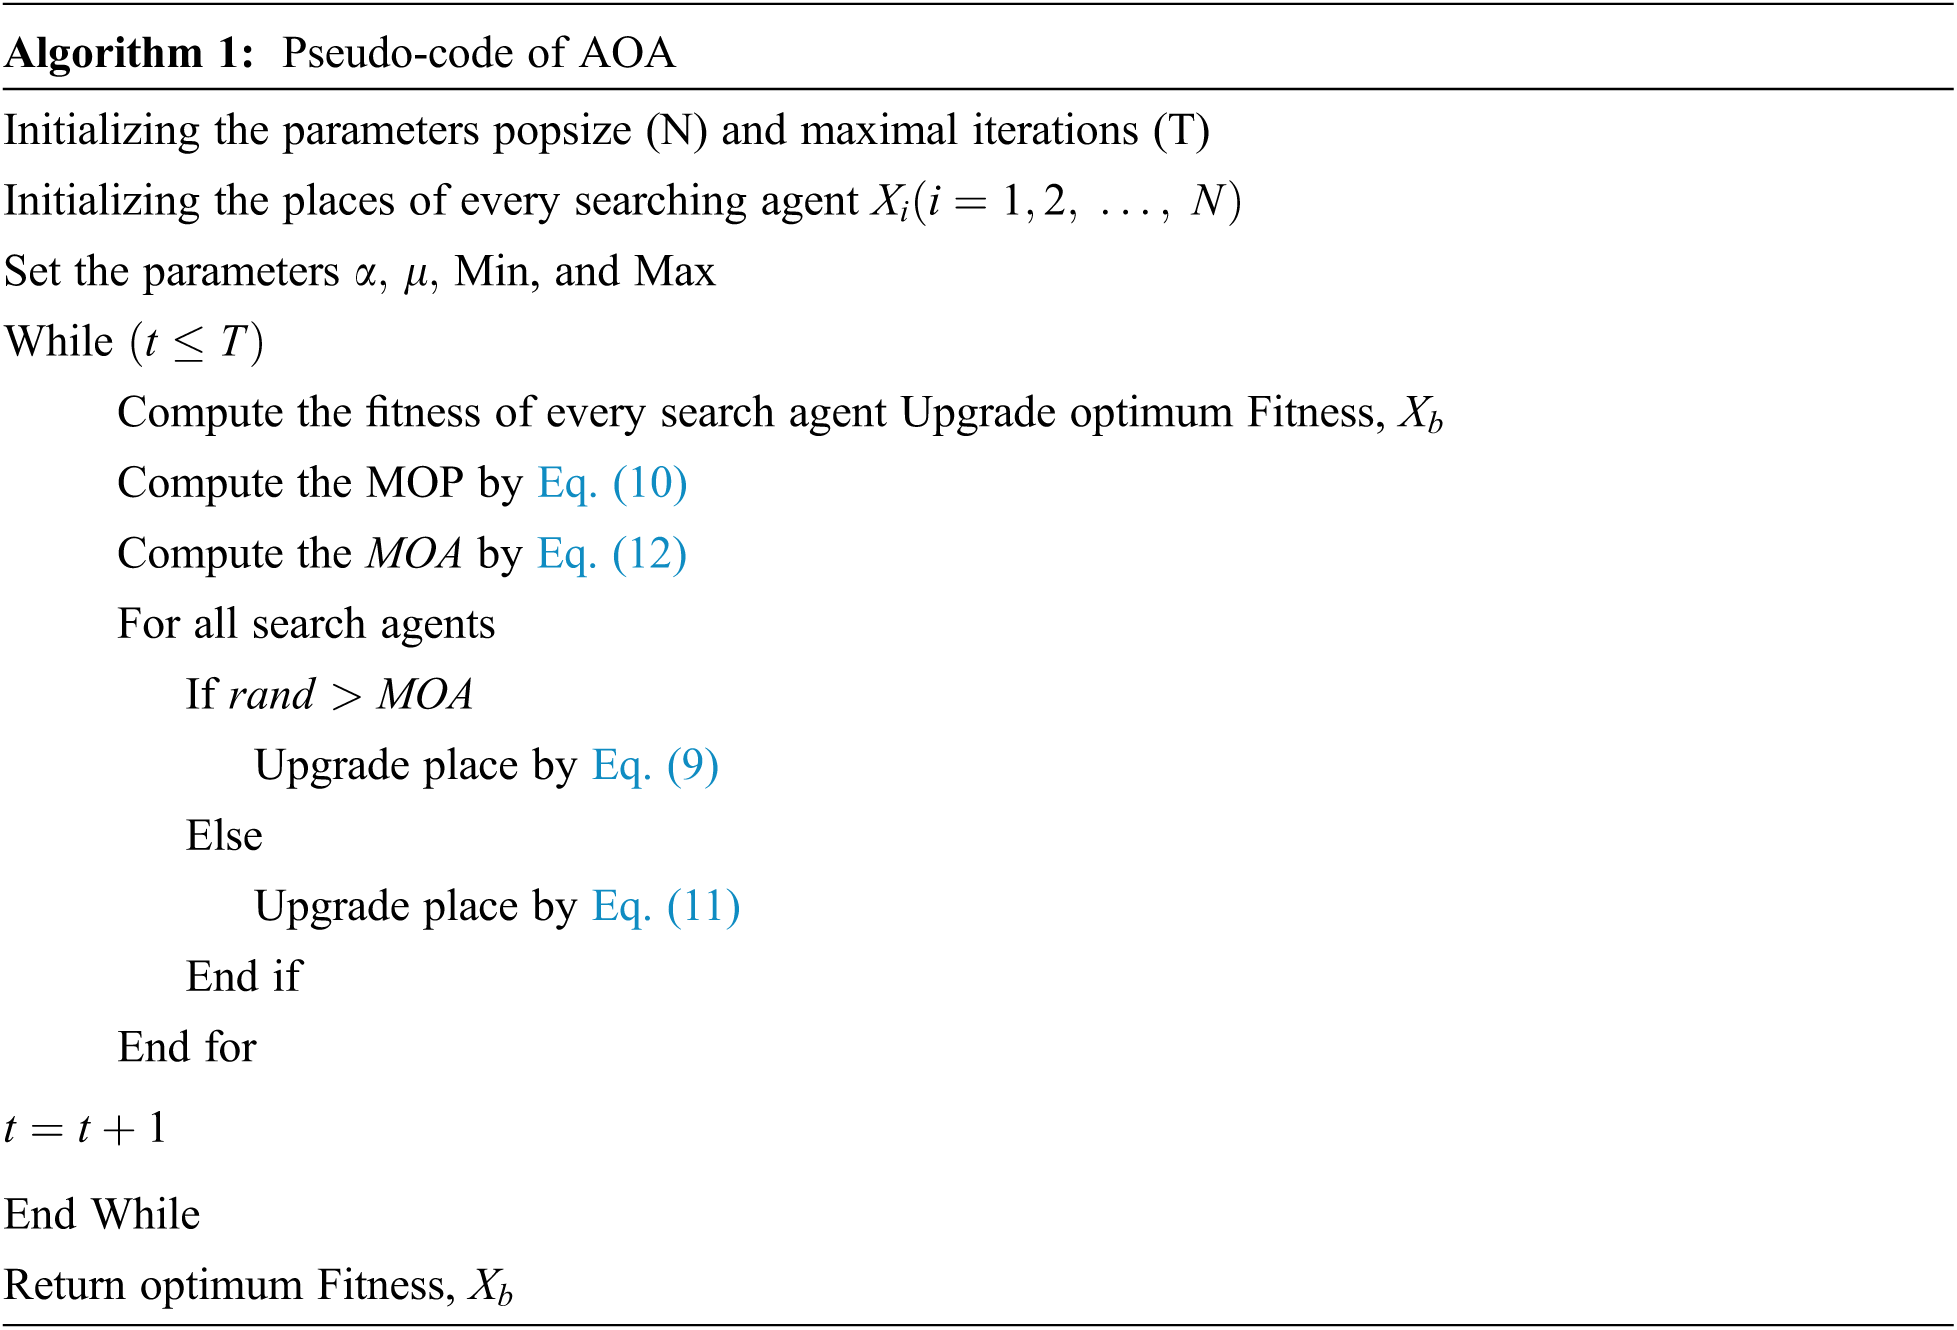
At the final stage, an optimal hyperparameter tuning process using AOA is developed to improve the performance of the SBLSTM model. AOA is a novel meta-heuristic model presented by Abualigah and others in 2021 [16]. The main stimulus of this technique is for combining the four standard arithmetic operators from mathematics, namely division (D), multiplication (M), addition (A), and subtraction (S). Related to the sine-cosine algorithm (SCA), AOA is a straightforward infrastructure and has minimal computation complexity. Assuming
whereas
In MOP, it is non-linearly reduced from one to zero under the iterations, and the formulation is as follows:
In which
In Eq. (9), it could be noticeable that both
. There is no doubt that the balance between exploration and exploitation is significant to an optimized technique. In AOA, the parameter
whereas
Based on Eq. (12),
The AOA approach derives a fitness function to obtain better classification accuracy. It defines a positive integer to characterize the effective accuracy of the candidate solutions. In our work, the minimization of the classification error rate is regarded as the fitness function. The optimum solution has a small error rate, and the worse solution accomplishes an increased error rate.
In this section, the experimental validation of the AOA-SBLSTM model is tested using a benchmark CCP dataset (available at http://www.sgi.com/tech/mlc/db/), comprising 3333 instances with 21 features. A set of 483 samples falls into the churner (CR) class, and 2859 samples come under the non-churner (NCR) class. The proposed model is simulated using Python 3.6.5 tool.
Fig. 3 inspects the performance of the AOA-SBLSTM model under distinct epoch count. The results demonstrated that the AOA-SBLSTM model has effectively classified CR and NCR classes. For instance, with 200 epochs, the AOA-SBLSTM model has identified 342 and 2844 samples under CR and NCR classes, respectively. In addition, with 400 epochs, the AOA-SBLSTM methodology has identified 208 and 2845 samples under CR and NCR classes correspondingly. Moreover, with 800 epochs, the AOA-SBLSTM technique has correspondingly identified 346 and 2843 samples under CR and NCR classes. Furthermore, with 1000 epochs, the AOA-SBLSTM system has correspondingly identified 310 and 2844 samples under CR and NCR classes. With 1200 epochs, the AOA-SBLSTM technique has correspondingly identified 371 and 2843 samples under CR and NCR classes.
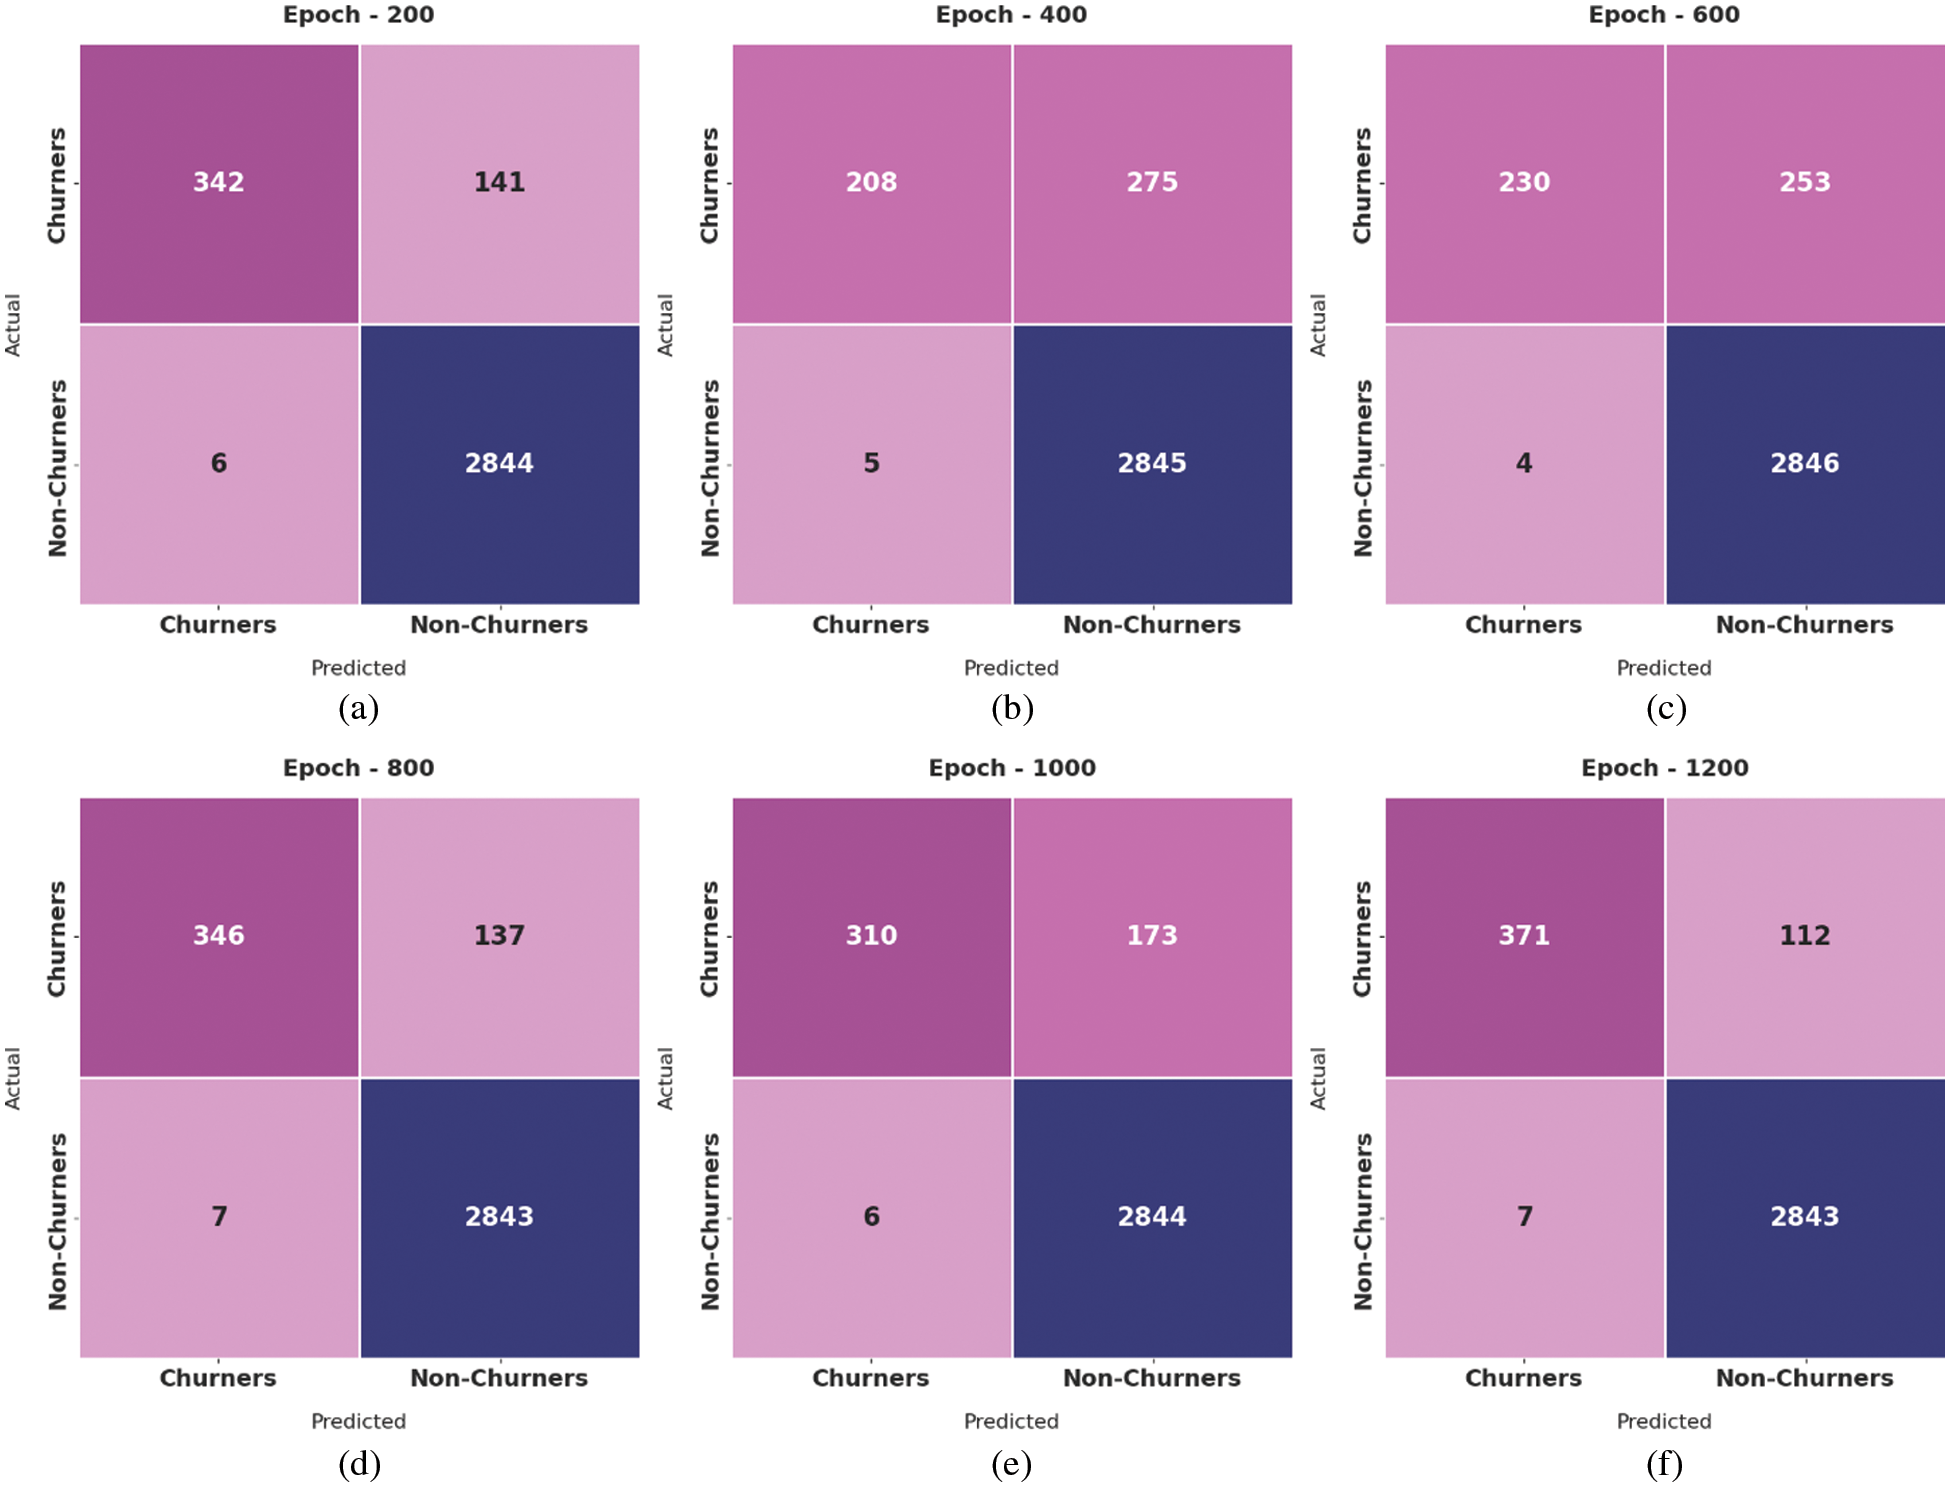
Figure 3: Confusion matrix of AOA-SBLSTM technique under distinct epoch count
Tab. 1 and Fig. 4 highlights the overall CCP outcomes of the AOA-SBLSTM model under varying epoch count. The experimental values denoted the improved performance of the AOA-SBLSTM model under all epochs. For instance, with 100 epochs, the AOA-SBLSTM model has obtained an average
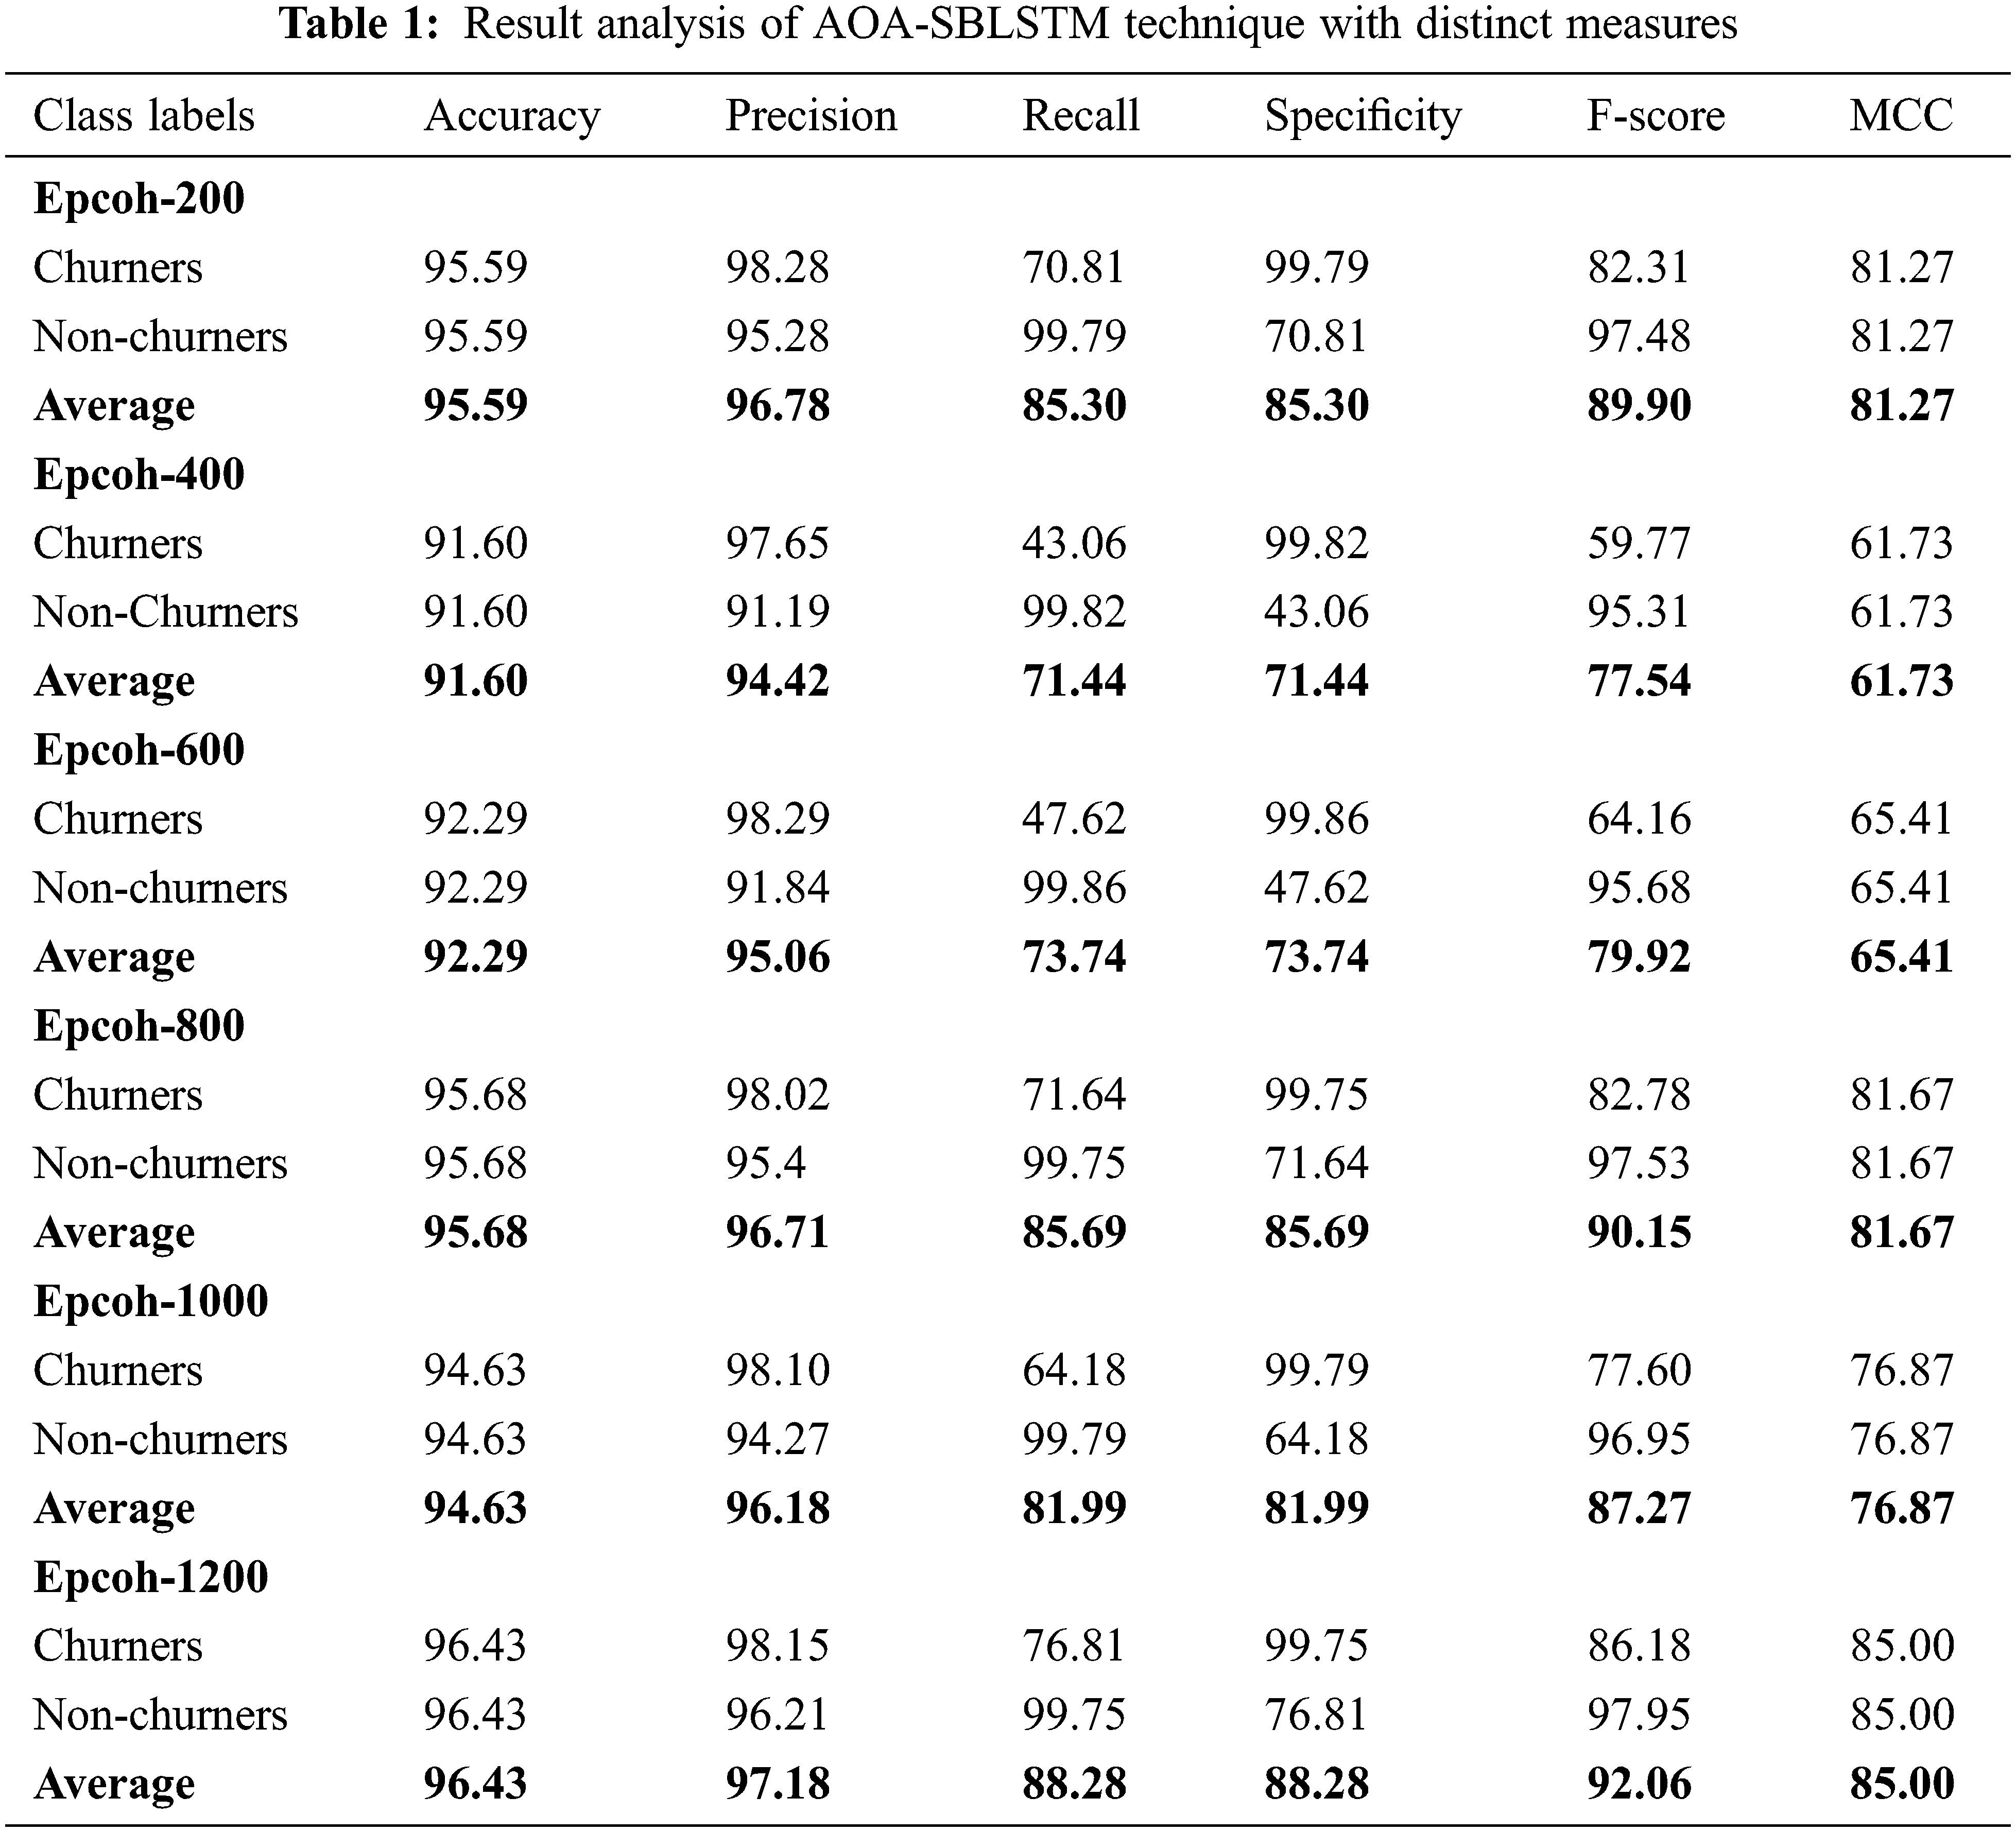
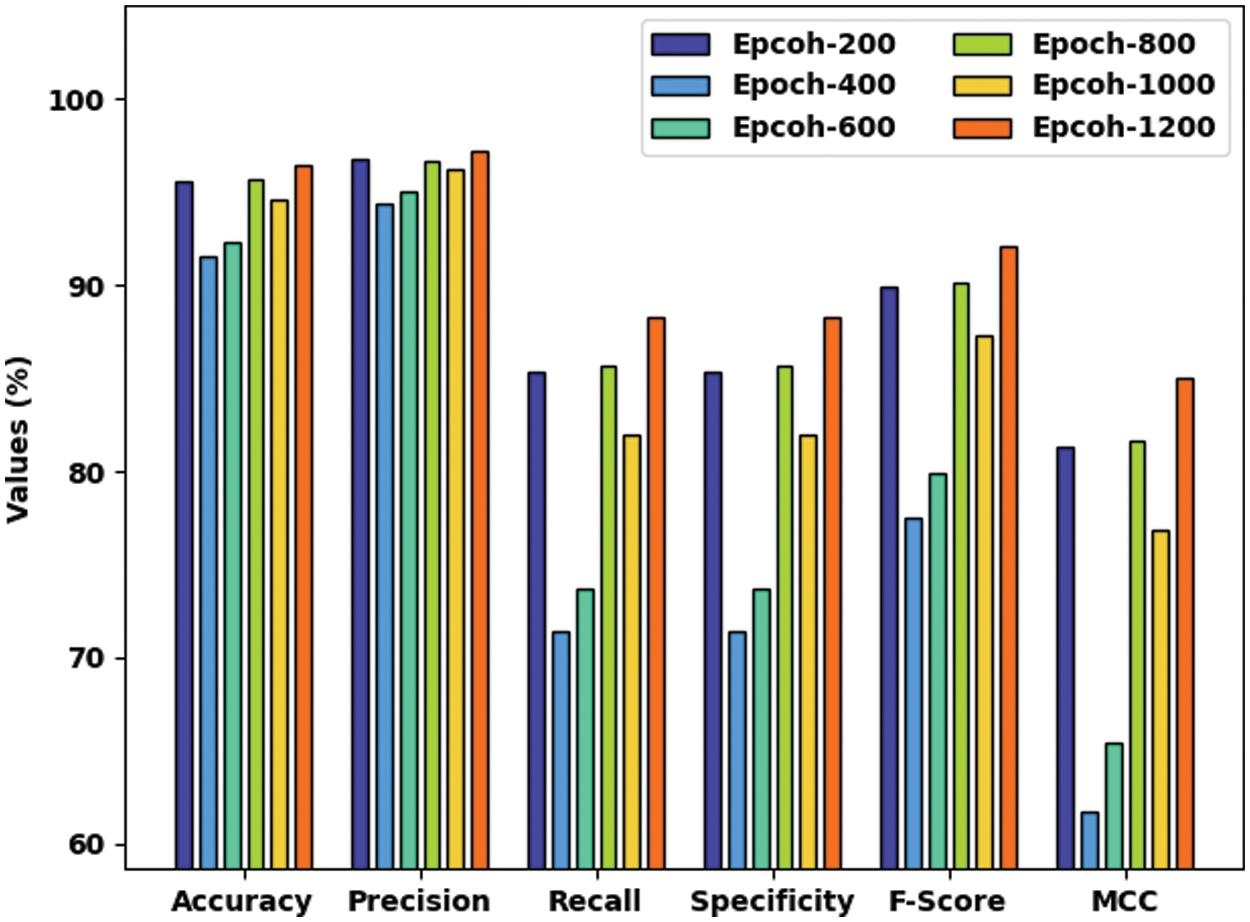
Figure 4: Result analysis of AOA-SBLSTM technique with distinct measures
The training accuracy (TA) and validation accuracy (VA) attained by the AOA-SBLSTM approach on the test dataset is demonstrated in Fig. 5. The experimental outcomes implied that the ICSOA-DLPEC model has gained maximal values of TA and VA. In specific, the VA seemed to be higher than TA.
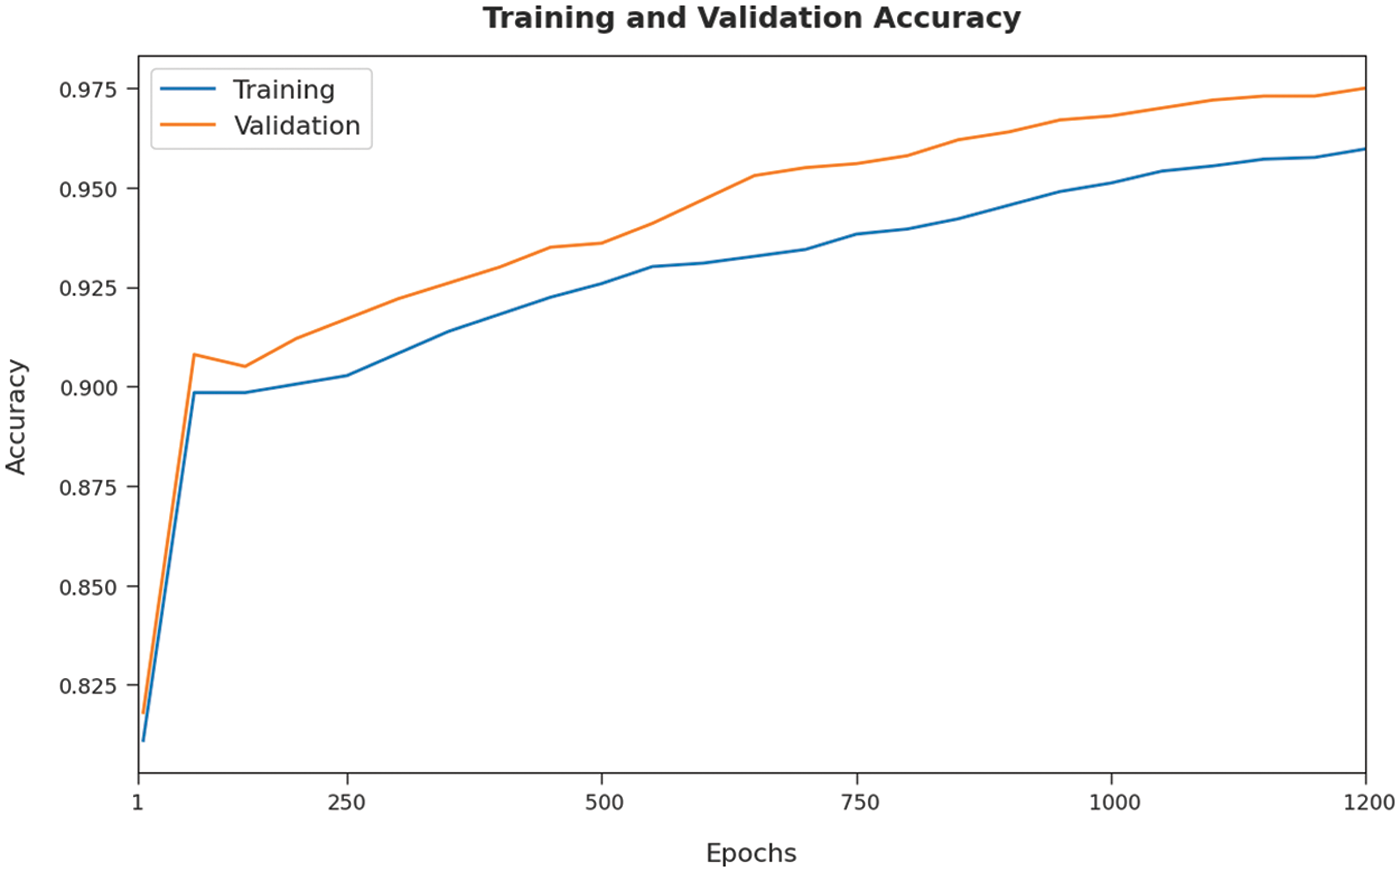
Figure 5: TA and VA graph analysis of AOA-SBLSTM technique
The training loss (TL) and validation loss (VL) attained by the AOA-SBLSTM technique on the test dataset are established in Fig. 6. The experimental outcomes inferred that the ICSOA-DLPEC system had accomplished the least values of TL and VL. In specific, the VL seemed to be lower than TL.
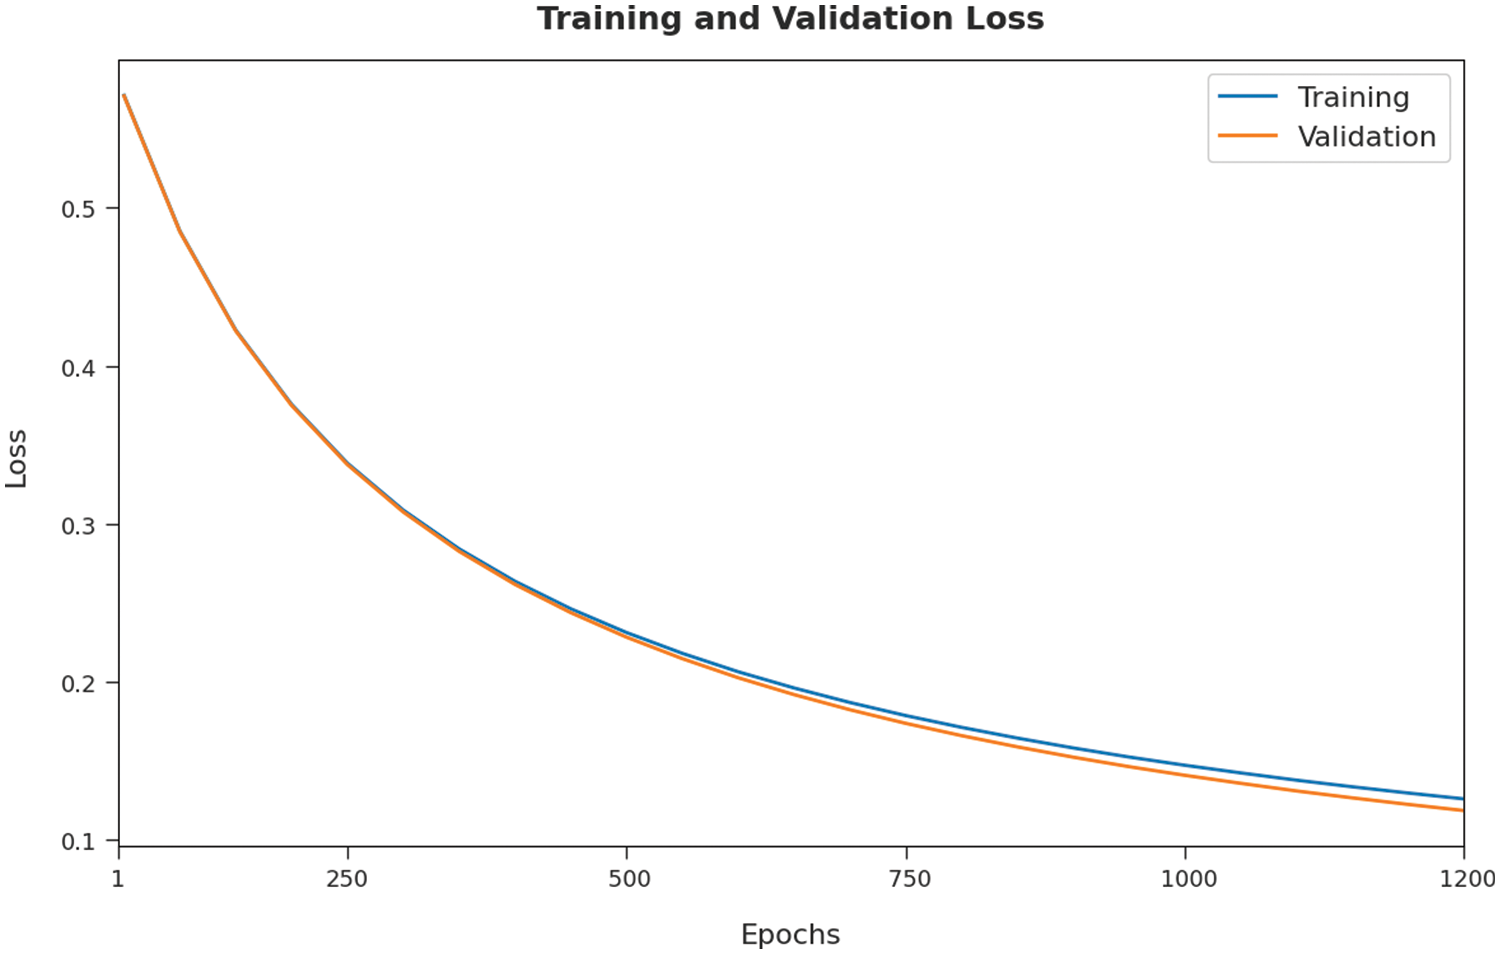
Figure 6: TL and VL graph analysis of AOA-SBLSTM technique
A detailed precision-recall examination of the AOA-SBLSTM model on the test dataset is demonstrated in Fig. 7. By observing Fig. 7, it can be obvious that the AOA-SBLSTM model has accomplished maximal precision-recall performance under the test dataset.
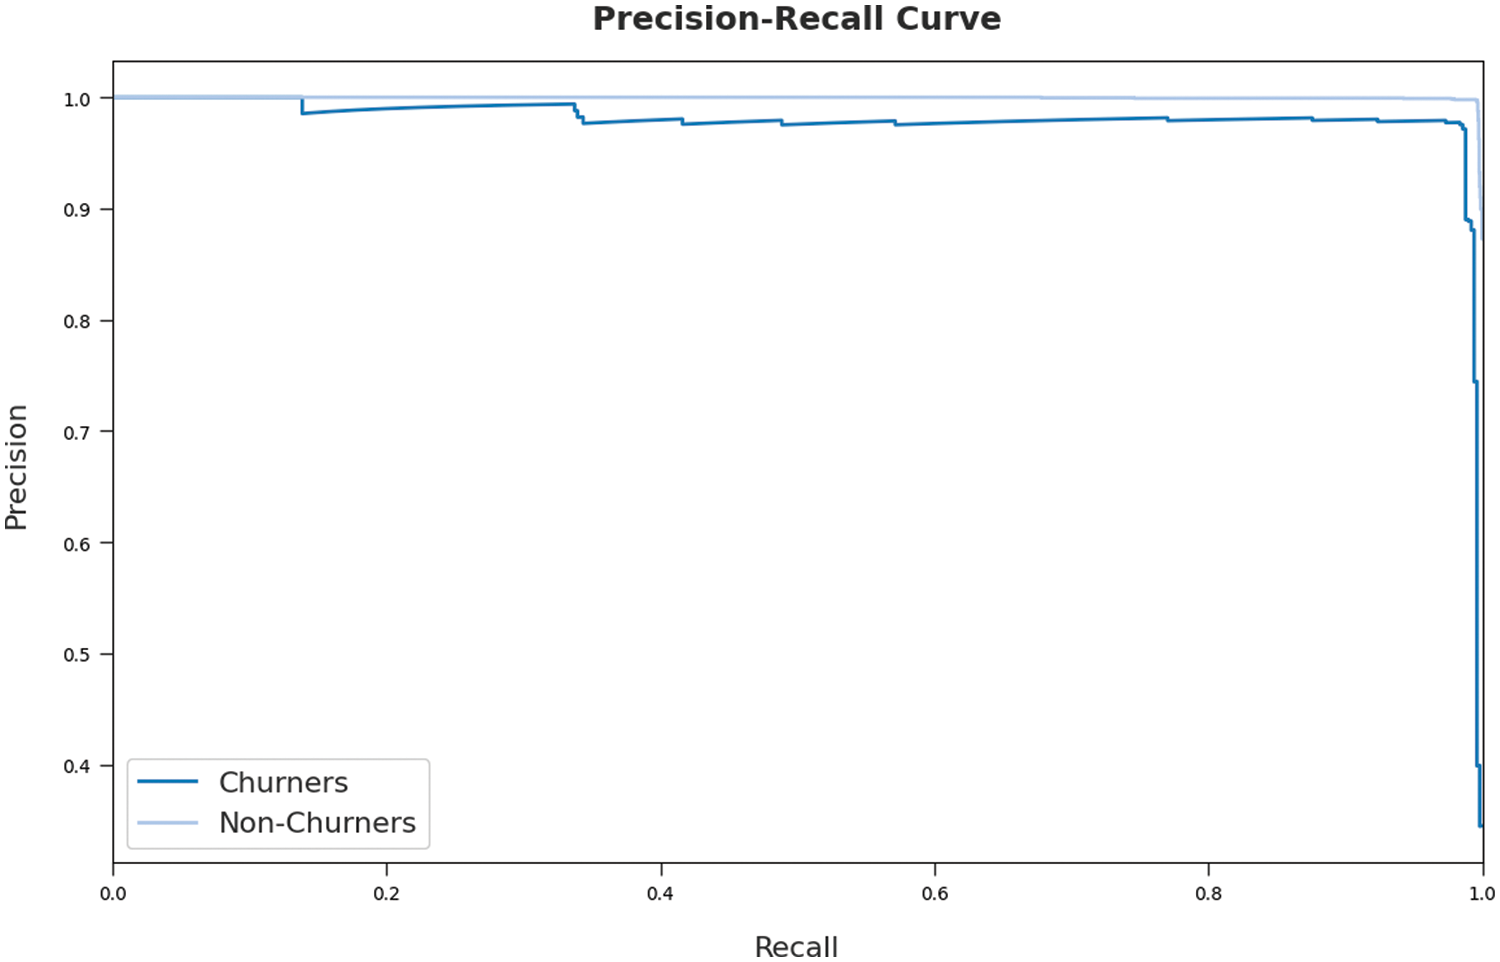
Figure 7: Precision-recall curve analysis of AOA-SBLSTM technique
Fig. 8 depicts the Receiver operating characteristic (ROC) examination of the AOA-SBLSTM model on the test dataset. Fig. 8 exposed that the AOA-SBLSTM model has resulted in maximal ROC values on the categorization of churners and non-churners images.
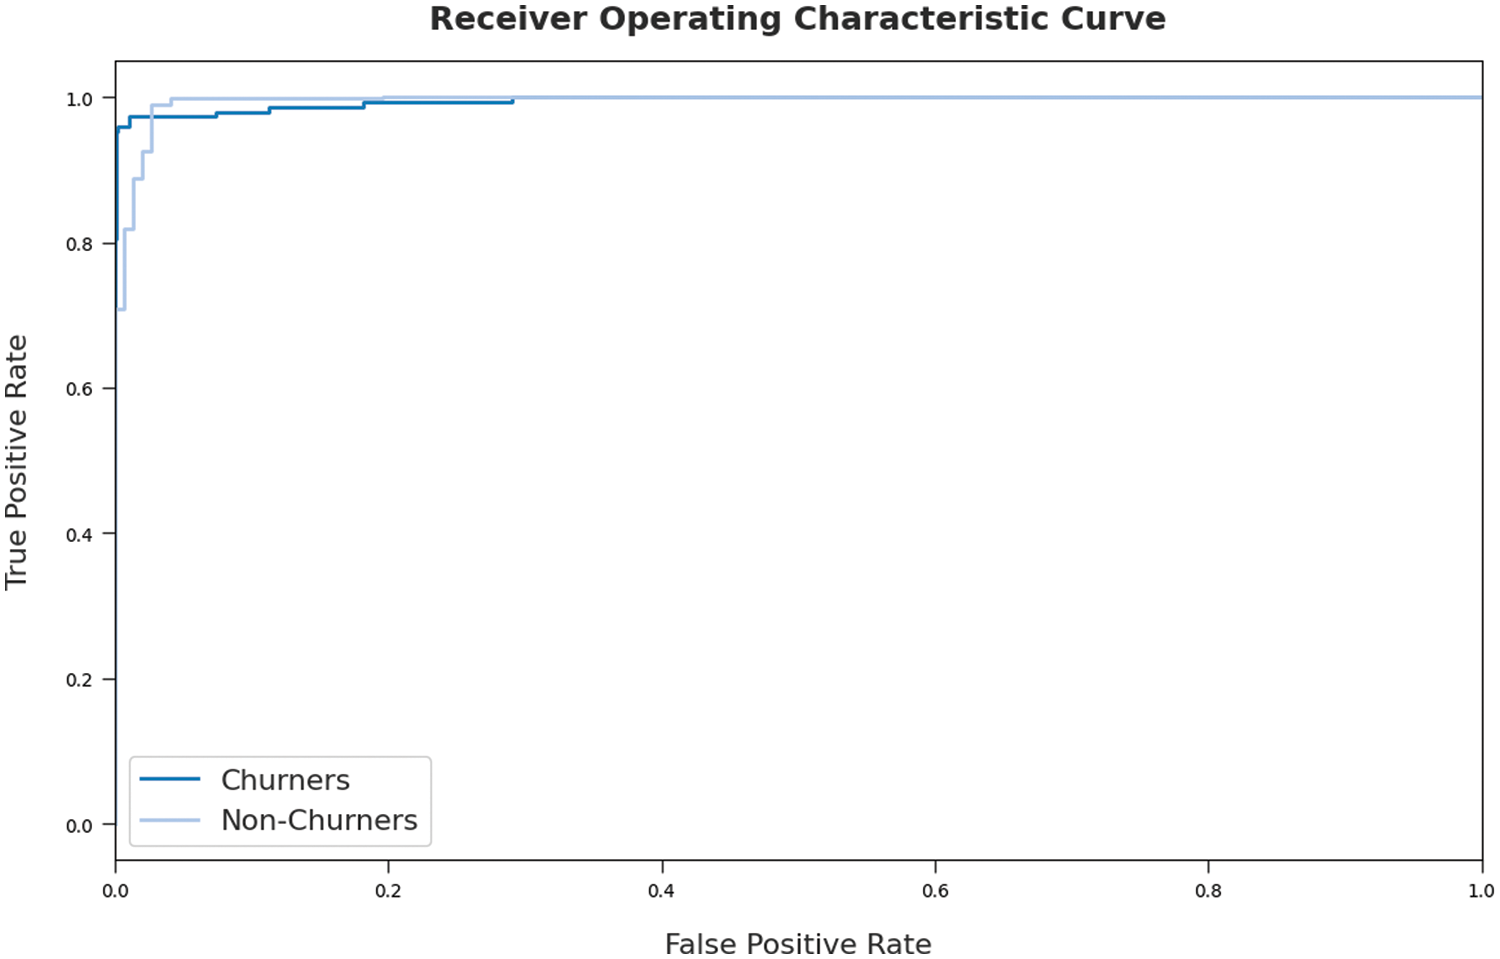
Figure 8: ROC curve analysis of AOA-SBLSTM technique
In order to ensure the enhancements of the AOA-SBLSTM model, a comparative study with existing approaches [16,17] is provided in Tab. 2. Fig. 9 reports a comparative
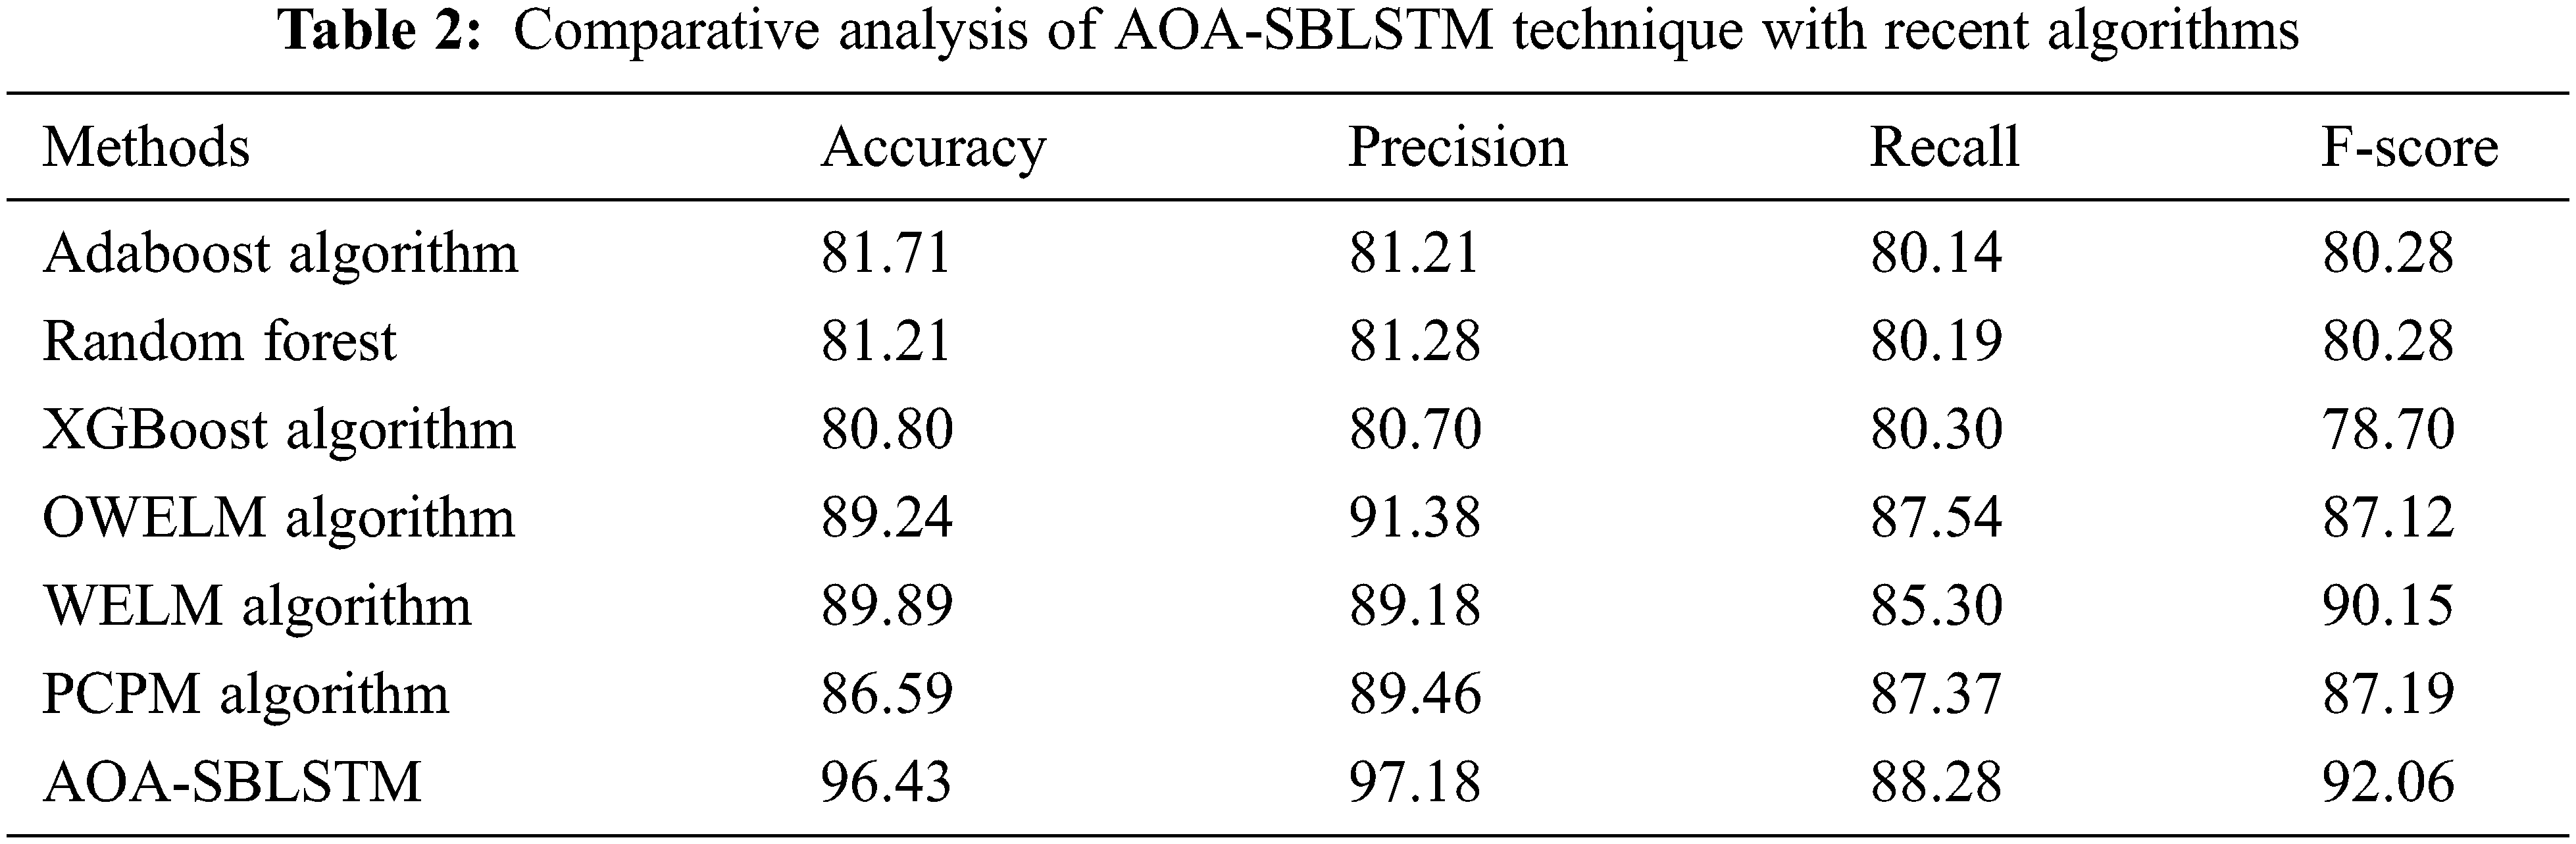
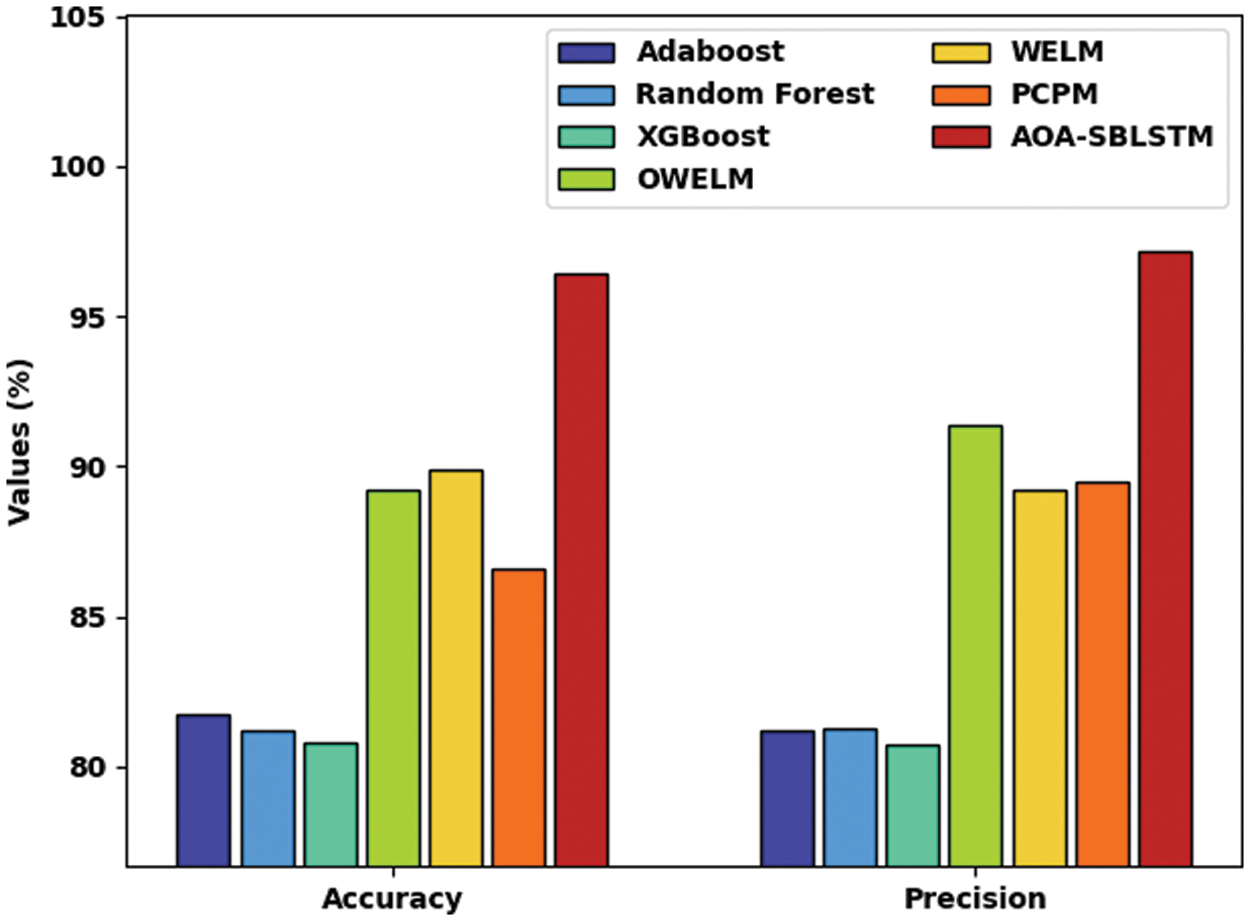
Figure 9:
Fig. 10 demonstrates a comparative
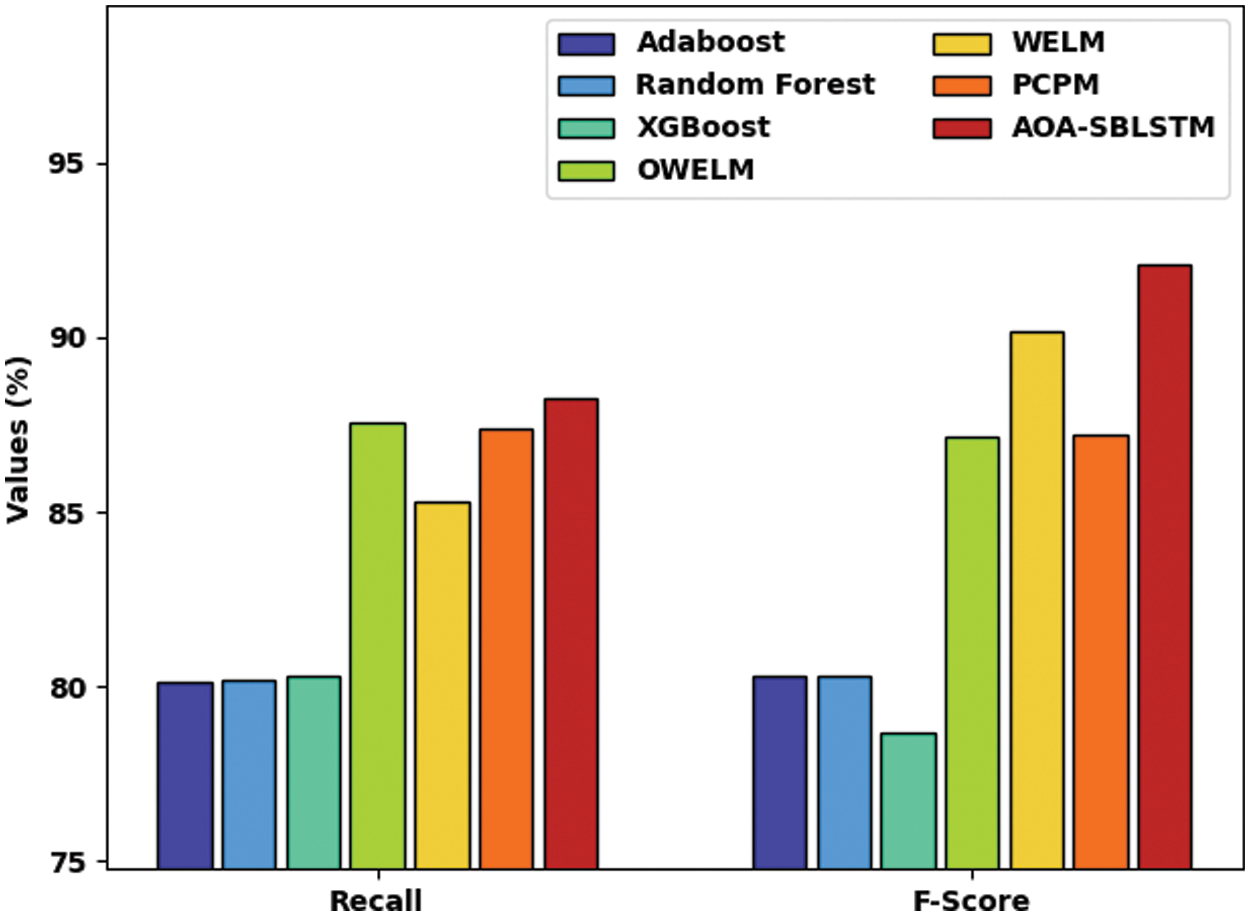
Figure 10:
After observing Tab. 2, Figs. 9 and 10, it is apparent that the AOA-SBLSTM model has shown an effectual outcome on the CCP process.
In this study, a novel AOA-BLSTM model has been designed to proficiently forecast the occurrence of CC in the telecommunication industry. Initially, the AOA-SBLSTM model performs pre-processing to transform the original data into a useful format. Besides, the SBLSTM model is employed to categorize data into churners and non-churners. To improve the CCP outcomes of the SBLSTM model, an optimal hyperparameter tuning process using AOA is developed. A widespread simulation analysis of the AOA-SBLSTM model is tested using a benchmark dataset with 3333 samples and 21 features. The experimental outcomes reported the promising performance of the AOA-SBLSTM model over the recent approaches. Thus, the presented AOA-SBLSTM model can be exploited as a real-time CCP tool. In the future, feature selection methodologies can be incorporated to reduce complexity and increase prediction efficiency.
Funding Statement: The authors received no specific funding for this study.
Conflicts of Interest: The authors declare that they have no conflicts of interest to report regarding the present study.
References
1. A. K. Ahmad, A. Jafar and K. Aljoumaa, “Customer churn prediction in telecom using machine learning in big data platform,” Journal of Big Data, vol. 6, no. 1, pp. 1–24, 2019. [Google Scholar]
2. A. De Caigny, K. Coussement, K. W. De Bock, “A new hybrid classification algorithm for customer churn prediction based on logistic regression and decision trees,” European Journal of Operational Research, vol. 269, no. 2, pp. 760–772, 2018. [Google Scholar]
3. A. Amin, F. Al-Obeidat, B. Shah, A. Adnan, J. Loo et al., “Customer churn prediction in telecommunication industry using data certainty,” Journal of Business Research, vol. 94, no. 8, pp. 290–301, 2019. [Google Scholar]
4. J. Uthayakumar, N. Metawa, K. Shankar and S. K. Lakshmanaprabu, “Financial crisis prediction model using ant colony optimization,” International Journal of Information Management, vol. 50, no. 5, pp. 538–556, 2020. [Google Scholar]
5. F. Shirazi and M. Mohammadi, “A big data analytics model for customer churn prediction in the retiree segment,” International Journal of Information Management, vol. 48, no. 6, pp. 238–253, 2019. [Google Scholar]
6. A. De Caigny, K. Coussement, K. W. De Bock and S. Lessmann, “Incorporating textual information in customer churn prediction models based on a convolutional neural network,” International Journal of Forecasting, vol. 36, no. 4, pp. 1563–1578, 2020. [Google Scholar]
7. P. Lalwani, M. K. Mishra, J. S. Chadha and P. Sethi, “Customer churn prediction system: A machine learning approach,” Computing, vol. 104, pp. 1–24, 2021. [Google Scholar]
8. E. Stripling, S. vanden Broucke, K. Antonio, B. Baesens and M. Snoeck, “Profit maximizing logistic model for customer churn prediction using genetic algorithms,” Swarm and Evolutionary Computation, vol. 40, no. 3, pp. 116–130, 2018. [Google Scholar]
9. S. De, P. Prabu and J. Paulose, “Effective ML techniques to predict customer churn,” in 2021 Third Int. Conf. on Inventive Research in Computing Applications (ICIRCA), Coimbatore, India, IEEE, pp. 895–902, 2021. [Google Scholar]
10. S. Kim and H. Lee, “Customer churn prediction in influencer commerce: An application of decision trees,” Procedia Computer Science, vol. 199, no. 2, pp. 1332–1339, 2022. [Google Scholar]
11. M. Zhao, Q. Zeng, M. Chang, Q. Tong and J. Su, “A prediction model of customer churn considering customer value: An empirical research of telecom industry in China,” Discrete Dynamics in Nature and Society, vol. 2021, no. 5, pp. 1–12, 2021. [Google Scholar]
12. H. K. Thakkar, A. Desai, S. Ghosh, P. Singh and G. Sharma, “Clairvoyant: AdaBoost with cost-enabled cost-sensitive classifier for customer churn prediction,” Computational Intelligence and Neuroscience, vol. 2022, no. 1, pp. 1–11, 2022. [Google Scholar]
13. T. Zhang, S. Moro and R. F. Ramos, “A data-driven approach to improve customer churn prediction based on telecom customer segmentation,” Future Internet, vol. 14, no. 3, pp. 94, 2022. [Google Scholar]
14. A. K. Nandanwar and J. Choudhary, “Semantic features with contextual knowledge-based web page categorization using the GloVe model and stacked BiLSTM,” Symmetry, vol. 13, no. 10, pp. 1772, 2021. [Google Scholar]
15. I. Banerjee, Y. Ling, M. C. Chen, S. A. Hasan, C. P. Langlotz et al., “Comparative effectiveness of convolutional neural network (CNN) and recurrent neural network (RNN) architectures for radiology text report classification,” Artificial Intelligence in Medicine, vol. 97, no. 2, pp. 79–88, 2019. [Google Scholar]
16. L. Abualigah, A. Diabat, S. Mirjalili, M. Abd Elaziz and A. H. Gandomi, “The arithmetic optimization algorithm,” Computer Methods in Applied Mechanics and Engineering, vol. 376, no. 2, pp. 113609, 2021. [Google Scholar]
17. I. V. Pustokhina, D. A. Pustokhin, P. T. Nguyen, M. Elhoseny and K. Shankar, “Multi-objective rain optimization algorithm with WELM model for customer churn prediction in telecommunication sector,” Complex & Intelligent Systems, pp. 1–13, 2021. [Google Scholar]
Cite This Article
 Copyright © 2023 The Author(s). Published by Tech Science Press.
This work is licensed under a Creative Commons Attribution 4.0 International License , which permits unrestricted use, distribution, and reproduction in any medium, provided the original work is properly cited.
 Downloads
 Citation Tools