
 Submit a Paper
 Propose a Special lssue
 Open Access
ARTICLE
Stacking Ensemble Learning-Based Convolutional Gated Recurrent Neural Network for Diabetes Miletus
1 Sathyabama Institute of Science and Technology, 603202, Tamilnadu, India
2 SRM Institute of Science and Technology, 603202, Tamilnadu, India
* Corresponding Author: G. Geetha. Email:
Intelligent Automation & Soft Computing 2023, 36(1), 703-718. https://doi.org/10.32604/iasc.2023.032530
Received 21 May 2022; Accepted 06 July 2022; Issue published 29 September 2022
 View Full Text
 Download PDF
Abstract
Diabetes mellitus is a metabolic disease in which blood glucose levels rise as a result of pancreatic insulin production failure. It causes hyperglycemia and chronic multiorgan dysfunction, including blindness, renal failure, and cardiovascular disease, if left untreated. One of the essential checks that are needed to be performed frequently in Type 1 Diabetes Mellitus is a blood test, this procedure involves extracting blood quite frequently, which leads to subject discomfort increasing the possibility of infection when the procedure is often recurring. Existing methods used for diabetes classification have less classification accuracy and suffer from vanishing gradient problems, to overcome these issues, we proposed stacking ensemble learning-based convolutional gated recurrent neural network (CGRNN) Metamodel algorithm. Our proposed method initially performs outlier detection to remove outlier data, using the Gaussian distribution method, and the Box-cox method is used to correctly order the dataset. After the outliers’ detection, the missing values are replaced by the data’s mean rather than their elimination. In the stacking ensemble base model, multiple machine learning algorithms like Naïve Bayes, Bagging with random forest, and Adaboost Decision tree have been employed. CGRNN Meta model uses two hidden layers Long-Short-Time Memory (LSTM) and Gated Recurrent Unit (GRU) to calculate the weight matrix for diabetes prediction. Finally, the calculated weight matrix is passed to the softmax function in the output layer to produce the diabetes prediction results. By using LSTM-based CG-RNN, the mean square error (MSE) value is 0.016 and the obtained accuracy is 91.33%.Keywords
Diabetes mellitus is a chronic disorder that causes certain illnesses that result in high sugar levels in the circulatory system. There is no permanent cure for diabetes and uncontrolled diabetes may lead to death. Individuals suffering from type 1 diabetes are prone to fatal comorbidities such as peripheral vascular disease, stroke, a heart disease involving the coronary artery, dyslipidemia, facial hypertension, and obesity [1]. In the past, diabetes was commonly diagnosed as a disease affecting the affluent class of society. Worldwide, public health statistics replace the previous myth that it belongs only to the elite class because it affects subjects of all age groups. The etiology of this syndrome refers to incorrect handling of the beta cells of the pancreas. The most widely known symptoms of Diabetes Mellitus are major: polydipsia which refers to increased thirst, polyuria which refers to frequent urination, and polyphagia which means increased hunger [2] and in many cases significant weight loss is also evident. These symptoms are slowly developed in [3] type 1 diabetes and they are sometimes subtle or non-existent in patients with type 1 diabetes. There are other symptoms and signs by which you can mark the onset of diabetes. In addition to the aforementioned, they have haze in the incision, headaches, fatigue, slow healing, and itching of the skin [4]. Most of the skin rashes occurring in diabetes are collectively called diabetic dermadromes.
The current Convolutional Gated Recurrent Network suffers from a vanishing gradient problem. In this problem, the hidden layer is affected by a given input [5]. To resolve the aforementioned problem, two promising solutions are put forward: LSTM and GRU. They are composed of memory blocks also known as connected sub-networks which can remember inputs for a considerable time. A minimum of one self-connected accumulator cell is present in the Blocks along with several units of multiplicative nature such as forget, input gate, and output gates. The gates act as the crucial mediums to store and access information by assigning counter that is 0 and 1.
In this paper, ensemble Learning-Based Convolutional Gated Recurrent Neural Network for Diabetes Miletus predictive have been proposed. Initially, our suggested technique uses the Gaussian distribution method to discover and eliminate outlier data, and the Box-cox method to appropriately arrange the dataset. Instead of being discarded after outlier identification, missing values are filled in simply taking the mean of the data. The suggested Meta model CGRNN algorithm and softmax function are utilized for diabetes classification and prediction, and finally, we compared the proposed method it outperforms earlier methods.
This section presents a review of different machine learning methods for Diabetes prediction is presented. The Database (DB) technology monitoring was developed in the field of management and is designed to help treat patients with type 1 diabetes mellitus (T1DM) [6]. This shift confirms the role of carotid sinus nerve (CSN)-driven sympathetic hyperactivation in type 2 diabetes and is inhibited in the case of carotid sinus nerve denervation in the sympathetic nervous system (SNS). Interestingly, the inter-burst interval (for IBI) is calculated from the strong correlation between CSN bursts and glycemic disorders. Binary Logistic Regression (LR) and individual anthropometry were used for normal subjects and type 2 diabetes to examine statistically significant differences between them [7]. To evaluate, the power of two machine learning algorithms will be used. The Naive Bayes (NB) and the LR are used to predict the most reliable prediction results for different phenotypes. The introduction of the so-called Sparse Balance Support Vector Machine (SB-SVM) ML method [8] is a newly discovered T2D collection electronic health record (EHR) dataset. Type 2 Diabetes Mellitus (T2DM) entered advocates are delegated for the calculation of cardiovascular disease (CVD) risk management guidelines to initiate appropriate treatment.
The main model consists of hybrids wavelets neural network (HWNNs) and a self-organizing map (SOM network), which constitutes an ensemble of the following subsampling methods. Chi-square tests, binary logistic regression analysis, and screening for T2DM risk predict the most important risk factors for diabetes. Synthetic Minority Over-sampling Technique (SMOTE) is used to balance cross-section data [9]. The differentially expressed gene (DEGs) for each condition is compared to the DEG for type 2 diabetes (T2D). For T1D patients, for example, UVA/Padova T1D model [10] describes the dynamics of glucose, insulin, and glucagon. As the development of the self-monitoring blood glucose system has taken place, they are connected to determine the simulator and monitoring the blood glucose module (SMBG), and continuous blood glucose measurement (CGM). An individual suffering from Diabetes of T2DM does not include abstract knowledge of the criteria and uses unbalanced EHR data to service desk manager system. To recommend that, the label classification model is used. The label classification model can stop or delay the progression of diabetes which provides people with the following healthy lifestyles and recommends appropriate medications [11]. There is a dire need for a method that gives promising results in less time, is simple, and is also coherent to the concept of a detection system that is non-invasive in approach. Iris is a quite recently emerging domain of science called iris imaging research which is used to diagnose human organs.
Prevention of diabetes or late onset of diabetes is very important. A framework is proposed to [12] Investigate bioinformatics of cellular pathways involved in disease and numerous analyses of publicly available gene expression datasets are used to investigate T2D and neurological disorders by exploring the Interactions between Possible and Comorbid Diseases (NDS) This framework derives datasets from the tissues affected by these diseases. Increasingly, in biological data which has upper ranged value for throughput, an enormous number of approaches have been put forward [13] in the last decade to calculate similarity with the disease. These approaches, however rarely take into account the interconnection of disease-causing genes and protein-protein interactions (PPIs). In the proposed method, the texture features are extracted from the texture analysis method, and a time series is taken as an image that can be advanced from the conventional gait analysis method. There is no significant difference between the Hear Rate Variability (HRV) genotypes in the group I/I genotypes, D/D and I/D genotypes [14].
The combinative approach involving Infra-Red Spectroscopy coupled with multi-dimensional analysis has been put forward as a promising method for diagnostics. To examine the probability of an accurate and correct diagnosis, certain approaches such as Partial Least Squares (PLS), Cluster analysis, regression [15], and Principal Component Analysis (PCA) are performed. A theory based on traditional medical Chinese origins put forwards the association between different facial areas with different visceral conditions [16]. About this, automatic placement of four major blocks is performed using the whole facial image to detect alternative diabetes using two pupil positions [17]. This approach uses weighting to improve the accuracy of interference estimation and proposes a new EEG coherence method. This problem is solved by a random formulation and Bayesian framework using Markov chain Monte Carlo methods.
CNNs towards EEG multispectral images are used to improve classification performance. The distribution model was developed in this study based on the inception V1 multi-view convolutional neural network (MVCNN) [18]. The main improvement and optimization of the model are performed using Stochastic Gradient Descent (SGD) for convolution layers and convolution architecture models. The proposed system is particularly suitable for facilitating pilot applications for chronic type 2 diabetes (T2D). But it also manages another chronic disease that can be easily and effectively placed. In the balanced data distribution [19], DPM oversamples the technology Somtet Tomek Link (SMOTETomek) for a small number of syntheses including outlier-based detection methods to eliminate outlier’s predictive disease collection methods like Outlier (iForest). The presented objects were categorized using a pressure sensor based on a Support Vector Machine (SVM) algorithm [20], smart and low-cost gloves. Two capacitive pressure sensors are used which are manufactured from layers of copper foil and ethyl vinyl acetate (EVA).
It is shown in the (CNN) also known as Unified Convolutional Neural Network and the (M-bCNN) known as Matrix-based Convolutional Neural Network to meet this challenge, while standard feature selection algorithms are used as a relief [21] for minimum redundancy, maximum association, and minimum values. This system has been developed based on classification algorithms that include decision trees and reduce operator and community learning options to remove irrelevant, redundant features [22]. At the same time, a semi-teacher robust discriminant classification method based on linear discriminant analysis has been proposed to detect sample outliers and noise characteristics [23] using both labeled training and unlabeled experimental data. In this paper, a non-invasive method is to be described for detecting the early stages of diabetes based on three sets of features extracted namely non-proliferative diabetic retinopathy (NPDR) [24] and tongue images.
They created a semi-automated framework that uses a machine-learning algorithm to increase recall while reducing false positives. They suggested a methodology that uses engineering and machine learning to identify subjects with or without T2DM from EHR. To quantify individual performance measures, the following machine learning models are examined and compared: Random Forest, Nave Bayes, Logistic Regression, K-Nearest Neighbor, and Support Vector Machine. They took a random sample of 300 patient records from the EHR repository’s 23,281 diabetic patient data [25,26]. They utilised two techniques to test for null hypotheses: Mann-Whitney (with a 0.05 p-level) and Kolmogorov-Smirnov (with a 0.05 p-level) (With p-level adhered to 0.05). They used a 0.05 threshold of significance and six classification algorithms: Hoeffding Tree, Random Forest, JRip, Multilayer Perceptron (deep learning algorithm), Bayes Network, and Multilayer Perceptron (deep learning algorithm). Precision, recall, F-measure, and ROC area were the metrics utilized to evaluate the results [27,28].
The implementation of gating mechanisms through Recurrent Neural Networks and their sophisticated units has emerged as powerful techniques for Diabetes Data Prediction.
The above-proposed method block diagram represented in Fig. 1 portrays the ensemble learning-based CGRNN. The task of processing the sequential data has been entrusted to the developed Meta Model. It comprises neural networks with feed-forward attributes possessing cyclic connections. The complete input history present in the entire network has been mapped by it for the prediction of every single output by maximizing the advantage of the temporal relationships existing between the data at every single instance of time.
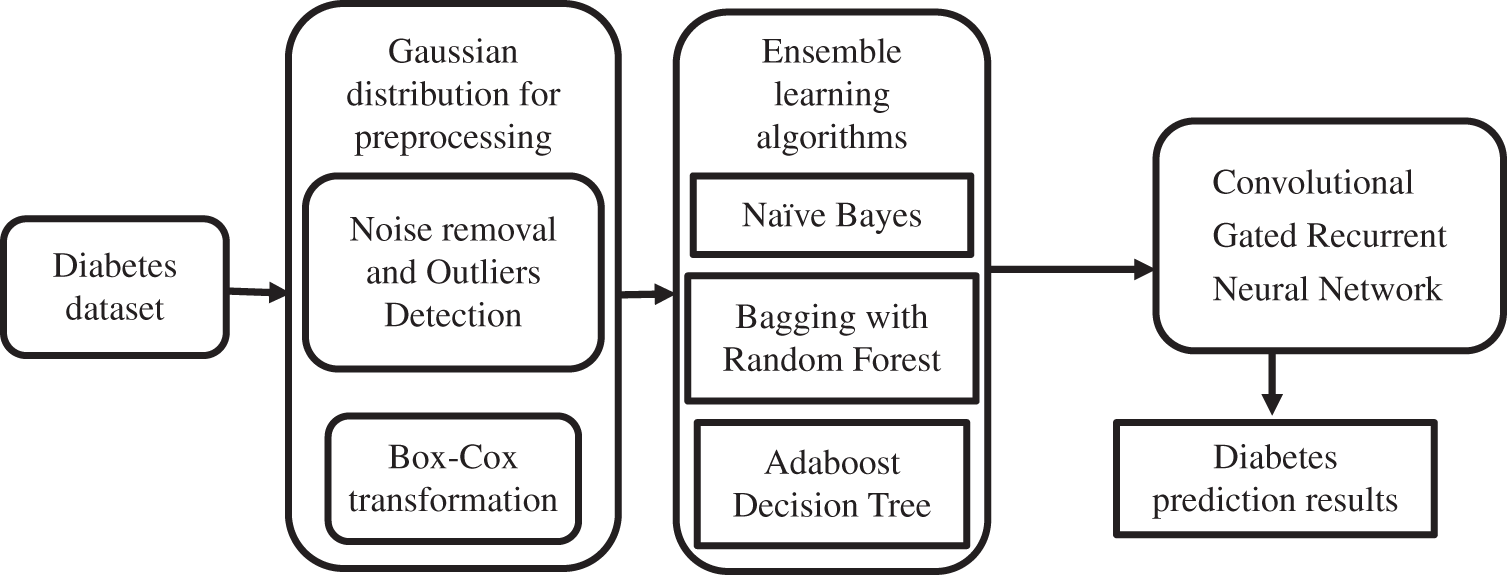
Figure 1: Working flow diagram of the proposed method
3.1 Pre-processing Using Gaussian Distribution
The method involved here is the Box-Cox technique. Based on this, the matrix sets which are dependent upon the surrounding subset feature value are created. This method involves the Box-Cox technique, the purpose is to construct the matrix sets which are derived from the feature values of the surrounding subset. It gives an estimation of what could be the maximum likelihood value for every matrix for efficient normalization of the data.
1. Calculation of lambda by using maximum likelihood estimation.
2. The normalization of data using a Box-Cox transformation
Let’s assume the λ optimal value selected which varies from −5 to 5, xi is transformed data, and Pd represents preprocessed dataset. In order to perform the initial most check to know if the outliers exist, the check is conducted in these two variables. There is a necessity for modification of some variables that are anomalous and then with the help of Box-Cox, convert them to attain normal distribution through Eq. (1). The dependence of the value of λ lies on the factors such as the shape of the best normal distribution curve generated by considering the data points which have been transformed.
Calculate the maximum likelihood of the Gaussian Probability Density Function with different mean and standard deviation values.
Normalization of data through calculation of its z-score as mentioned below:
Z score can be calculated using Eq. (1), where x is the observed value,
to find the mean values, let’s assume n refers to the number of data points.
where
The amount of data required for the process of normalization is considerably less when compared with quantification. It is the expected error pertaining to prediction to be in coherence with the mean of 0,1 and the confidence interval. The calculation process with respect to the Variables’ mean is dependent on assumptions for example normal distribution: as represented in Fig. 2.
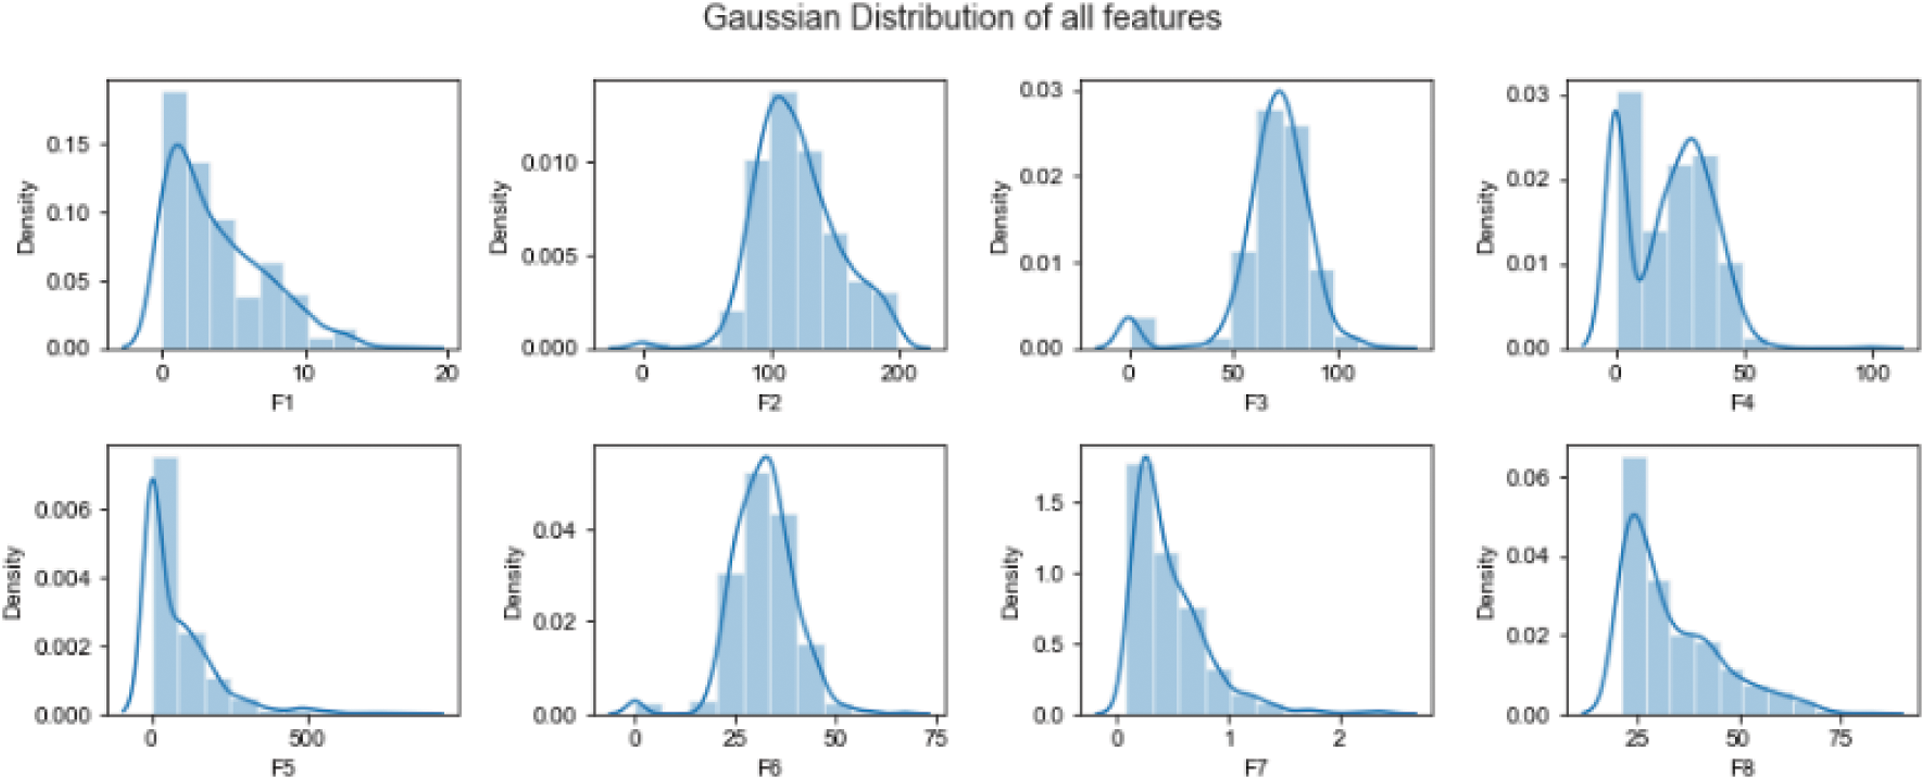
Figure 2: Data normalization using Gaussian distribution
The Bayesian classification is based on Bayes’ theorem. These Naïve Bayesian Classification algorithms characterize simple bases comparable to the classification of end trees and selected networks when used in a large database. Naive Bayes classification allows representation between a subset of dependent attributes. In this method, the posterior probability
where the
3.3 Bagging with Random Forest
Bagging stands for bootstrap aggregation; it combines multiple learner’s methods for decreasing the variance of the estimates. For example, the Random Forest Decision Tree, can train different random M subsets of data on different trees and vote for final predictions. To use this methodology, we must first develop numerous models on the data sets using the Bootstrap sampling method. A Bootstrap sampling approach, on the other hand, involves the creation of enormous training sets from the original datasets. The number of training sets (N) and original datasets (M) are equal in the count. The training set is made up of random subsamples of the main dataset that might comprise duplicate entries or be missing certain records. The test dataset will be the original dataset. It can train M different trees on different subsets of the data for classification which is expressed in the following equation.
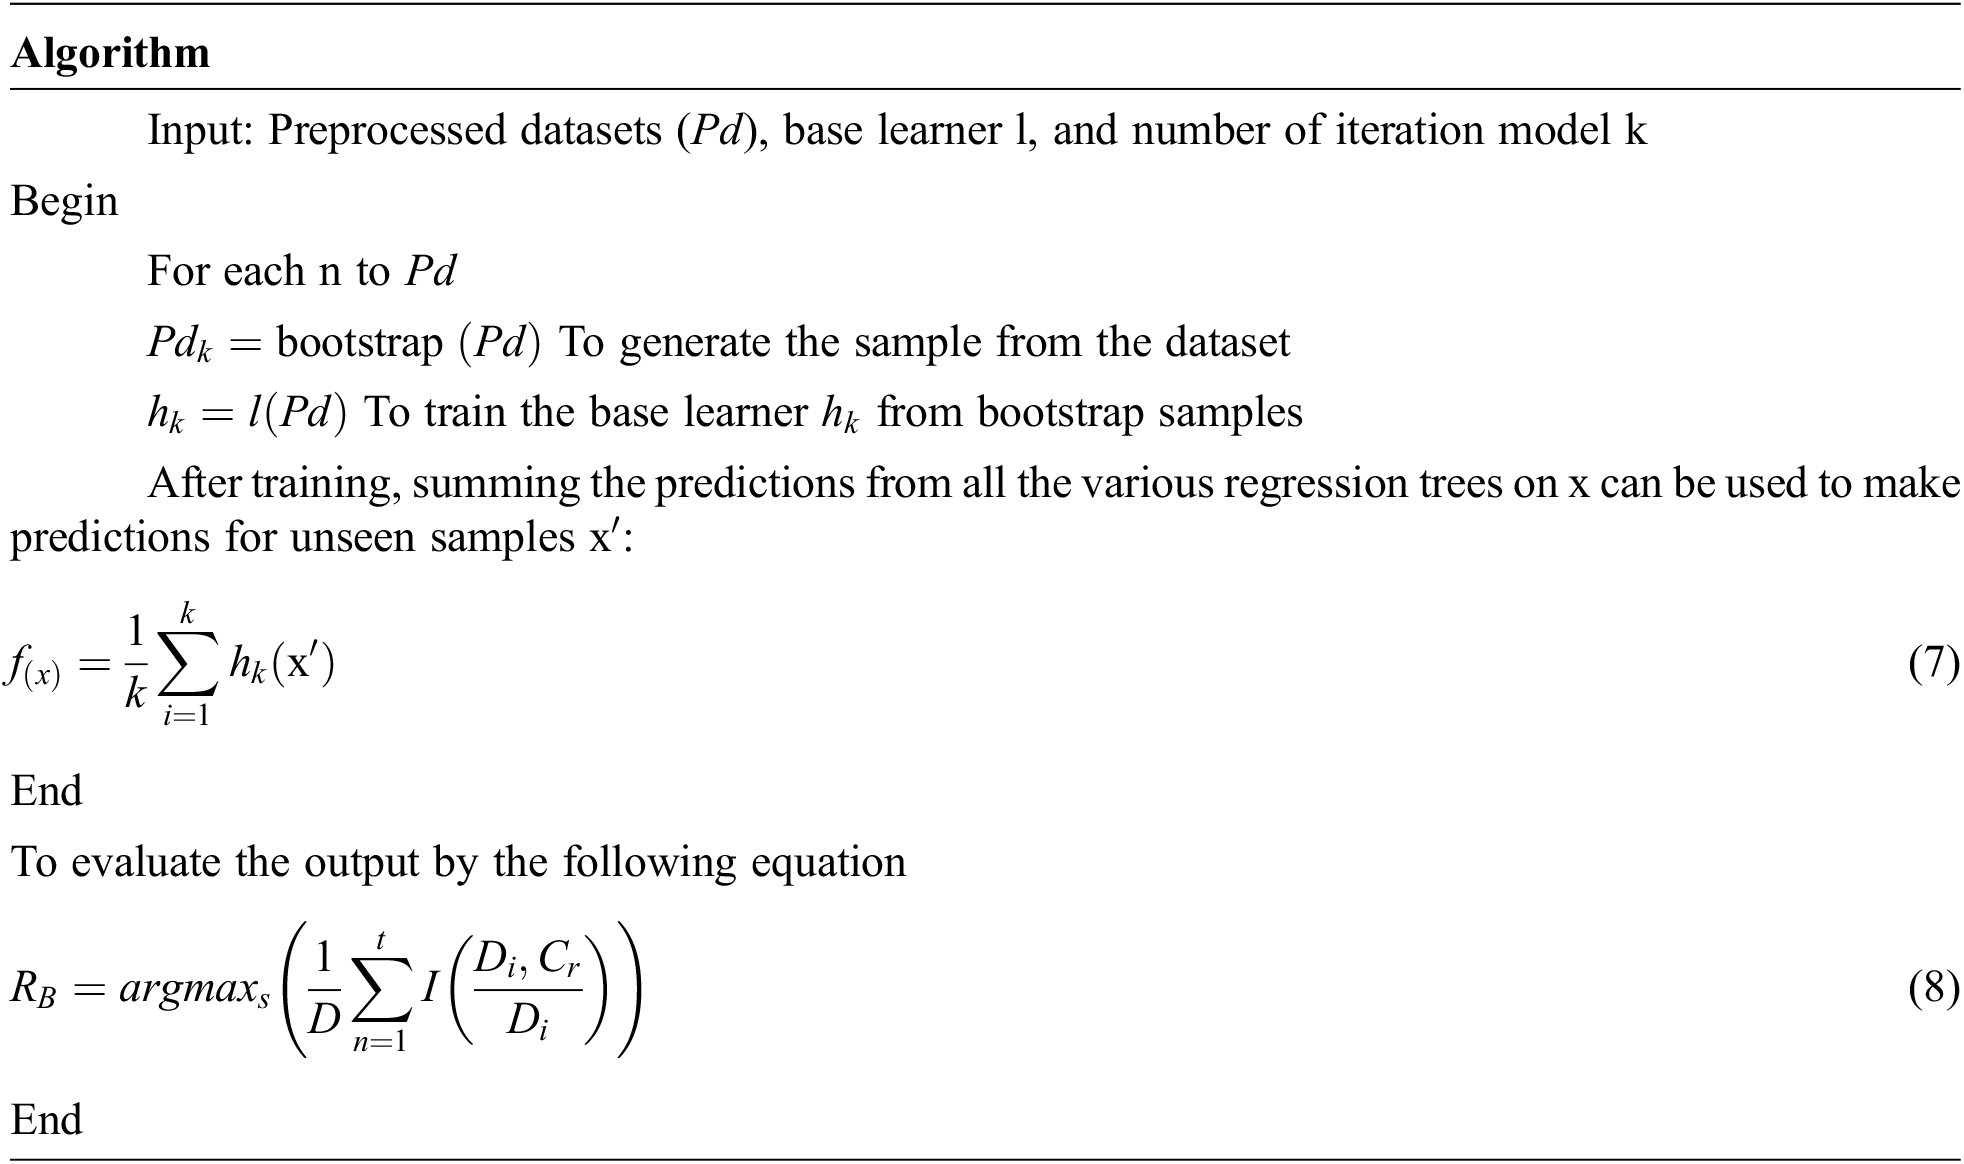
where
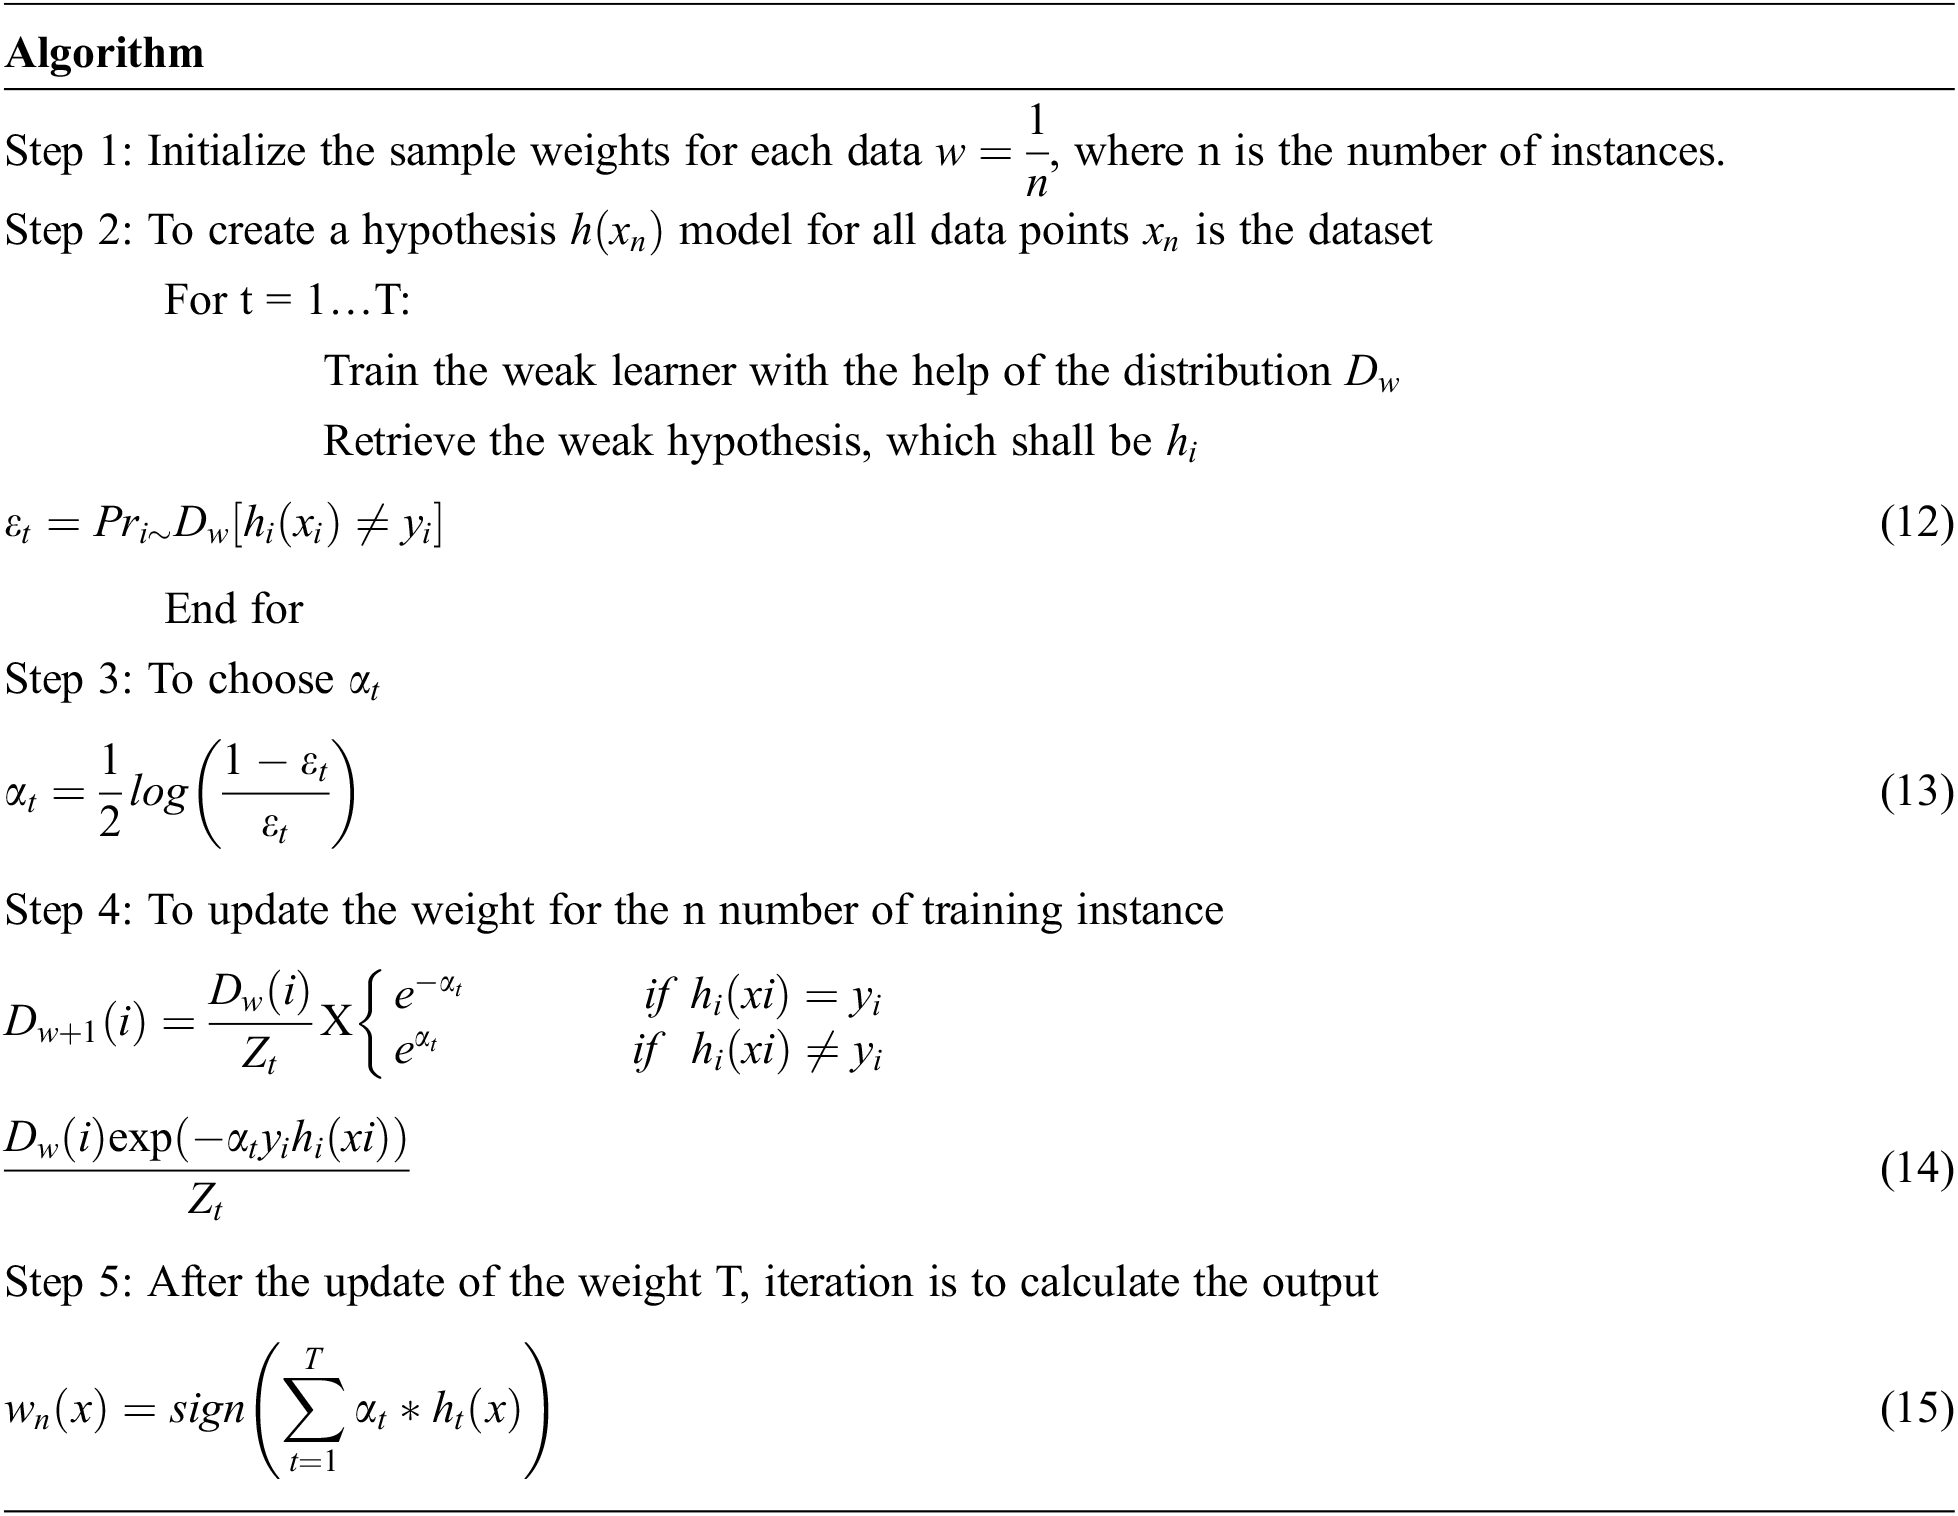
3.4 Adaboost Decision Tree (ADT)
The chief distinguishing factor that separates AdaBoost from Bagging is that in bagging, trees, all the iterations involve the generation of trees, and the tree with the most votes is deemed the best-performed tree, but in Adaboost, trees are created based on previous incorrect classification errors.
While constructing the next model, each model learns from the flaws or mistakes made in the prior model and corrects them as shown in Fig. 3. Bagging builds trees in parallel, whereas Adaboost builds trees in a sequential fashion. The most fascinating and widely used machine learning method is the decision tree, which functions similarly to the human brain. N samples from the dataset, target variable Y = 1, −1, and R covariates are used by Adaboost for the decision tree method. To discover the misclassified mistake, assign weights to each row as 1/N and train the classifier.
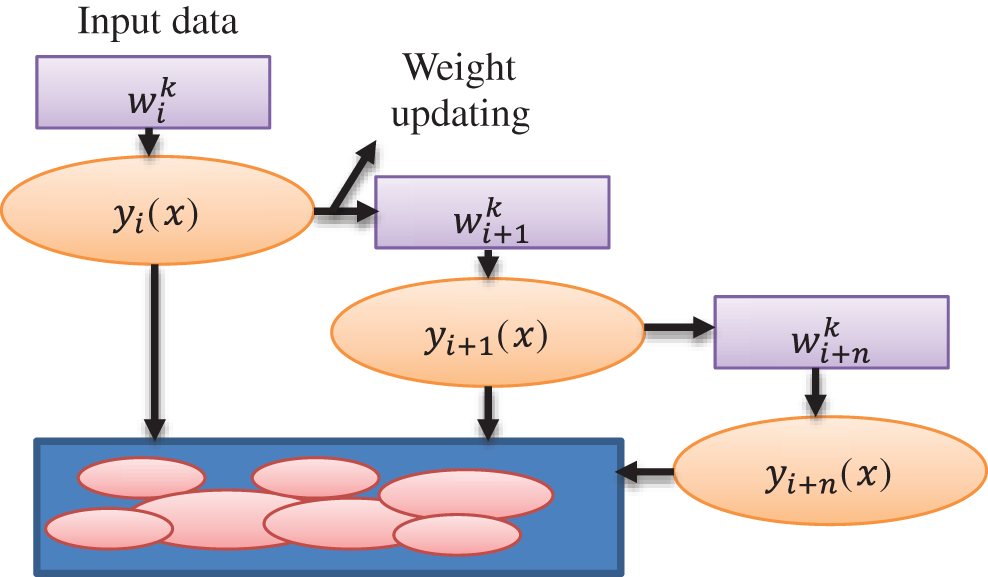
Figure 3: Weight updating flow diagram for Adaboost
where wi is the weight matrix, N is the sample size, and yi is the target variable.
The weighted error E in the previous question has been self-normalized by us, and it now lies between 0 and 1.
Through this we can calculate the ‘importance of say’ with the help of the equation:
α is the importance of say, E is the weighted error
If this technique is further continued for n iterations, we will have n classifiers with weighted votes in the last iteration.
A weighted dataset is created when the weight of a single instance in the dataset is determined by the prior base classifier results for each of these occurrences. If they misclassify an instance, the weight of that instance will grow in subsequent models, but the weight will remain the same if the classification is right.
The final decision is achieved by weighted voting of the basic classification, determined by the model’s weight, which depends on the misjudgment rate.
If the model has higher classification accuracy, it gets low weight. If it has poor classification accuracy, it gets the highest weight.
where
The methodology for classifying type 1 diabetes mellitus using the same data set training and test data is followed by K10-cross-validation. The comparison of predictions is made by each tree with the actual labels in the training set. The tree training samples that correspond to this feature are categorized as the following trees in the forest. Let assume initial weights of
3.5 Meta Model Convolutional Gated Recurrent Neural Network
The recurrent neural network method is an approach that is mainly used for processing sequential data. The attribute involved in this approach is the neural networks which are feed-forward, possessing cyclic connections. The complete input history in the network has been mapped by it for the prediction of every single output by maximizing the advantage of temporal relationships between the data at every single instance of time.
The architecture diagram of a simple Convolutional Gated Recurrent Neural Network is shown in Fig. 4. Each node present in the above diagram corresponds to a specific layer of the whole network at each instance of time. It connects the input layer to the layer that lies hidden, and subsequently, the hidden layer is connected to the output layer. The two important hidden layers are used, one is Long-Short-Time Memory (LSTM) and another for Gated Recurrent Unit (GRU). PD is a diabetes pre-processed dataset, and it is given to the input layer. After that, the hidden layer calculates the weight of diabetes. Further, the output layer uses the softmax function to produce the diabetes prediction results.
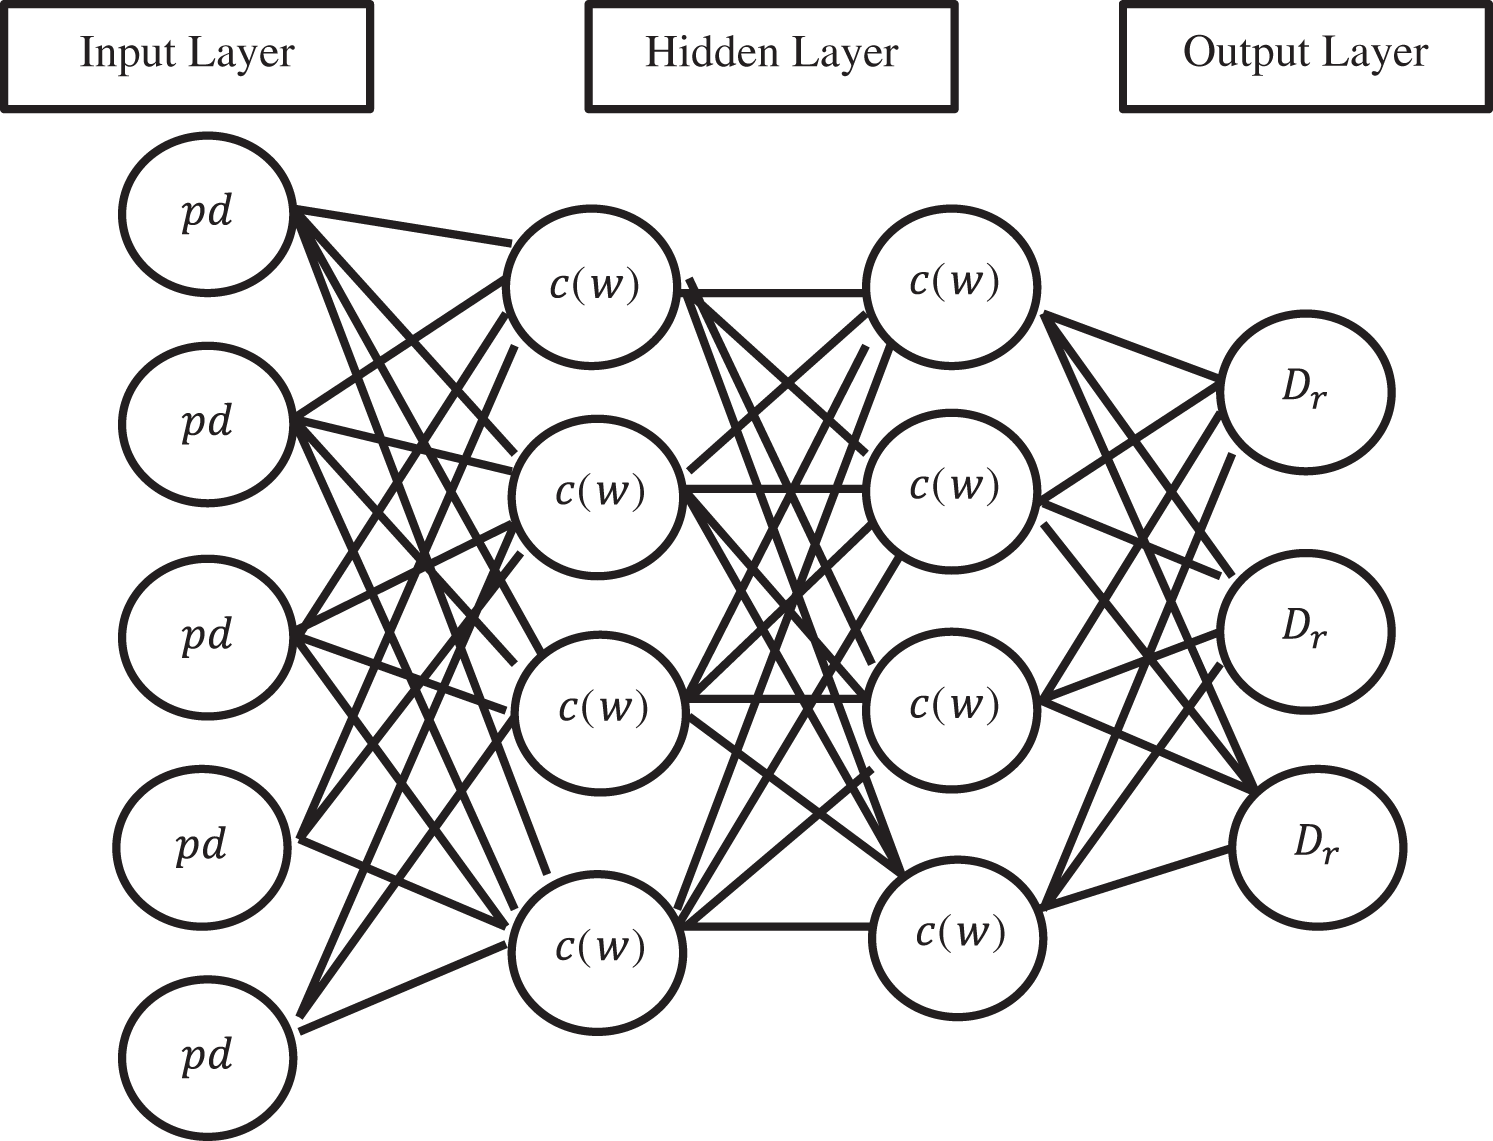
Figure 4: Convolutional gated recurrent neural network
The final weight matrix generated is then passed through a softmax function. The softmax function is given by
where
The CG_RNN is capable enough of handling the variable-length sequence as it comprises a hidden state of recurrent nature whose activation is dependent upon that of the previous time. The architecture of LSTM is shown in Fig. 5. The LSTM comprises three major gates namely: input, output, and forget gates.
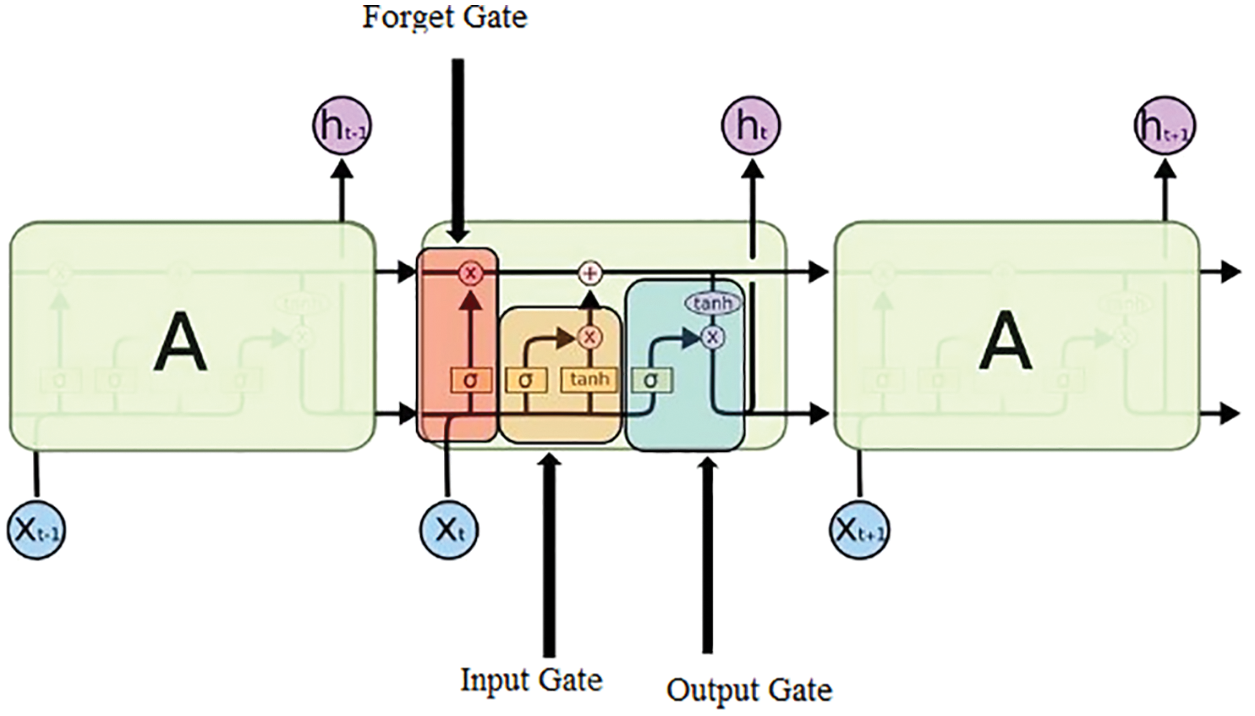
Figure 5: Structure of LSTM
Input gate: The purpose of this gate is to recognize which details are no longer needed to be kept in the block and are required to be discarded. The purpose of the Sigmoid function is to figure out which values are supposed to be let through 0 and 1. The tanh( ) function is used to provide the weightage to the values ranging from −1 to 1
value,
Forget Gate: The purpose of this gate is to determine the details that are required to be discarded and no longer kept in the block. It considers the previous state (ht−1) and the content input (Xt) and gives the output as the number either 0 which means omit this or 1 which means keep this for each number in the cell state Ct−1.
Output Gate: In this gate, the output is decided by the memory of the block and the input is given.
where
3.6 Type-1 Diabetes Data Prediction using Ensemble Learning Based CGRNN
An ensemble learning algorithm predicts a good machine learning model from multiple combinations to learn the best way. Meta models are predictive training created from sample data on the base model.
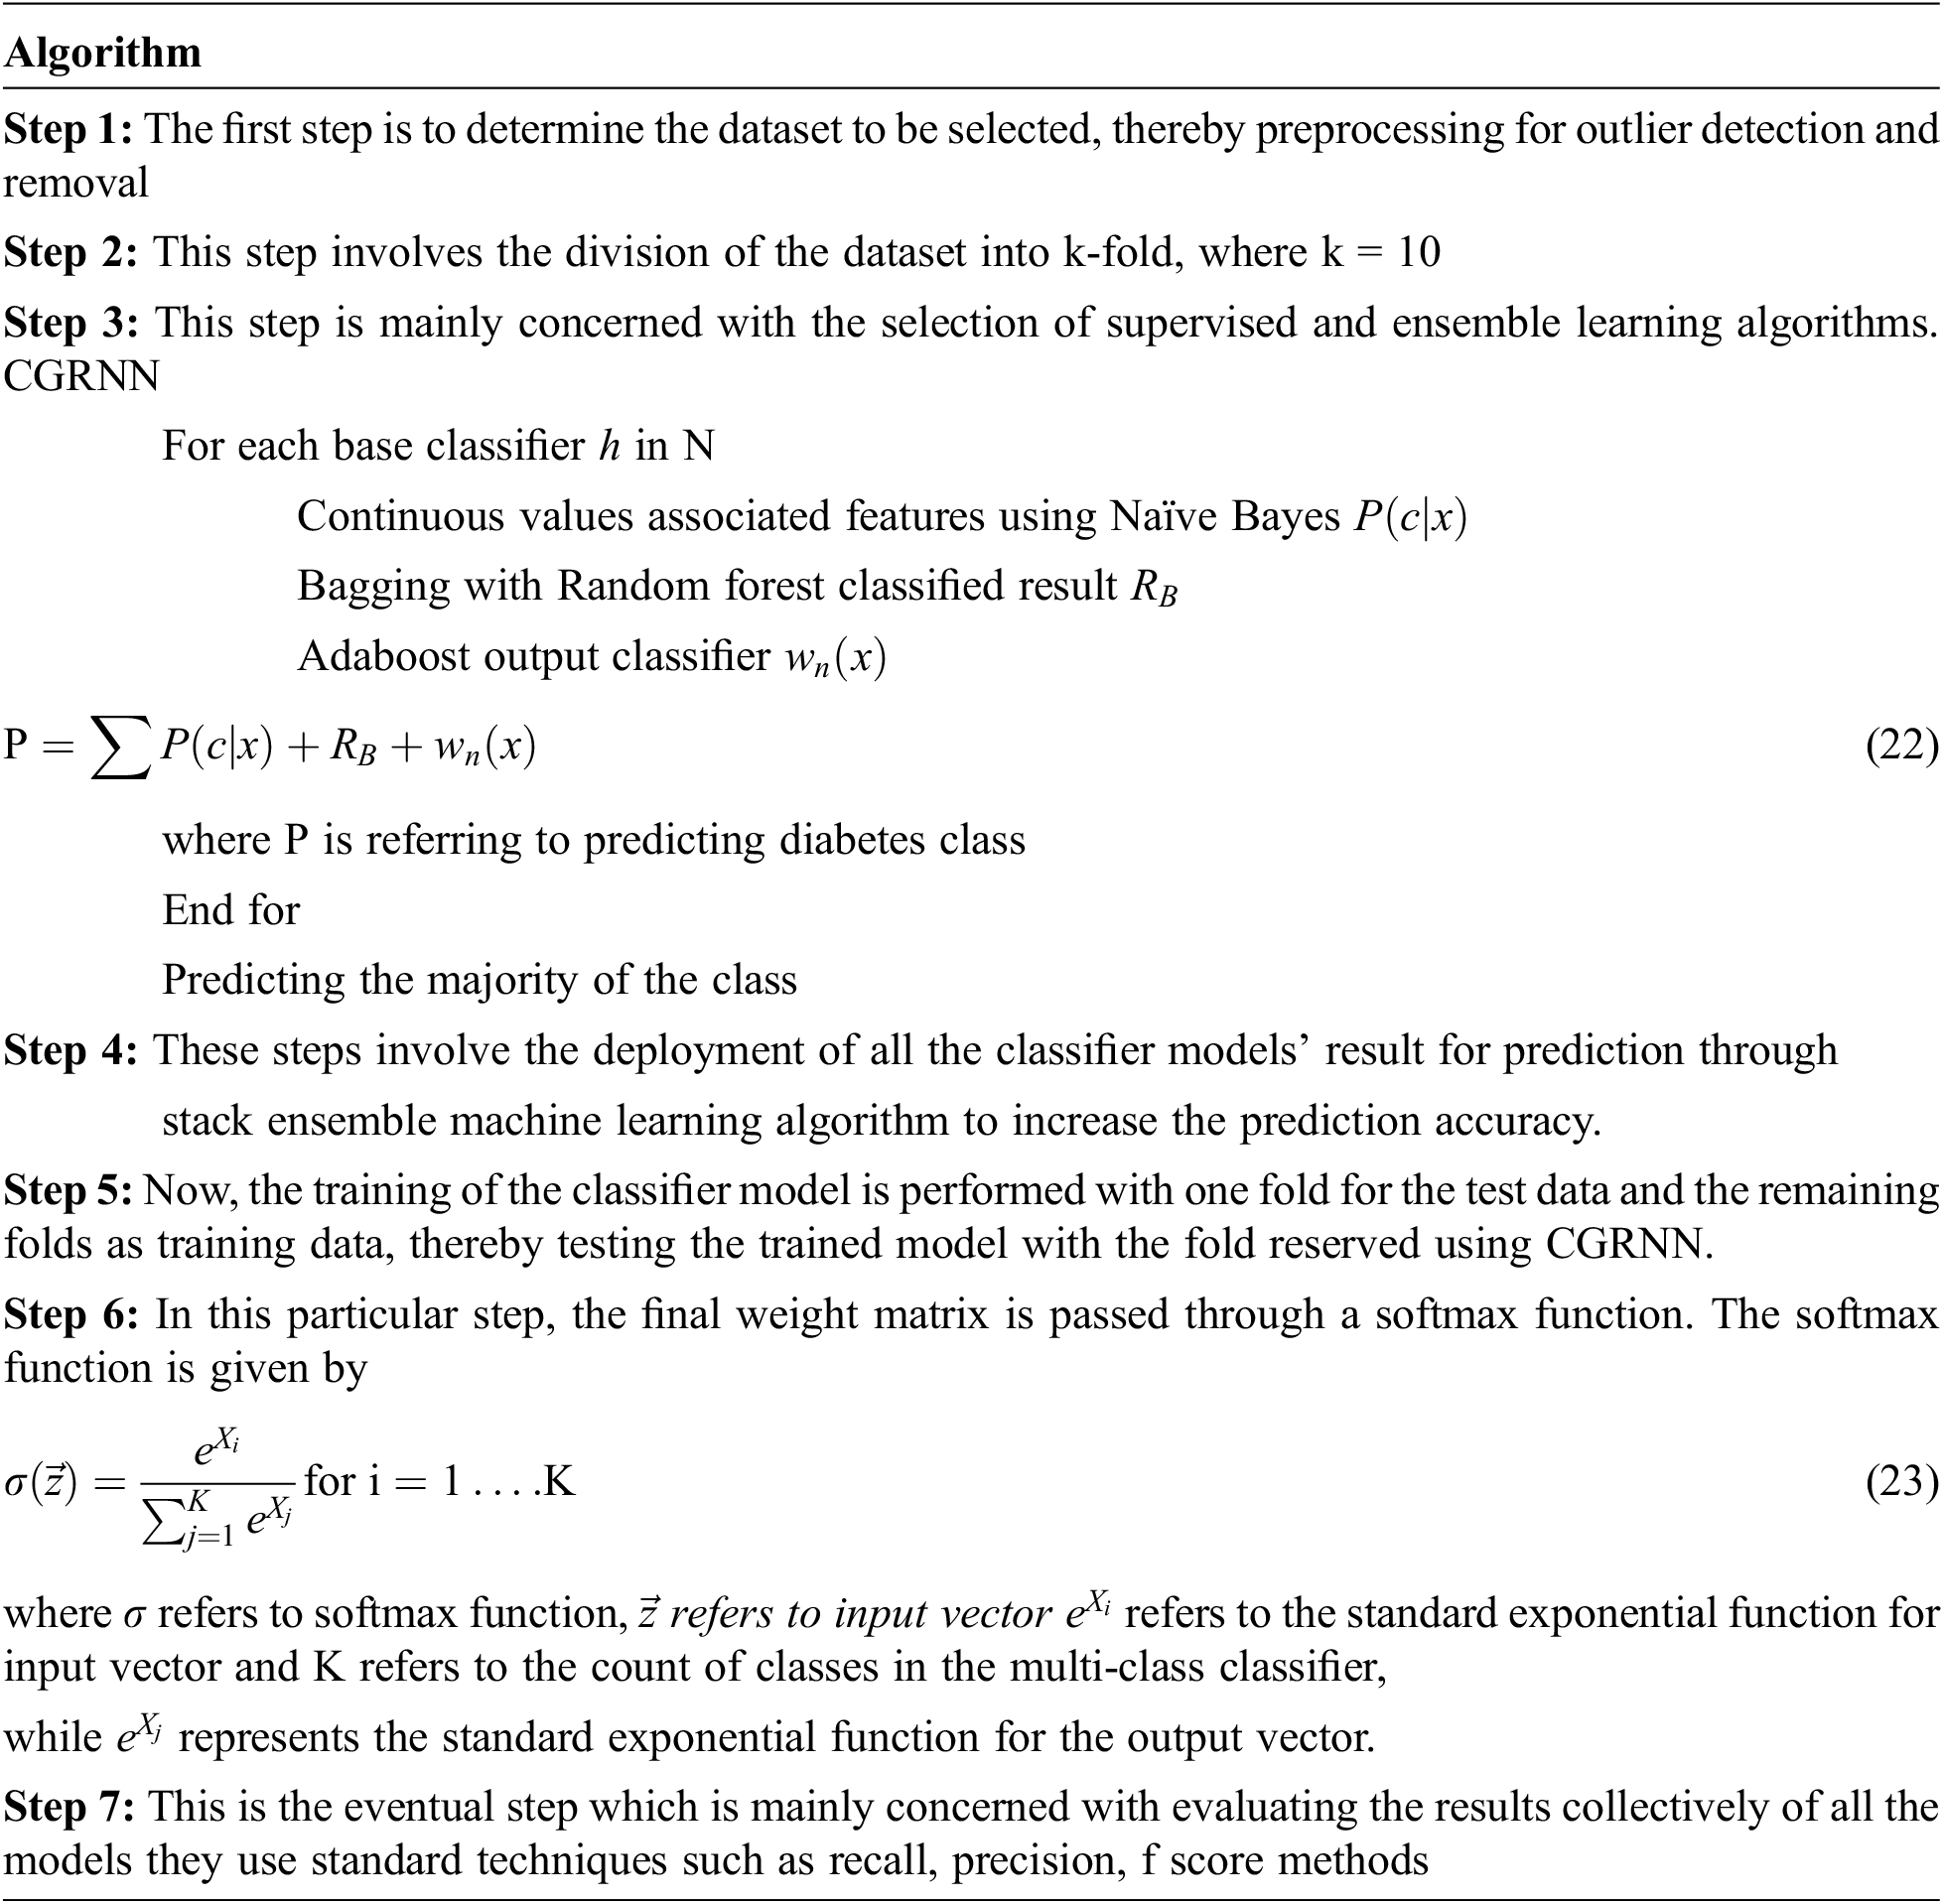
The data left unused (which hasn’t been used to train the basic model) is fed to the basic model. Predictions are made, and the training data is the expected output together for the set used to fit the Metamodel. These predictions have provided input and output pairs. Therefore, as compared with NB, RBF, and Adaboost decision tree-the proposed CG-RNN gives a better result.
We have used the Austin Public Health Diabetes database for classification and analysis. These data are Multivariate and Time-Series based Data sets from the UCI repository consisting of 10000 records of different people. The dataset consists of several medical predictors (independent variables), target (association) variables, and results. Independent variables include the patient’s BMI number, insulin level, age, etc. This analysis results have taken (A, B, C, D, and E) different ratios (85/15, 80/20, 75/25, 70/30, 60/40) of the training and testing dataset. Austin Public Health Diabetes dataset was taken for testing and training data set.
Fig. 6 shows the simulation result of training and testing loss of the proposed LSTM-based CG-RNN method. By using LSTM-based CG-RNN, the MSE value is 0.016.
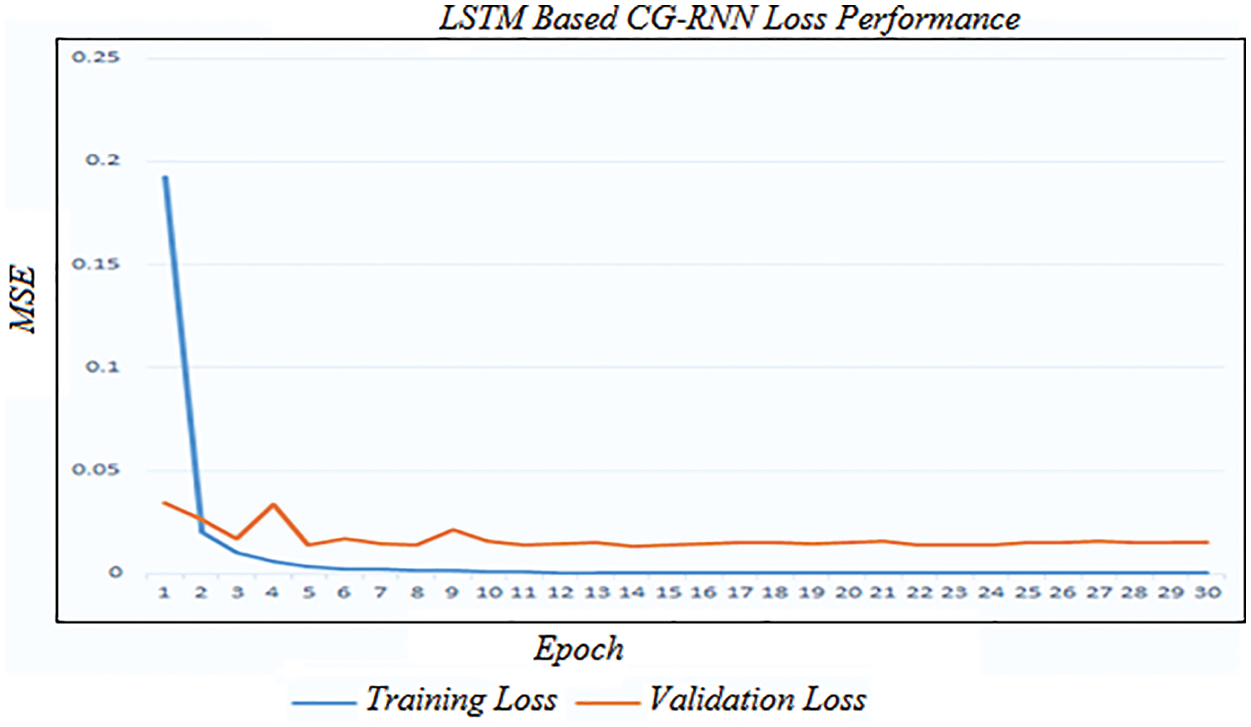
Figure 6: Training and validation loss of LSTM-based CG-RNN
Fig. 7 shows the LSTM-based CG-RNN simulation result of net loss and the predicted response for the test data.
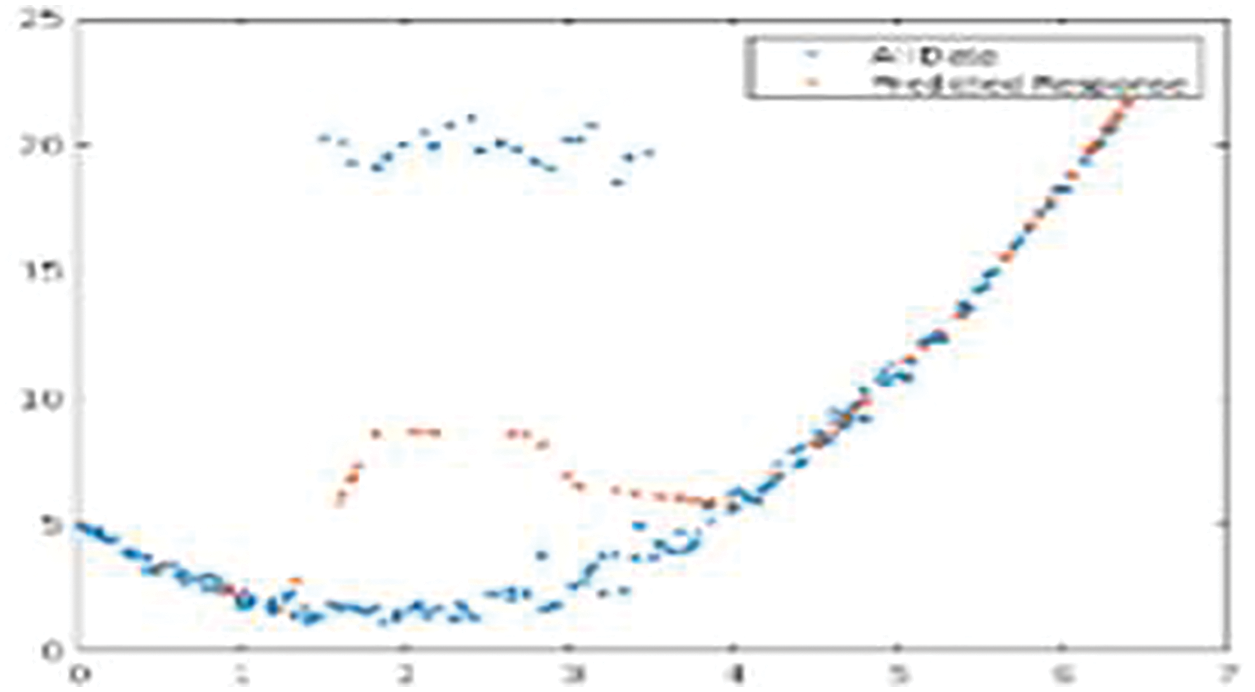
Figure 7: Net loss and the predicted response for the test data
The proposed Naive Bayes method has a 0.82% accuracy for 10-folds and 0.70% of f1-score, 0.68% of recall rate, and 0.72% Precision rate for 10-fold data validation. The result comparison is illustrated in Fig. 8. Moreover, Fig. 9 shows the bagging with Random Forest Model performance analysis of precision, recall, f1-score, and accuracy rate comparison. This result has taken several different k-fold datasets to evaluate the bagging with the Random Forest algorithm. First, the bagging model reduces the learning for multiple learners to modify the decision tree. So, this proposed model improves classification accuracy and performance.
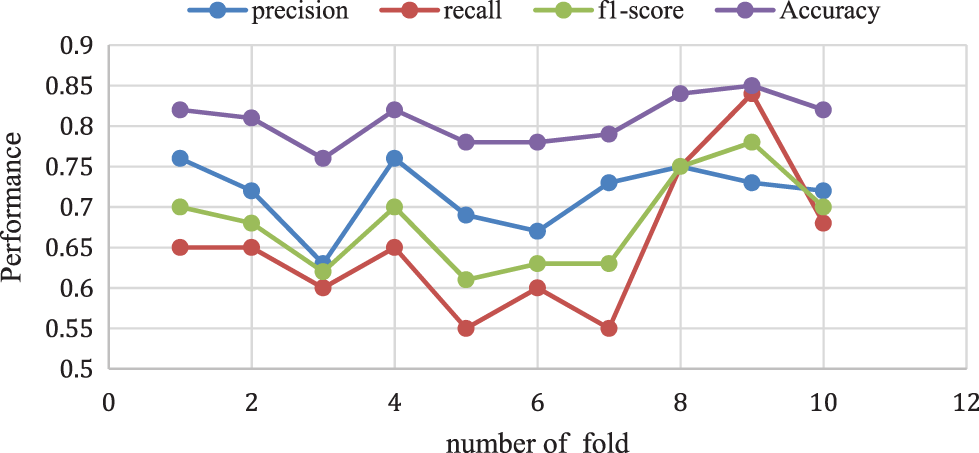
Figure 8: Naive Bayes performance vs. k-fold validation
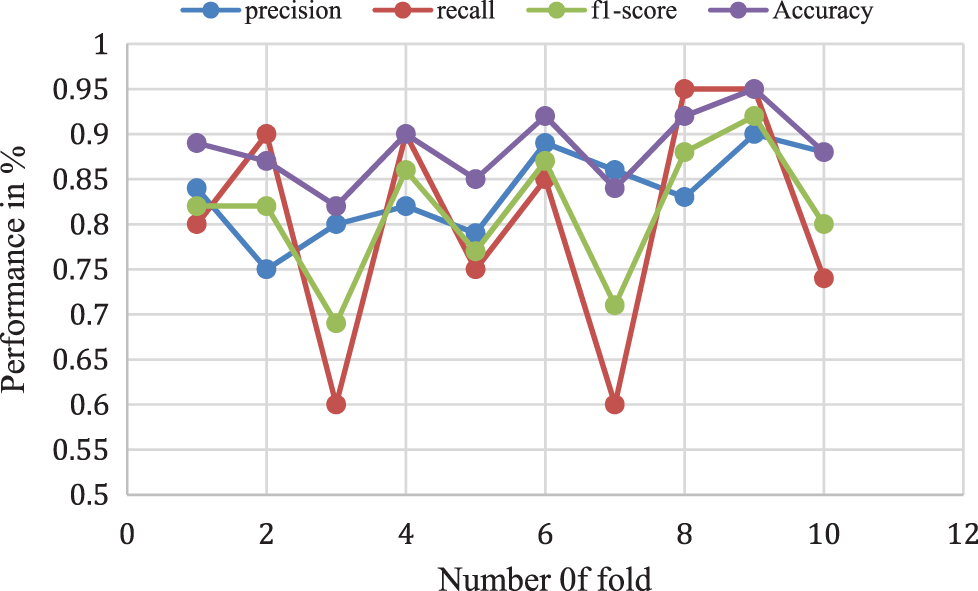
Figure 9: Bagging with random forest model performance analysis
The above analysis shows that the proposed Adaboost for the decision tree model provides a 0.87% accuracy for 10-folds and 0.78% of f1-score, 0.74% of recall rate, and a 0.82% Precision rate for 10-fold data validation. The different k-fold cross-validation of Adaboost for the decision tree method is shown in Fig. 10.
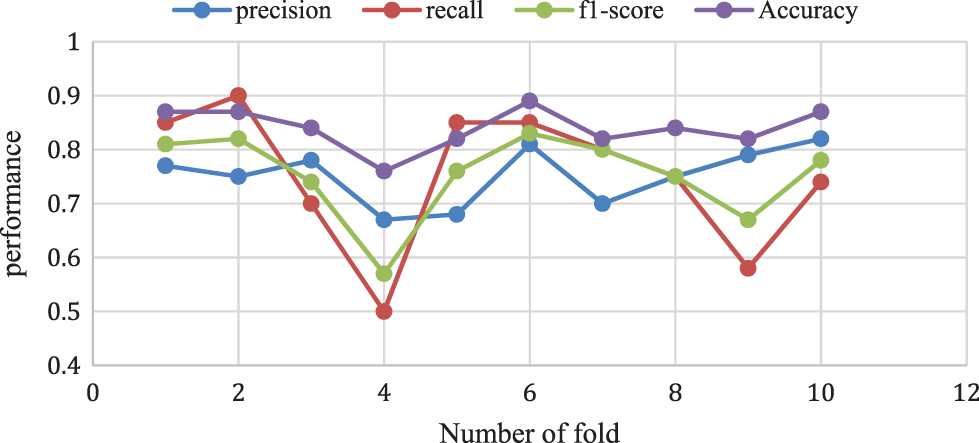
Figure 10: Adaboost for decision tree model performance analysis
Proposed method performance analysis is given in Tab. 1. and Tab. 2 shows the proposed method’s performance and existing methods’ average classification accuracy, precision, and recall comparison.
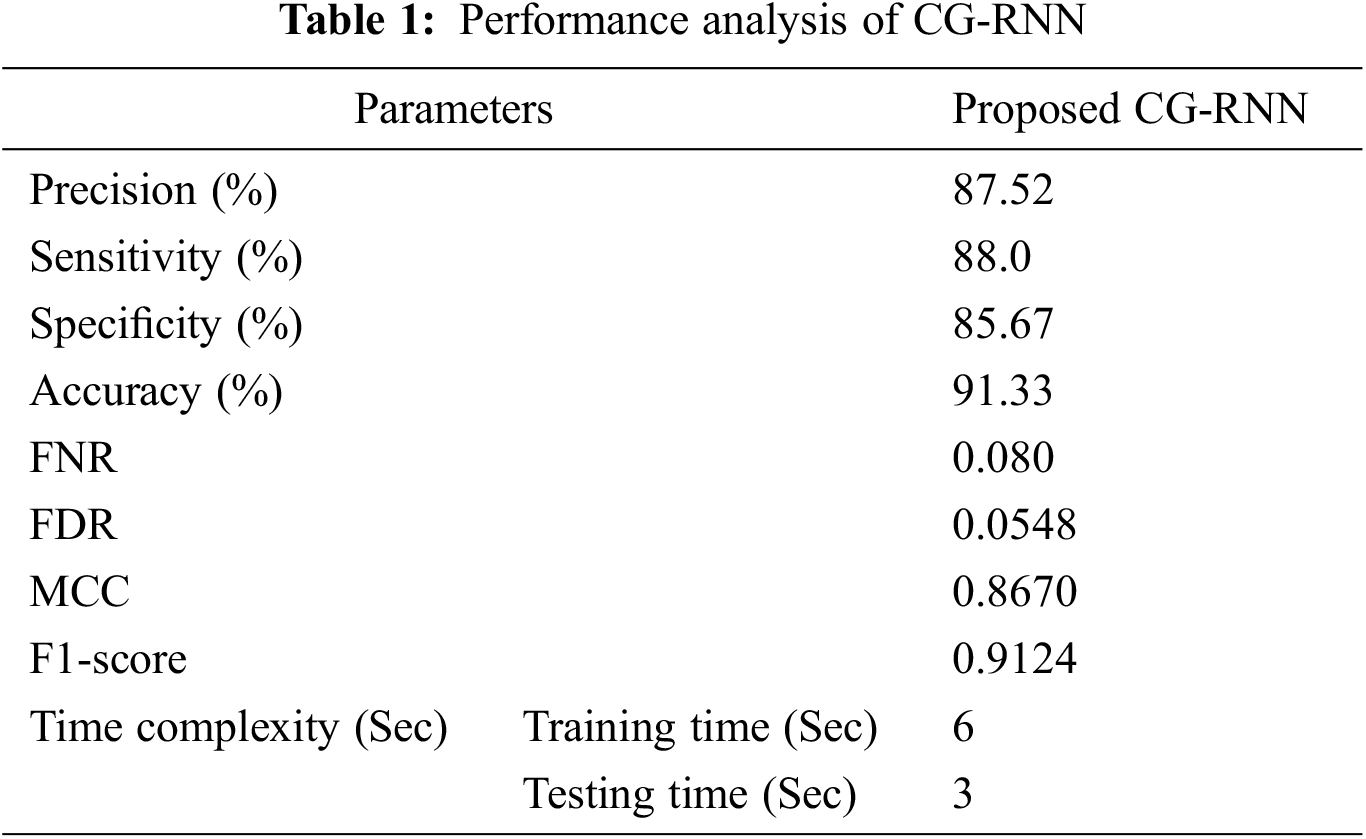
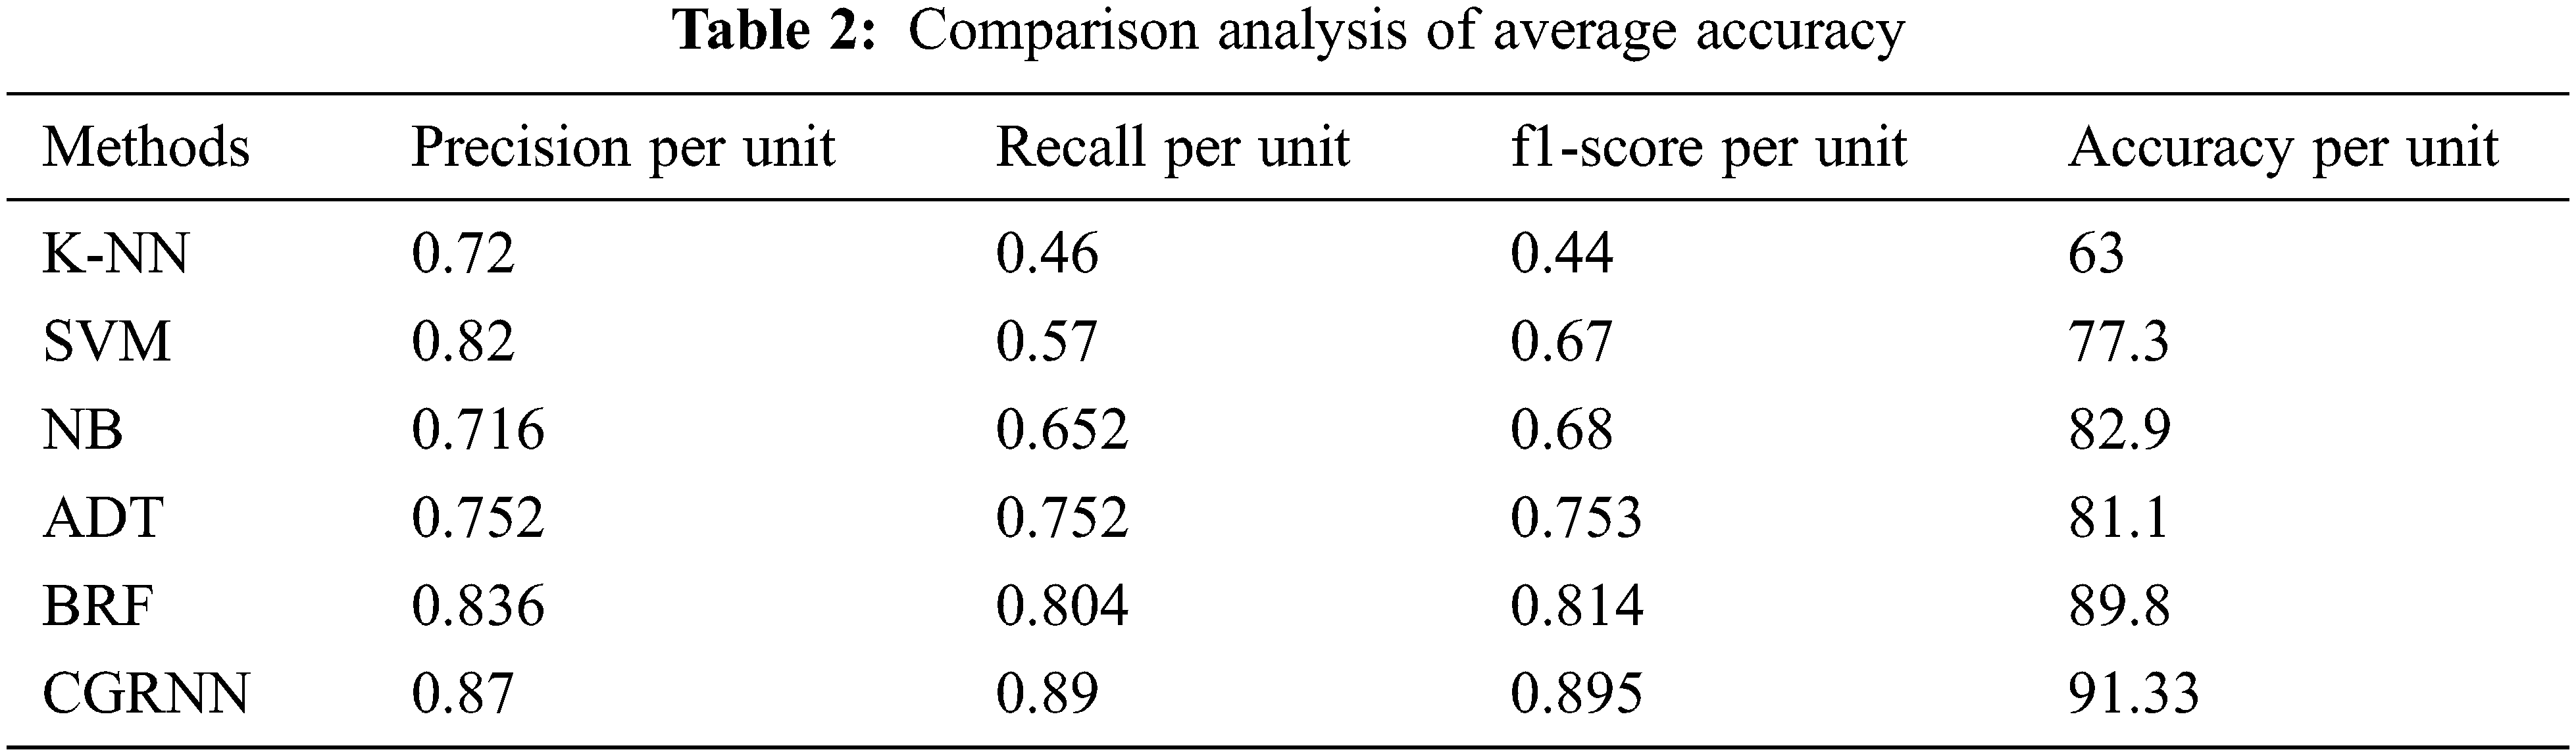
Fig. 11 presents the overall average performance of precision, recall, f1-score, and accuracy rate comparison. This analysis result shows that the K-NN method has 63%, SVM method has 77.39% compared to the proposed classifier NB, BRF, and ADT methods which have 81.1%, 88.8%, 82.9% better classification accuracy.
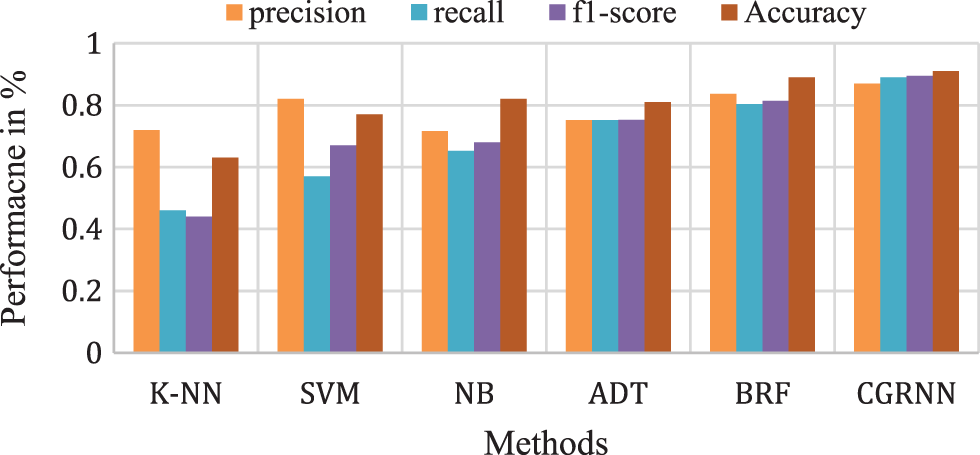
Figure 11: Comparison analysis of average accuracy
Type 1 diabetes mellitus (T1DM) is a serious and fast-growing health problem worldwide. T1DM is a long-term, progressive metabolic disorder primarily attributed to hyperglycemia due to inhibited secretion of insulin and insulin action resistance. The proposed CGRNN Meta model method predicts diabetes mellitus more accurately than other methods. Initially, the Gaussian distribution method is applied to perform outlier detection to remove outlier data. The preprocessing method involved here is majorly concerned with the evaluation of the standard deviation, and mean along with the likelihood values for every parameter for filling the missing value. The stacking ensemble machine learning algorithms like Naïve Bayes, Adaboost decision tree, and bagging with Random Forest are used for training and updating the weightage of the datasets concerning diabetes mellitus. The proposed CGRNN Meta model method analyzes the best classifier model based on the accuracy voting method for the accurate prediction of Type 1 diabetes mellitus (T1DM). The proposed NB methods’ overall classification accuracy is 81.2%, BRF provides 88.8%, ADT provides 82.9% and CGRNN produced better accuracy of 91.33%. The accuracy of the system can be further improved if the number of records is scaled up in the dataset.
Acknowledgement: The authors with a deep sense of gratitude would thank the supervisor for his guidance and constant support rendered during this research.
Funding Statement:The authors received no specific funding for this study.
Conflicts of Interest:The authors declare that they have no conflicts of interest to report regarding the present study.
References
1. M. Cracchiolo, J. F. Sacramento, A. Mazzoni and S. Micera, “Decoding neural metabolic markers from the carotid sinus nerve in a type 2 diabetes model,” IEEE Transactions on Neural Systems and Rehabilitation Engineering, vol. 27, no. 10, pp. 2034–2043, 2019. [Google Scholar]
2. M. Bernardini, L. Romeo, P. Misericordia and E. Frontoni, “Discovering the type 2 diabetes in electronic health records using the sparse balanced support vector machine,” IEEE Journal of Biomedical and Health Informatics, vol. 24, no. 1, pp. 235–246, 2020. [Google Scholar]
3. K. Zarkogianni, M. Athanasiou, A. C. Thanopoulou and K. S. Nikita, “Comparison of machine learning approaches toward assessing the risk of developing cardiovascular disease as a long-term diabetes complication,” IEEE Journal of Biomedical and Health Informatics, vol. 22, no. 5, pp. 1637–1647, 2018. [Google Scholar]
4. H. Syed and T. Khan, “Machine learning-based application for predicting risk of type 2 diabetes mellitus (t2dm) in Saudi Arabia: A retrospective cross-sectional study,” IEEE Access, vol. 8, pp. 199539–199561, 2020. [Google Scholar]
5. M. A. Moni, M. A. Moni, M. R. Rahman, M. R. Al-Mahfuz, A. M. Awal et al., “Network-based computational approach to identify delineating common cell pathways influencing type 2 diabetes and diseases of bone and joints,” IEEE Access, vol. 8, pp. 1486–1497, 2020. [Google Scholar]
6. M. Vettoretti, A. Facchinetti, G. Sparacino and C. Cobelli, “Type-1 diabetes patient decision simulator for in silico testing safety and effectiveness of insulin treatments,” IEEE Transactions on Biomedical Engineering, vol. 65, no. 6, pp. 1281–1290, 2018. [Google Scholar]
7. M. S. Islam, M. K. Qaraqe, S. B. Belhaouari and M. A. Abdul-Ghani, “Advanced techniques for predicting the future progression of type 2 diabetes,” IEEE Access, vol. 8, pp. 120537–120547, 2020. [Google Scholar]
8. M. H. Rahman, S. Peng, X. Hu, C. Chen, S. Uddin et al., “Bioinformatics methodologies to identify interactions between type 2 diabetes and neurological comorbidities,” IEEE Access, vol. 7, pp. 183948–183970, 2019. [Google Scholar]
9. P. Ni, J. Wang, P. Zhong, Y. Li, F. Wu et al., “Constructing disease similarity networks based on disease module theory,” IEEE/ACM Transactions on Computational Biology and Bioinformatics, vol. 17, no. 3, pp. 906–915, 2020. [Google Scholar]
10. T. D. Pham, “Texture classification and visualization of time series of gait dynamics in patients with neurodegenerative diseases,” IEEE Transactions on Neural Systems Rehabilitation Engineering, vol. 26, no. 1, pp. 188–196, 2018. [Google Scholar]
11. F. M. Ahsan, H. Khandoker, B. D. Hambly, E. Ng, M. Tamayo et al., “Methodological comparisons of heart rate variability analysis in patients with type 2 diabetes and angiotensin-converting enzyme polymorphism,” IEEE Journal of Biomedical and Health Informatics, vol. 20, no. 1, pp. 55–63, 2016. [Google Scholar]
12. D. Wen, P. Li, Y. Zhou, Y. Sun, J. Xu et al., “Feature classification method of resting-state eeg signals from amnestic mild cognitive impairment with type 2 diabetes mellitus based on multi-view convolutional neural network,” IEEE Transactions on Neural Systems and Rehabilitation Engineering, vol. 28, no. 8, pp. 1702–1709, 2020. [Google Scholar]
13. E. Frontoni, “A decision support system for diabetes chronic care models based on general practitioner engagement and EHR data sharing,” IEEE Journal of Translational Engineering in Health and Medicine, vol. 8, pp. 1–12, 2020. [Google Scholar]
14. N. L. Fitriyani, M. Syafrudin, G. Alfian and J. Rhee, “Development of disease prediction model based on ensemble learning approach for diabetes and hypertension,” IEEE Access, vol. 7, pp. 144777–144789, 2019. [Google Scholar]
15. L. I. R. Ruiz, W. Beccaro, B. G. P. Evaristo and F. J. Ramirez Fernandez, “Tactile sensing glove-based system for objects classification using support vector machine,” IEEE Latin America Transactions, vol. 16, no. 6, pp. 1658–1663, 2018. [Google Scholar]
16. Z. Lin, S. Mu, F. Huang, K. A. Mateen, M. Wang et al., “A unified matrix-based convolutional neural network for fine-grained image classification of wheat leaf diseases,” IEEE Access, vol. 7, pp. 11570–11590, 2019. [Google Scholar]
17. J. P. Li, A. U. Haq, S. U. Din, J. Khan, A. Khan et al., “Heart disease identification method using machine learning classification in e-healthcare,” IEEE Access, vol. 8, pp. 107562–107582, 2020. [Google Scholar]
18. E. Adeli, K. H. Thung, L. An, G. Wu, F. Shi et al., “Semi-supervised discriminative classification robust to sample-outliers and feature-noises,” IEEE Transactions Pattern Analysis and Machine Intelligence, vol. 41, no. 2, pp. 515–522, 2019. [Google Scholar]
19. A. N. Long and D. Jack, “Comorbidities of diabetes and hypertension: Mechanisms and approach to target organ protection,” The Journal of Clinical Hypertension, vol. 13, no. 4, pp. 244–251, 2016. [Google Scholar]
20. B. Kulshreshtha, A. Arpita and P. T. Rajesh, “Adolescent gynecomastia is associated with a high incidence of obesity, dysglycemia, and family background of diabetes mellitus,” Indian Journal of Endocrinology and Metabolism, vol. 21, no. 3, pp. 160–164, 2017. [Google Scholar]
21. R. Muc, A. Saracen and I. G. Liberek, “Associations of diabetic retinopathy with retinal neurodegeneration on the background of diabetes mellitus, overview of recent medical studies with an assessment of the impact on healthcare systems,” Open Med (Wars), vol. 13, no. 1, pp. 130–136, 2018. [Google Scholar]
22. J. Gu, Z. Wang, J. Kuen, L. Ma and A. Shahroudy, “Recent advances in convolutional neural networks,” Pattern Recognition, vol. 77, no. 11, pp. 354–377, 2018. [Google Scholar]
23. J. M. Marugán, S. Tabik and Y. Benhammou, “Deep learning in omics data analysis and precision medicine,” Journal of Computational Biology, vol. 21, 2019. [Google Scholar]
24. V. Sitnikova, T. Nosenko, R. Olekhnovich and M. Uspenskaya, “Multivariate analysis for diagnostic of type ii diabetes mellitus,” in IEEE-EMBS Conf. on Biomedical Engineering and Sciences (IECBES), Sarawak, Malaysia, pp. 642–646, 2018. [Google Scholar]
25. T. Shu, B. Zhang and Y. Tang, “Computer-assisted noninvasive diabetes mellitus detection system via facial key block analysis,” in Int. Conf. on Wavelet Analysis and Pattern Recognition (ICWAPR), Chengdu, pp. 101–106, 2018. [Google Scholar]
26. S. El-Sappagh, F. Ali, S. El-Masri, K. Kim, A. Ali et al., “Mobile health technologies for diabetes mellitus: Current state and future challenges,” IEEE Access, vol. 7, pp. 21917–21947, 2019. [Google Scholar]
27. A. Mahajan, S. Kumar and R. Bansal, “Diagnosis of diabetes mellitus using PCA and genetically optimized neural network,” in Int. Conf. on Computing, Communication and Automation (ICCCA), Greater Noida, pp. 334–338, 2017. [Google Scholar]
28. C. S.-Pierre, F. Prieto, V. Herskovic and M. Sepúlveda, “Team collaboration networks and multidisciplinarity in diabetes care: Implications for patient outcomes,” IEEE Journal of Biomedical and Health Informatics, vol. 24, no. 1, pp. 319–329, 2020. [Google Scholar]
Cite This Article
 Copyright © 2023 The Author(s). Published by Tech Science Press.
This work is licensed under a Creative Commons Attribution 4.0 International License , which permits unrestricted use, distribution, and reproduction in any medium, provided the original work is properly cited.
 Downloads
 Citation Tools