
 Submit a Paper
 Propose a Special lssue
 Open Access
ARTICLE

Hybrid Convolutional Neural Network for Plant Diseases Prediction
1 Department of Information Technology, Sri Sivasubramaniya Nadar College of Engineering, Chennai, 603110, India
2 Department of Statistics and Operations Research, College of Science, King Saud University, Riyadh, 11451, Saudi Arabia
3 Department of Mathematics, Faculty of Science, Mansoura University, Mansoura, 35516, Egypt
4 Department of Computational Mathematics, Science, and Engineering (CMSE), Michigan State University, East Lansing, MI, 48824, USA
* Corresponding Author: S. Poornima. Email:
Intelligent Automation & Soft Computing 2023, 36(2), 2393-2409. https://doi.org/10.32604/iasc.2023.024820
Received 01 November 2021; Accepted 11 January 2022; Issue published 05 January 2023
 View Full Text
 Download PDF
Abstract
Plant diseases prediction is the essential technique to prevent the yield loss and gain high production of agricultural products. The monitoring of plant health continuously and detecting the diseases is a significant for sustainable agriculture. Manual system to monitor the diseases in plant is time consuming and report a lot of errors. There is high demand for technology to detect the plant diseases automatically. Recently image processing approach and deep learning approach are highly invited in detection of plant diseases. The diseases like late blight, bacterial spots, spots on Septoria leaf and yellow leaf curved are widely found in plants. These are the main reasons to affects the plants life and yield. To identify the diseases earliest, our research presents the hybrid method by combining the region based convolutional neural network (RCNN) and region based fully convolutional networks (RFCN) for classifying the diseases. First the leaf images of plants are collected and preprocessed to remove noisy data in image. Further data normalization, augmentation and removal of background noises are done. The images are divided as testing and training, training images are fed as input to deep learning architecture. First, we identify the region of interest (RoI) by using selective search. In every region, feature of convolutional neural network (CNN) is extracted independently for further classification. The plants such as tomato, potato and bell pepper are taken for this experiment. The plant input image is analyzed and classify as healthy plant or unhealthy plant. If the image is detected as unhealthy, then type of diseases the plant is affected will be displayed. Our proposed technique achieves 98.5% of accuracy in predicting the plant diseases.Keywords
Identifying the plant diseases is based upon the appearance of plant leaves which play a essential task in agriculture land. Similarly automated prior detection of diseases in the plants will improve the yield in healthy manner and high quality [1]. In the cultivation of large quantity of crops, it’s too difficult to find the plant diseases by observing and visualize the affected leaf. Even though pathologist, agriculturist may also face these difficulties. If disease is identified, then continuous monitoring is done. In the remote areas there is no such facility to identify the disease. Also, preventing the disease by treatment is a challenging one. Farmers have to travel far to consult an expert of agriculturist or pathologist. It is a time-consuming job and expensive too [2–4]. Therefore, an automated intelligent system was needed for the recognizing and analyzing of diseases in the plant and guides the farmer in a proper profitable way.
To overcome these issues, many research works have been developed using machine learning (ML) and deep learning (DL) algorithms for classifying the healthy and unhealthy leaf image. These algorithms are implemented based on the concept of pre-processing work of enhancement of image, image segmentation, image features are extracted and implementing various classifiers [5]. Most widely used classifiers are support vector machine (SVM) [6], decision tree, K-nearest algorithm (KNN) [7], random forest techniques (RF) [8], naive Baye technique (NB), logistic regression strategy (LR), rule generation [9]. Similarly, deep-learning-based algorithms, CNN, RCNN are produces the promising techniques in the detection of diseases of plant diseases. Therefore, identifying plant disease using deep learning model is major contribution of this work [10]. In this research paper, we try to comprehensively respond the following research questions:
Q1: How does our novel proposed RCNN-RFCN algorithm outperforms, after comparing it with existing relevant model?
Q2: How far can feature extraction improve the efficiency in the detection of disease plant image?
Nowadays, Deep Learning algorithm produces better outcome in recent areas like speech and Image Recognition, Natural Language Processing, etc., The main advantage of using Convolutional Neural Network (CNN) in the field of d plant disease prediction got better and accurate results. And also, CNN is best for Object Recognition [11].
The major role of this research work is described as follows:
• To apply and implement the RCNN-RFCN algorithm to monitor the growth of the crop and detect the diseased part in the plant.
• To classify the plant disease type.
• To incorporate the global optimization strategy for enhancing the optimal solution.
• To modify the existing solution more efficiently for problem solving.
The article has been arranged as shown: Section 2 discusses about the review of existing techniques, Section 3 introduces detection of plant diseases using RCNN-RFCN, Section 4 discusses about the experimented outcome and Section 5 concludes the work with future scope.
To get good yield in the crop production, diseases are great threatened to the farmers. Due to bacterial, fungal and viral infection, diseases are formed in the plant. For the tomato plant, foliar disease are occurred by warm temperature or prolonged time of wetness [12,13]. Identifying plant diseases and detecting the pest are very important thing for the farmer. But it’s very difficult to do it manually. Intelligent machine vision is needed to achieve it. Machine vision is a technology that collecting the images from the plant village dataset and analysis it further by providing benefit to the agriculturist. By replacing the traditional method of agriculture, this machine vision based detecting plant diseases are used nowadays [14].
Machine Learning (ML) algorithm assists machines to interact with agriculturist and observed their necessities, take decision on behalf of human. For the past few years by using ML algorithms, we can classify the plant diseases and early detection of diseases. It helps agriculturist in the aspects of increasing productivity in the field of cultivation [15]. Many studies have shown that CNN’s work is better for images than many data processing techniques. The reason is that CNN’s automatically extract features without using a feature extraction algorithm explicitly. Wang et al. [16] used Deep learning based Convolutional Neural Network for identifying the severity of diseases. The comparison two workflow architectures like shallow network from scratch and transferring algorithms are done. Comparison output regulats the top layers in pre-trained deep learning network. They used transfer learning to build a powerful classification network.
Liu et al. [17] presents a novel deep learning based CNN method for detecting leaf disease of apple in an accurate way. Then automatically extracting the features from the unhealthy leaf and applying pipeline learning concept with prompt accuracy. For analysis the experimental it needs 13,689 unhealthy apple leaf images and doing the process by using image processing techniques like Principal component analysis (PCA) jittering, disturbance in the direction and light disturbance. A novel framework of Deep CNN based upon AlexNet model which removes the fully connected layers partially, add pooling layers, by introduce the GoogLeNet model. For optimizing the network by using Numerical Algorithm Group (NAG) algorithm identifying the disease of apple leaf in accurate form.
Amara et al. [18] proposed CNN technique for identifying and classify the diseases in the banana leaf. This model uses decision support tool and helps the farmers in detecting the disease of banana leaf by taking pictures of the leaf then this tool automatically detects the disease type.
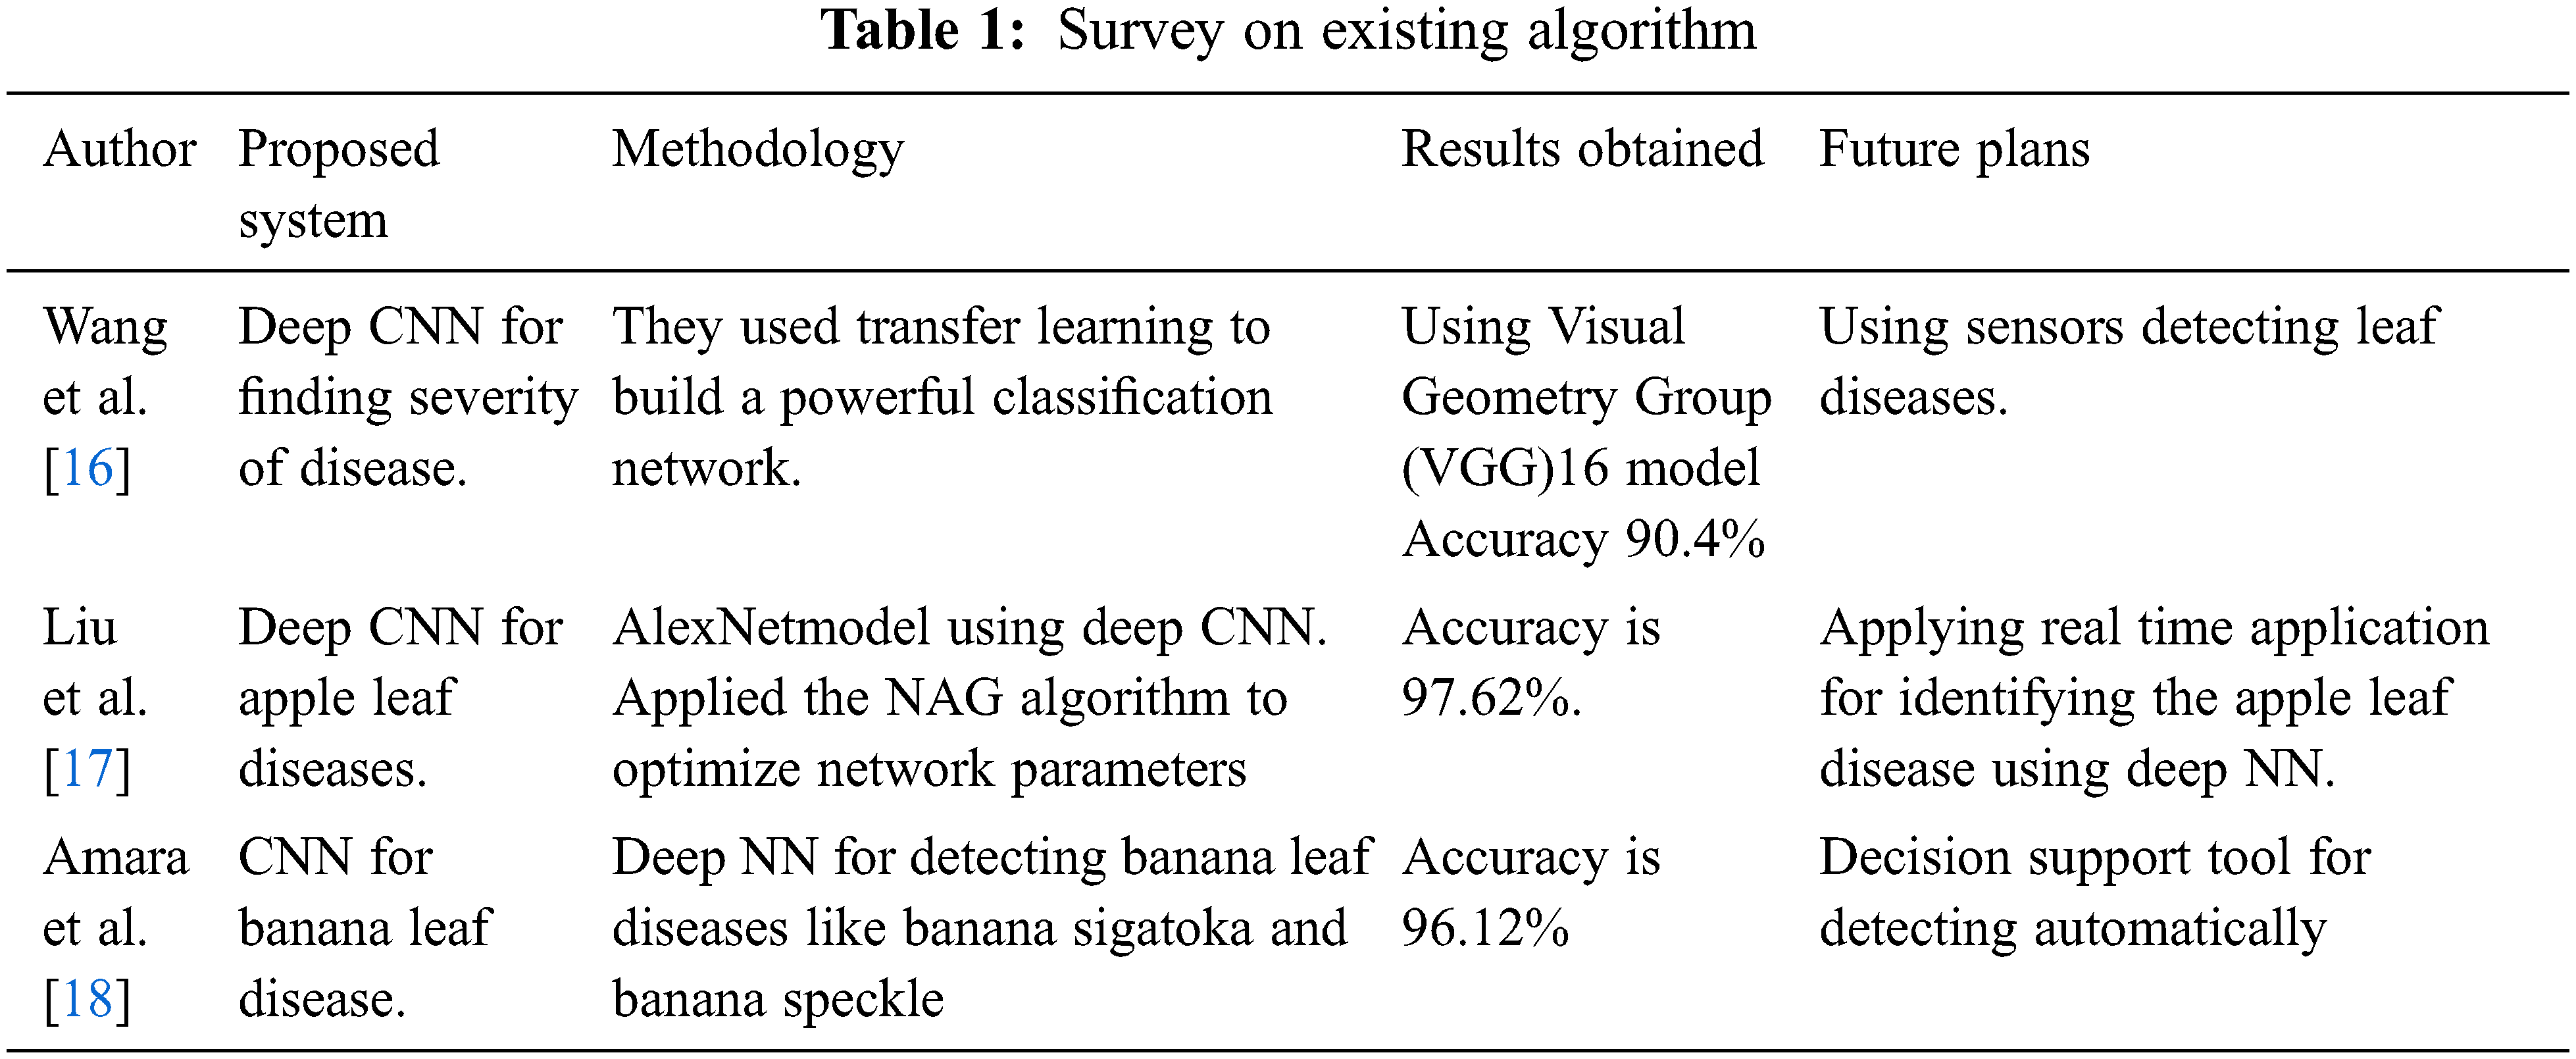
Infected part in the plant can be detected with help of color, and other changing properties by using classification algorithm discussed in strategy embraced in paper are Segmentation, Red Green Blue (RGB), Color transformation, Image acquisition, classification. Different pixel information is extracted from leaf image. Green leaves pixel and diseased leaf pixel are compared by finding the pixel ratio corresponding to the healthy leaf to the infected leaf pixel [19]. In [20] the author monitors the crop growth using the image segmentation techniques. Noise filtering is made, and features are extracted and then image is further classified to detect the diseased part. Strategies/Methodology embraced in paper are Dispersion method, Support Vector Machine (SVM), Self-sorting out element. Using picture segmentation techniques and ML techniques the information for ripening stages of the crop and infected part recognition is made. Tab. 1 shows the survey on detecting diseases of plant leaf using deep learning algorithm.
3 Proposed RCNN-RFCN Plant Diseases Detection Methodology
The timely identification and prevention of plant diseases at the early stage are essential thing for improving yield. This proposed work consists of following phases: pre-processing, Segmentation, Feature Extraction, and classifying of healthy leaf, unhealthy leaf. These phases are shown in Fig. 1.
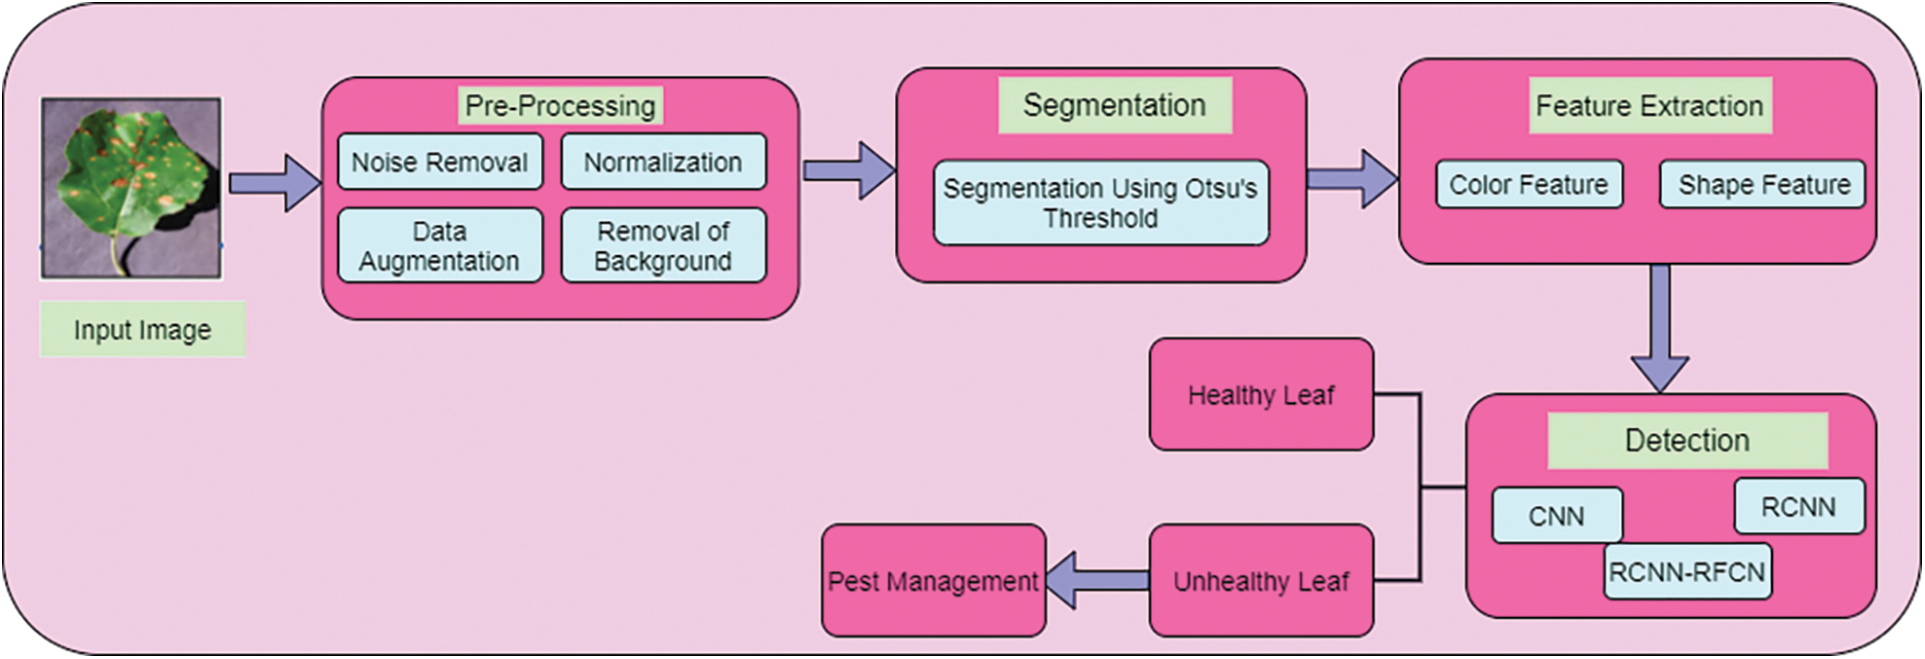
Figure 1: Architecture of proposed work
The Fig. 1 show that for the pre-processing work includes noise removal, normalization of the image, data augmentation and background removal of the input plant image. In the segmentation phase using Otsu’s threshold, extracting the features based on image colour and image texture and finally classification of the image as healthy and unhealthy leaf in the dataset.
In order to classify the healthy and unhealthy leaf accurately it undergoes to pre-process the phase. The pre-processing phase consists of four stages:
Stage 1: Noise Removal
Stage 2: Normalization
Stage 3: Data Augmentation
Stage 4: Removal of Background
To improve image quality, it has to delete the noise presents in image. In this work, the Wiener filter is applied. This filter helps to remove the blur, noisy and improves the smoothing of the image. It is based on the concept of statistical signal processing and minimize the mean square error between the original and restored signal of image. It can be represented by:
where,
To normalize the image this work implements the Z-score normalization
where,
To get better quality of detection of healthy and unhealthy leaf, the data augmentation is applied. It applied in both training and testing phases. In these work augmentation methods like scaling, rotation and translation is applied. The rotated images were in the angle between 5 to 20 degrees in counterclockwise and clockwise direction. Then scaling process is applied as shrinking or enlarging the image’s frame size and translation of image in both vertically and horizontally.
To enhancing the detection of unhealthy leaf image and reduce computation time, there is need of background removal in image. Removal of the background is done by using detection of the edge and clustering is based on pixels. For separating the background from leaf transforming from RGB image to HSV (Hue, Saturation and Value) color space.
The feature extraction from the leaf plant image is done using segmentation. It plays a vital role and segment the diseased portion of plant image. In this work for the segmentation of the diseased region is performed using Otsu’s algorithm. It is very simple and best algorithm by calculating the threshold value in the gray-level histogram. This algorithm is powerful technique for segmenting the object from the dark background. This Otsu’s threshold [21] operation converting the multilevel plant image into a binary image. That is dividing the pixels of image into different regions and by this way separating object from its background. Based on the threshold value, it is classified into two classes foreground class and background class. Threshold value determines about reducing intra class intensity-based variance by increasing inter class variance. The variance sum of two classes is represented by:
where, P0, P1 probability of two classes, n = 125 threshold value,
The probability of class can be computed using bin numbers (L = 256) with histogram and it is defined as:
Less intra-class variance is equal to More inter class variance and it is represented by:
where β0(n), β1(n), βthr(n) are class;
Histogram of plant image is calculated with 256 bins and threshold value of 125.
From the plant image segmentation, relevant features extraction plays a vital role for providing accurate detection of healthy and unhealthy plant image. Shape, color, and texture features classifies as healthy plant and unhealthy plant image.
The color feature of the leaf plant image is distinct from the healthy portion of the plant image, and it is similar to inter-class samples with intra-class samples. Extracting the features from the plant image based on color used color moments of standard deviation, mean, skewness and Kurtosis [22].
where, Pi,j denotes the ith component of color of the jth pixel value of a plant color image, N is the total pixels numbers in the image. In the moment color we evaluated four standard deviation features, mean, skewness and kurtosis for the three channels of RGB [23–35]. Therefore, for the color moment we calculated twelve features of the plant image.
From leaf image features are extracted by using gray level co-occurrence matrix (GLCM) which is represented by:
where, p(i, j, d, θ) is value of normalized matrix, N is the addition of all pixel value of leaf in matrix element, I and j are gray pixel values. To extract the texture feature of the plant image, four parameters are used. They are Angular second moment, correlation, contrast, and entropy. These parameters are defined as follows:
where,
The above four parameter is implemented, step by step pixel value with four different angles of 0o, 45o, 90o and 135o in segmented pixel elements helps to remove the green pixels.
For extracting the shape, features of the plant image using descriptor shape is used. The feature such as area of an object in numbers, object centroids, value of perimeter are important characteristics to describe the object shape.
In this phase, detection of leaf disease as healthy and unhealthy image from the dataset is done. This paper implements the classification algorithms of Convolutional Neural Network (CNN), Region-based Convolutional Neural Network (RCNN) with Genetic Algorithm (GA) for this detection.
3.4.1 Convolutional Neural Network (CNN)
CNN has a complex structure used to perform convolution operation for detecting the healthy and unhealthy leaf in the dataset. Fig. 2 show that structure of CNN.
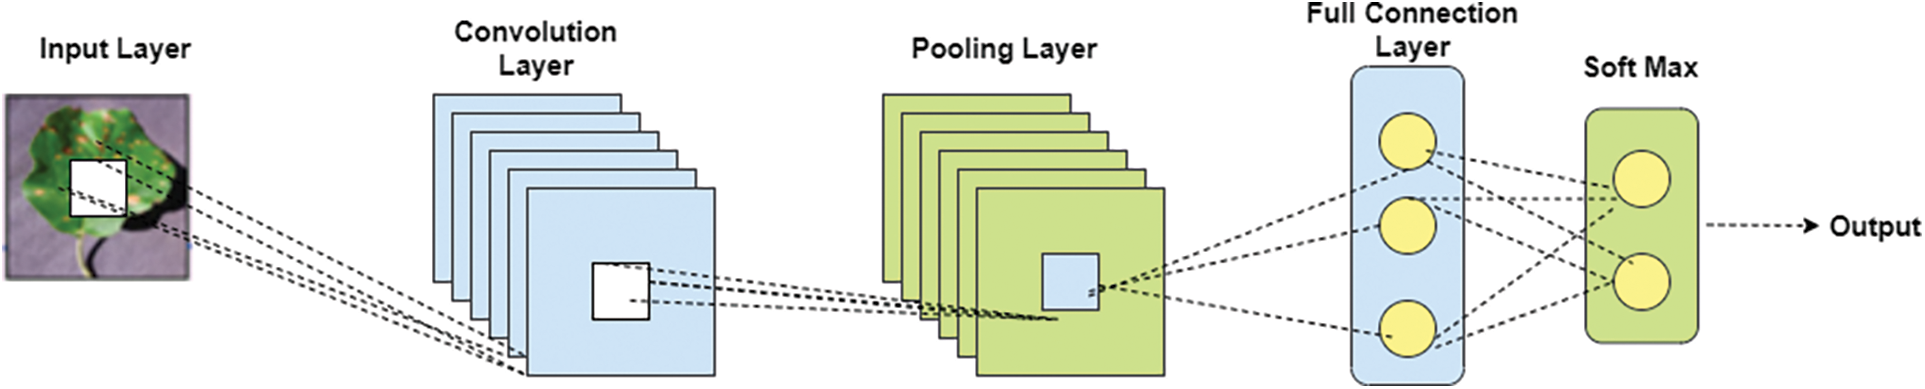
Figure 2: CNN architecture for classifying leaf image
Fig. 2 is consists of input part, convolution part, pooling parts, full connection parts, soft max and output section. Convolution layer neurons are connected with pooling layer neurons. Convolution core of convolution layer contains a local receptive field. When processing input data the slides of feature map on convolution core extract the relevant information of the feature. After this extraction in convolution section. The neurons at output are fed into pooling section as input for feature extraction. This process is repeated. Then the image is passed onto three more convolution layers each followed by a max pooling section. Finally size of the image is reduced to 7 × 7. The methods used in the pooling layer is maximum, mean and selecting random values of the local receptive field. Then this output neuron value is entered into of the fully connected neurons layer. Here neurons data are classified by soft max method and determines healthy and unhealthy leaf in the data set as output.
R-CNN stands for “Region-based Convolutional Neural Networks”. This includes two steps of processing. At first, identification of ROI (normal Return on Investment) by using the technique of selective search which detects the bounding-box object region. In the second step, extracting the features of CNN from every region of the image for classification. Fig. 3 show that architecture of RCNN.
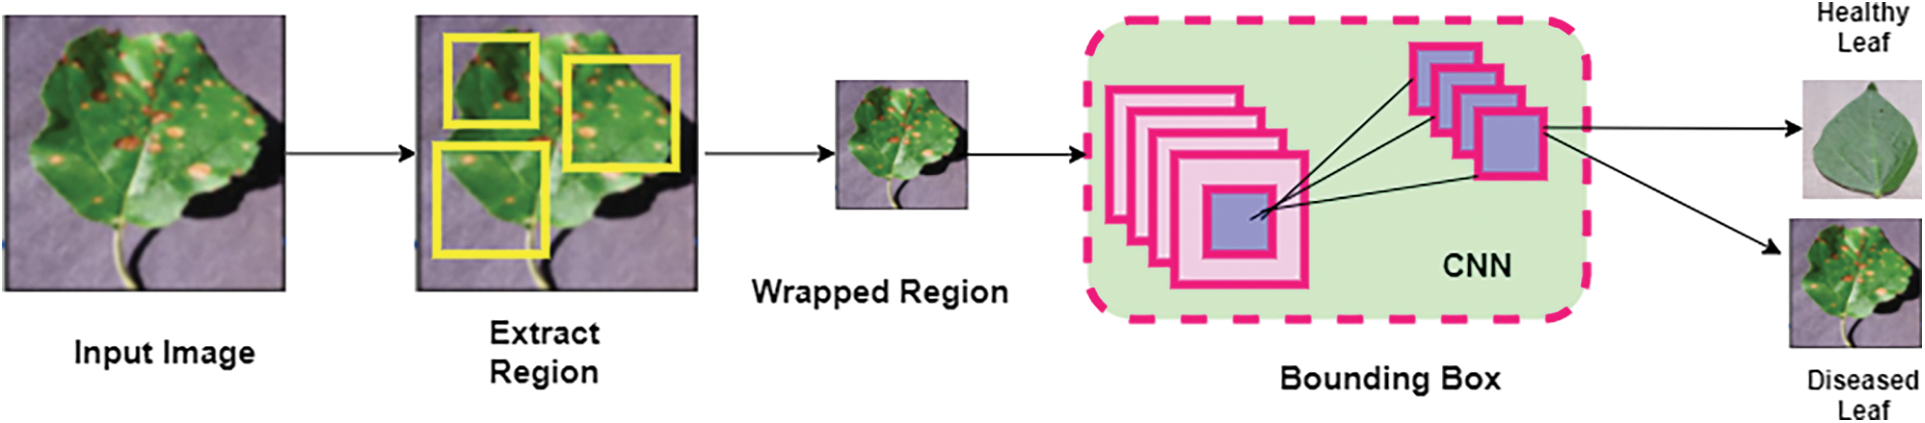
Figure 3: Architecture of RCNN
Summarization of R-CNN workflow:
1. For classifying the image using CNN network of VGG or ResNet which pre-train the dataset of ImageNet. This classification tasks includes N classes.
2. By using selective search algorithm classify the independent ROI which contains various size of target image objects.
3. For getting fixed size of the image using CNN and selected regions are warped.
4. To get fine tuning repeatedly apply CNN technique on warped to image regions of K + 1 classes. In this stage use smaller value for learning rate and oversampling it because to detect the background region of the image.
5. For every region of image applying propagation of forward through CNN which generates feature vector. This feature vector is trained by binary SVM in each class of the image. For the positive sample of image with IoU (intersection over union) threshold >= 0.3 and for negative samples of image are irrelevant.
6. Using regression model it reduces the errors and trained the model for detecting the exact image using CNN.
3.4.3 Proposed Hybrid of RCNN-RFCN
Region-based fully convolutional networks (RFCN) are used for detecting the disease image in an efficient and accurate manner. To execute it position-sensitive score map is used to address a dilemma between detecting of object and classification of object in translation-invariance. The steps involved in hybrid of RCNN-RFCN are given below:
Step 1: input image reading
Step 2: To improve the quality implement the pre-processing using 3.1
Step 3: feature Extracting of the input pre-processed image using 3.2
Step 4: Apply RCNN using 3.4.2
Step 5: In order to get fine tune classification of leaf image, the output of RCNN is applied the fully connected convolutional network.
Step 6: In the ROI pooling, to detect the object of the image it needs, two classes namely background class and foreground class which detect the region of the objects.
Step 7: At the convolution layer of RCNN, implements positive-sensitive score maps for k2(C + 1) − d convolution.
Step 8: For each class, it will evaluate k2 feature maps which represents Top-Left, Top-Centre, Bottom right and so on.
Step 9: In the pooling layer, for (C + 1) feature maps with size of k2, calculate the average voting for the overlapping detection of object.
Step 10: Apply SoftMax and classify the leaf image.
The hybrid of RCNN-RFCN could automatically perform the pre-processing work, extracting the features of image in the basis of color, texture, and shape. This work is implemented in two phases in the training phase and testing phase.
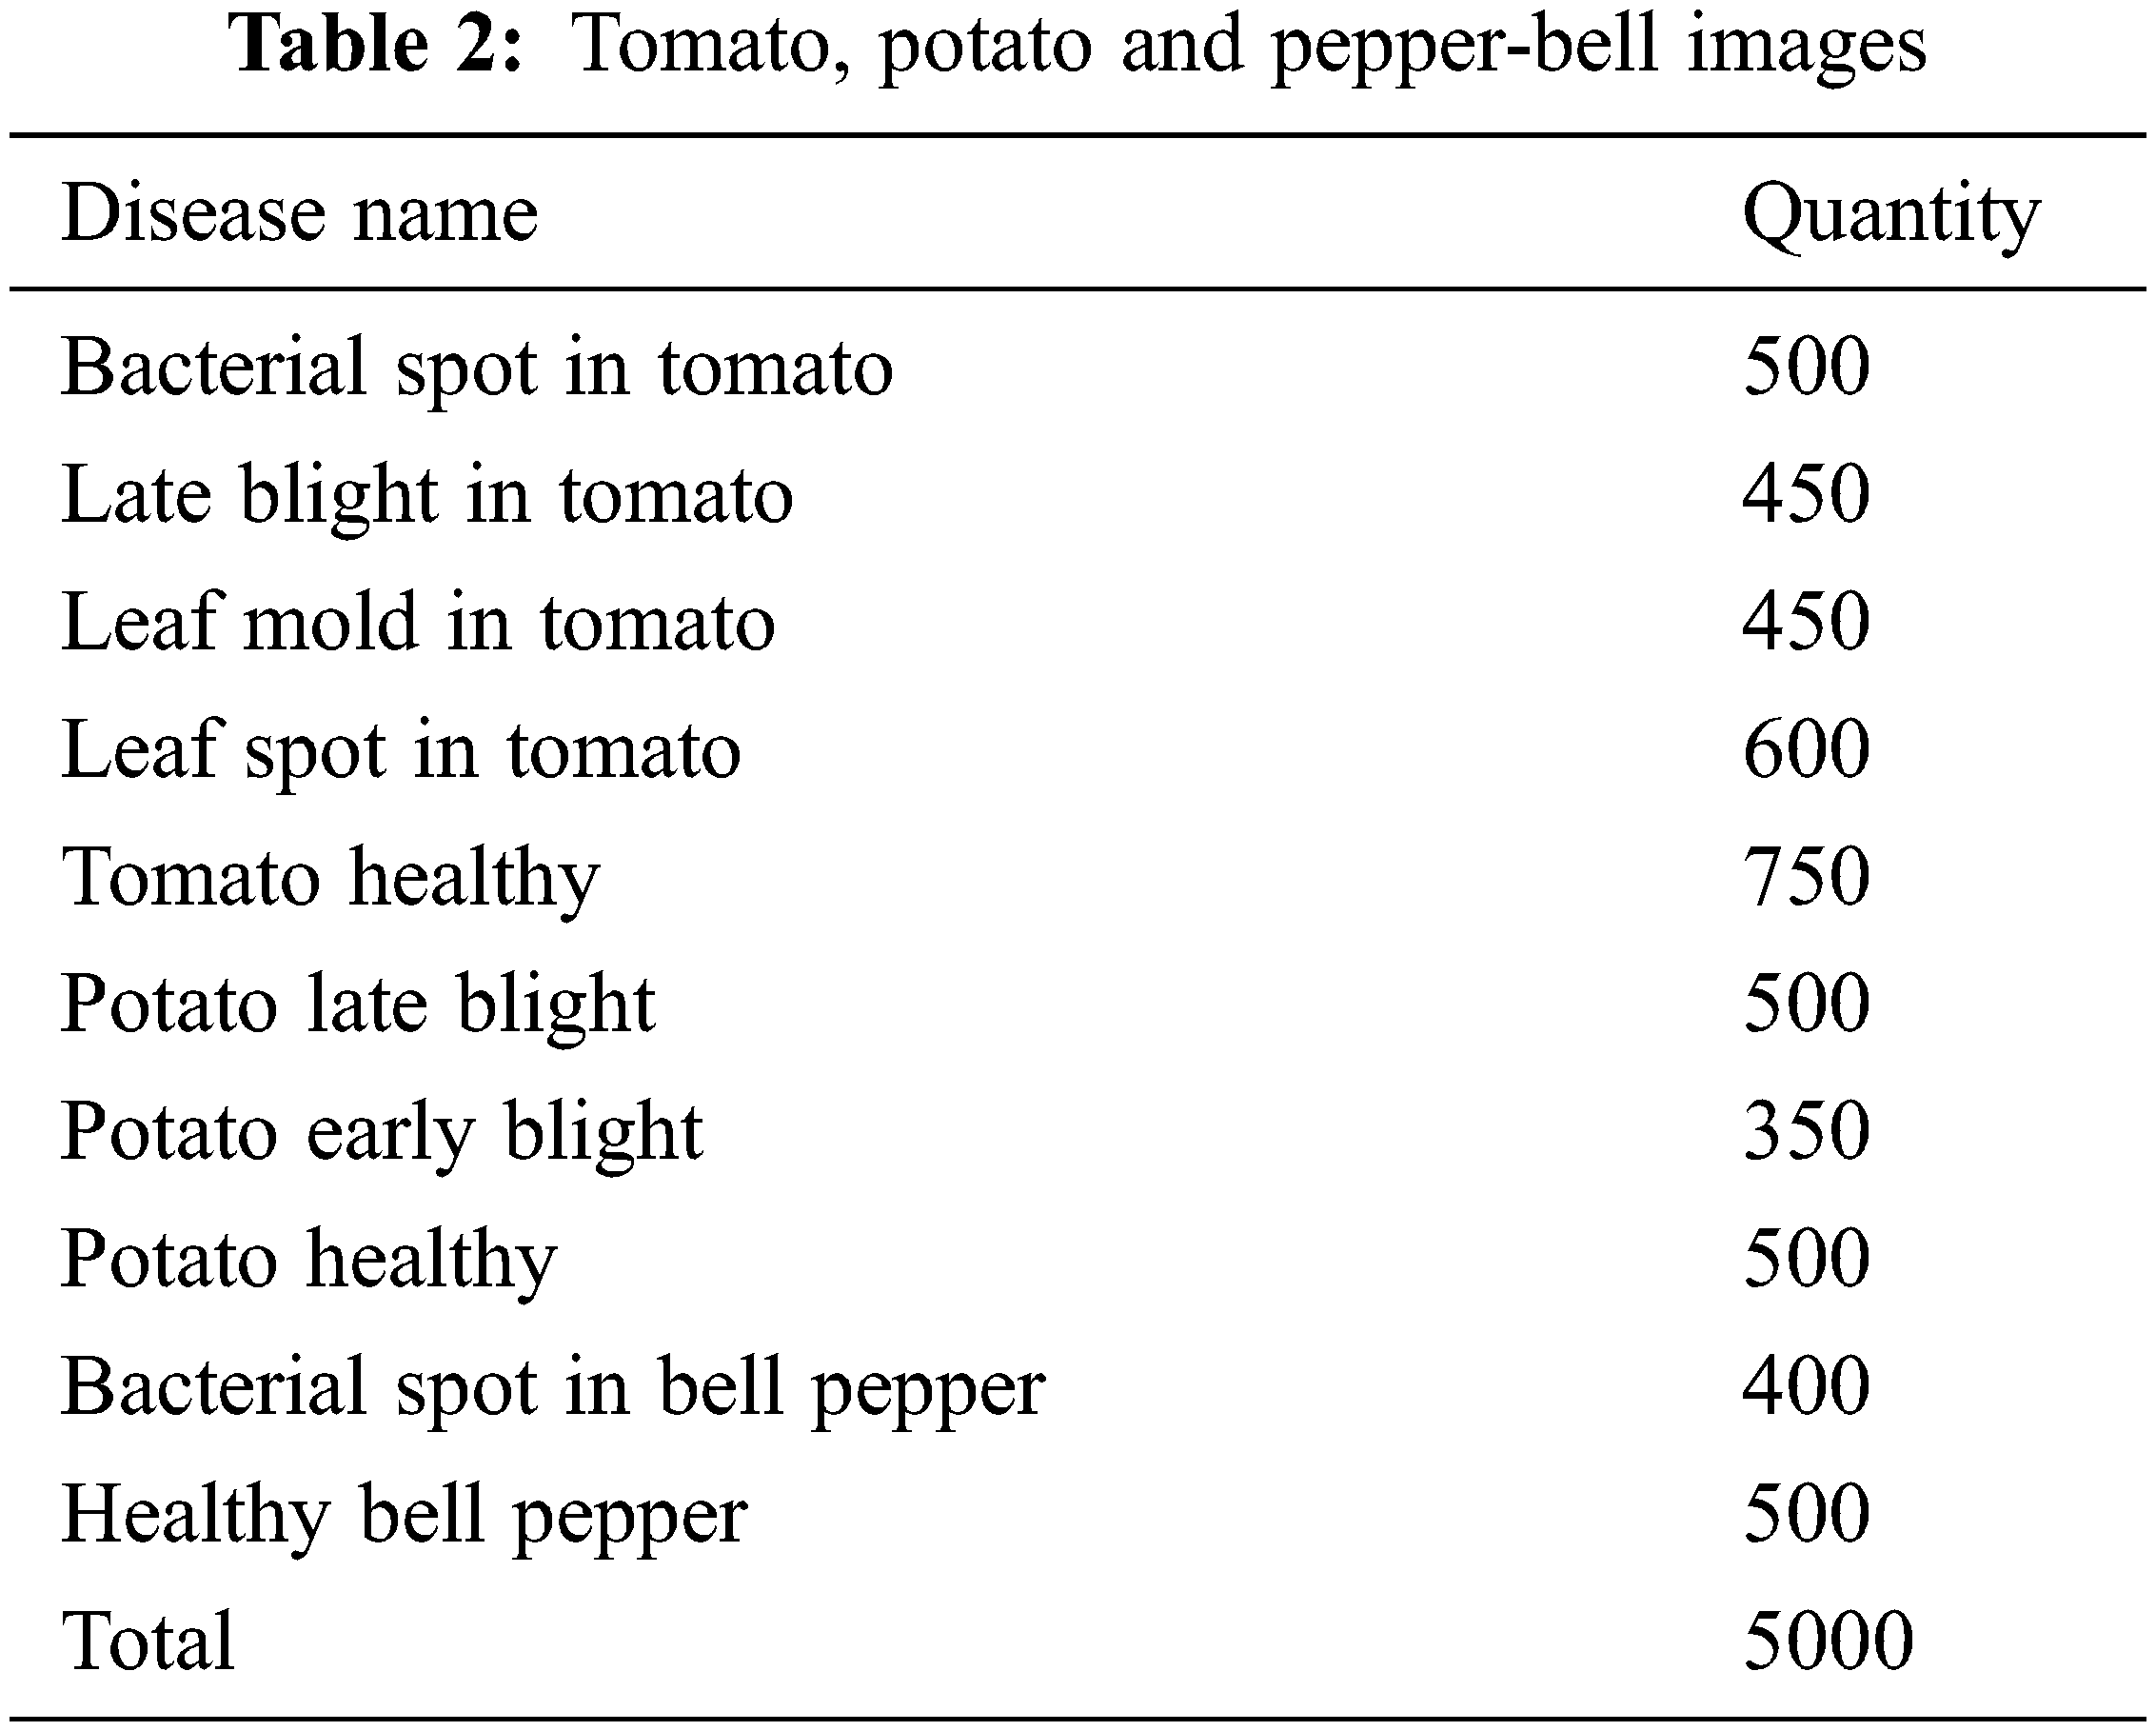
In this work plant images are collected from the village plant dataset. The village plant dataset consists of leaf’s disease in plant image name with labels. The number of tomatoes, potato and pepper-bell images used in this work is given in the Tab. 2.
In 10-Fold-cross validation, the full dataset is equally splitted into 10 subsets. Out of 10, 8 training subsets and 2 subsets for testing. In each validation, the classification accuracy and average classification accuracy is computed. The classification of accuracy is given below:
where y is the samples of classified correctly and classified ‘n’ samples.
The number of samples classifies is represented as:
where total number of samples is ‘N’ in dataset of 5000 images. Q is 10 because of 10-fold cross validation.
The average accuracy of classification in 10-fold cross validation is:
Tab. 3 show that accuracy of average classification over 10-fold cross Validation for various disease image in the data set.
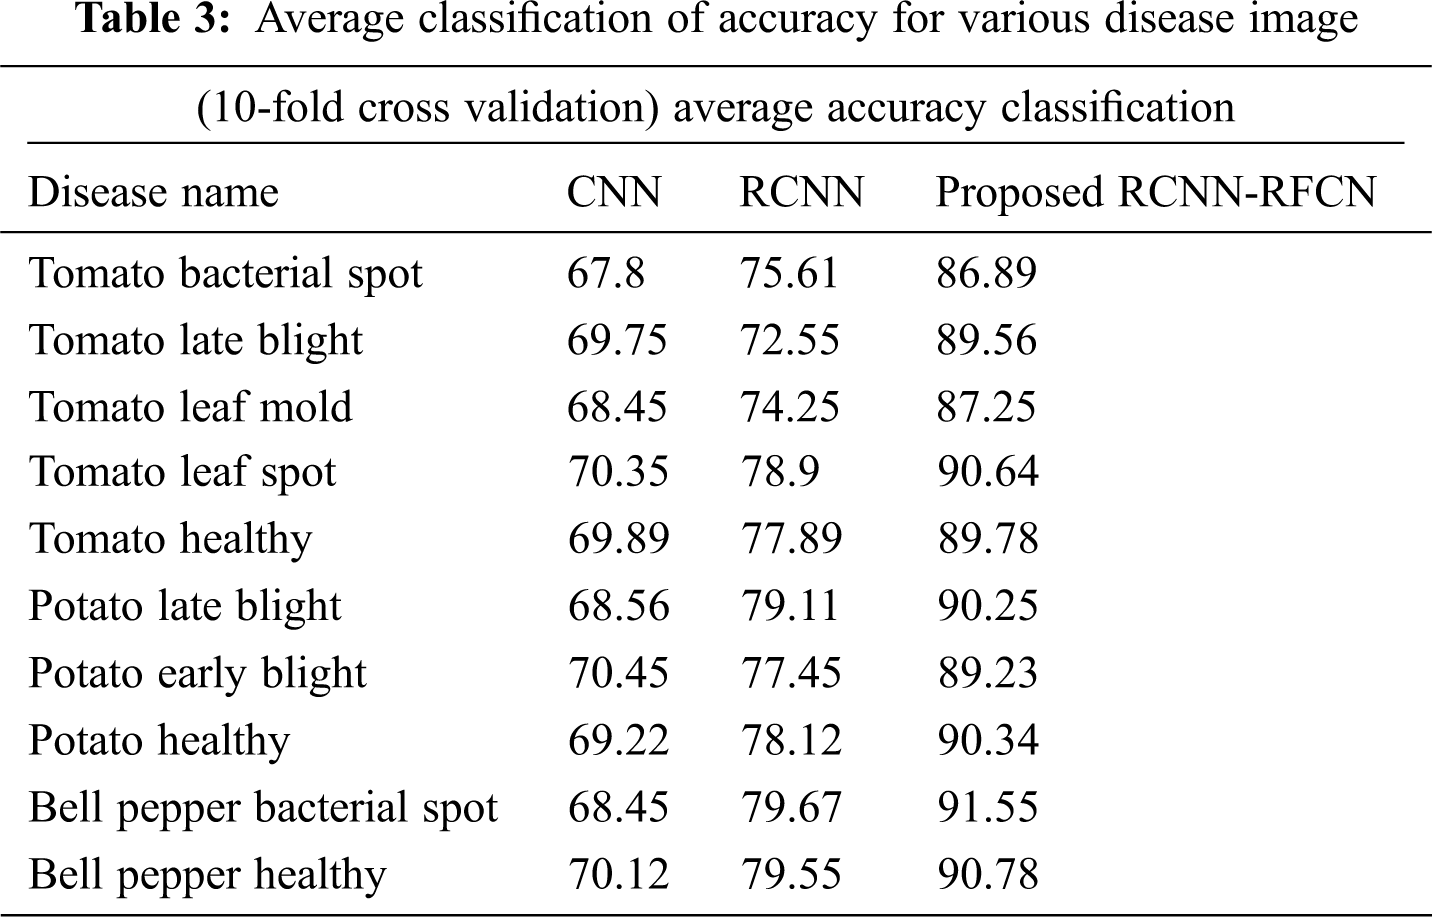
From the observed Tab. 3 the average accuracy of classification obtains a result by the 10-fold cross validation on 5000 image datasets with various disease types. The proposed RCNN-RFCN (Proposed) classifier got 90.78% as maximum average classification accuracy compared with other classifiers.
The statistical performance metric measures are given below:
Accuracy
It is used to evaluate the classification of healthy leaf images accurately.
Sensitivity
It is used to evaluate sensitive to measure how much diseased images are identified
Specificity
It is used to evaluate the rate between True Negative (TN) and True Positive (TP)
Precision
Recall
F1-Score
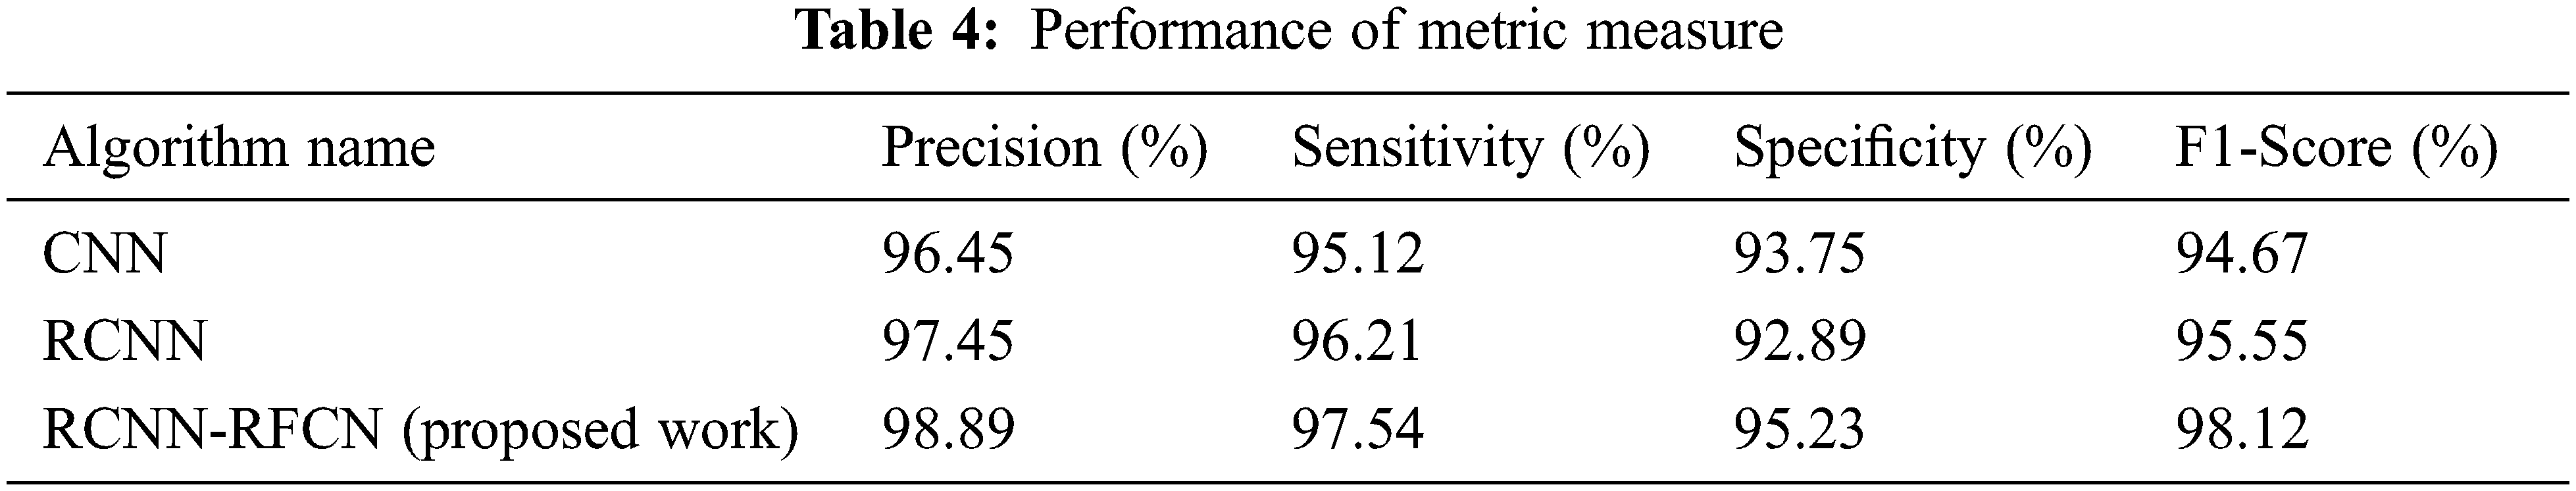
where, TP is the true positive which contains exactly classified normal images of leaf and True Negative (TN) is exact number of leaf disease image, False-Positive (FP) and False Negative (FN) are misidentified normal and abnormal leaf images. Tab. 4 show that performance on metric measures of precision, specificity, sensitivity and F1 measure.
Performance metric based on error rate of the Signal-to-Noise-Ratio (SNR), Root Mean Square Error (RMSE), Peak Signal-to-Noise-Ratio (PSNR) and Mean Absolute Error (MAE). The error rate value is calculated as follows:
From the Tab. 4 classifying the healthy and unhealthy leaf images using the metric measures of precision, sensitivity, specificity and F1-Score. The proposed work RCNN-RFCN got 98.89%, 97.54%, 95.23% and 98.12%. Fig. 4 shows that to classify the healthy leaf from the data set based on the extracting the features. From the Fig. 4 which classifies the leaf based on extracting features of mean, entropy, standard deviation, variance etc. Fig. 5 shows that the classification of diseased leaf based on extracting features.
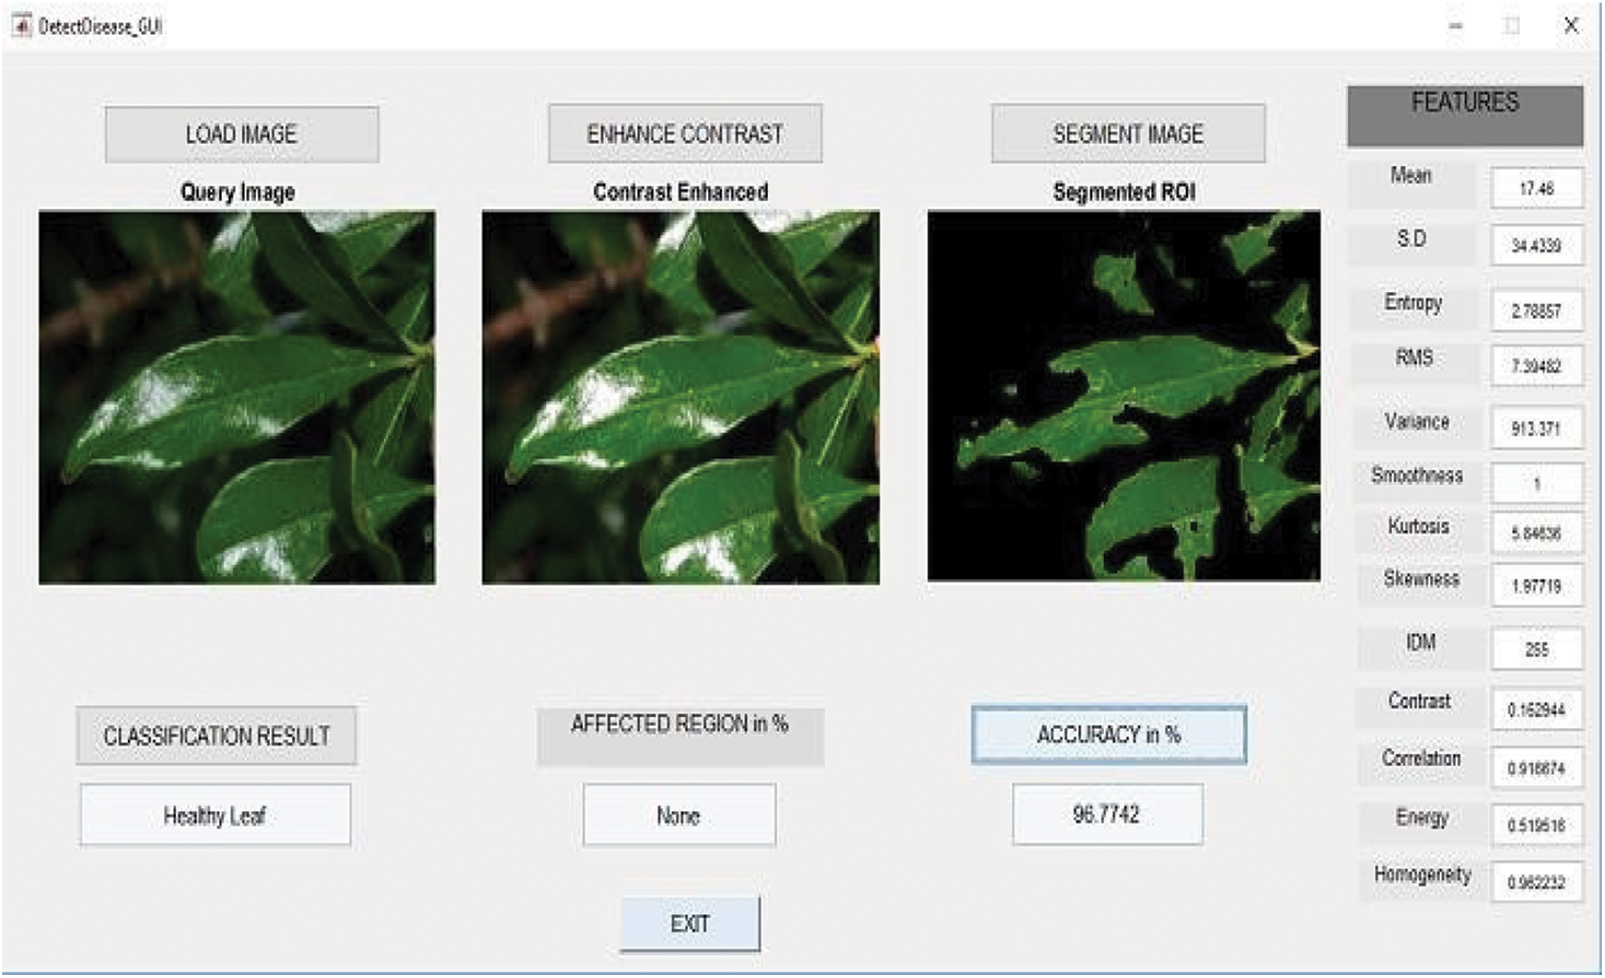
Figure 4: Classify leaf based on extracting the features
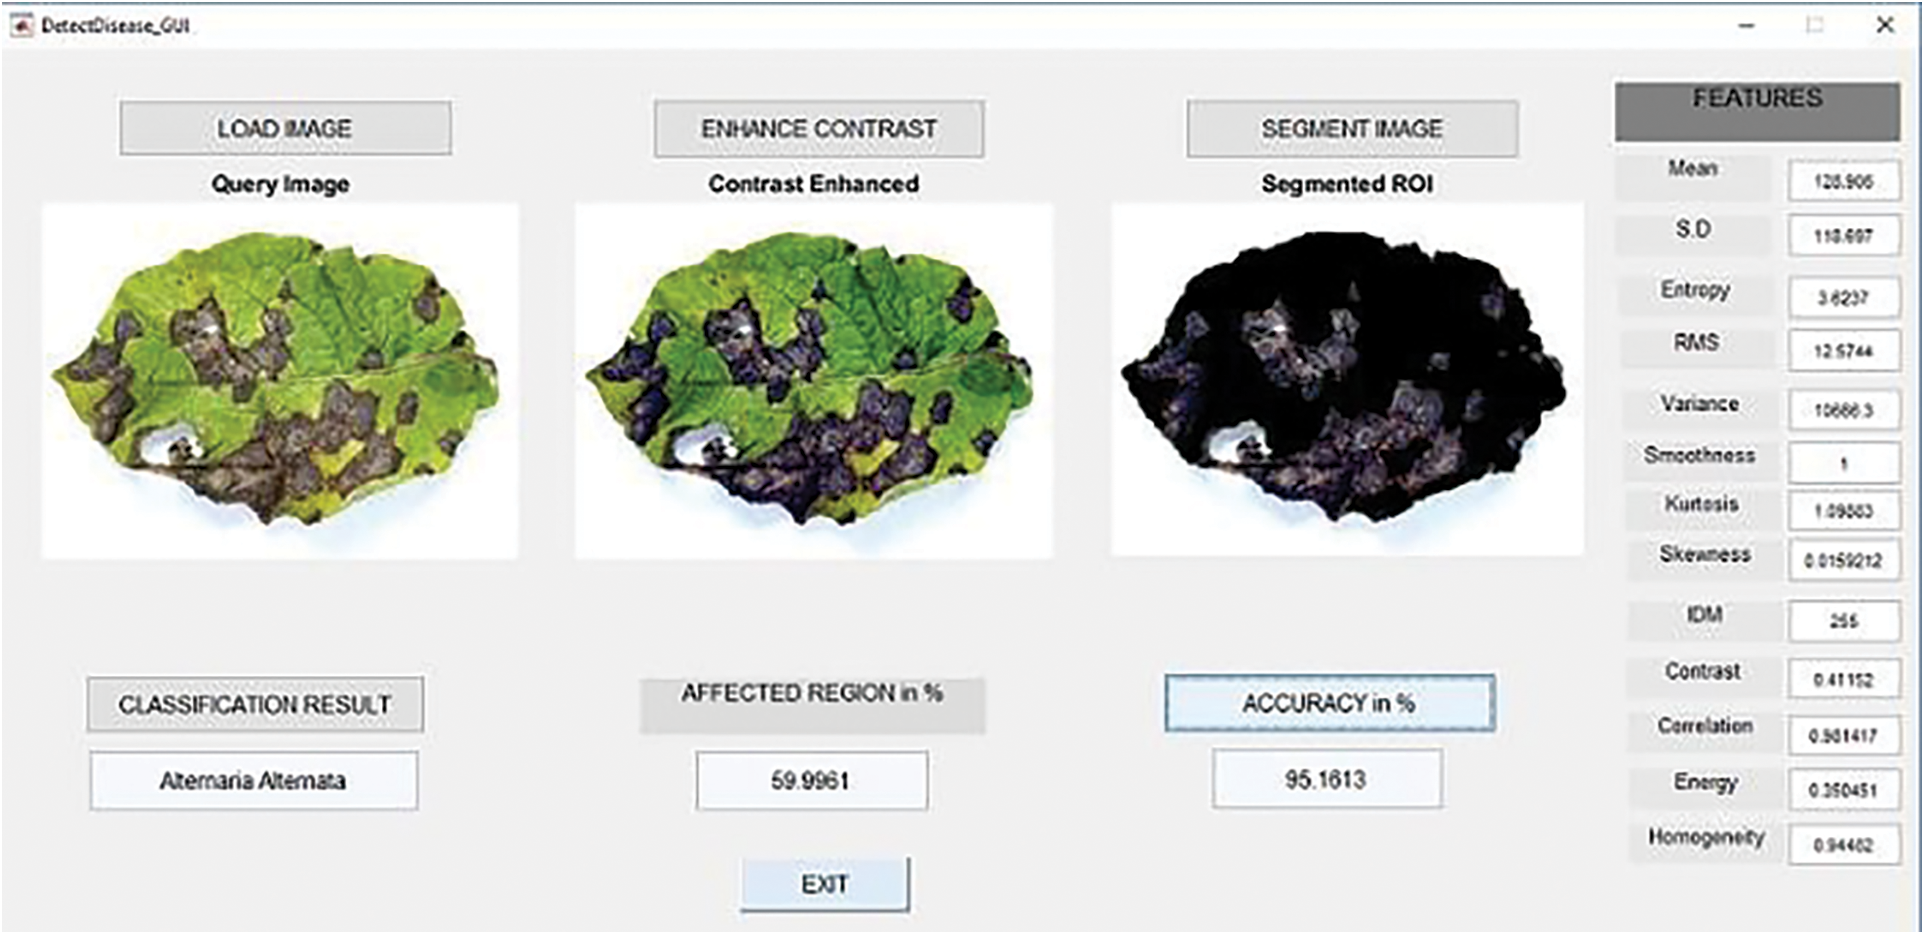
Figure 5: Classification of diseased leaf based on features
From the Fig. 5 show that classifying the diseased leaf based on extracting the features like mean, standard deviation, entropy and so on. Tab. 5 show that execution time of different algorithm.
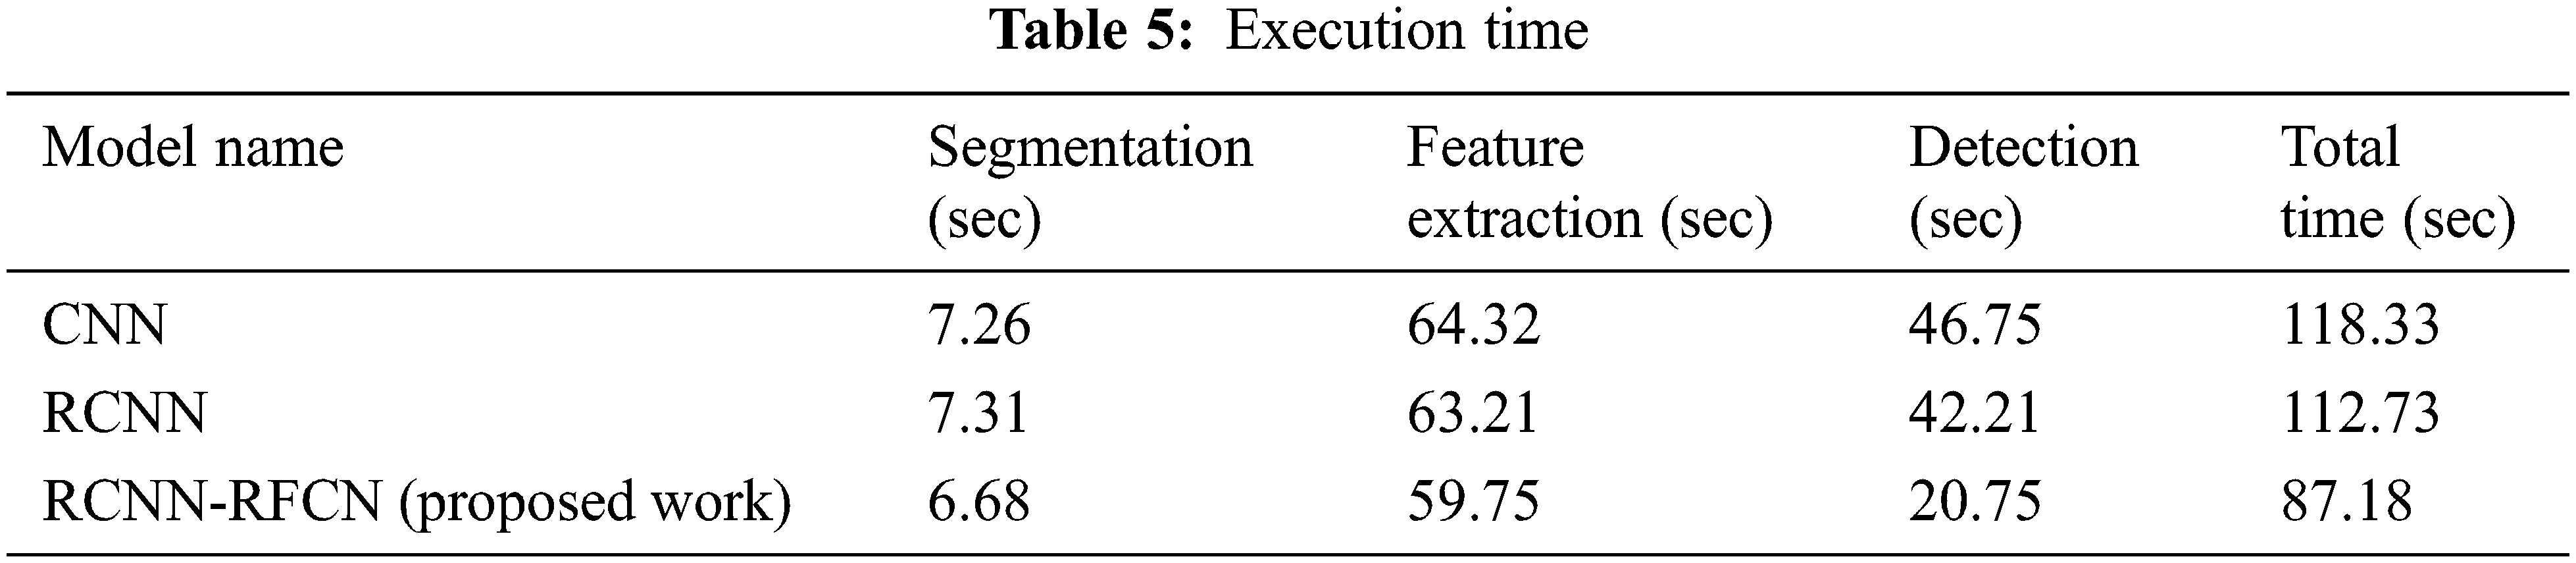
In the Tab. 5 show that execution time of performing various phases based on different model. Our proposed work needs less time for segmentation, feature extraction, detection of healthy and unhealthy image dataset. Fig. 6 show that accuracy of various classifiers.
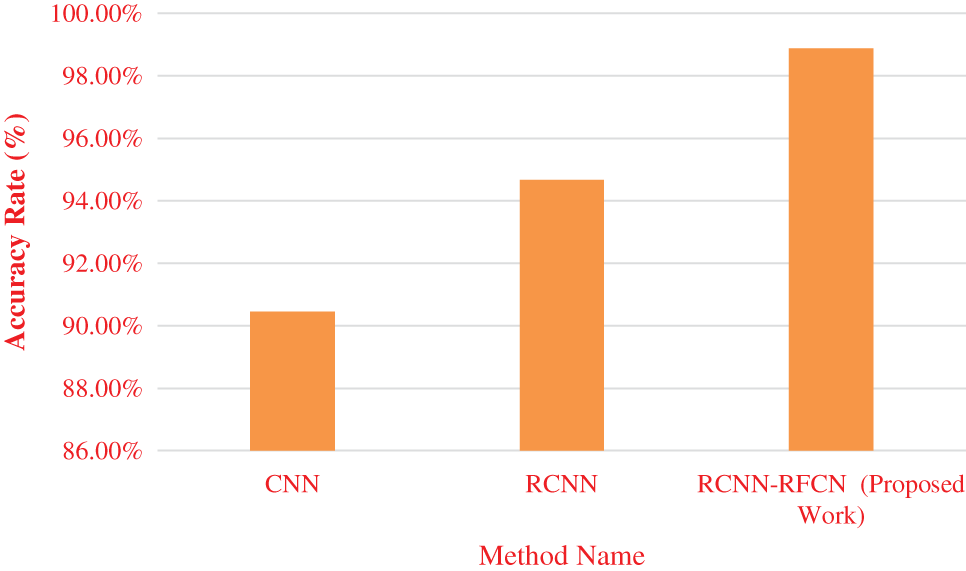
Figure 6: Accuracy
From the Fig. 6 accuracy rate of CNN, RCNN and RCNN-RFCN. Proposed work produces high accuracy rate in the classification of healthy and unhealthy from the data set. CNN got accuracy rate of 90.45%, RCNN is 94.67% and RCNN-RFCN got 98.88%. Fig. 7 show that error rate value is calculated based on its accuracy by using Eqs. (30)–(33).
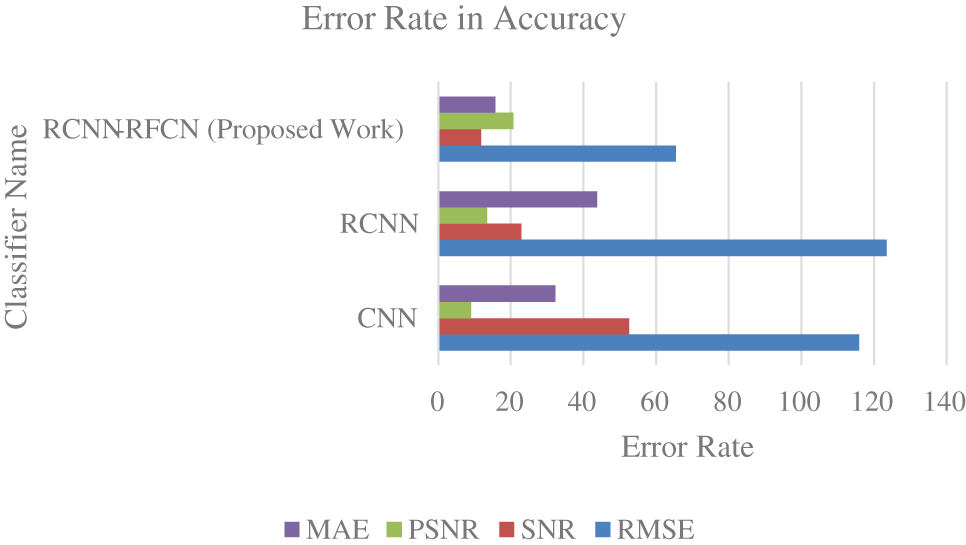
Figure 7: Error rate
From the Fig. 7 observed that PSNR value must increase, and MAE value must decrease for the best detection of healthy and diseases leaf image. Our proposed approach gives better error rate value in the basis of accuracy. In the proposed work the value of PSNR increase and the value of MAE get decrease compared with other existing techniques.
In the prediction of plant leaf disease, this research proposed a RCNN-RFCN. This proposed work detects and classify the various leaves of various plants and spot out the red pixels are available in the leaves. This proposed work is a fast, less cost, faster in execution, affordable and robust one. By using deep learning algorithm, it detects the affected region of the plant leaf in an efficient way. Using deep learning techniques, we successfully identify the affected area in the plant leaf. Various features of the image are extracted with their numeric values. The hybrid technique of RCNN-RFCN algorithm used here is very much efficient and best-case time space complexities are achieved. Proposed work produces high accuracy rate in the classification of healthy and unhealthy from the data set. CNN got accuracy rate of 90.45%, RCNN is 94.67% and RCNN-RFCN got 98.88%. This work can be extended for detecting healthy and unhealthy for various crop leaf images with various deep learning techniques.
Acknowledgement: Research Supporting Project Number (RSP-2021/323), King Saud University, Riyadh, Saudi Arabia.
Funding Statement: This project is funded by King Saud University, Riyadh, Saudi Arabia.
Conflicts of Interest: The authors declare that they have no conflicts of interest to report regarding the present study.
References
1. P. Sethy, N. Barpanda, A. K. Rath and S. K. Behera, “Deep feature based rice leaf disease identification using support vector machine,” Computers and Electronics in Agriculture, vol. 175, no. 4, pp. 105527, 2020. [Google Scholar]
2. J. Chen, D. Zhang, Y. Sun and Y. Nanehkaran, “Using deep transfer learning for image-based plant disease identification,” Computers and Electronics in Agriculture, vol. 173, no. 12, pp. 105393, 2020. [Google Scholar]
3. X. Bai, Z. Cao, L. Zhao, J. Zhang, C. Li et al., “Rice heading stage automatic observation by multi-classifier cascade based rice spike detection method,” Agricultural and Forest Meteorology, vol. 259, no. 3, pp. 260–270. 2018. [Google Scholar]
4. A. Ramcharan, K. Baranowski, P. Loskey, B. Ahmed, J. Legg et al., “Deep learning for image-based cassava disease detection,” Frontiers in Plant Science, vol. 8, no. 4, pp. 1852, 2017. [Google Scholar]
5. A. Camargo and J. S. Smith, “An image-processing based algorithm to automatically identify plant disease visual symptoms,” Bio Systems Engineering, vol. 102, no. 1, pp. 9–21, 2009. [Google Scholar]
6. A. Camargo and J. S. Smith, “Image pattern classification for the identification of disease causing agents in plants,” Computers and Electronics in Agriculture, vol. 66, no. 2, pp. 121–125, 2009. [Google Scholar]
7. J. Singh and H. Kaur May, “Plant disease detection based on region-based segmentation and KNN classifier,” in Proc. Int. Conf. on IoT, Social, Mobile, Analytics and Cloud in Computational Vision and Bio-Engineering ((ISMAC-CVB), Tuticorin, India, pp. 1667–1675, 2018. [Google Scholar]
8. A. Chaudhary, S. Kolhe and R. Kamal, “An improved random forest classifier for multi-class classification,” Information Processing in Agriculture, vol. 3, no. 4, pp. 215–222, 2016. [Google Scholar]
9. S. Phadikar, J. Sil and A. K. Das, “Rice diseases classification using feature selection and rule generation techniques,” Computers and Electronics in Agriculture, vol. 90, no. 11, pp. 76–85, 2013. [Google Scholar]
10. S. Lee, C. Chan, S. Mayo and P. Remagnino, “How deep learning extracts and learns leaf features for plant classification,” Pattern Recognition, vol. 71, no. 3, pp. 1–13, 2017. [Google Scholar]
11. V. Kumar and M. Khaitan, “Plant disease detection using CNN,” Turkish Journal of Computer and Mathematics Education, vol. 12, no. 12, pp. 2106–2112, 2021. [Google Scholar]
12. O. Batuman, Y. Kuo, M. Palmieri, M. Rojas and R. Gilbertson, “Tomato chocolate spot virus, a member of a new torradovirus species that causes a necrosis-associated disease of tomato in Guatemala,” Archives of Virology, vol. 155, no. 6, pp. 857–869, 2010. [Google Scholar]
13. M. Gleason, R. Gitaitis and M. Ricker, “Recent progress in understanding and controlling bacterial canker of tomato in eastern North America,” Plant Disease, vol. 77, no. 11, pp. 1069–1076, 1993. [Google Scholar]
14. S. Lee, C. Chan, S. Mayo and P. Remagnino, “How deep learning extracts and learns leaf features for plant classification,” Pattern Recognition, vol. 71, no. 3, pp. 1–13, 2017. [Google Scholar]
15. R. Hasan, S. Yusuf and L. Alzubaidi, “Review of the state of the art of deep learning for plant diseases: A broad analysis and discussion,” Plants, vol. 9, no. 10, pp. 1–15, 2020. [Google Scholar]
16. G. Wang, Y. Sun and J. Wang, “Automatic image-based plant disease severity estimation using deep learning,” Computational Intelligence and Neuroscience, vol. 2017, no. 3, pp. 34–45, 2017. [Google Scholar]
17. B. Liu, Y. Zhang, D. He and Y. Li, “Identification of apple leaf diseases based on deep convolutional neural networks,” Symmetry, vol. 10, no. 1, pp. 1–12, 2018. [Google Scholar]
18. J. Amara, B. Bouaziz and A. Algergawy, “A deep learning-based approach for banana leaf diseases classification,” DatenBankSystem for Business, Technology and Web, vol. 79, no. 2, pp. 79–88, 2017. [Google Scholar]
19. S. Bashir and N. Sharma, “Remote area plant disease detection using image processing,” IOSR Journal of Electronics and Communication Engineering, vol. 2, no. 6, pp. 31–34, 2012. [Google Scholar]
20. N. Savitam and G. Arora, “Detection and classification of plant leaf diseases using image processing and soft computing techniques: A review,” International Journal of Recent Advances in Engineering &Technology, vol. 2, no. 3, pp. 2347–2812, 2014. [Google Scholar]
21. M. Sezgin and B. Sankur, “Survey over image thresholding techniques and quantitative performance evaluation,” Journal of Electronic Imaging, vol. 13, no. 1, pp. 146–166, 2014. [Google Scholar]
22. H. Yu, M. Li, H. Zhang and J. Feng, “Color texture moments for content-based image retrieval,” in Proc. Int. Conf. on Image Processing, Anchorage, USA, pp. 929–932, 2002. [Google Scholar]
23. M. AbdelBasset, D. ElShahat, K. Deb and M. Abouhawwash, “Energy-aware whale optimization algorithm for real-time task scheduling in multiprocessor systems,” Applied Soft Computing, vol. 93, no. 3, pp. 34–45, 2020. [Google Scholar]
24. M. AbdelBasset, R. Mohamed, M. Abouhawwash, K. Chakrabortty and J. Michael, “EA-MSCA: An effective energy-aware multi-objective modified sine-cosine algorithm for real-time task scheduling in multiprocessor systems: Methods and analysis,” Expert Systems with Applications, vol. 173, no. 3, pp. 1–15, 2021. [Google Scholar]
25. H. Seada, M. Abouhawwash and K. Deb, “Multiphase balance of diversity and convergence in multiobjective optimization,” IEEE Transactions on Evolutionary Computation, vol. 23, no. 3, pp. 503–513, 2019. [Google Scholar]
26. M. Abouhawwash and A. Alessio, “Multi objective evolutionary algorithm for PET image reconstruction: Concept,” IEEE Transactions on Medical Imaging, vol. 40, no. 8, pp. 2142–2151, 2021. [Google Scholar]
27. S. Kumar, A. Jain, A. P. Shukla, S. Singh, R. Raja et al., “A comparative analysis of machine learning algorithms for detection of organic and nonorganic cotton diseases,” Mathematical Problems in Engineering, vol. 2021, pp. 1–18, 2021. [Google Scholar]
28. M. A. Khan, A. Ullah, S. Khan, M. Ali, S. Khan et al., “A novel fractional-order variational approach for image restoration based on fuzzy membership degrees,” IEEE Access, vol. 9, no. 3, pp. 43574–43600, 2021. [Google Scholar]
29. M. Abdel-Basset, R. Mohamed, N. M. AbdelAziza and M. Abouhawwash, “HWOA: A hybrid whale optimization algorithm with a novel local minima avoidance method for multi-level thresholding color image segmentation,” Expert Systems with Applications, vol. 190, no. 1, pp. 116145, 2022. [Google Scholar]
30. H. Seada, M. Abouhawwash and K. Deb, “Towards a better diversity of evolutionary multi-criterion optimization algorithms using local searches,” in Proc. of the 2016 on Genetic and Evolutionary Computation Conf. Companion, pp. 77–78, Denver, USA, 2016. [Google Scholar]
31. M. Abouhawwash and K. Deb, “Karush-kuhn-tucker proximity measure for multi-objective optimization based on numerical gradients,” in Proc. of the 2016 on Genetic and Evolutionary Computation Conf. Companion, pp. 525–532, Denver, USA, 2016. [Google Scholar]
32. M. Abouhawwash, M. A. Jameel and K. Deb, “A smooth proximity measure for optimality in multi-objective optimization using benson’s method,” Computers & Operations Research, vol. 117, no. 3, pp. 104900, 2020. [Google Scholar]
33. S. T. Suganthi, A. Vinayagam, V. Veerasamy, A. Deepa, M. Abouhawwash et al., “Detection and classification of multiple power quality disturbances in microgrid network using probabilistic based intelligent classifier,” Sustainable Energy Technologies and Assessments, vol. 47, no. 4, pp. 101470, 2021. [Google Scholar]
34. N. Mittal, H. Singh, V. Mittal, S. Mahajan, A. K. Pandit et al., “Optimization of cognitive radio system using self-learning salp swarm algorithm,” Computers, Materials & Continua, vol. 70, no. 2, pp. 3821–3835, 2022. [Google Scholar]
35. M. Masud, N. Sikder, A. A. Nahid, A. K. Bairagi and M. A. AlZain, “A machine learning approach to diagnosing lung and colon cancer using a deep learning-based classification framework,” Sensors, vol. 21, no. 3, pp. 1–15, 2021. [Google Scholar]
Cite This Article
 Copyright © 2023 The Author(s). Published by Tech Science Press.
This work is licensed under a Creative Commons Attribution 4.0 International License , which permits unrestricted use, distribution, and reproduction in any medium, provided the original work is properly cited.
 Downloads
 Citation Tools