
 Submit a Paper
 Propose a Special lssue
 Open Access
ARTICLE

Spectral Analysis and Validation of Parietal Signals for Different Arm Movements
1 School of Electrical and Electronics Engineering, Sathyabama Institute of Science and Technology, Chennai, 600119, India
2 School of Electronics and Instrumentation Engineering, SRM Institute of Science and Technology, Chennai, 630203, India
3 Department of Biomedical and Mechanical Engineering, School of Engineering, National University of Ireland, Galway, H91 CF50, Ireland
* Corresponding Author: Umashankar Ganesan. Email:
Intelligent Automation & Soft Computing 2023, 36(3), 2849-2863. https://doi.org/10.32604/iasc.2023.033759
Received 27 June 2022; Accepted 29 September 2022; Issue published 15 March 2023
 View Full Text
 Download PDF
Abstract
Brain signal analysis plays a significant role in attaining data related to motor activities. The parietal region of the brain plays a vital role in muscular movements. This approach aims to demonstrate a unique technique to identify an ideal region of the human brain that generates signals responsible for muscular movements; perform statistical analysis to provide an absolute characterization of the signal and validate the obtained results using a prototype arm. This can enhance the practical implementation of these frequency extractions for future neuro-prosthetic applications and the characterization of neurological diseases like Parkinson’s disease (PD). To play out this handling method, electroencephalogram (EEG) signals are gained while the subject is performing different wrist and elbow movements. Then, the frontal brain signals and just the parietal signals are separated from the obtained EEG signal by utilizing a band pass filter. Then, feature extraction is carried out using Fast Fourier Transform (FFT). Subsequently, the extraction process is done by Daubechies (db4) and Haar wavelet (db1) in MATLAB and classified using the Levenberg-Marquardt Algorithm. The results of the frequency changes that occurred during various wrist movements in the parietal region are compared with the frequency changes that occurred in frontal EEG signals. This proposed algorithm also uses the deep learning pattern analysis network to evaluate the matching sequence for each action that takes place. Maximum accuracy of 97.2% and maximum error range of 0.6684% are achieved during the analysis. Results of this research confirm that the Levenberg-Marquardt algorithm, along with the newly developed deep learning hybrid PatternNet, provides a more accurate range of frequency changes than any other classifier used in previous works of literature. Based on the analysis, the peak-to-peak value is used to define the threshold for the prototype arm, which performs all the intended degrees of freedom (DOF), verifying the results. These results would aid the specialists in their decision-making by facilitating the analysis and interpretation of brain signals in the field of neuroscience, specifically in tremor analysis in PD.Keywords
In order to make an independent resolution in human-machine teams, understanding about effects taking place during small motor movements on EEG signals is necessary [1]. In addition, analyzing and formulating EEG signals provides investigators with a pathway to interface directly with brain activities. In particular, the need for prosthetics for people with physical disabilities is one of the major motivations for the evolution of brain-computer interfacing technology [2,3]. However, various artifacts due to external sources like power line frequency components and internal sources like bioelectric potentials caused during facial and eye movements might be present in the raw EEG signals. Therefore, a band pass filter might be effective for removing all these artifacts [4]. Also, the selection of appropriate and compatible features is very important for effective classification. Various studies prove that the β-band has higher mapping and convergence during motor movements; hence it plays a crucial role during hand movements [5]. This paper mainly focuses on comparing, analyzing, and differentiating the frequency changes between the frontal EEG signals and parietal EEG signals, which play a crucial role during motor movements. It is anticipated that this might increase the overall accuracy of the classification of motor EEG signals and reduce computational complexity and setup time. Consequently, it helps to successfully create a hybrid machine learning algorithm, which can be used in real-time for prediction by using Discrete Wavelet Transform (DWT) to extract features and delete unnecessary datasets.
In 1934, Adrian and Matthews published an article validating the basic facts about oscillations in EEG waves based on day-to-day activities and confirmed that oscillations that occur in EEG waves are around 10 to 12 Hz, and they termed it “alpha rhythm” [6]. Earlier research proved that oscillations in EEG waves are generally sinusoidal [7]. On the other hand, Cole also demonstrated that there might be non-sinusoidal oscillations in EEG signals that play a crucial role in physiological information related to neural communication and cognition [8]. In regards to the progression of EEG signal analysis based on muscular movements, the identification and differentiation of continuous EEG signals based on finger flexion movement have been demonstrated [9]. Later on, authors of [10,11] proved the differentiation of EEG signals recorded during finger movements and without finger movements. Recent studies also attest that during analysis, alpha and beta waves hold crucial statistics during motor movements. Therefore, all these researchers have mutually used alpha and beta wave bands that range between 8–30 Hz for their analysis [10,11].
Recent approaches show the classification of motor imagery EEG signals based on a common spatial pattern (CSP) where the spatial pattern vectors in scalp mapping are desynchronized and its readiness potential is analyzed for imagery head and hand movement classification [12]. Other publishers have also proved that motor imagery EEG signals can also be separated into multiple frequency bands using a filter bank before feature extraction; this improves the accuracy [13–15]. But then, the classification of merely the motor EEG signal from the overall EEG signal has not yet been achieved. Few studies have investigated the effects of finger artifacts using their time and frequency domain features. This method helped the researchers to visually detect even the small changes in muscle movements; this approach increases the classification accuracy in neural network models [16]. Existing techniques so far use auto regressive moving average (ARMA) for EEG signal classification for various hand movements like finger open, finger close, wrist clockwise, and wrist counter-clockwise [17]. Certain researches showed EEG signals classification using linear discriminant analysis (LDA), the quadratic classifier analysis (QDA), classification based on Mahalanobis distance (MD), and the scaled conjugate gradient method [18]. However, current approaches predict and classify overall EEG signals for motor movements. This reduces the accuracy of classification as EEG might have many artefacts. But this novel approach mainly focuses on analysing and differentiating the frequency changes in frontal and parietal EEG signals which play a crucial role during motor movements.
In this study, a total of 300 EEG data sets were recorded using a 10–20 electrode EEG system from three healthy male and three healthy female subjects for the frontal region and parietal region for analysis. The experiments have been carried out in accordance with the code of ethics of the World Medical Association. Correspondingly, before experimenting, informed consent was obtained from the subjects. The EEG signals recorded are grouped into 2 clusters that cover the frontal region in one cluster and the parietal region in another cluster for analysis. The subjects were asked to perform various wrists and elbow movements, and the EEG signals were recorded simultaneously. The various wrist movements analysed in this study include clockwise rotation, anti-clockwise rotation, wrist flexion, and wrist extension; and elbow movements include elbow flexion and elbow extension. EEG signals are recorded for five attempts per movement, with an epoch time of 12 s per attempt for various conditions.
The frontal and parietal EEG sets are categorized into two main groups, and then these main groups are sub-categorized based on the subject’s eyes open and closed conditions. Next, each of these sub-groups is again divided into total of five subgroups, in which four groups are based on wrist movement performed by subjects during recording EEG signals and one control group. Group-1 is a control group that represents 30 EEG data sets in the eyes-open (OE) condition and 30 EEG data sets in the eyes-closed condition (CE). Group-2 includes a total of 120 data sets recorded in OE condition. Furthermore, the sub-groups contain the EEG data sets recorded during different hand movements in OE conditions. Group-3 consists of a total of 120 data sets recorded that are sub-categorized based on the different hand movements in CE conditions. Finally, the EEG signals recorded are exported to MS Excel sheets in the form of frequencies for analysis.
3.2 Experimental Methodology and Flow Chart
The experimental methodology initially comprises the pre-processing of raw EEG signals. This is an important process for performing feature extraction and classification of frontal and parietal EEG signals. Primarily, the raw EEG data is exported to MS EXCEL (Microsoft, Inc.) in the form of frequencies for various wrist and elbow movements. In this study, MATLAB (The Math Works, Inc.) was used to perform pre-processing, feature extraction, and some parts of EEG analysis.
Two types of analysis are performed in this approach. As Alpha (α) and Beta (β) brain signals play a vital role in motor movements, the frontal brain signals are recorded and analysed. Equally, parietal brain signals play a vital role in the processing of information during motor movements. Here, it is anticipated that extracting and analysing only the parietal brain signals will help in reducing the computational complexity during the processing of EEG signals. Therefore, EEG signals recorded only from channels P1-P4 are analysed. Then both the results are compared to identify the frequency changes that occur in an ideal region responsible for wrist and elbow muscular movements. Feature extraction is performed using the FFT. Secondly, the filtering technique is essential to remove unnecessary data from the raw signals. Thus, the band pass filter is used in this approach for both signal analysis to filter direct current (DC) shifts and to remove the non-stationary artefacts present in epoch boundaries. Following that, the spectral analysis is done using the Haar wavelet (db1) transform for parietal brain signal analysis and the Daubechies wavelet (db4) transform for frontal brain signal analysis, where the EEG signals are decomposed, i.e., the coefficients that are smaller than the soft threshold values are removed. After decomposition, the reconstruction of the signal is performed using the inverse discrete Haar wavelet transform for parietal EEG signals and the inverse Daubechies wavelet transform for frontal brain signal analysis. Next, power spectral density (PSD) is calculated for both the signals to identify where the frequency variation is strong and weak for different trials and to compare the results of frontal EEG signal and parietal EEG signal analysis. The EEG signals are distributed in the means of time-frequency, so the statistical features like mean, variance, standard deviation (SD), kurtosis, skewness, co-variance, and median are calculated for both frontal and parietal EEG signal analysis.
To identify the ideal frequency range for wrist movements, it is very important to know how the information is processed during wrist movements. Therefore, for a better understanding of the variations that take place in parietal EEG signals, the extracted features are then fed into the Levenberg-Marquardt algorithm where a hybrid neural network is used to monitor the details regarding how the signals are trained in the time domain values and the number of hidden layers used inside. As a result, performance measures, training state, error histogram, confusion matrix, and receiver operating characteristics can be analysed. Then, the ideal parietal frequency range is identified and compared with the results of the frontal EEG signal frequency range for wrist and elbow muscular movements.
3.3 Fast Fourier Transform (FFT)
As FFT is a time-shift invariant, it is considered one of the best transformations between the time and frequency domain [19]. In addition, one of the key benefits of FFT is that the dominant features can easily be spotted in the input EEG signal. The FFT of a given signal is shown in Eq. (1). And the original time-domain signal can be recovered using an Inverse Fast Fourier Transform, which is shown in Eq. (2).
FFT can be expressed as,
where,
It is a member of the Daubechies wavelet family and is a first-order Daubechies wavelet db1 [21]. The main intention for selecting the Haar wavelet in this study is that, among all types of wavelet transforms, the Haar wavelet is the simplest technique. It gives us the shortest path for processing EEG signals [22]. As a result, it reduces the processing time. This is also stated as a sampling process [23]. The foremost benefit of using a wavelet-based decomposed signal is that it can be represented in both the time and frequency domain. In the Haar wavelet, each row of the transformation matrix acts as a sampling of finer resolution [24]. The Haar wavelet is shown in Eq. (3). The scaling function Φ(t) of the Haar wavelet is defined in Eq. (4).
3.5 Levenberg-Marquardt Algorithm
The Levenberg-Marquardt algorithm uses the Jacobian matrix and the gradient vector as mentioned in Eq. (5).
It is also called the damped least square method, where the loss functions are represented in the form of a sum of squared errors [25]. Therefore, this makes the algorithm powerful and allows it to perform faster even in the case of some kinds of errors found in training the neural network [26]. The derivatives of the errors relating to the parameters are known as the loss function. In the case where the damping parameter is zero, Newton’s method is approached, where an approximate Hessian matrix is used.
It has six servomotors, which allow it to grab in any direction. Every servomotor is fixed in a specific position to achieve a specific DOF. For the elbow joint, large torque and high precision are used to achieve the maximum range of movements. The motor used for the elbow joint is the LDX-218 digital servomotor, and it provides a 0°–180° angle of rotation. The motor used for the wrist joint is the LFD-06 servomotor. It provides 0°–180° rotation with a rotation speed of 0.12 sec/60°. To achieve the appropriate movement, the servomotor is fixed through a hard aluminum bracket so that the joint becomes stable during the movement. Through this, arm, wrist, and elbow joint movements such as clockwise, anticlockwise, elbow extension, elbow flexion, wrist extension, and wrist flexion can be achieved. The whole arm is balanced by a large, strong bottom plate so that the arm will not be disturbed during movement. The arm can be controlled through the 6-channel servo controller, and it can be interfaced with the personal computer (PC) and Arduino very easily, and all the wrist and elbow movements can be achieved.
EEG is a very complex and noisy signal; the overall processing will be time-consuming. However, in this approach as anticipated, Fast Fourier Transform has increased the speed of feature extraction. Raw EEG signal before being processed and classified is shown in Fig. 1a. The feature extraction of EEG signals is performed using FFT as shown in Fig. 1b. These two figures show a significant difference between the raw signal and the feature extracted signal.
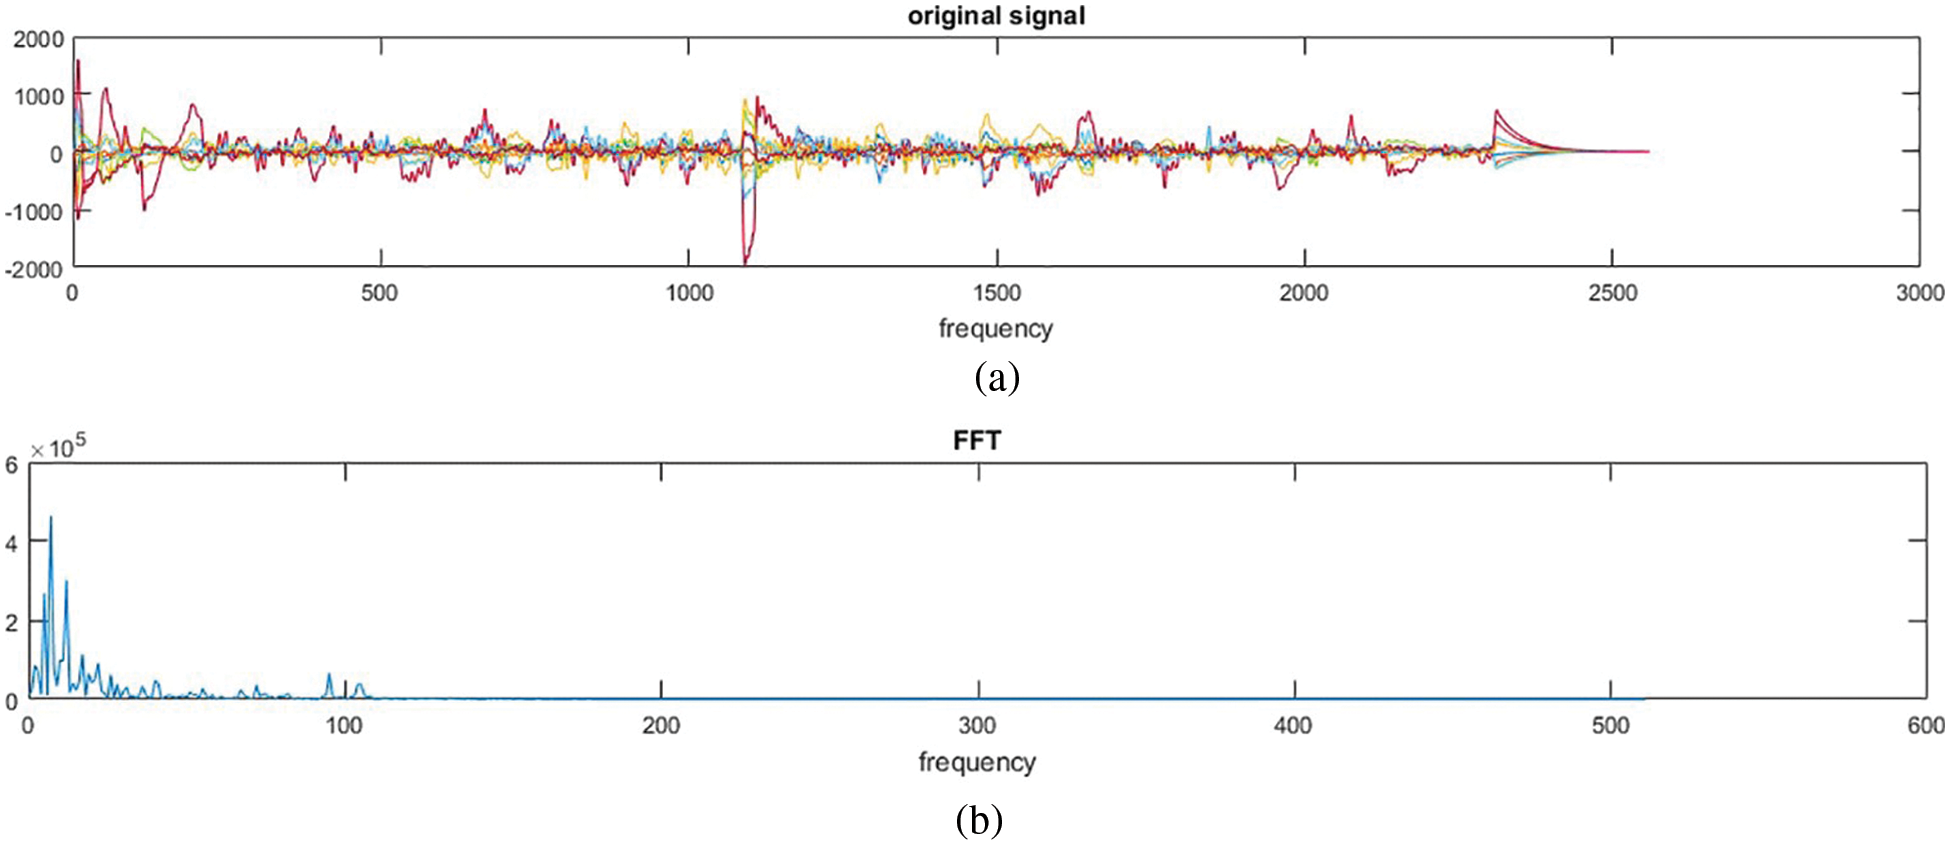
Figure 1: EEG signal (a) Raw EEG signal (b) FFT of EEG signal
Since the band frequencies of alpha and beta waves responsible for motor movements are already known, band pass filters are used in this approach to remove the noise in EEG signals. The band pass filter has effectively removed the minute noises that occurred due to other movements like a heartbeat, breathing, and eye blinking during the eyes-open condition. To extract the information related to variations in frequencies during various wrist and elbow movements and wavelet coefficients, the filtered EEG signals are decomposed into several wavelet levels using the Daubechies wavelet transform [27]. Approximation coefficients are picked up by passing the signals simultaneously through a series of high-pass and low-pass filters. In this approach, multilevel decomposition is performed with sub-bands of a total of seven levels of DWT. The filtered and decomposed frontal and parietal EEG signals are again reconstructed using the Inverse debauches wavelet transform.
The PSD of the frontal and parietal EEG signals obtained from FFT of input signals was successfully validated and tested using statistical analysis. For better evaluation, both frequency domain analysis and time-domain analysis are performed. The PSD in terms of decibels (dB) is plotted against the frequency band for validating the characteristics of both the frontal and parietal EEG spectrums as shown in Figs. 2a and 2b. In the case of frontal EEG signals, the PSD of the processed signals for various movements is visually calculated based on the peak value obtained. This peak value denotes the distribution of the power of the EEG signal over frequency. Slight fluctuations are observed in every output depending on subjects, type of wrist and elbow movements, and conditions recorded. However, the average frequency obtained for various wrist and elbow movements is between 23–30 Hz, and the error is 0.9219%. Outcomes of parietal signal analysis show an accuracy of a maximum of 97.2%; the performance of power spectral frequency between 25–31 Hz, mean value of 30.5421, and an error of 0.6684% are achieved. Meanwhile, the variations in frequency between frontal and parietal signals are also very minute, which can be classified by encoding the prosthetic device during application. Hidden layers of the parietal brain signal, performance measures, training state, error histogram, confusion matrix, and receiver operating characteristics are monitored using a hybrid neural network. Its error histogram values, mean squared error (MSE) for training, validation (check), and test steps are plotted for both frequency domain and time domain analysis as shown in Figs. 2c and 2d.
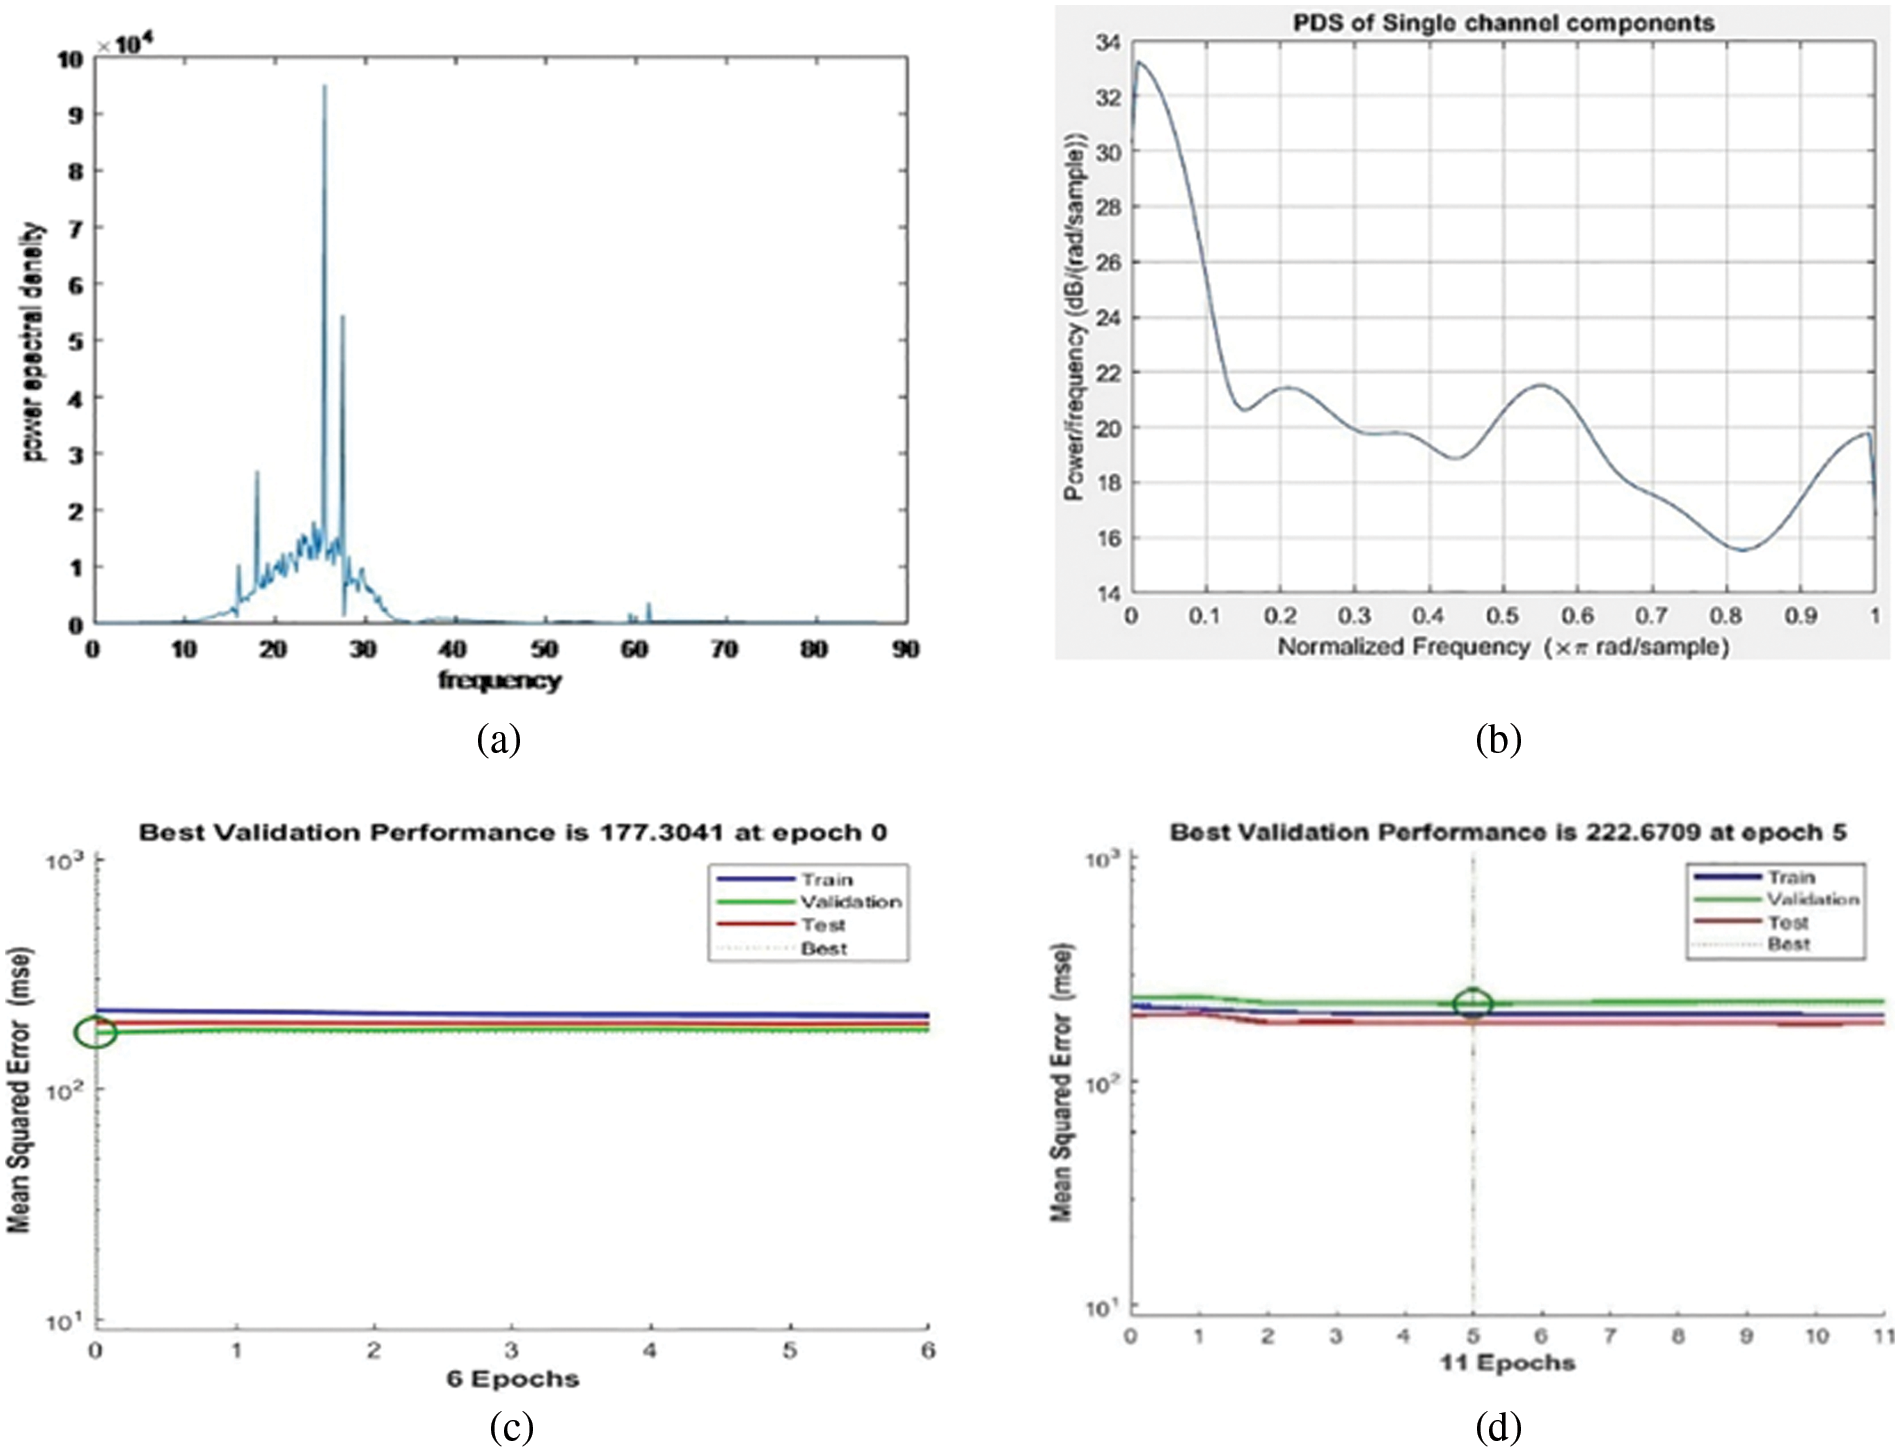
Figure 2: (a) PSD of frontal brain signal (b) PSD of selected channel parietal brain signal (c) MSE of frequency domain analysis (d) MSE of time-domain analysis
The confusion matrix plotted for both frontal and parietal region analysis allowed the proposed approach to perform a more detailed analysis of the performance of classifiers with respect to performance in individual classes when the numbers of observations in different classes vary greatly. The confusion matrix plotted in Figs. 3a and 3b shows the classification of time points for the frontal and parietal regions when the classification proposed in this algorithm attained its maximum point. These confusion matrices were constructed for fifty subjects. Based on the results obtained in this proposed algorithm, there was no misclassification ensured in this proposed algorithm. Therefore, the results of the confusion matrix prove that the classification of this proposed algorithm is more accurate than the existing algorithm. While confirming the objective of the proposed approach, a comparison of parietal signal analysis and frontal signal analysis proves that the values obtained from the Levenberg-Marquardt algorithm provide more accurate values than the existing literature system.
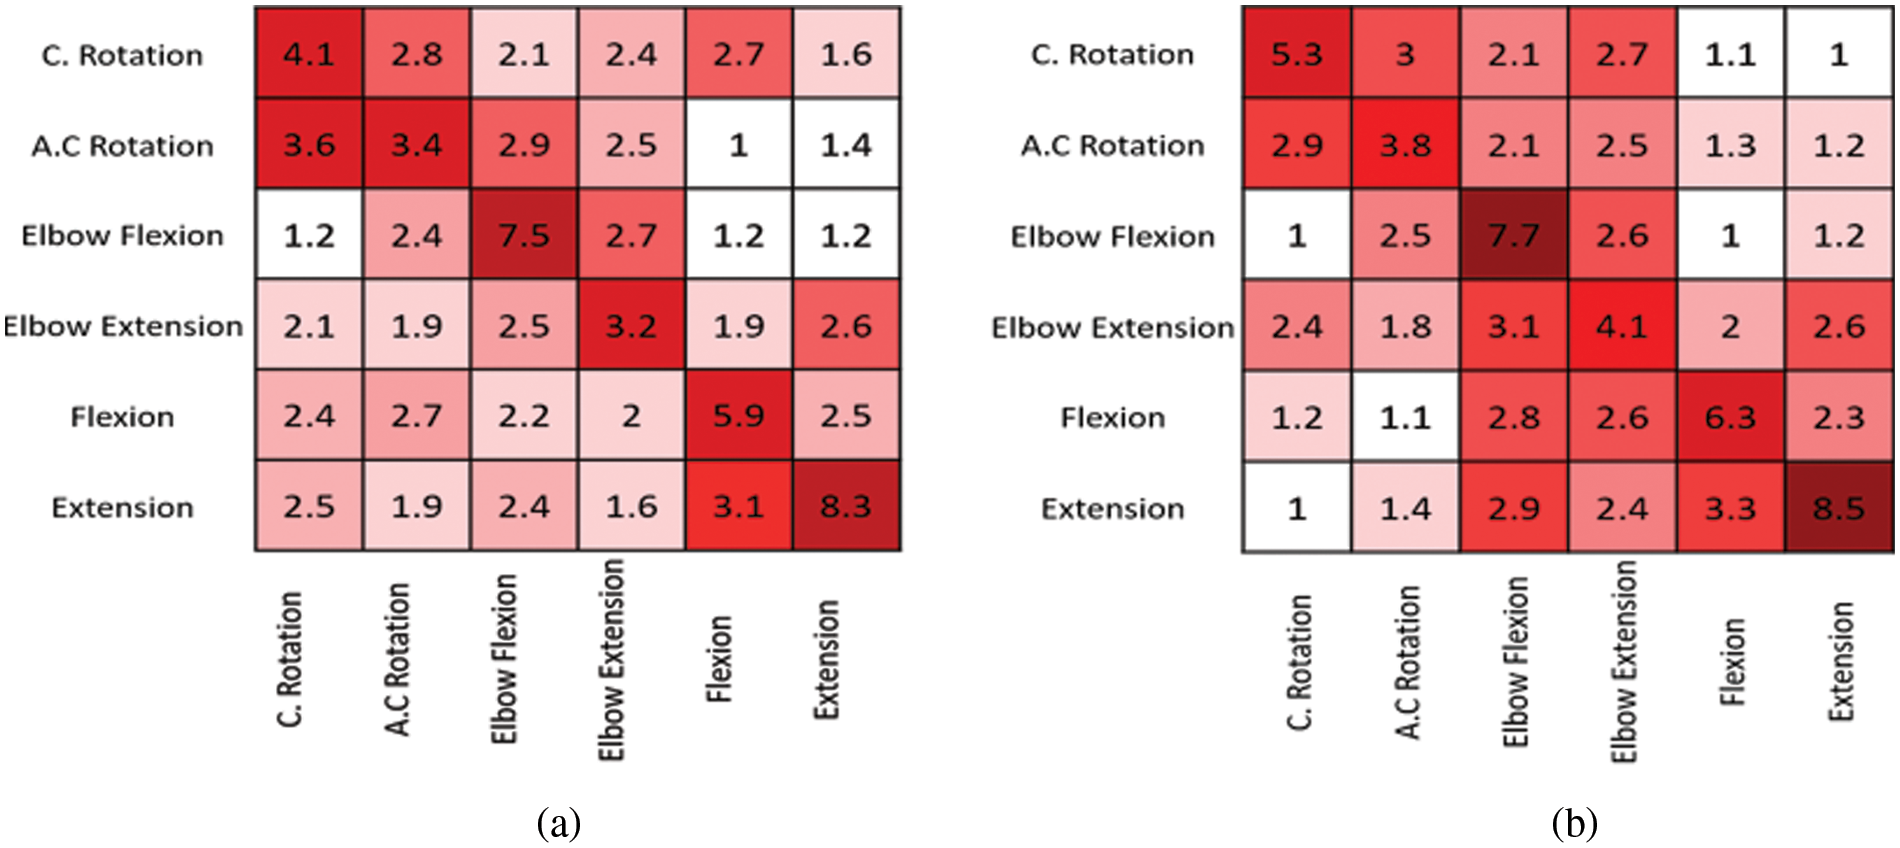
Figure 3: Confusion matrix for (a) frontal region (b) parietal region
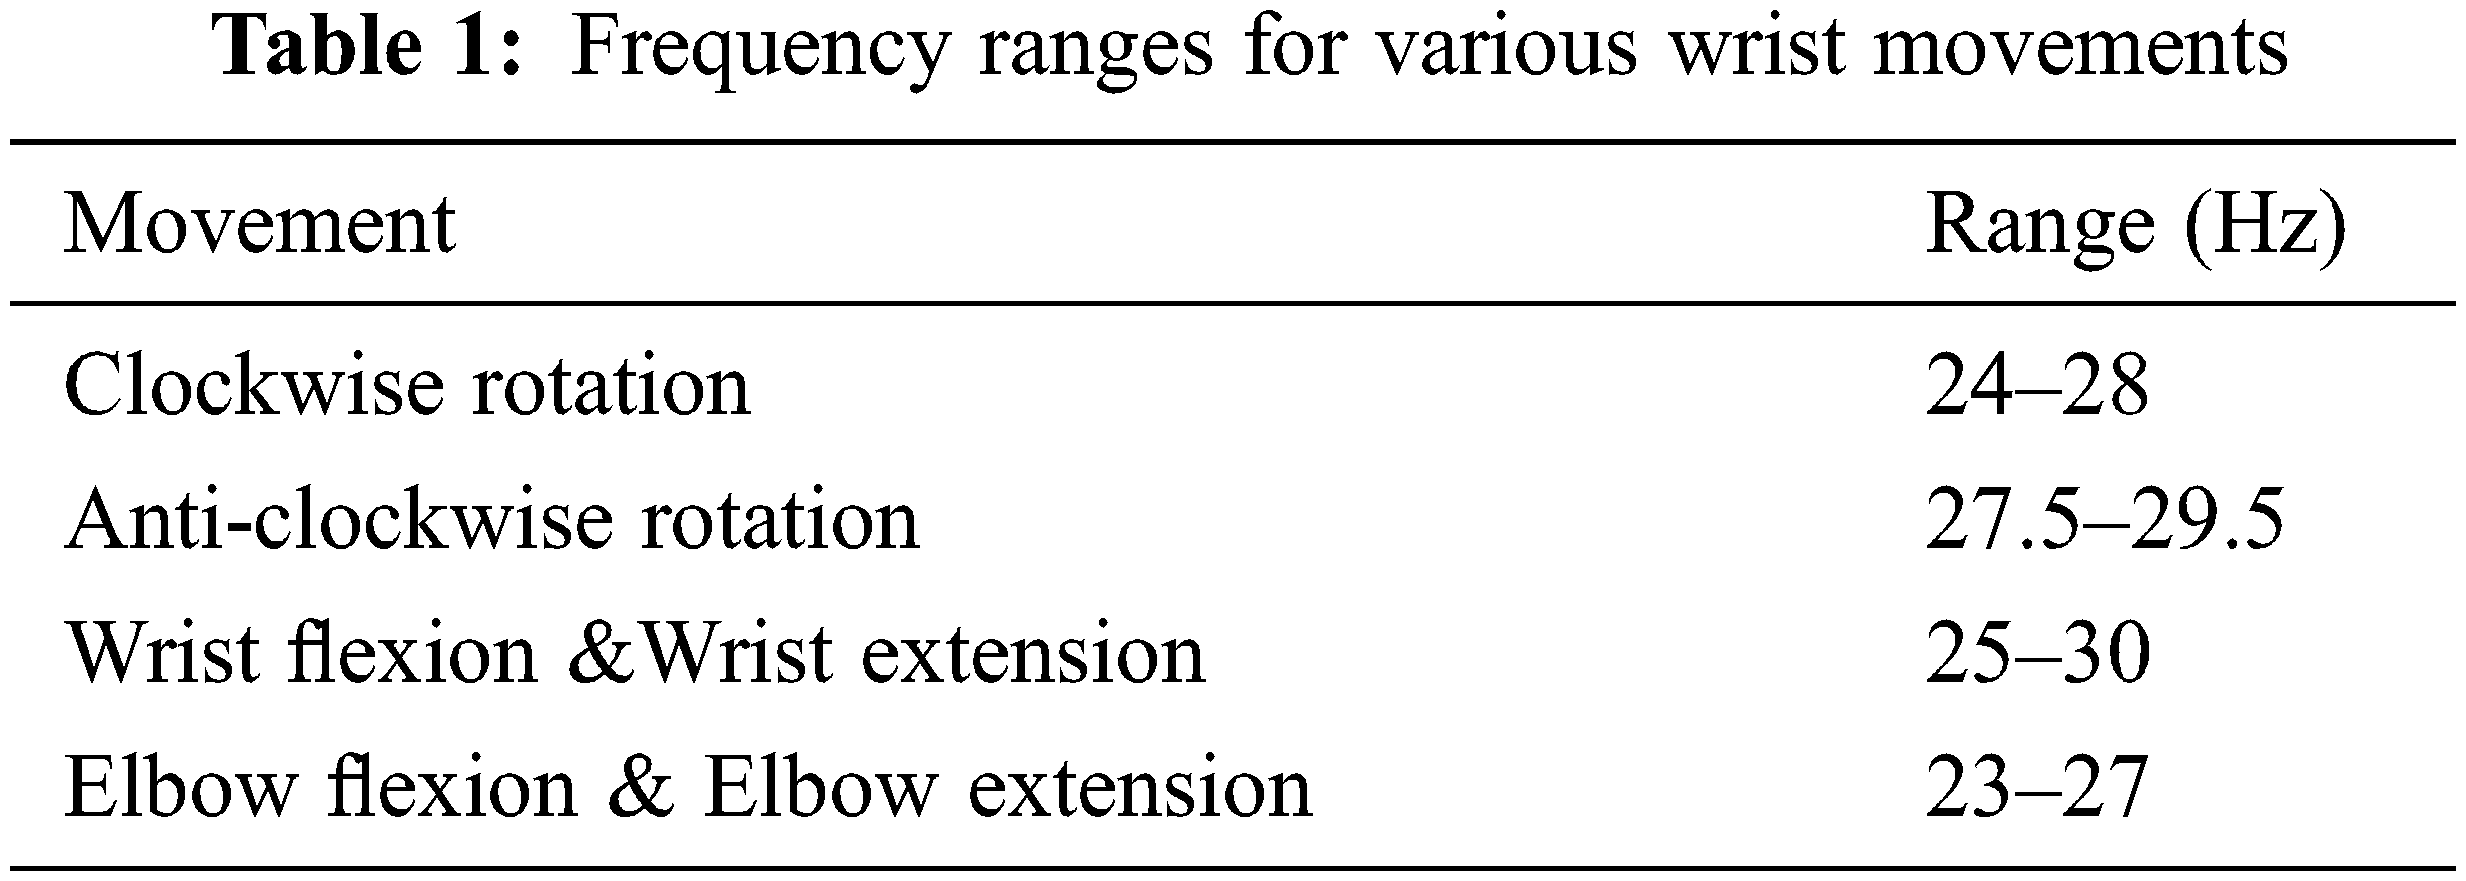
The frequency ranges obtained for processed and classified frontal brain signals are tabulated as shown in Table 1. These frequency ranges are then cross-verified with the results of already existing theories regarding alpha and beta waves responsible for motor activities merging from central and frontal regions. The frequency ranges obtained are approximately similar to existing articles.
EEG signals are non-stationary signals. Therefore, minute variations occurring during wrist and elbow movements cannot be recognized in FFT. On the other hand, to perform a better investigation of the variation of frequency, spectral analysis is performed using the Daubechies wavelet transform. As shown in Fig. 4, comparing current results for classification accuracy to other studies performed so far using various other classifiers [28,29], classification using the Levenberg-Marquardt algorithm achieves maximum accuracy. In addition, classification using the Levenberg-Marquardt algorithm in this approach gives the desired frequency range of the wrist and elbow movements, and it also exhibits the accuracy and specificity of the input signal. In the proposed approach, the average frontal brain signal frequency during various wrist and elbow movements is approximately 23–30 Hz and the parietal brain signal frequency is 25–31 Hz. Therefore, as anticipated from the analysis of both frontal and parietal brain signals, it is determined that “beta waves” (21–30 Hz) are more dominant during wrist and elbow movements. Simulation results are verified by applying various test procedures using a hybrid neural network. As anticipated, this proposed deep learning hybrid PatternNet increases the overall accuracy of classification of motor EEG signals and reduces computational complexity and setup time.
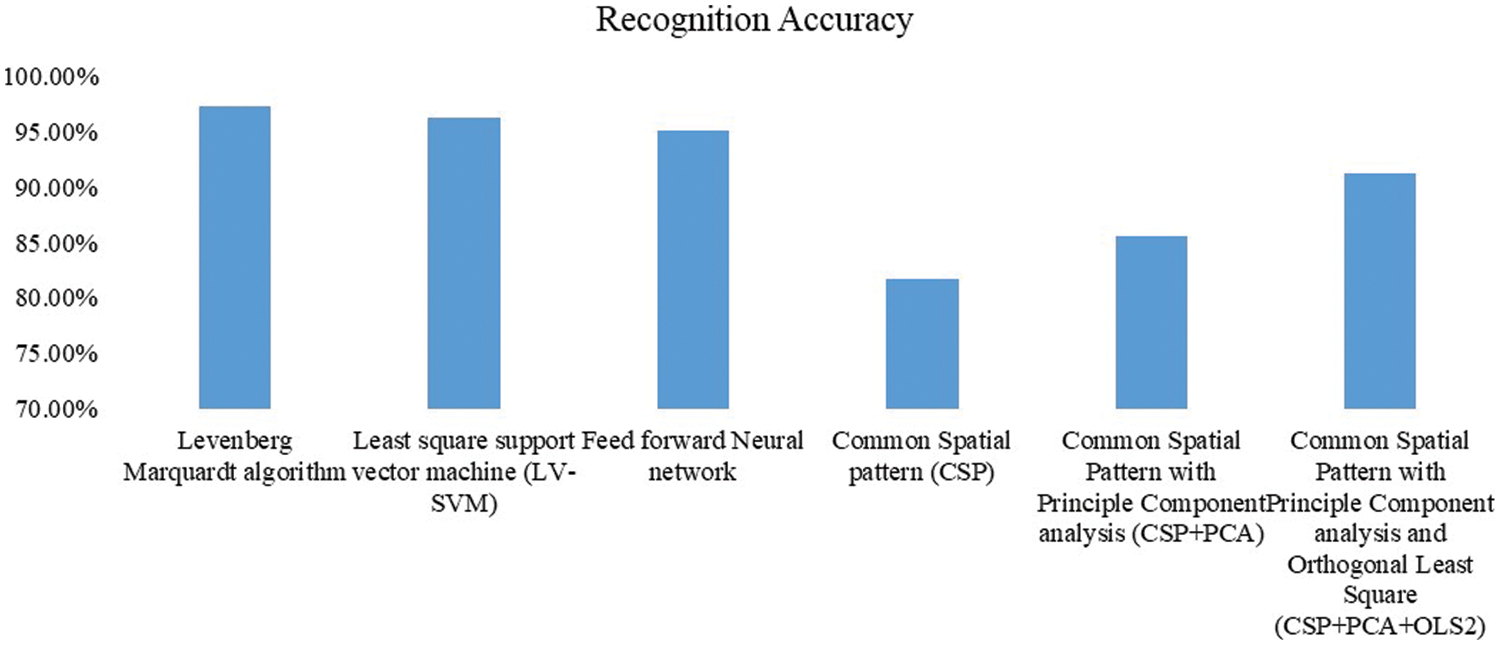
Figure 4: Accuracy of various classifiers
A robust statistical study of certain EEG channels that are primarily responsible for DOF was performed to construct a prototype of an arm controlled by brain signals. The threshold value to be set in the Arduino for various DOF is determined based on the study. The channels chosen are: F4C4, C4P4, P4O2, F3C3, C3P3, and P3O1. Wrist anticlockwise movement (ACL), wrist clockwise movement (CL), elbow extension (ELEX), elbow flexion (ELFL), wrist extension (EX), and wrist flexion (FL) are the DOF considered. The frequency-domain features examined are peak-to-peak value, skewness, kurtosis, mean, median, and SD.
The values of all channels are compared to analyse the fluctuation so that the optimal parameter for defining the Arduino threshold can be determined. Figs. 5a–5f present a graphical depiction of the results obtained during wrist anticlockwise movement, wrist clockwise movement, elbow extension, elbow flexion, wrist extension, and wrist flexion, respectively. The peak-to-peak values obtained during wrist clockwise movement are lower than those obtained during wrist anticlockwise movement. The skewness during elbow extension is close to zero, indicating that the distribution is approximately symmetrical and that the mean and median will be roughly equal [30]. The kurtosis, which is a method of assessing the variance in frequency and amplitude, is nearly equal in all the channels during elbow flexion. The peak-to-peak value of the signals when performing wrist extension is in the 59–69 range. The standard deviation, or departure of data from its mean, falls within a restricted range of 6–8. The standard deviation of the wrist extension movement is similar to that of the wrist flexion movement.
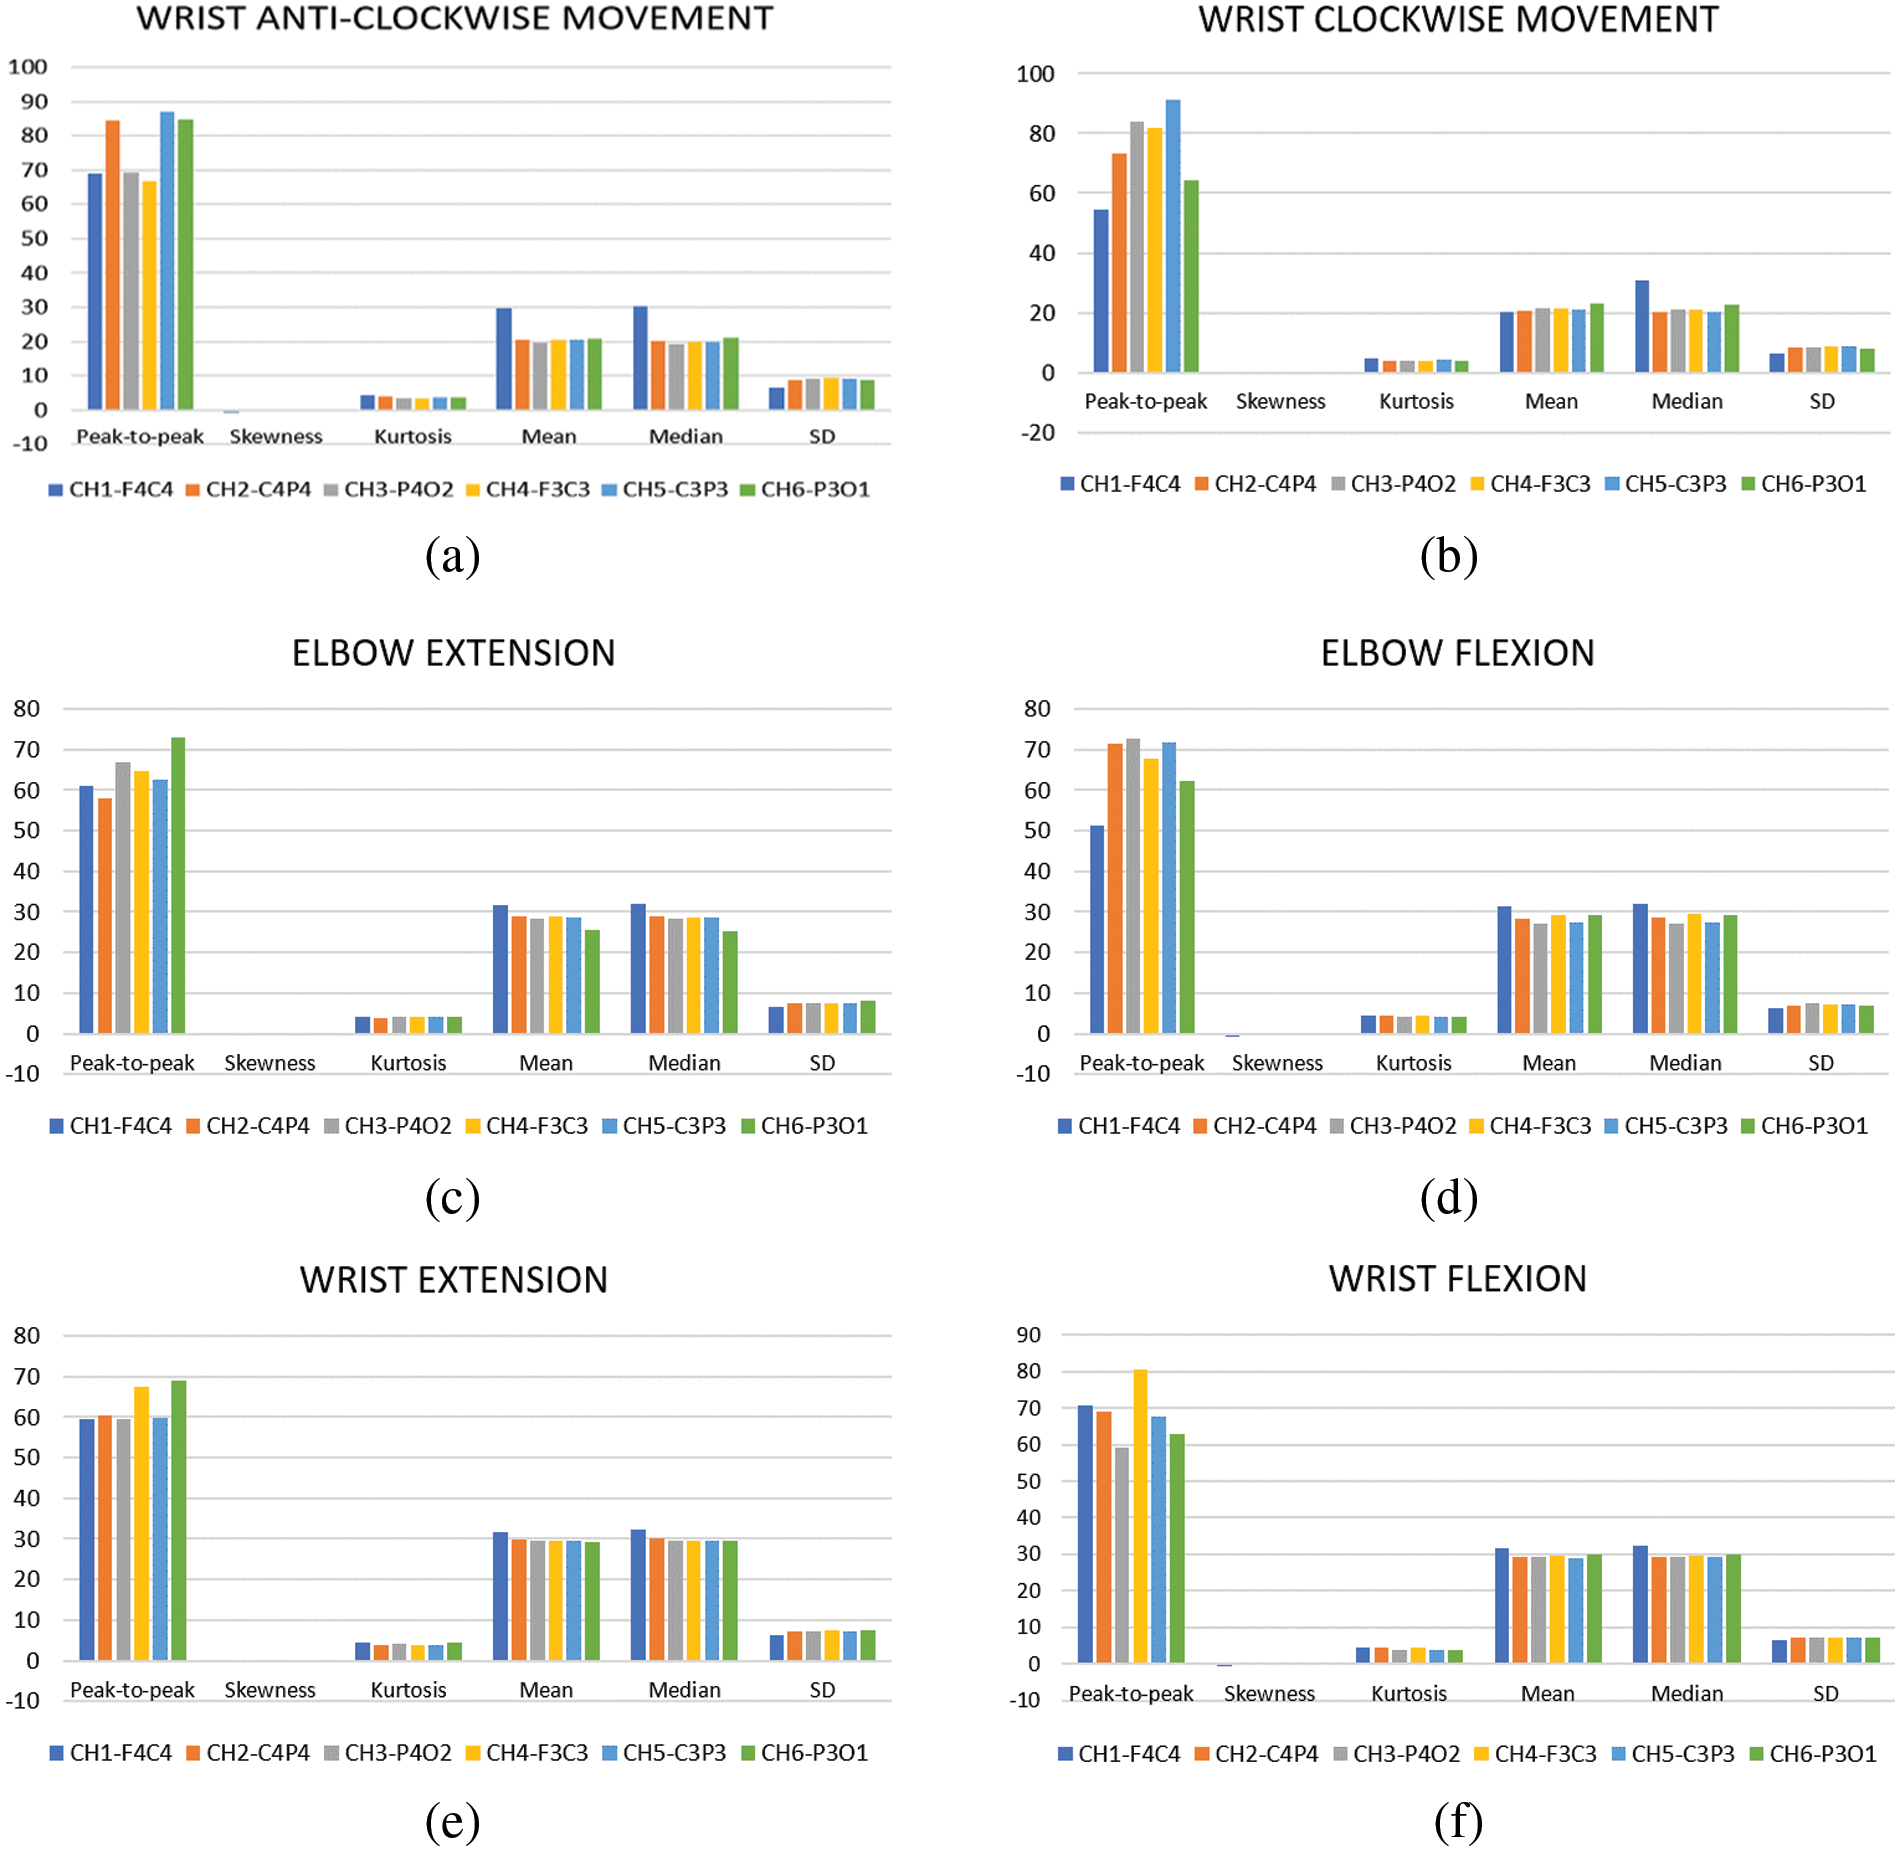
Figure 5: Statistical analysis of (a) wrist anticlockwise movement (b) wrist clockwise movement (c) elbow extension (d) elbow flexion (e) wrist extension (f) wrist flexion
To identify which parameter or parameters can be used to effectively distinguish between the various arm movements, the average of the features in all the channels is determined. The average values have been plotted in Fig. 6. After examining all of the parameters, the peak-to-peak value was found to have a wide range across all six DOF. The peak-to-peak value plays a significant role in arm movements. As a result, the peak-to-peak value of the frequency domain signal was taken into account in this proposed method. If there are any changes in the peak-to-peak value, it can be concluded that there is an increase in desynchronization and a decrease in synchronization in the beta band [31]. It indicates that there is a high chance of neurological disorders and can be used for diagnosing PD at an early stage.
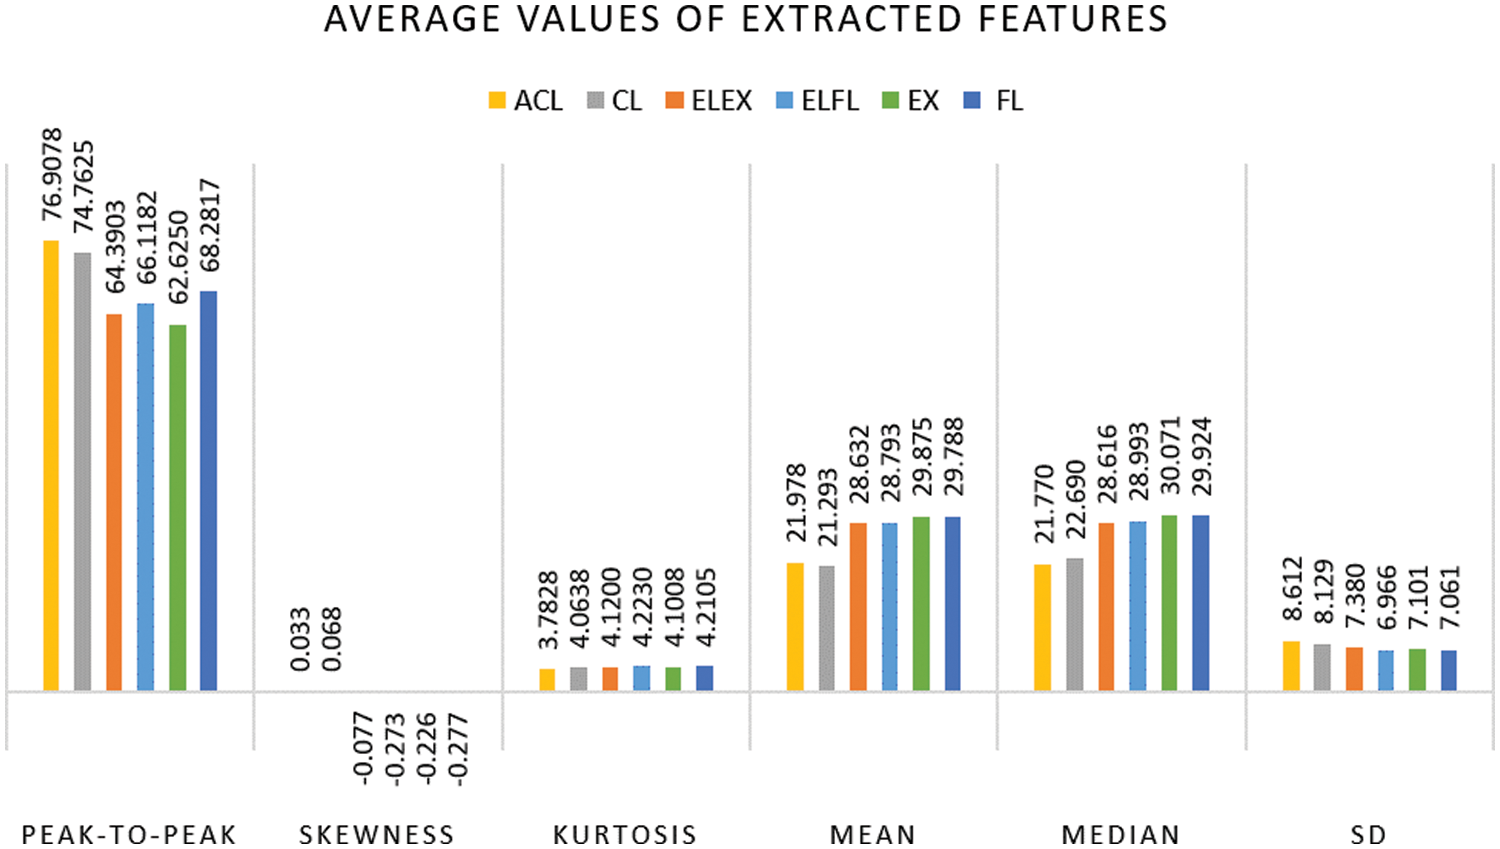
Figure 6: Average values of the extracted features
Fig. 7 shows a detailed study of the peak-to-peak levels of the signals in all channels during various DOF. The maximum peak-to-peak value obtained during wrist anticlockwise and clockwise movement come from channel 5-C3P3, as shown in Figs. 7a and 7b. Figs. 7c and 7d show that the average peak-to-peak values of elbow extension and elbow flexion are in the range of 64-67. Similarly, the average peak-to-peak values of wrist extension and flexion in Figs. 7e and 7f vary from 61 to 70. The results of this research are utilized to calculate a threshold value for the Arduino.
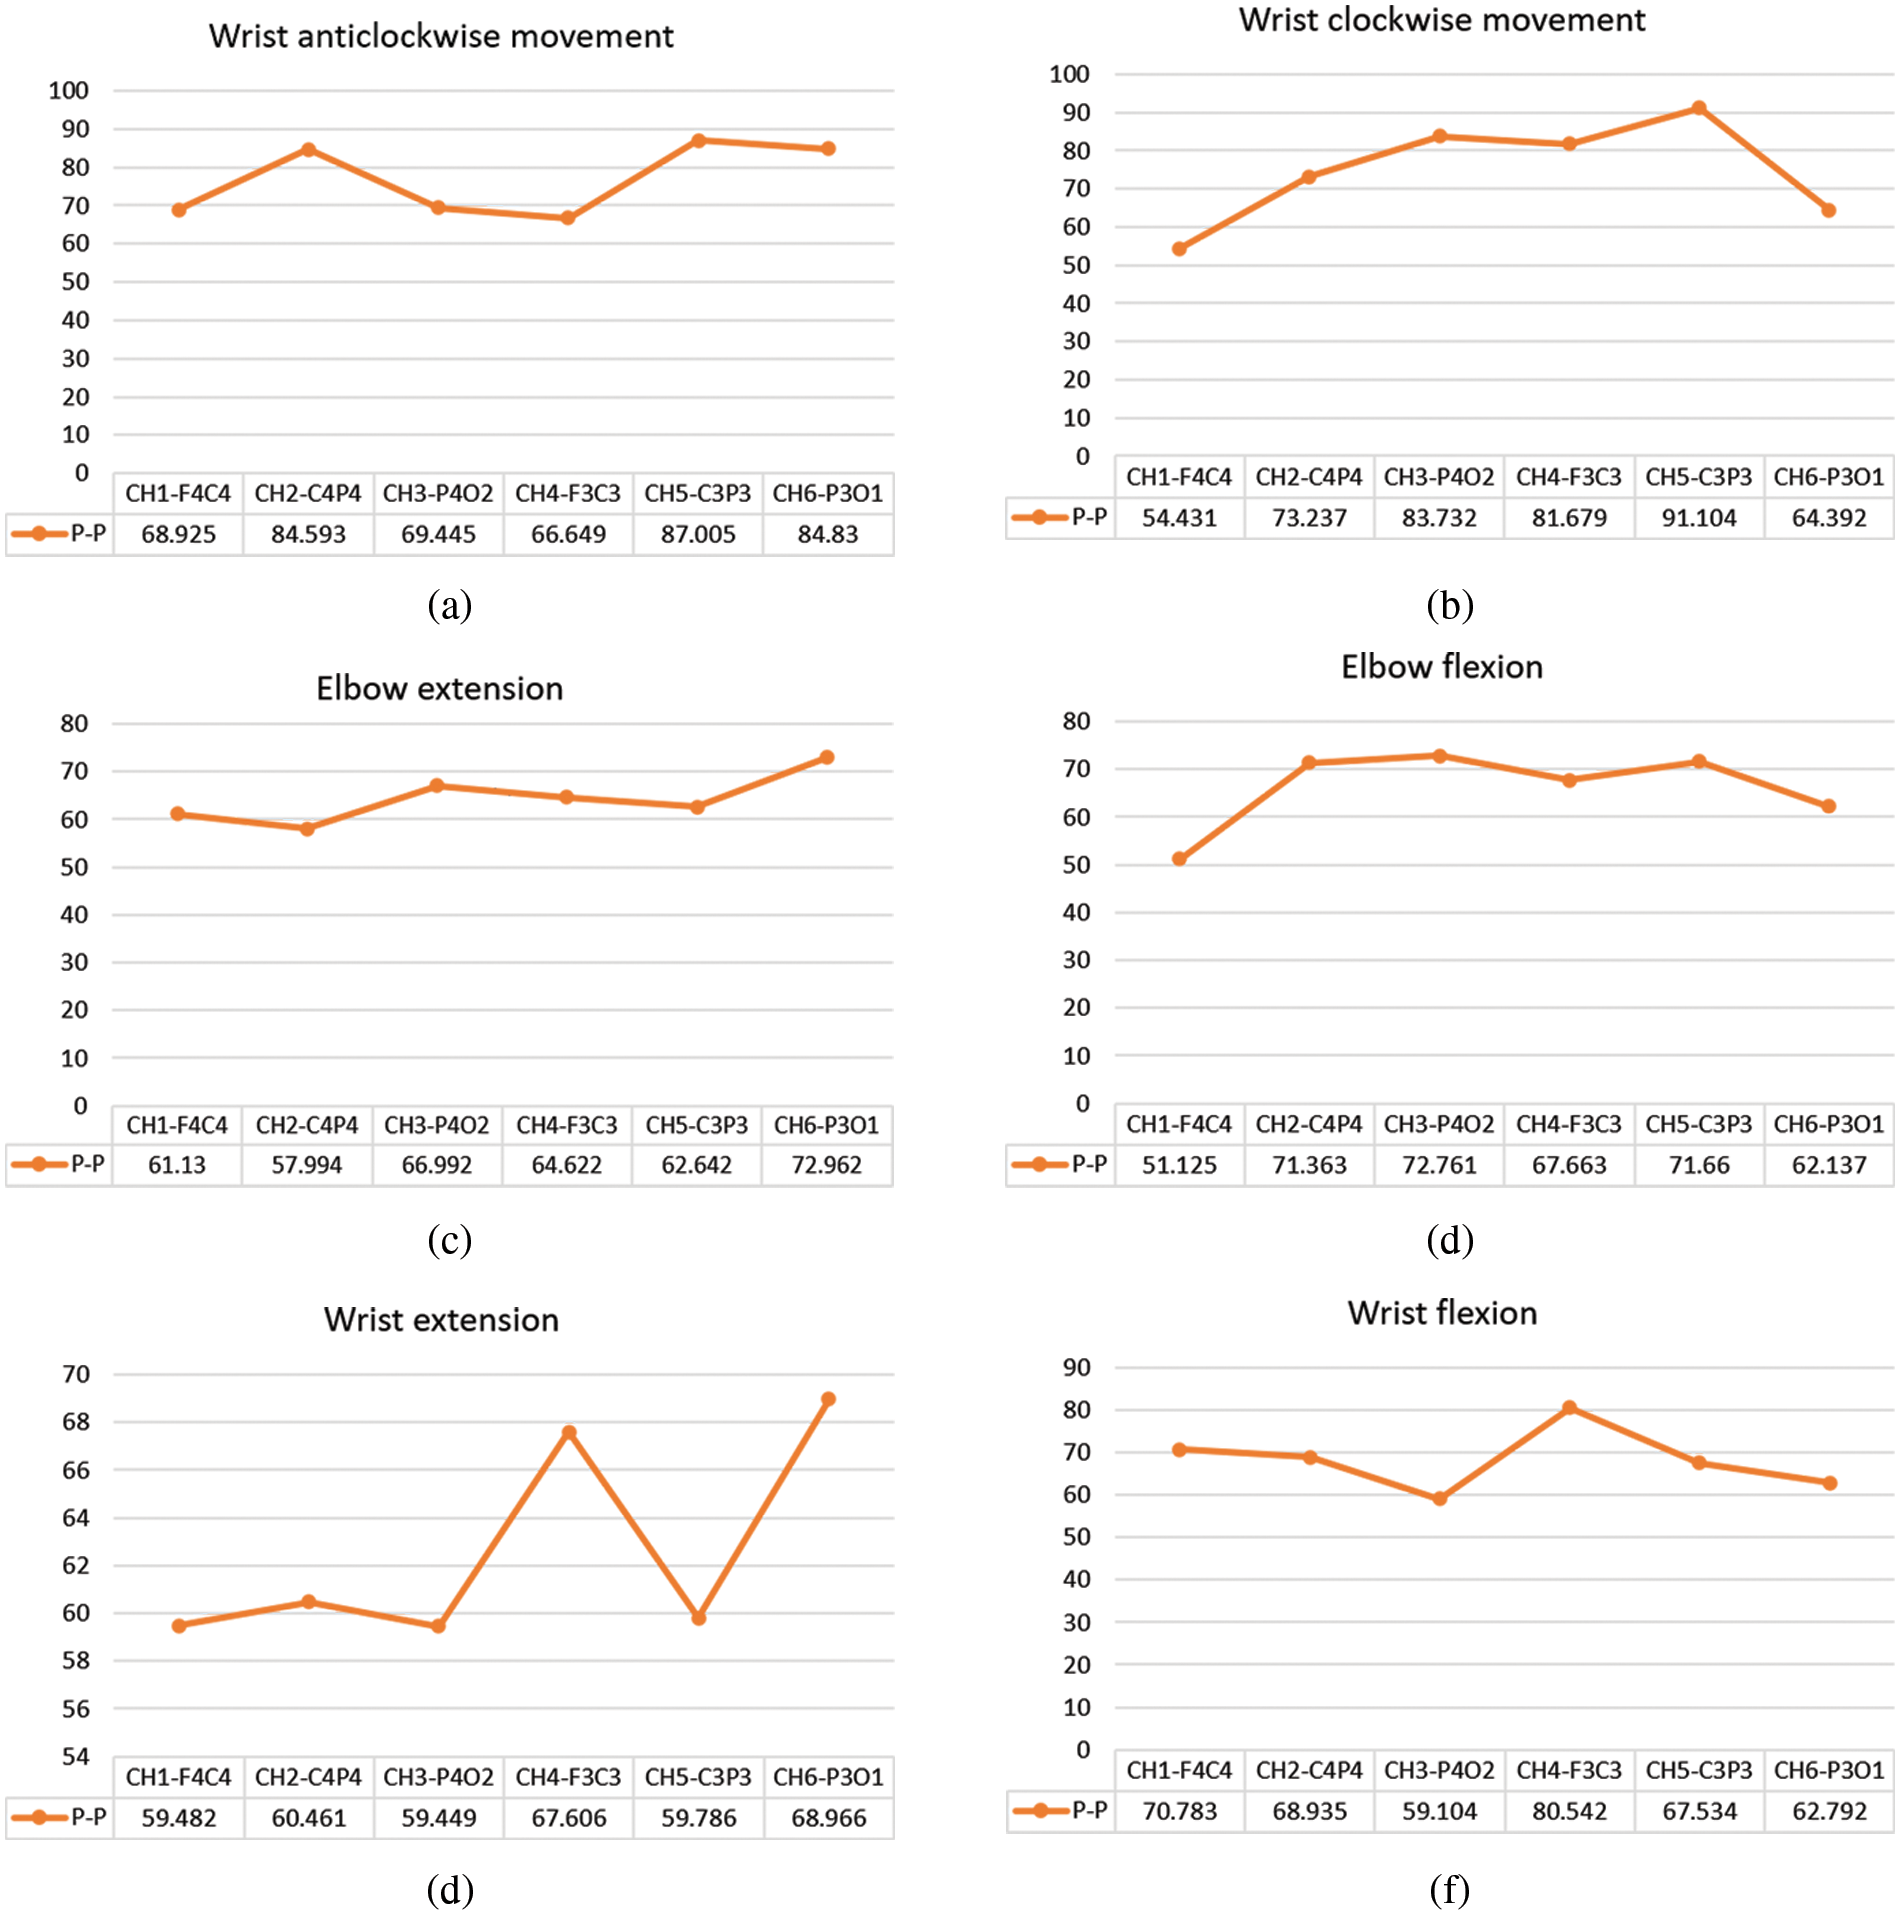
Figure 7: Peak-to-peak values of (a) wrist anticlockwise movement (b) wrist clockwise movement (c) elbow extension (d) elbow flexion (e) wrist extension (f) wrist flexion
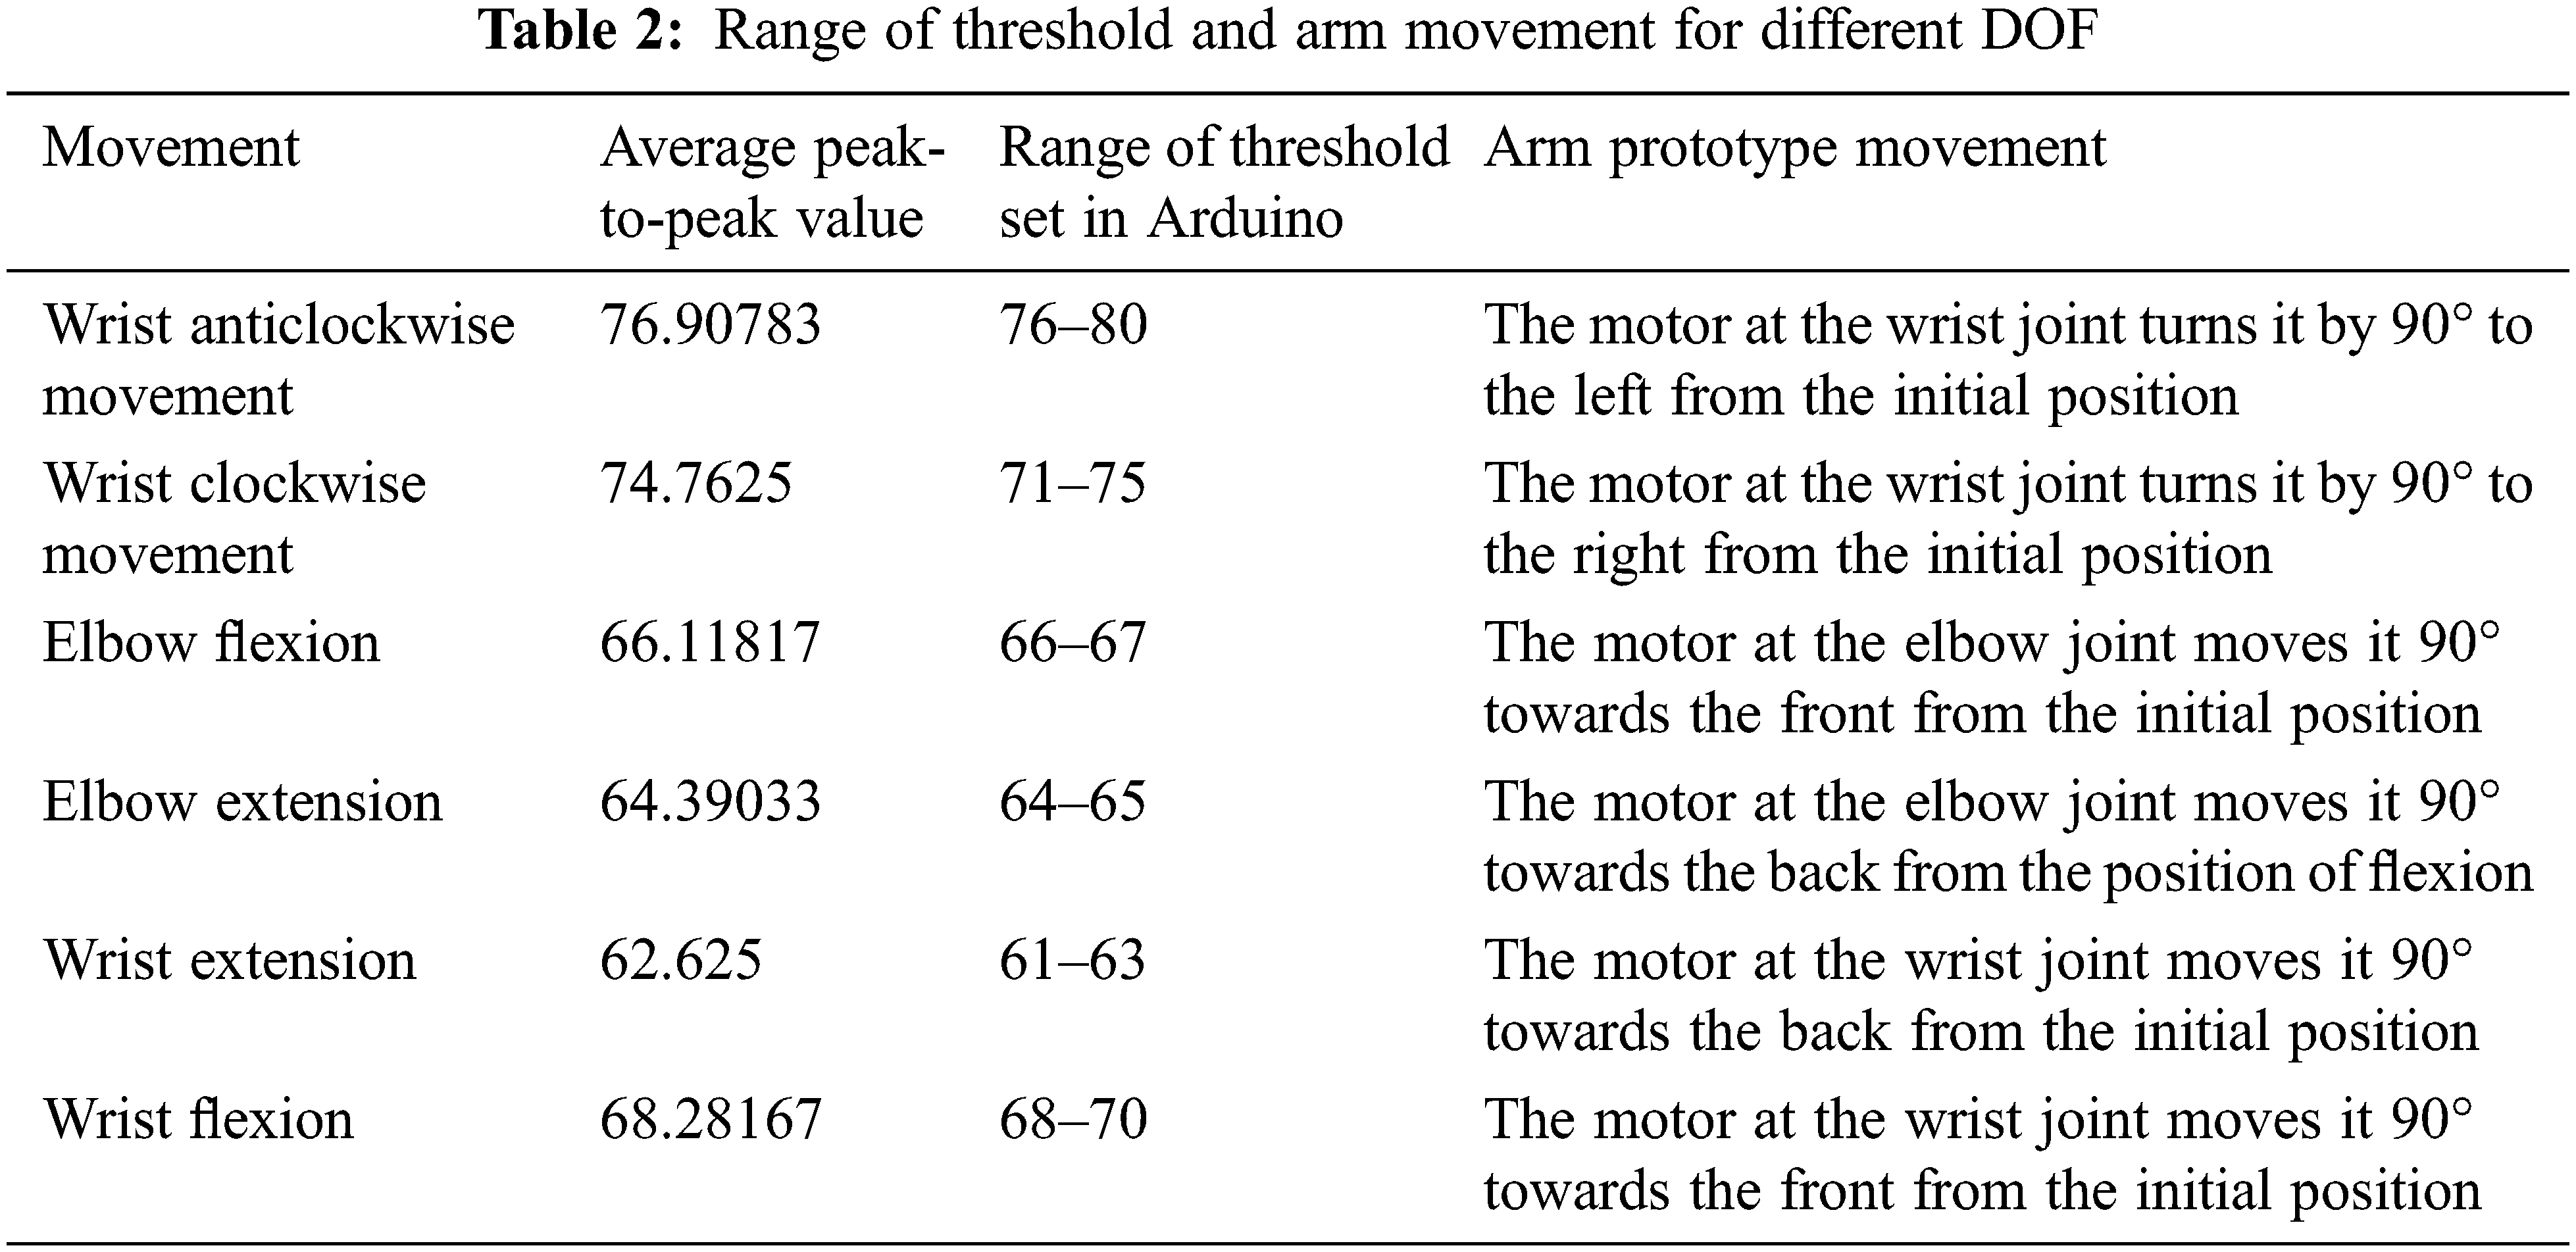
From the above analysis, the threshold value that can distinguish between the various movements was determined and set in the Arduino based on the calculated values [32,33]. Table 2 shows the peak-to-peak value used to compute the threshold and the range of thresholds defined in the Arduino, and the movement of the prototype arm is given. The system acquires and processes the real-time EEG signal. The average of the peak-to-peak values is computed and provided as input to the Arduino. The input is compared to the values coded in the Arduino. The arm prototype performs the movement for that corresponding limit after the input is matched with the threshold value by moving the servo motor to appropriate angles [34]. For instance, if the input peak-to-peak value is between 76–80, the movement will be wrist anticlockwise. The Arduino matches this value with the already set threshold and performs the anticlockwise movement of the wrist by rotating the motor at the wrist by 90° towards the left. Similarly, other movements are performed as listed in Table 2.
The same is implemented, and the findings are validated using the robotic arm that was constructed. Fig. 8a depicts the entire experimental setup, including the EEG electrodes connected to the subject, the prototype arm, PC, and the Arduino setup. The person is in a resting position in this illustration, and therefore the prototype arm is motionless. Figs. 8b and 8c show the elbow flexion and elbow extension performed by the subject and the corresponding movement of the prototype arm. Similarly, all the DOF listed above are achieved by the robotic arm, which confirms results acquired through statistical analysis of brain signals while performing hand movements. A five DOF robotic arm control interface based on electrooculogram signals has been created in prior work [35]. Similarly, controlled motion of a five DOF robotic arm using electromyogram signals and control of a four DOF robotic arm using EEG signals have been achieved [36,37]. The proposed system achieves six DOF of the prototype arm using real-time EEG signals.
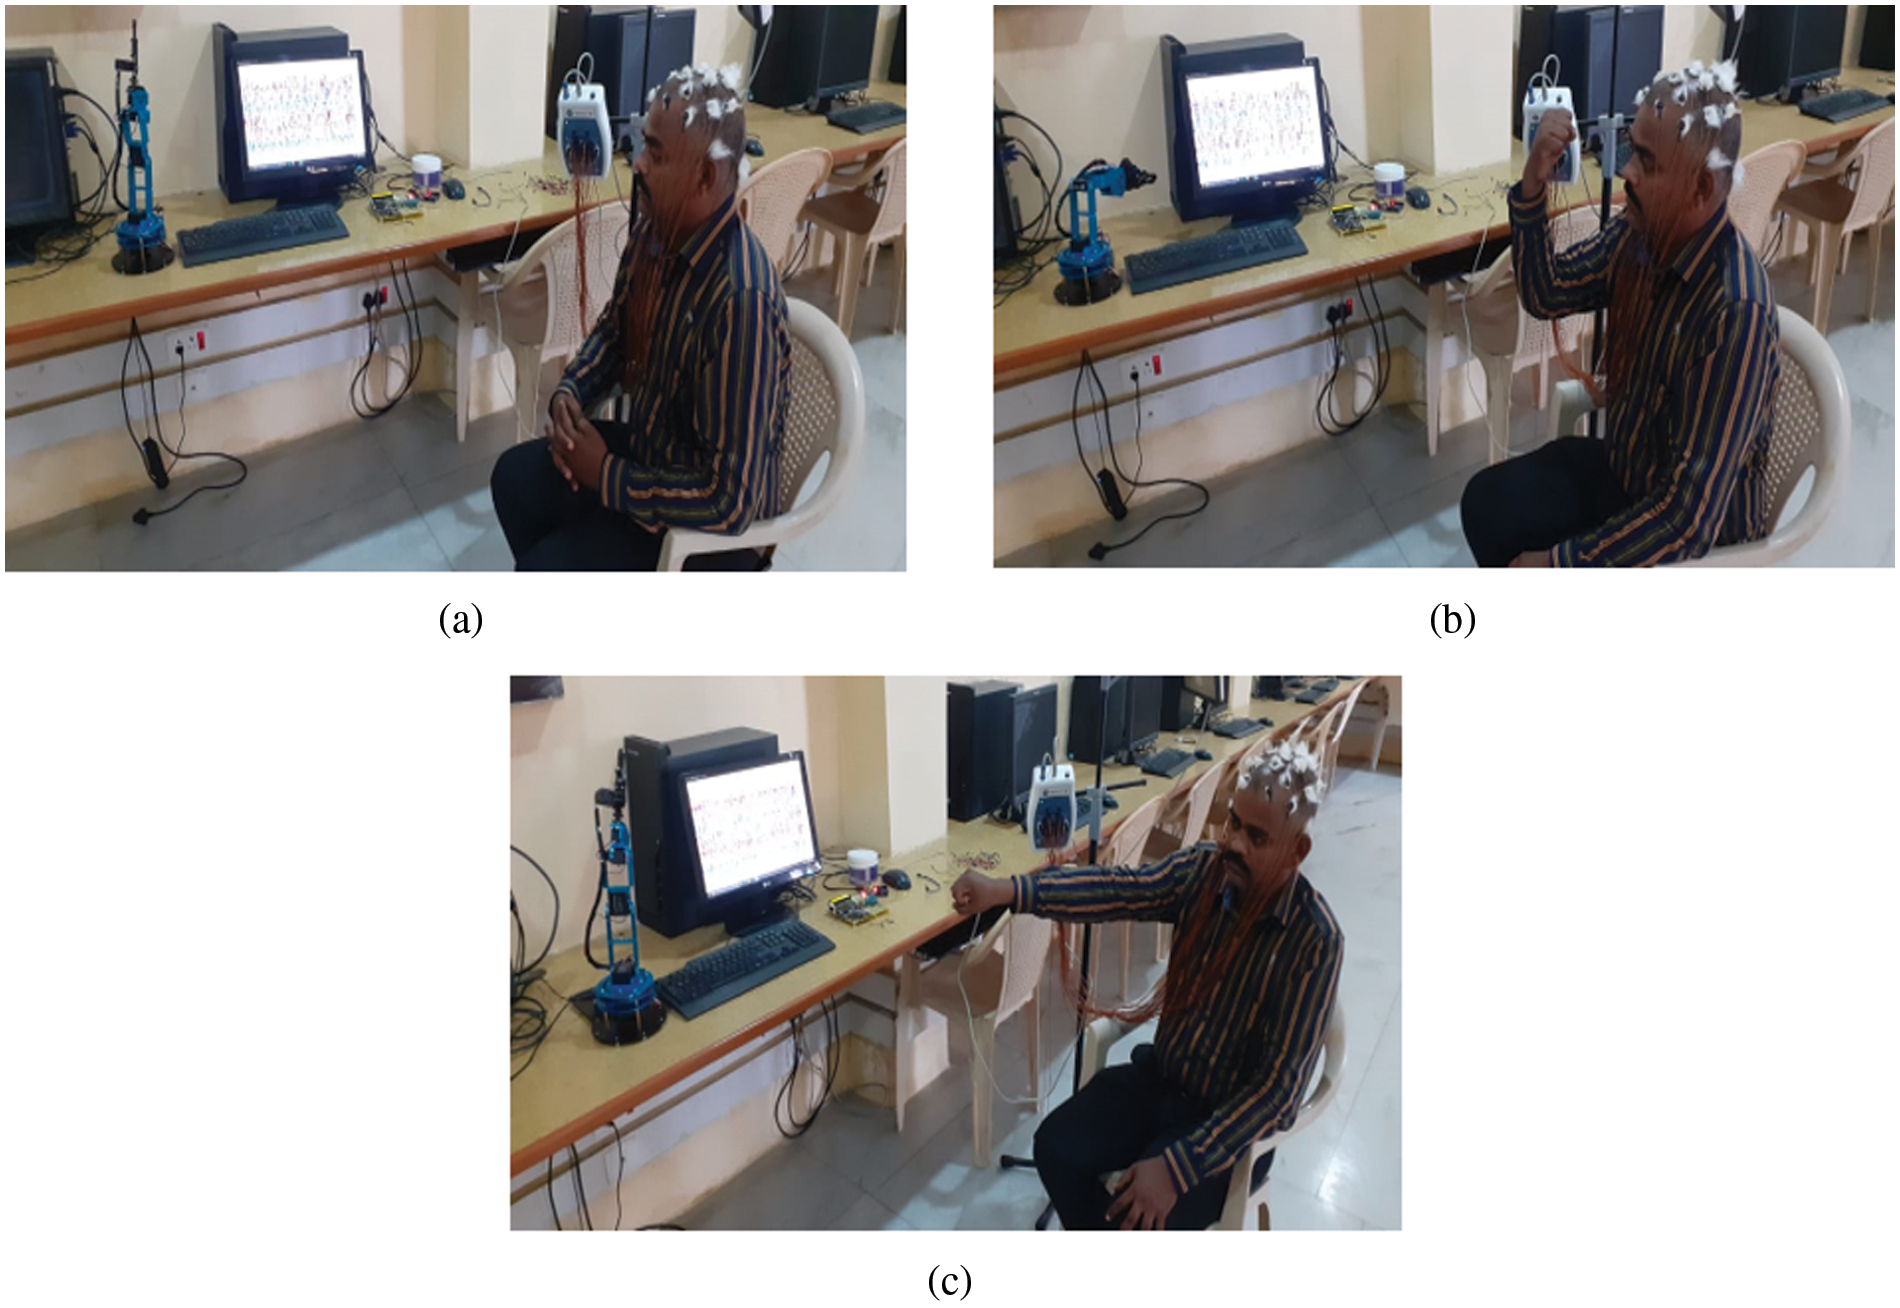
Figure 8: (a) Arm in resting position (b) Elbow flexion of prototype arm (c) Elbow extension of prototype arm
To conclude, the novel design to analyse the role of parietal signal and its classification using EEG analysis of wrist and elbow movement prediction has been successfully implemented using MATLAB software. The use of FFT for feature extraction has helped us find a certain EEG range of 22–30 Hz for the attempted moves, specifically the wrist and elbow movements (clockwise rotation, anticlockwise rotation, elbow flexion, elbow extension, wrist flexion, and wrist extension). The obtained frequency ranges were seen to vary depending on the physiological changes of the individual being put through the EEG test. These frequency ranges were cross-checked with the already existing theory about the alpha and beta waves responsible for motor activities merging from the central and frontal regions. The outputs of this approach provide us with definite performance measures such as accuracy, specificity, and errors in the classification, which certainly show us the quality of the input signal and the classifier used in this approach. The exact range of detection was ameliorated through the thorough statistical analysis of the output. Furthermore, the statistical analysis of the obtained frequency was validated using a prototype arm, and all the movements were achieved. The strategic objective of this work is to employ these trained and tested frequencies in an effective method to analyse the slowly fluctuating motions of the arm for PD patients during tremor analysis. Since it is found that the beta waves are more prominent during wrist and elbow movement, identifying variations in the frequencies while executing different hand movements would aid in the diagnosis of PD.
Acknowledgement: The authors acknowledge support from Sathyabama Institute of Science and Technology for providing research facilities and encouragement for technical assistance to complete the work.
Funding Statement: This research did not receive any specific grant from funding agencies in the public, commercial, or not-for-profit sectors.
Conflicts of Interest: The authors declare that they have no conflicts of interest to report regarding the present study.
References
1. G. Umashankar, V. Juliet and S. Santhosh, “Brain-computer interface for the movement of wheel chair based on visual stimuli for paralyzed person,” Biomedicine (India), vol. 38, no. 3, pp. 384–389, 2018. [Google Scholar]
2. M. F. Mridha, S. C. Das, M. M. Kabir, A. A. Lima, M. R. Islam et al., “Brain-computer interface: Advancement and challenges,” Sensors (Basel, Switzerland), vol. 21, no. 17, pp. 1–46, 2021. [Google Scholar]
3. P. Pandey and K. R. Seeja, “Subject independent emotion recognition system for people with facial deformity: An EEG based approach,” Journal of Ambient Intelligence and Humanized Computing, vol. 12, no. 2, pp. 2311–2320, 2021. [Google Scholar]
4. G. Umashankar, A. V. Juliet and G. H. Krishnan, “Elbow joints for upper-limb prosthesis: Analysis of biomedical EEG signals using discrete wavelet transform,” International Journal of Engineering Trends and Technology, vol. 70, no. 7, pp. 190–197, 2022. [Google Scholar]
5. J. Barone and H. E. Rossiter, “Understanding the role of sensorimotor beta oscillations,” Frontiers in Systems Neuroscience, vol. 15, pp. 1–7, 2021. [Google Scholar]
6. N. Jrad, A. Kachenoura, I. Merlet, F. Bartolomei, A. Nica et al., “Automatic detection and classification of high-frequency oscillations in depth-EEG signals,” IEEE Transactions on Biomedical Engineering, vol. 64, no. 9, pp. 2230–2240, 2017. [Google Scholar] [PubMed]
7. S. Nishida, M. Nakamura and H. Shibasaki, “An EEG model expressed by the sinusoidal waves with the Markov process amplitude,” Japanese Journal of Medical Electronics and Biological Engineering, vol. 24, no. 1, pp. 8–14, 1986. [Google Scholar] [PubMed]
8. S. R. Cole and B. Voytek, “Brain oscillations and the importance of waveform shape,” Trends in Cognitive Sciences, vol. 21, no. 2, pp. 137–149, 2017. [Google Scholar] [PubMed]
9. D. Lisogurski and G. E. Birch, “Identification of finger flexions from continuous EEG as a brain computer interface,” in Proc. of the 20th Annual Int. Conf. of the IEEE Engineering in Medicine and Biology Society, Hong Kong, China, vol. 4, pp. 2004–2007, 1998. [Google Scholar]
10. Z. Bozorgzadeh, G. E. Birch and S. G. Mason, “The LF-ASD brain computer interface: On-line identification of imagined finger flexions in the spontaneous EEG of able-bodied subjects,” in Proc. of the 2000 IEEE Int. Conf. on Acoustics, Speech, and Signal Processing, Istanbul, Turkey, vol. 4, pp. 2385–2388, 2000. [Google Scholar]
11. Y. Li, X. Gao, H. Liu and S. Gao, “Classification of single-trial electroencephalogram during finger movement,” IEEE Transactions on Biomedical Engineering, vol. 51, no. 6, pp. 1019–1025, 2004. [Google Scholar] [PubMed]
12. Y. Wang, S. Gao and X. Gao, “Common spatial pattern method for channel selection in motor imagery based brain-computer interface,” in Proc. of the 27th Annual Conf. of the IEEE Engineering in Medicine and Biology, Shanghai, China, vol. 7, pp. 5392–5395, 2005. [Google Scholar]
13. T. Shiratori, H. Tsubakida, A. Ishiyama and Y. Ono, “Three-class classification of motor imagery EEG data including ‘rest state’ using filter-bank multi-class common spatial pattern,” in Proc. of the 3rd Int. Winter Conf. on Brain-Computer Interface, Gangwon, South Korea, pp. 14–17, 2015. [Google Scholar]
14. M. Mohammadi and M. R. Mosavi, “Improving the efficiency of an EEG-based brain computer interface using filter bank common spatial pattern,” in Proc. of the 2017 IEEE 4th Int. Conf. on Knowledge-Based Engineering and Innovation, Tehran, Iran, pp. 878–882, 2018. [Google Scholar]
15. S. C. Liao, C. T. Wu, H. C. Huang, W. T. Cheng and Y. H. Liu, “Major depression detection from EEG signals using kernel eigen-filter-bank common spatial patterns,” Sensors (Switzerland), vol. 17, no. 6, pp. 1–18, 2017. [Google Scholar]
16. G. Yilmaz, P. Ungan, O. Sebik, P. Uginğius and K. S. Türker, “Interference of tonic muscle activity on the EEG: A single motor unit study,” Frontiers in Human Neuroscience, vol. 8, no. 504, pp. 1–11, 2014. [Google Scholar]
17. V. V. Ramalingam, S. Mohan, B. R. J. Vadhanam and V. Sugumaran, “Classification of EEG signals for prosthetic limb movements with ARMA features using C4.5 decision tree algorithm,” Indian Journal of Science and Technology, vol. 9, no. 47, pp. 1–11, 2016. [Google Scholar]
18. A. Shakeel, M. S. Navid, M. N. Anwar, S. Mazhar, M. Jochumsen et al., “A review of techniques for detection of movement intention using movement-related cortical potentials,” Computational and Mathematical Methods in Medicine, vol. 2015, no. 18, pp. 1–13, 2015. [Google Scholar]
19. G. Umashankar, V. Juliet and S. Santhosh, “Acquiring and processing of female EEG signals of various wrist movements for neuro prosthetic applications,” International Journal of Engineering and Technology, vol. 7, no. 2.25, pp. 154–159, 2018. [Google Scholar]
20. J. G. Proakis and D. G. Manolakis, “The discrete fourier transform: Its properties and applications,” in Digital Signal Processing, 4th edition, Upper Saddle River, NJ, USA: Pearson Prentice Hall, pp. 394–445, 2006. [Google Scholar]
21. G. Lindfield and J. Penny, “Analyzing data using discrete transforms,” in Numerical Methods, 4th edition, USA: Academic Press, pp. 383–431, 2019. [Google Scholar]
22. M. Fraiwan, M. Alafeef and F. Almomani, “Gauging human visual interest using multiscale entropy analysis of EEG signals,” Journal of Ambient Intelligence and Humanized Computing, vol. 12, no. 2, pp. 2435–2447, 2021. [Google Scholar]
23. C. S. Burrus, R. A. Gopinath and H. Guo, “Introduction to wavelets,” in: Introduction to Wavelets and Wavelet Transforms: A Primer, New Jersey, USA: Prentice Hall, pp. 5–14, 1998. [Google Scholar]
24. L. Cheng, D. Li, X. Li and S. Yu, “The optimal wavelet basis function selection in feature extraction of motor imagery electroencephalogram based on wavelet packet transformation,” IEEE Access, vol. 7, pp. 174465–174481, 2019. [Google Scholar]
25. G. Mohanbabu, S. Anupallavi and S. R. Ashokkumar, “An optimized deep learning network model for EEG based seizure classification using synchronization and functional connectivity measures,” Journal of Ambient Intelligence and Humanized Computing, vol. 12, no. 7, pp. 7139–7151, 2021. [Google Scholar]
26. S. Deivasigamani, C. Senthilpari and W. H. Yong, “Machine learning method based detection and diagnosis for epilepsy in EEG signal,” Journal of Ambient Intelligence and Humanized Computing, vol. 12, no. 3, pp. 4215–4221, 2021. [Google Scholar]
27. A. Baghdadi, Y. Aribi, R. Fourati, N. Halouani, P. Siarry et al., “Psychological stimulation for anxious states detection based on EEG-related features,” Journal of Ambient Intelligence and Humanized Computing, vol. 12, no. 8, pp. 8519–8533, 2021. [Google Scholar]
28. M. T. Sadiq, X. Yu, Z. Yuan, Z. Fan, A. U. Rehman et al., “Motor imagery EEG signals classification based on mode amplitude and frequency components using empirical wavelet transform,” IEEE Access, vol. 7, pp. 127678–127692, 2019. [Google Scholar]
29. M. G. Tsipouras, “Spectral information of EEG signals with respect to epilepsy classification,” Eurasip Journal on Advances in Signal Processing, vol. 2019, no. 1, pp. 1–17, 2019. [Google Scholar]
30. A. H. Mooij, B. Frauscher, J. Gotman and G. Huiskamp, “A skew-based method for identifying intracranial EEG channels with epileptic activity without detecting spikes, ripples, or fast ripples,” Clinical Neurophysiology, vol. 131, no. 1, pp. 183–192, 2020. [Google Scholar] [PubMed]
31. E. L. Stegemöller, D. P. Allen, T. Simuni and C. D. MacKinnon, “Motor cortical oscillations are abnormally suppressed during repetitive movement in patients with Parkinson’s disease,” Clinical Neurophysiology, vol. 127, no. 1, pp. 664–674, 2016. [Google Scholar]
32. S. Abdullah, M. A. Khan, M. Serpelloni and E. Sardini, “Hybrid EEG-EMG based brain computer interface (BCI) system for real-time robotic arm control,” Advanced Materials Letters, vol. 10, no. 1, pp. 35–40, 2019. [Google Scholar]
33. S. Sankaran, “Robotic arm for the easy mobility of amputees using EMG signals,” International Journal of Innovative Technology and Exploring Engineering, vol. 9, no. 2S2, pp. 926–932, 2019. [Google Scholar]
34. M. Salama and A. Bakr, “Six prosthetic arm movements using electromyogram signals: A prototype,” in Proc. of the 2016 UKSim-AMSS 18th Int. Conf. on Computer Modelling and Simulation, Cambridge, United Kingdom, pp. 37–42, 2016. [Google Scholar]
35. B. Champaty, S. Nayak and K. Pal, “Development of an electrooculogram-based human-computer interface for hands-free control of assistive devices,” International Journal of Innovative Technology and Exploring Engineering, vol. 8, no. 4S, pp. 376–386, 2019. [Google Scholar]
36. S. Gowtham, K. M. A. Krishna, T. Srinivas, R. G. P. Raj and A. Joshuva, “EMG-based control of a 5 DOF robotic manipulator,” in Proc. of the 2020 Int. Conf. on Wireless Communications Signal Processing and Networking, Chennai, India, pp. 52–57, 2020. [Google Scholar]
37. A. Maassarani, I. Akoğlu, I. Hoballah, N. Absi, Y. Corky et al., “EEG controlled robotic arm,” Bachelor’s Thesis, Bahçeşehir university, Istanbul, 2021. [Google Scholar]
Cite This Article
 Copyright © 2023 The Author(s). Published by Tech Science Press.
This work is licensed under a Creative Commons Attribution 4.0 International License , which permits unrestricted use, distribution, and reproduction in any medium, provided the original work is properly cited.
 Downloads
 Citation Tools