
 Submit a Paper
 Propose a Special lssue
 Open Access
ARTICLE

Generalized Jaccard Similarity Based Recurrent DNN for Virtualizing Social Network Communities
1 Department of Electronics and Communication Engineering, Hindusthan Institute of Technology, Coimbatore, 641050, Tamil Nadu, India
2Department of Electronics and Communication Engineering, Hindusthan College of Engineering and Technology, Coimbatore, 641032, Tamil Nadu, India
* Corresponding Author: R. Gnanakumari. Email:
Intelligent Automation & Soft Computing 2023, 36(3), 2719-2730. https://doi.org/10.32604/iasc.2023.034145
Received 07 July 2022; Accepted 27 August 2022; Issue published 15 March 2023
 View Full Text
 Download PDF
Abstract
In social data analytics, Virtual Community (VC) detection is a primary challenge in discovering user relationships and enhancing social recommendations. VC formation is used for personal interaction between communities. But the usual methods didn’t find the Suspicious Behaviour (SB) needed to make a VC. The Generalized Jaccard Suspicious Behavior Similarity-based Recurrent Deep Neural Network Classification and Ranking (GJSBS-RDNNCR) Model addresses these issues. The GJSBS-RDNNCR model comprises four layers for VC formation in Social Networks (SN). In the GJSBS-RDNNCR model, the SN is given as an input at the input layer. After that, the User’s Behaviors (UB) are extracted in the first Hidden Layer (HL), and the Generalized Jaccard Similarity coefficient calculates the similarity value at the second HL based on the SB. In the third HL, the similarity values are examined, and SB tendency is classified using the Activation Function (AF) in the Output Layer (OL). Finally, the ranking process is performed with classified users in SN and their SB. Results analysis is performed with metrics such as Classification Accuracy (CA), Time Complexity (TC), and False Positive Rate (FPR). The experimental setup considers 250 tweet users from the dataset to identify the SBs of users.Keywords
Online SN has recently become more complex due to the number of connected users worldwide. One of the security concerns in these networks is that SU tries to reveal the privacy of other users and misappropriates user names and identification by creating fake accounts. Removing the SU has attracted the consideration of many types of research in SN by analyzing the relationship of activities performed with user behaviour. In [1], a Mutual Clustering Coefficient-based suspicious-link identification framework was designed to identify negative (or suspicious) links in online users. But the suspicious link detection time was not minimized. To identify the anomalous users, an Anomaly Detection On Multilayer Social (ADOMS) network was designed [2]. The anomalous user’s detection accuracy was not enhanced.
Automatic detection and grouping of sock puppets were performed in [3] using different Machine Learning (ML) algorithms. The algorithms failed to apply the various social media data, like Facebook or Twitter. A lightweight algorithm called GroupFound was developed [4] to discover the suspicious link in SN. But, the suspicious account detection performance was not improved.
A new metric based on an ethical probabilistic model was designed in [5] to detect the social dataset’s SB patterns. But the model failed to perform accurate detection of SB patterns. In [6], a forwarding message tree approach was designed to increase the feature analysis and identify hidden Suspicious Accounts (SA). Though the approach improves the accuracy, the SA was not carried out. The rank algorithm was created in [7] so that hidden services could be ranked and the domain-related influential SB could be found.
A system for identifying the suspicious Uniform Resource Locator (URL) was presented in [8]. However, the URL detection time was longer. A Bayesian classification was presented in [9] to detect the malicious URL with a higher level of accuracy as well as a True Positive Rate (TPR). The designed approach did not calculate the robustness of the detection. Based on user friends’ network similarity, a novel approach was introduced in [10] to discover fake accounts. However, accurate detection was not performed. A similarity measure is a real-valued function used in statistical data and related subjects to accurately measure the level to which two objects are alike.
Most common risks of social media are:
a) Internet bullying
b) Privacy intrusion
c) Identification fraud
d) The people who are exposed of your child to insulting substances
e) The probability for participants to be “groomed” by outsiders
Contribution and Structure
The proposed method was developed with Deep Learning (DL)-based SU identification in the SN. Comparison with other models shows that our proposed model exhibits improved performance with a minimum TC. The paper contains the following main contributions:
• To improve the accuracy of SB identification, the GJSBS-RDNNCR model is designed by measuring the similarity between the UB. This contribution is achieved by DL analyzing the user behaviours at different layers.
• The Generalized Jaccard Similarity (GJS) function is applied to find the correlation between the online UB and SB users at the HL of the DL. The similarity value is analyzed with the threshold value using AF and classifies the SB or NSB. This, in turn, improves the CA. The recurrent process of DL lessens the FPR.
• To reduce the TC of classification, the GJSBS-RDNNCR model extracted the user behaviours from SN and verified them with the user’s SB.
The remainder of the article is ordered as follows. Section 2 discusses the issue of SB identification in SN. A network model is described in Section 3. A novel model called GJSBS-RDNNCR with a neat diagram is described in Section 4. In Section 5, the experimental setup and parameter settings of proposed and existing methods are presented. Section 6 provides the performance results under different parameters. Section 7 provides the other related works. The conclusion of the paper is provided in Section 8.
In [11], a hybrid DL-based anomaly detection method was created to find suspicious flows, it failed to perform similarity measures to improve the detection accuracy. In [12] conducted a user behaviour analysis investigation to identify SB. But the analysis did not use any ML algorithms for accurate detection. In [13], a hybrid ML model was introduced to detect spammers in SN. The designed approach has more TC in the spammer’s detection. A fuzzy comprehensive evaluation approach was introduced in [14] to identify user behaviour by calculating the users’ direct trust. The approach was not efficient in minimising the TC. An efficient method was introduced in [15] to detect SB with less FPR automatically. The method failed to rank the SB. In [16] introduced supervised ML to identify spammers with a high TPR.
A similarity approach was designed in [17] to identify the suspicious posts, but it failed to improve their identification with minimum time and higher accuracy. A Recurrent Neural Network (RNN) was integrated into the auto encoders and was presented in [18] to classify the rumours as anomalies based on users’ behaviour. But, the TC performance was not minimized. In [19], a new visual analysis model called TargetVue was made available to find and see SU behaviors. A suspicious URL filtering method was developed in [20] with higher accuracy, but the similarity between the users was not calculated to improve the system’s performance. In [21], an anti-money laundering application was introduced to detect suspicious money transactions. However, the performance of detecting SB was not sufficient. For security purposes, an early warning system was designed in [22]. This system integrates face recognition, social media and text analysis for recognising people in surveillance camera environments. A person’s face image forwarded by the queuing system will then have the user’s face compared with social media profile images collected from Facebook. If the social media profile is found in the database, the person’s name is used to collect more information and text from news and other social media profiles. The result is used for text analysis to get meaningful sentences and people mentioned with a given person. This leads to constructing a social graph of the person. In this way, the behaviour of SU was detected with the help of an early warning system. However, this system failed to achieve minimum accuracy.
The DL model was implemented for intrusion detection [23]. This model achieves high accuracy in anomaly detection. But the FPR was not sufficient. A supervised and unsupervised ML methodology was introduced in [24] for SB detection. However, the accuracy of suspicious detection was not enhanced. A data fusion technique was designed in [25] to identify SB based on heterogeneous data. But, the minimization of TC was not sufficient.
In people’s lives, SN is a significant part of sharing information about their favourites and passions, as well as personal opinions on financial, social, and cultural issues. While performing several activities in SN, the SA spread malicious URLs to abuse the system. Therefore, the problem of detecting SU depends on the user profile in SN and their behaviour. The detection of SA as quickly as possible protects legitimate members and preserves the trustworthiness of the network. Many methods are designed to classify SA from SN. However, the existing method cannot identify the SB, leading to more detection time. Thus, it is necessary to propose ML algorithms to solve the above-said issues in the SN.
The DL model [26–28] comprises one input layer, three hidden layers, and one output layer. To evaluate the similarity of two sets, the Jaccard similarity coefficient (or index) is generally applied. The Jaccard index is defined as the ratio of the intersection size to the union size for two sets A and B. (A, B) J = (A, B)/(A, B). The Jaccard Index is primarily the number in both sets divided by the number in either set multiplied by 100. As a result, the similarity between the two sample sets will be expressed as a percentage. Subtract the percentage value from 1 to evaluate the Jaccard distance. Let us consider 25 users as input, and SN is given as input at a time ‘
In this work, we considered 25 users to conduct the experiments. So, we substitute
Let us consider the behaviour of the user taken from the Sentiment 140 dataset. Let us assume the behaviour of the online SN users
RDNN model identifies the SB based on the similarity value using Eqs. (9) and (10)
If the similarity is more significant than 0.5, the AF returns ‘1’. Otherwise, it returns ‘0’. The ‘1’ denotes the SB of users, and the ‘0’ represents the user’s NSB, leading to the formation of virtual communities in the SN.
SN is organized into an undirected graph G = (v, e) where ‘v’ indicates nodes (i.e., users)
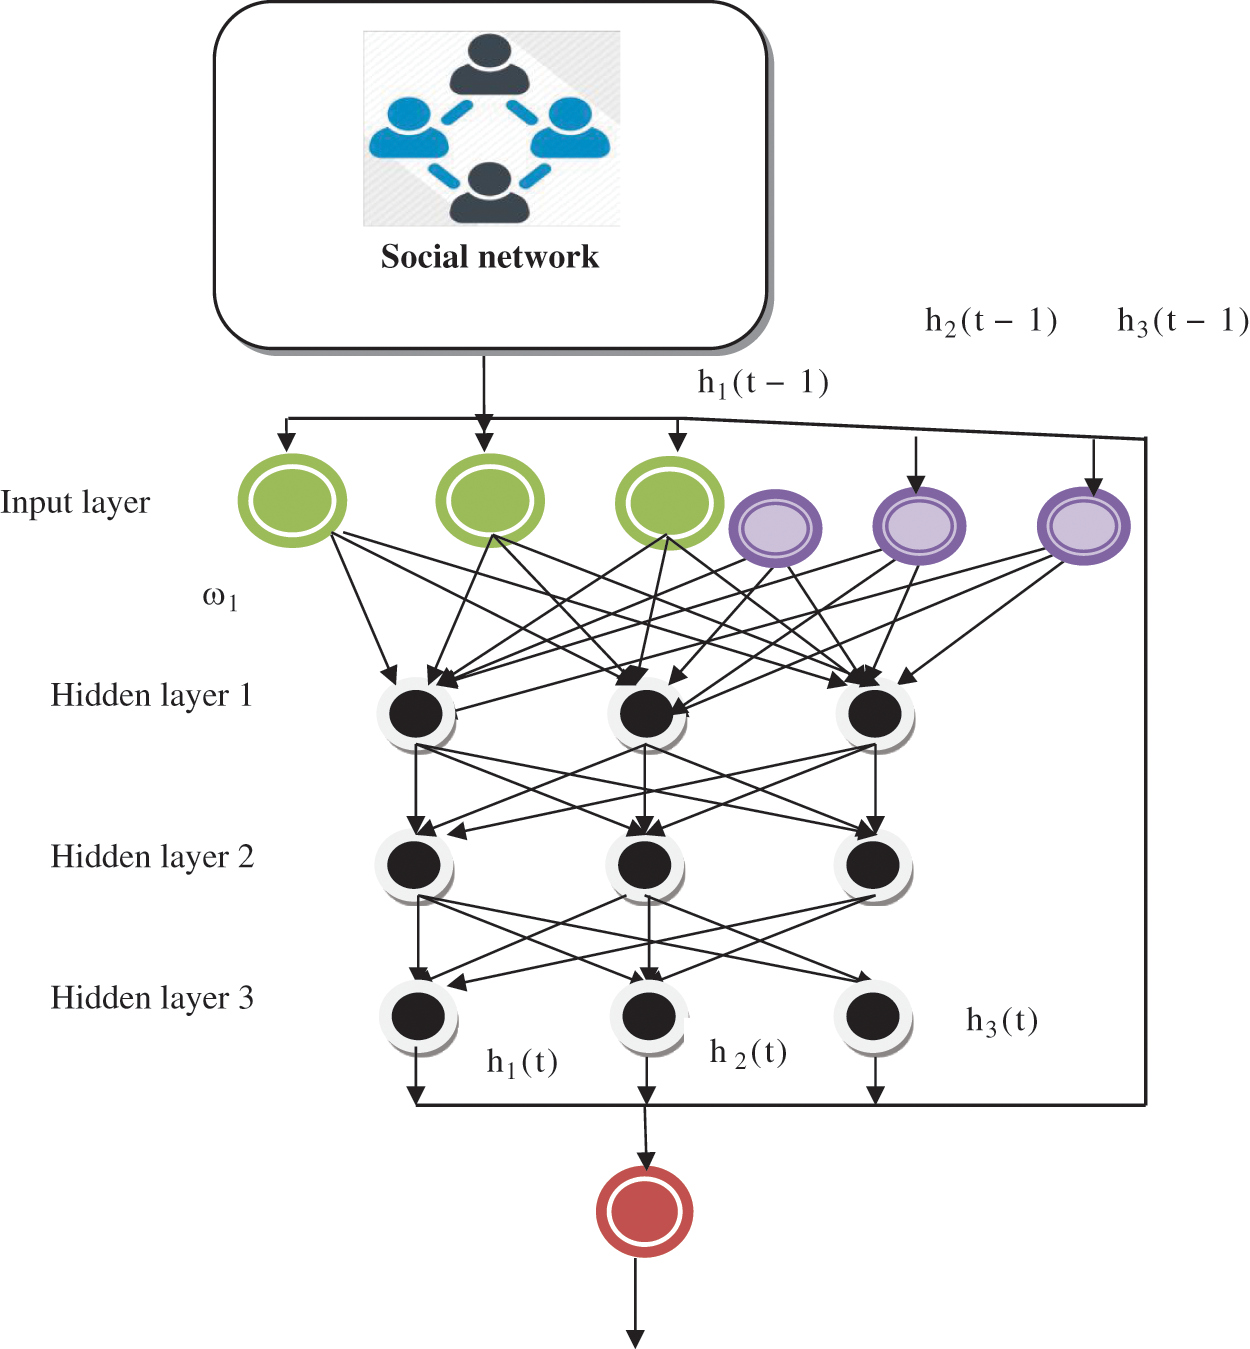
Figure 1: Recurrent DNN base suspicious behaviour detection
The RDNN model is depicted in Fig. 1, with three different layers. RDNN comprises neurons, i.e., nodes are interconnected. The nodes in one layer are thoroughly linked to successive layers, and repeatedly, the DL is performed to identify the SB of a user in the SN. The DL structure includes one input layer and three HLs. SN is given as input at a time ‘t’ to the input layer, which is denoted as ‘i(t)’, where the network consists of the number of users
From Eq. (11),
In Eq. (12),
In Eq. (13),
From Eq. (14),
From Eq. (15),
From Eq. (16), the RDNN structure identifies the SB depending on the similarity value. The AF returns ‘1’ when the similarity is higher than
Fig. 2 illustrates the flow process of SU identification. SN is given as the input of the DL model. After that, the UB in given input networks is extracted and the calculated similarity among SB and NSB’s of users is calculated. The user is classified as suspicious if the similarity value exceeds a threshold value. Otherwise, the user is classified as NSU. After identifying the SU, the ranking is performed to identify the level of SU based on the similarity value. The similarity values are arranged in descending order and assigned a rank. The higher similarity value of the SU is ranked first than the other users.
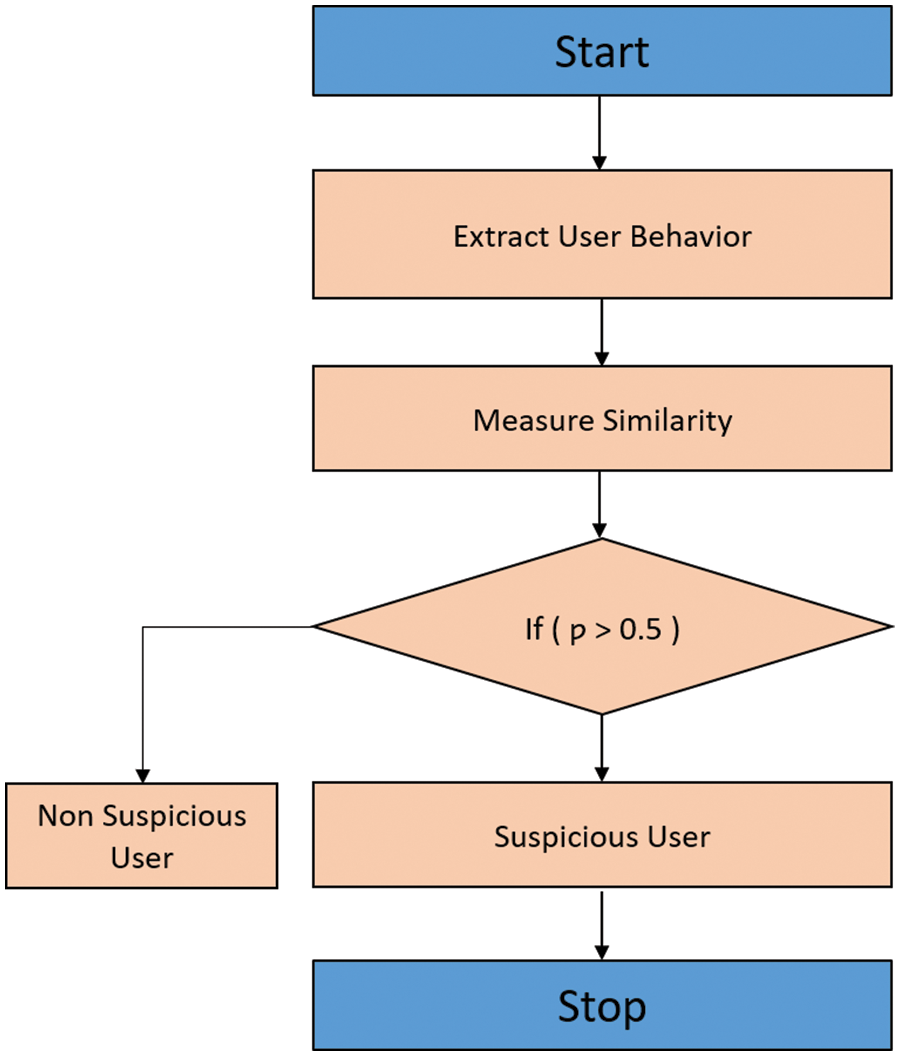
Figure 2: Flow process of SU identification
3.4 Algorithm for GJSBS-RDNNCR Model
Step 1. Input: SN, users
Step 2. Output: identify the SB of the user on SN
Step 3. Begin
Step 4. Given the number of users U1, U2, U3,…Un in the input layer
Step 5. For each user Ui
Step 6. Extract the behaviours’
Step 7. At hidden layer 2, assess the similarity between SB and NSB
Step 8. If (
Step 9.
Step 10. SU
Step 11. Else
Step 12.
Step 13. NSU
Step 14. End If
Step 15. For Each SU
Step 16. Determine the social network’s most suspicious users
Step 17. End For
Step 18. Identify top priority SU in SN
Step 19. End For
Step 20. End For
Step 21. End
GJSBS-RDNNCR is described in Algorithm 1 to form VC in the SN. SN is given as an input to the system. With the assistance of the first HL, the various UB are extracted. In the second HL, the GJS is calculated with the extracted behaviours of users. The similarity values range from 0 to 1. The similarity is analyzed with the threshold value and classifies the SU or NSU in the third HL. If the similarity is more significant than
The GJSBS-RDNNCR Model and existing methods are implemented using Java. For the experiment, the Sentiment140 DS with 1.6 million tweets was obtained [https://www.kaggle.com/kazanova/sentiment140]. The data set comprises tweets with negative emotions as well as positive emotions. DS includes 1,600,000 tweets gathered using the Twitter API. The dataset comprises six columns (i.e., attributes): target, id, date, flag, user, and text. The target is the output that provides the three classes: negative (i.e., suspicious), neural and positive. SU in SN is discovered by GJSBS-RDNNCR Model experiments and classifies the users. The experimental setup considers 250 tweet users from the dataset to identify the SBs of users. Various metrics are considered to evaluate the proposed and existing methods.
The performance of the GJSBS-RDNNCR Model and existing methods is validated with metrics such as CA, FPR, and TC. Statistical results are provided in every section to evaluate the performance of proposed and conventional techniques.
CA is measured as the proportion of users correctly classified as SU or NSU to the total number of users taken as input from the SN. CA is formulated as follows:
In Eq. (17),
The experimental results of CA are illustrated in Fig. 3, with many online social users ranging from 25 to 250. The graphical results confirm that the accuracy of the online social user classification is increased using the GJSBS-RDNNCR model compared to the other two methods. The accuracy enhancement of the GJSBS-RDNNCR model is achieved by applying the DRNN to identify the SU and NSU in the given SN. The DL approach effectively identifies similar online SU behaviours with the help of the GJS measure. The GJSBS-RDNNCR model effectively finds SU and normal users through the AF results. The AF offers final classification output with greater accuracy.
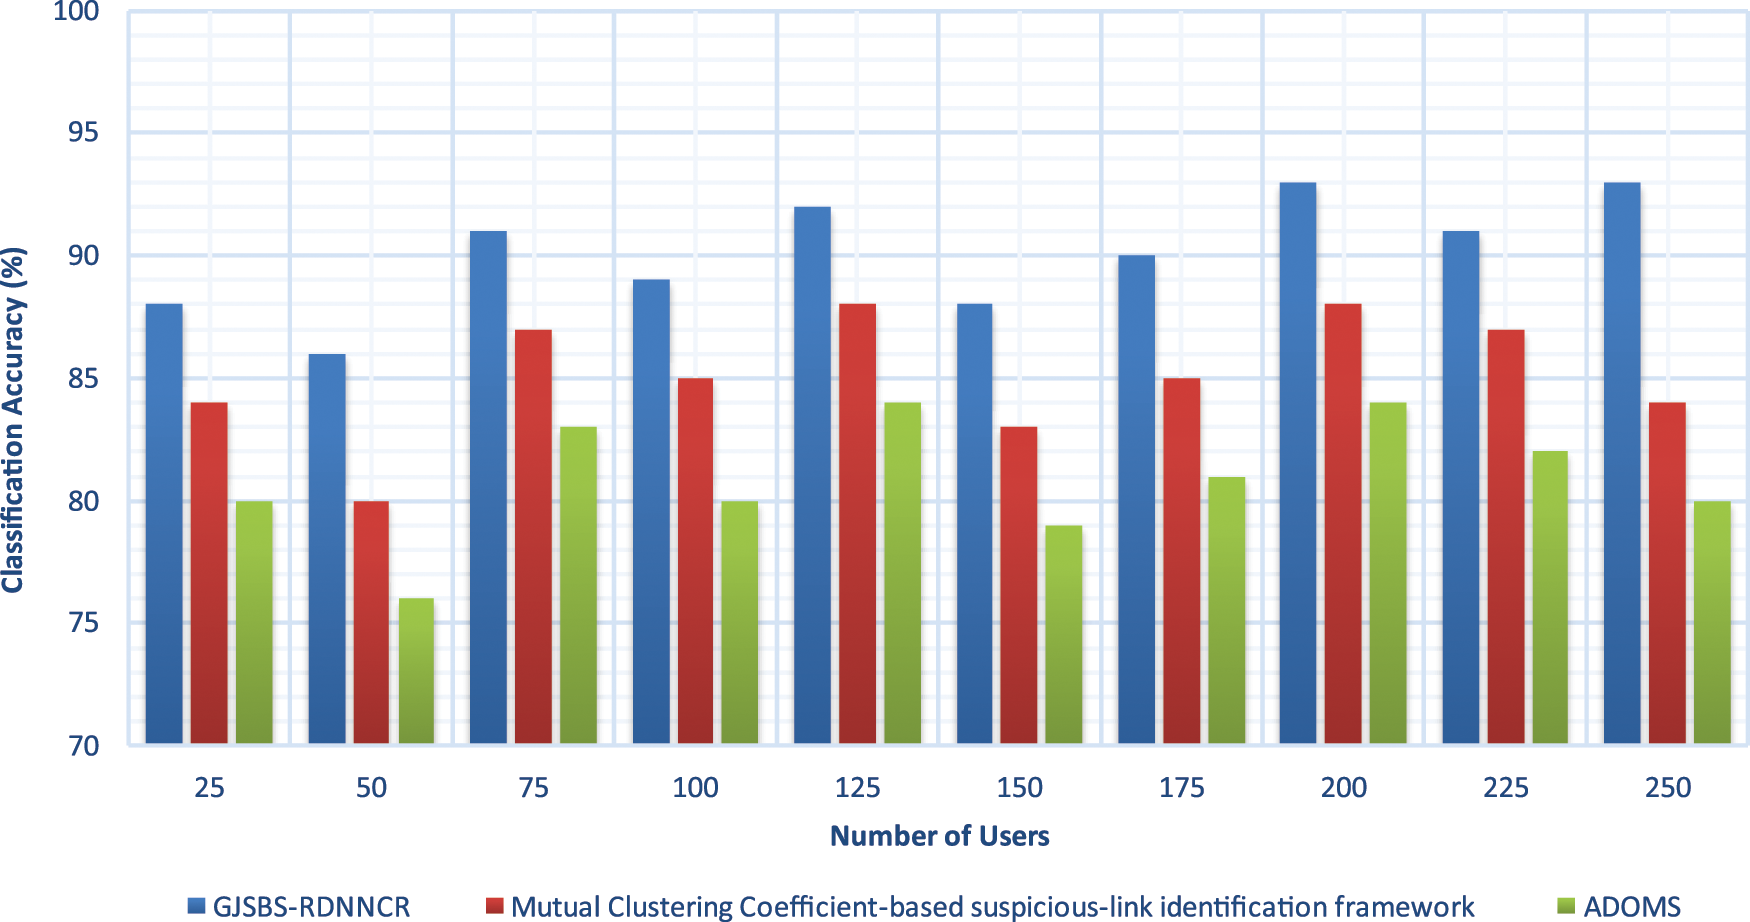
Figure 3: Classification accuracy
Statistical results prove that the GJSBS-RDNNCR model achieves a higher CA. For example, out of 25 online users considered from the given SN, 22 are correctly identified as SU (or) NSU, and their accuracy is 88%. whereas the existing techniques correctly classify 21 and 20 users, and their accuracy is 84% and 80%, respectively. The analysis of the different results confirms that the GJSBS-RDNNCR model obtains 6% to 11% improvement in accuracy compared to existing methods.
False-Positive Rate (FPR) is the number of users incorrectly classified as SU (or) NSU compared to the total number of users taken as input in SN. FPR is measured using the below formula. In Eq. (18),
The result of FPR of three different methods is illustrated in Fig. 4 with many online users. The performance of FPR is minimized in the user classification using the GJSBS-RDNNCR model. The proposed recurrent DL approach repeatedly learns the users’ behaviours in the SN at the HLs. The recurrent DL process of the proposed model improves the CA and minimizes the error. In addition, the similarity values are analyzed to find the SU and NSU. This reduces the incorrect user classification. So, compared to other methods, the FPR of GJSBS-RDNNCR is lower by 33% and 48%.
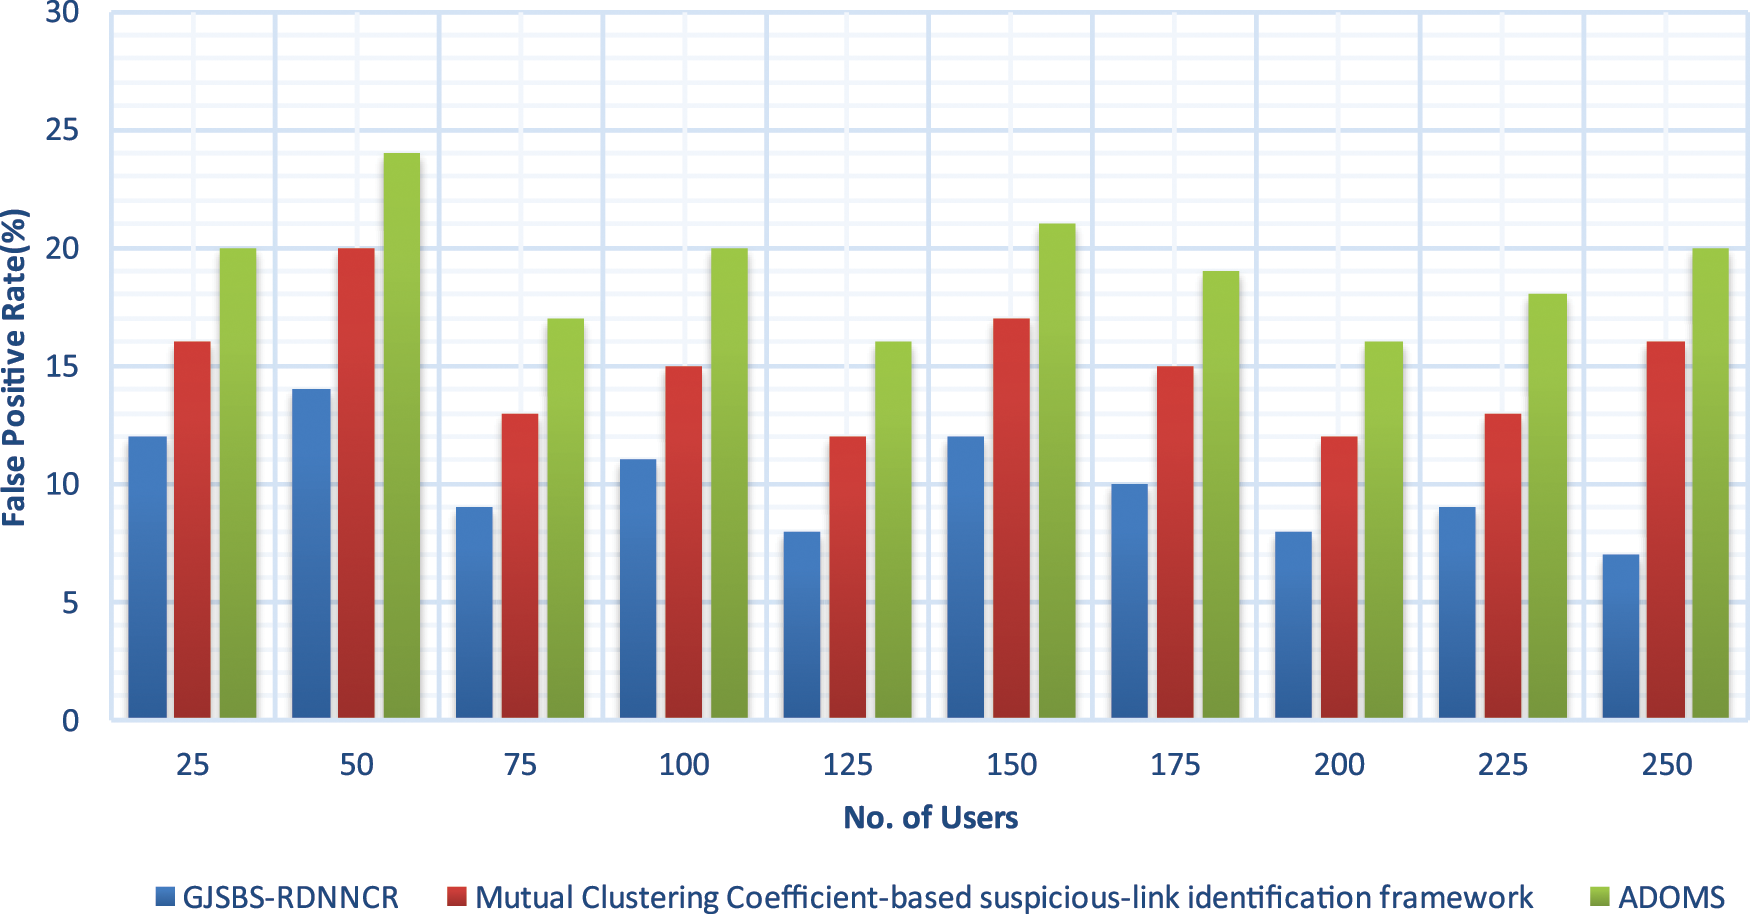
Figure 4: False positive rate
TC is measured as the amount of time consumed to identify SU/NSU through the classification. With the TC, the model is said to be more efficient. TC is formalized as follows:
From Eq. (19), ‘TC’ symbolizes the time complexity, ‘NU’ indicates several users, ‘U’ indicates single users. TC is calculated in milliseconds (ms).
Experimental results of TC are illustrated in Fig. 5 with many users. The TC of SU identification is enhanced when the number of users is increased. But compared to all the methods, the GJSBS-RDNNCR model minimises the TC in the SU identification. This is because the proposed recurrent neural network automatically extracts the SU behaviours to find the similarity. The SU behaviour and SB similarity are calculated to classify the users with a minimum time investment. Let us consider the 25 users. The classification time of the user is 15 ms and the classification times of the existing methods are 18 and 20 ms. The GJSBS-RDNNCR model reduces the TC by 14% and 22% compared to the existing methods. The above discussion clearly shows that the GJSBS-RDNNCR model identifies the SB of the users in the SN with higher accuracy and less time consumption.
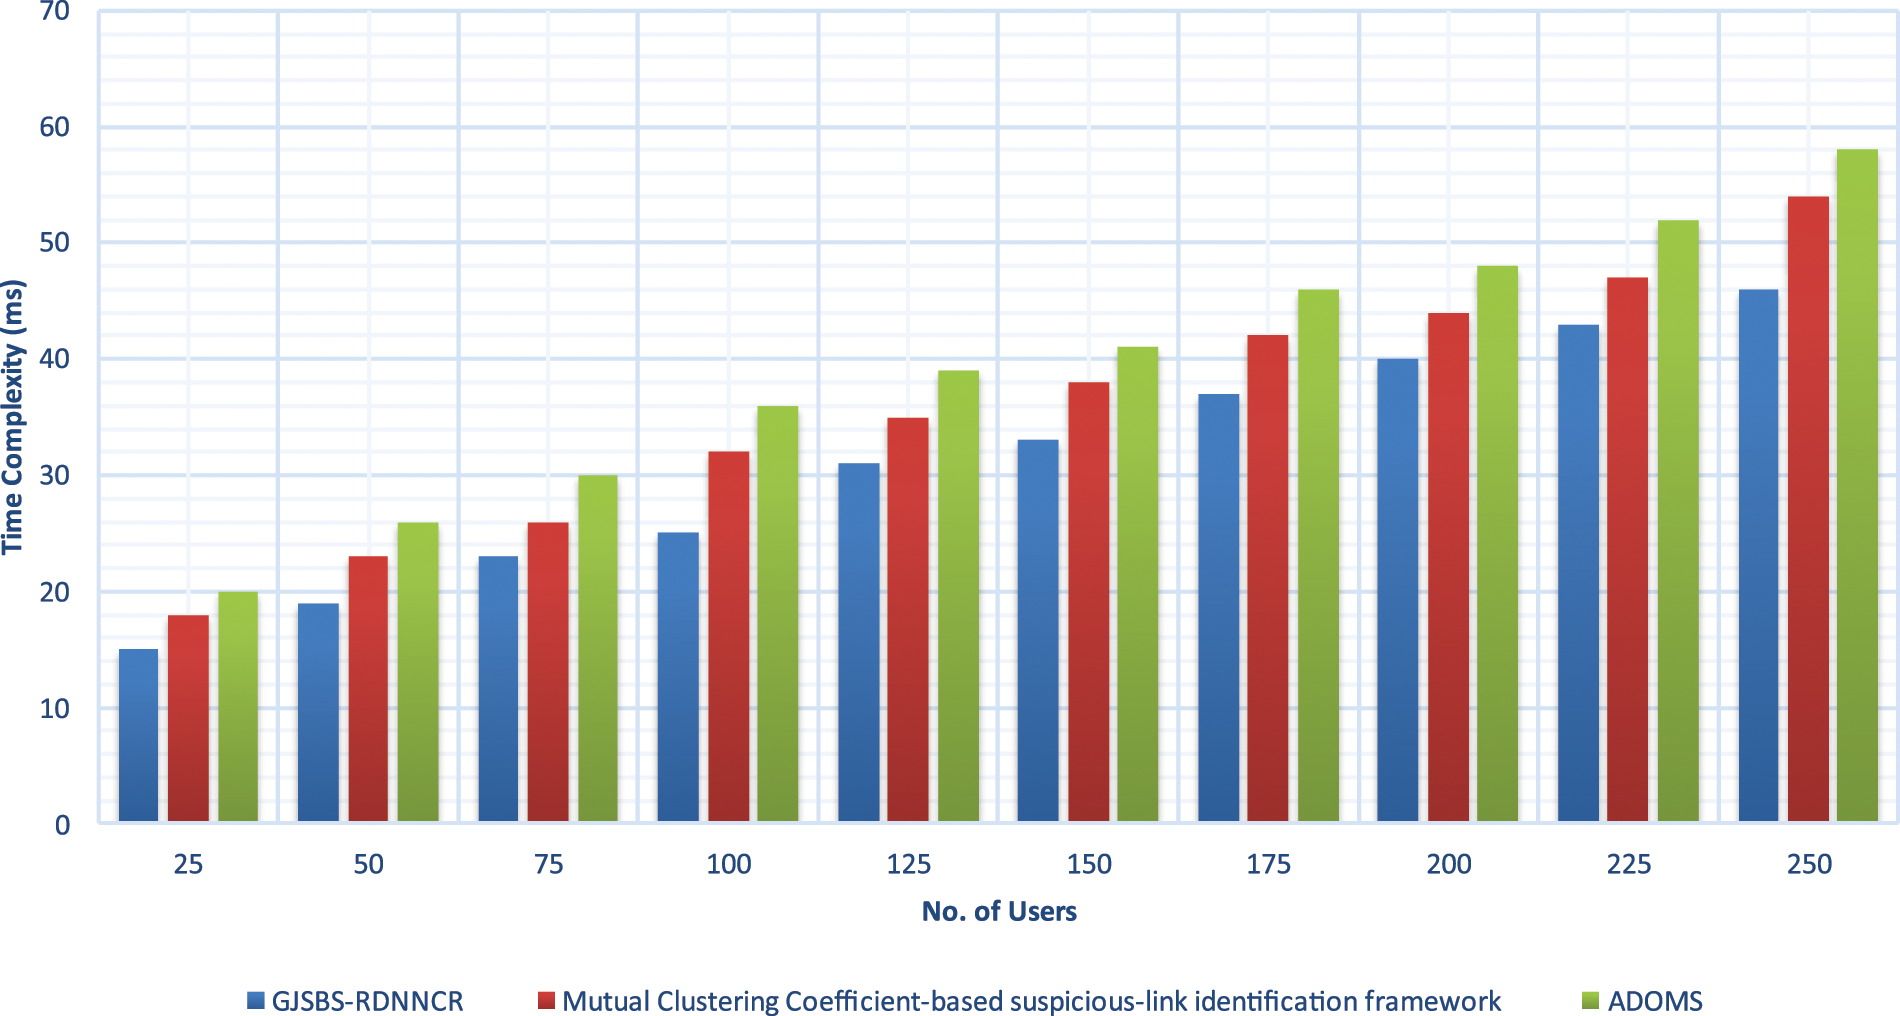
Figure 5: Time complexity
An efficient model called GJSBS-RDNNCR has been developed to identify the SB in SN by measuring similarity between UB. Detecting the SB using the existing method has a few limitations, such as the lack of improvement in accuracy and TC in SN analysis. The patterns of interactions of SU in the network can be used to recognise legitimate or fake ones by DL analysing the UB to form the VC. In the GJSBS-RDNNCR model, the user behaviour similarity criterion is first calculated in the HLs. Depending on the AF, the user is correctly classified in the OL, which lessens the error rate. Finally, the SB is ranked to identify the level of malicious activity. Experimental evaluation is performed using the GJSBS-RDNNCR model and existing techniques with online Twitter DS. The discussion shows that the GJSBS-RDNNCR model does better than other methods at VC formation because it can find suspicious people with more CA and less TC and FPR.
In future work, the accuracy of Suspicious Behaviour detection will be increased with the help of trust behaviour similarity determined from the communication behaviour of the users to form virtual community in social networks.
Funding Statement: The authors received no specific funding for this study.
Conflicts of Interest: The authors declare that they have no conflicts of interest to report regarding the present study.
References
1. A. W. Mudasir and J. Suraiya, “Mutual clustering coefficient-based suspicious-link detection approach for online social networks,” Journal of King Saud University-Computer and Information Sciences, vol. 34, no. 2, pp. 218–231, 2022. [Google Scholar]
2. P. V. Bindu, P. Santhi Thilagam and A. Deepesh, “Discovering suspicious behavior in multilayer social networks,” Computers in Human Behavior, vol. 73, pp. 568–582, 2017. [Google Scholar]
3. Y. Zaher, S. Julien and V. Laurent, “SocksCatch: Automatic detection and grouping of sock puppets in social media,” Knowledge-Based Systems, vol. 149, pp. 124–142, 2018. [Google Scholar]
4. F. Bo, L. Qiang, P. Xiaowen, Z. Jiahao and G. Dong, “GroupFound: An effective approach to detect suspicious accounts in online social networks,” International Journal of Distributed Sensor Networks, vol. 13, no. 7, pp. 1–15, 2017. [Google Scholar]
5. J. Meng, B. Alex, C. Peng, H. Bryan, Y. Shiqiang et al., “Spotting suspicious behaviors in multimodal data: A general metric and algorithms,” IEEE Transactions on Knowledge and Data Engineering, vol. 28, no. 8, pp. 2187–2200, 2016. [Google Scholar]
6. C. Jian, F. Qiang, L. Qiang and G. Dong, “Discovering hidden suspicious accounts in online social networks,” Information Sciences, vol. 394–395, pp. 123–140, 2017. [Google Scholar]
7. A. N. Mhd Wesam, F. Eduardo, A. Enrique and R. F. Laura, “ToRank: Identifying the most influential suspicious domains in the TOR network,” Expert Systems with Applications, vol. 123, pp. 212–226, 2019. [Google Scholar]
8. L. Sangho and K. Jong, “WarningBird: A near real-time detection system for suspicious URLs in twitter stream,” IEEE Transactions on Dependable and Secure Computing, vol. 10, no. 3, pp. 183–195, 2013. [Google Scholar]
9. M. Chia, D. J. G. Chen and S. K. Qun, “Feature set identification for detecting suspicious URLs using Bayesian classification in social networks,” Information Sciences, vol. 289, pp. 133–147, 2014. [Google Scholar]
10. M. Mohammadreza, S. E. Mohammad and R. M. Amir, “Identifying fake accounts on social networks based on graph analysis and classification algorithms,” Security and Communication Networks, vol. 2018, pp. 1–8, 2018. [Google Scholar]
11. G. Sahil, K. Kuljeet, K. Neeraj and J. P. C. R. Joel, “Hybrid deep-learning-based anomaly detection scheme for suspicious flow detection in SDN: A social multimedia perspective,” IEEE Transactions on Multimedia, vol. 21, no. 3, pp. 566–578, 2019. [Google Scholar]
12. W. Hajra, A. Maria, R. Mariam and K. Amina, “Investigation of user behavior on social networking sites,” PLoS One, vol. 12, no. 2, pp. 1–19, 2016. [Google Scholar]
13. M. A. Z. Ala, F. Hossams, A. Jafar and A. H. Mohammad, “Evolving support vector machines using whale optimization algorithm for spam profiles detection on online social networks in different lingual contexts,” Knowledge-Based Systems, vol. 153, pp. 91–104, 2018. [Google Scholar]
14. Y. Min, Z. Shibin, Z. Hang and X. Jinyue, “A new user behavior evaluation method in online social network,” Journal of Information Security and Applications, vol. 47, pp. 217–222, 2019. [Google Scholar]
15. O. Kan, G. Shashi and N. D. Matthew, “Incremental behavior modeling and suspicious activity detection,” Pattern Recognition, vol. 46, no. 3, pp. 671–680, 2013. [Google Scholar]
16. Z. Xianghan, Z. Zhipeng, C. Zheyi, Y. Yuanlong and R. Chunming, “Detecting spammers on social networks,” Neurocomputing, vol. 159, pp. 27–34, 2015. [Google Scholar]
17. A. Salim and E. B. Omar, “Detecting suspicious profiles using text analysis within social media,” Journal of Theoretical and Applied Information Technology, vol. 7, no. 3, pp. 405–410, 2015. [Google Scholar]
18. C. Weiling, Z. Yan, K. Chai, C. Yeo, L. Tong et al., “Unsupervised rumor detection based on users’ behaviors using neural networks,” Pattern Recognition Letters, vol. 105, pp. 226–233, 2018. [Google Scholar]
19. C. Nan, S. Conglei, L. Sabrina, L. Jie, R. L. R. Yu et al., “TargetVue: Visual analysis of anomalous user behaviors in online communication systems,” IEEE Transactions on Visualization and Computer Graphics, vol. 22, no. 1, pp. 280–289, 2016. [Google Scholar]
20. M. C. Chia, J. H. Jhe and H. O. Ya, “Efficient suspicious URL filtering based on reputation,” Journal of Information Security and Applications, vol. 20, pp. 26–36, 2015. [Google Scholar]
21. K. Singh and P. Best, “Anti-money laundering: Using data visualization to identify suspicious activity,” International Journal of Accounting Information Systems, vol. 34, pp. 1–18, 2019. [Google Scholar]
22. S. Afra and R. Alhajj, “Early warning system: From face recognition by surveillance cameras to social media analysis to detecting suspicious people,” Physical A: Statistical Mechanics and Its Applications, vol. 540, pp. 1–29, 2019. [Google Scholar]
23. A. Aldweesh, A. Derhab and A. Z. Emam, “Deep learning approaches for anomaly-based intrusion detection systems: A survey, taxonomy, and open issues,” Knowledge-Based Systems, vol. 189, pp. 1–37, 2019. [Google Scholar]
24. K. K. Verma, B. M. Singh and A. Dixit, “A review of supervised and unsupervised machine learning techniques for suspicious behavior recognition in intelligent surveillance system,” International Journal of Information Technology, vol. 14, pp. 397–410, 2022. [Google Scholar]
25. A. M. Ali and P. Angelov, “Anomalous behaviour detection based on heterogeneous data and data fusion,” Soft Computing, vol. 22, no. 10, pp. 3187–3201, 2018. [Google Scholar]
26. M. Mozaffari Kermani, S. Sur Kolay, A. Raghunathan and N. K. Jha, “Systematic poisoning attacks on and defenses for machine learning in healthcare,” IEEE Journal of Biomedical and Health Informatics, vol. 19, no. 6, pp. 1893–1905, 2015. [Google Scholar] [PubMed]
27. H. Sun and R. Grishman, “Lexicalized dependency paths based supervised learning for relation extraction,” Computer Systems Science and Engineering, vol. 43, no. 3, pp. 861–870, 2022. [Google Scholar]
28. H. Sun and R. Grishman, “Employing lexicalized dependency paths for active learning of relation extraction,” Intelligent Automation & Soft Computing, vol. 34, no. 3, pp. 1415–1423, 2022. [Google Scholar]
Cite This Article
 Copyright © 2023 The Author(s). Published by Tech Science Press.
This work is licensed under a Creative Commons Attribution 4.0 International License , which permits unrestricted use, distribution, and reproduction in any medium, provided the original work is properly cited.
 Downloads
 Citation Tools