
 Submit a Paper
 Propose a Special lssue
 Open Access
ARTICLE

Graph Convolutional Neural Network Based Malware Detection in IoT-Cloud Environment
1 Department of Cybersecurity, College of Computer Science and Engineering, University of Jeddah, Jeddah, 21959, Saudi Arabia
2 Department of Information Systems, College of Computer and Information Sciences, Princess Nourah Bint Abdulrahman University, P.O.Box 84428, Riyadh, 11671, Saudi Arabia
3 Department of Computer Sciences, College of Computing and Information System, Umm Al-Qura University, Makkah, 24211, Saudi Arabia
4 Department of Computer and Self Development, Preparatory Year Deanship, Prince Sattam bin Abdulaziz University, AlKharj, 16242, Saudi Arabia
* Corresponding Author: Abdelwahed Motwakel. Email:
Intelligent Automation & Soft Computing 2023, 36(3), 2897-2914. https://doi.org/10.32604/iasc.2023.034907
Received 31 July 2022; Accepted 26 October 2022; Issue published 15 March 2023
 View Full Text
 Download PDF
Abstract
Cybersecurity has become the most significant research area in the domain of the Internet of Things (IoT) owing to the ever-increasing number of cyberattacks. The rapid penetration of Android platforms in mobile devices has made the detection of malware attacks a challenging process. Furthermore, Android malware is increasing on a daily basis. So, precise malware detection analytical techniques need a large number of hardware resources that are significantly resource-limited for mobile devices. In this research article, an optimal Graph Convolutional Neural Network-based Malware Detection and classification (OGCNN-MDC) model is introduced for an IoT-cloud environment. The proposed OGCNN-MDC model aims to recognize and categorize malware occurrences in IoT-enabled cloud platforms. The presented OGCNN-MDC model has three stages in total, such as data pre-processing, malware detection and parameter tuning. To detect and classify the malware, the GCNN model is exploited in this work. In order to enhance the overall efficiency of the GCNN model, the Group Mean-based Optimizer (GMBO) algorithm is utilized to appropriately adjust the GCNN parameters, and this phenomenon shows the novelty of the current study. A widespread experimental analysis was conducted to establish the superiority of the proposed OGCNN-MDC model. A comprehensive comparison study was conducted, and the outcomes highlighted the supreme performance of the proposed OGCNN-MDC model over other recent approaches.Keywords
The Internet of Things (IoT) is a novel network paradigm in which devices, machines and human beings communicate and collaborate with each other through novel association procedures [1]. The pervasive and ever-rising cybersecurity assaults on IoT mechanisms made organizations and people experience a wide range of complexities in finance, reputation, compliances and day-to-day business functions [2]. The increased occurrences of cyberattacks are a direct result of phenomenal growth and the development of IoT gadgets in these fields in terms of smart manufacturing, smart grids, patient monitoring systems, logistics and environmental monitoring. It is challenging to accomplish the security management of IoT networks due to the transient and dynamic nature of the links among the devices, the diversity of the players who can interact with IoT networks and resource limitations [3]. The global IoT security market is anticipated to expand at an Annual Growth Rate of 33.7%, owing to multiple factors such as a high number of cyberattacks on IoT gadgets, heavy regulations on IoT security and an increased number of security concerns [4].
In recent years, mobile devices have turned out to be a crucial part of everyone’s life and are utilized even more than traditional computers like personal computers [5]. The data generated by smartphones is different and highly confidential in nature. Thus, smartphones are employed as working tools, payment means and also for other modes of interaction [6]. On the other hand, these devices are highly susceptible to cyberattacks than conventional computer systems since all the types of protocols and networks are used in these devices, such as mobile networks, Wi-Fi (e.g., 3rd or 4th generation), etc. As mentioned earlier, the rapid penetration of Android platforms in mobile devices makes detecting malware assaults a significant task to accomplish [7]. This malware can access the data of the users from their Android devices, transmit Short Message Services (SMSs) to the usernames and disrupt the privacy of a user [8]. Such evolved malware have been contained earlier using numerous analytical techniques and malware identification processes like hybrid analysis, static analysis and dynamic analysis to secure Android devices from cyberattacks [9]. Thus, a precise malware detection technique needs a large volume of hardware resources that are not only highly significant but also must be resource-limited for mobile devices [10]. This denotes the requirement for a multi-objective malware detection technique that can function in mobile atmospheres and optimally solve this problem.
In this article, an optimal Graph Convolutional Neural Network-based Malware Detection and Classification (OGCNN-MDC) model is introduced for the IoT-cloud environment. The proposed OGCNN-MDC aims to recognize and categorize the occurrences of malware in IoT-enabled cloud platforms. The presented OGCNN-MDC model has three stages in total, such as data pre-processing, malware detection and parameter tuning. To detect and classify the malware, the GCNN model is exploited in this study. To enhance the overall efficiency of the GCNN model, the Group Mean-Based Optimizer (GMBO) algorithm is utilized for appropriate adjustment of the GCNN parameters. A widespread experimental analysis was conducted to highlight the improvements of the proposed OGCNN-MDC model.
In the literature [11], the authors developed an event-aware and scalable Android malware detection technique called EveDroid. This technique exploited the behavioural patterns of different activities to efficiently identify the novel malware in accordance with the insights reflected by the events in case of potential malware attacks [11]. Unlike the existing methodologies that use Application Programming Interface (API) calls as features directly, the authors developed this model to utilize the activity groups for describing the behaviour of the apps at the activity level so that a high level of semantics can be compared to the API levels. Inactivity groups, a functioning cluster was adopted to characterize the behaviour for all the events. This is executed in such a way that the behaviour, concealed in every event, is still taken, and the EveDroid program is allowed to detect the novel malware at event levels. The authors developed a testing architecture named learning-based Android Malware Detection System (TLAMD) to be applied in IoT gadgets [12]. The major concern lies in creating an appropriate fitness function that can generate efficient adversarial samples without impacting the feature of the applications.
Taheri et al. developed two defence methodologies against adverse attacks in malware detection process for mobile multi-media applications in an IoT environment [13]. In these methodologies, a powerful NN and a group of 1-nearest neighbour (C4N) and CNN were used. Then, the methods were trained using the dataset with adverse attacks. Consequently, the trained Machine Learning (ML) method achieved precise results. Further, when a malicious program arrives in the network through any other IoT device, the system triggers crucial warnings too. This study also described the attack model and algorithm for defending these attacks. Akbar et al. developed a Permission-based Malware Detection Method (PerDRaML) in which the App’s malevolence was defined based on the application of the suspected permission [14]. Being a multi-level based model, this method identified and extracted a set of many characteristics, namely, permission rate, small size and permissions from the data gathered automatically-gathered from 10,000 applications. Furthermore, this study employed different ML models to classify the Apps as benign and malicious.
In the study conducted earlier [15], the authors proposed a malware detection technique to reduce the error rates and improve the accuracy by pre-processing and balancing the used datasets. To achieve this objective, static analysis was applied in this study to extract the features of the application. The feature ranking method was utilized in this study to pre-process the feature subset. Based on the ranks generated, the low-efficient features were eliminated. Also, the suggested method balanced the datasets using SMOTE, an under-sampling technique, along with a group of two other models which were not investigated earlier in the domain of detection techniques. Next, KNN, SVM, and Iterative Dichotomiser 3 classifiers were utilized to develop the recognition system. Niu et al. developed a novel method to categorize Android malware according to OpCode-level FCG and deep learning techniques [16]. The FCG was achieved with the help of static analysis of the Operation Code (OpCode), whereas this study used LSTM as its DL method.
This article has developed a new OGCNN-MDC model for malware detection and classification in IoT-cloud environment. The proposed OGCNN-MDC model aims to recognize and categorize the occurrences of malware in IoT-enabled cloud platforms. The presented OGCNN-MDC model has three stages: data pre-processing, malware detection and parameter tuning. Fig. 1 depicts the working processes of the OGCNN-MDC approach.
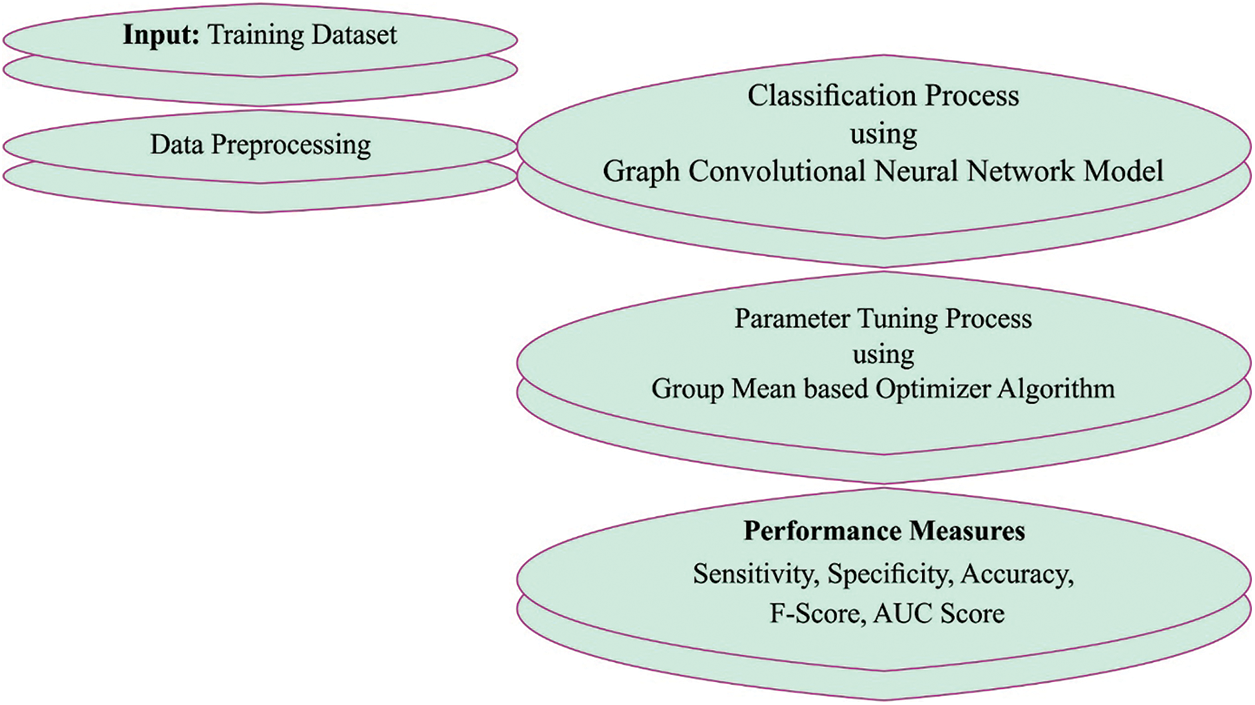
Figure 1: Working processes of the OGCNN-MDC approach
3.1 Malware Detection Using the GCNN Model
In order to detect and classify the malware, the GCNN model is exploited in this work. The GCNN approach implements the semi-supervised classifier [17]. The major concept is to upgrade the representation of the nodes by transmitting the data among the nodes.
Unlike the typical convolution that operates on a local Euclidean structure in the image, the GCNN approach aims to learn a function (.,.) on graph
After applying the convolution function,
In Eq. (2),
Furthermore, the graph model (viz., correlative matrixes) is generally pre-determined though it is not presented during the multi-label image detection process. Therefore, the correlative matrices should be developed from scratch. It encompasses two major components: GCNN-based classifier learning modules and image representation learning. Then, the CNN base model is applied to learn the features of the image. Therefore, an input image I with
In Eq. (3),
Consider that the ground truth label of the image is
In Eq. (5), σ(.) represents the sigmoid function.
Typically, if a ‘surfboard’ occurs in an image, then a ‘person’ occurs with a high probability. But, due to the condition of the occurring ‘person’, the ‘surfboard’ not necessarily appears. Fig. 2 depicts the framework of the CNN method.
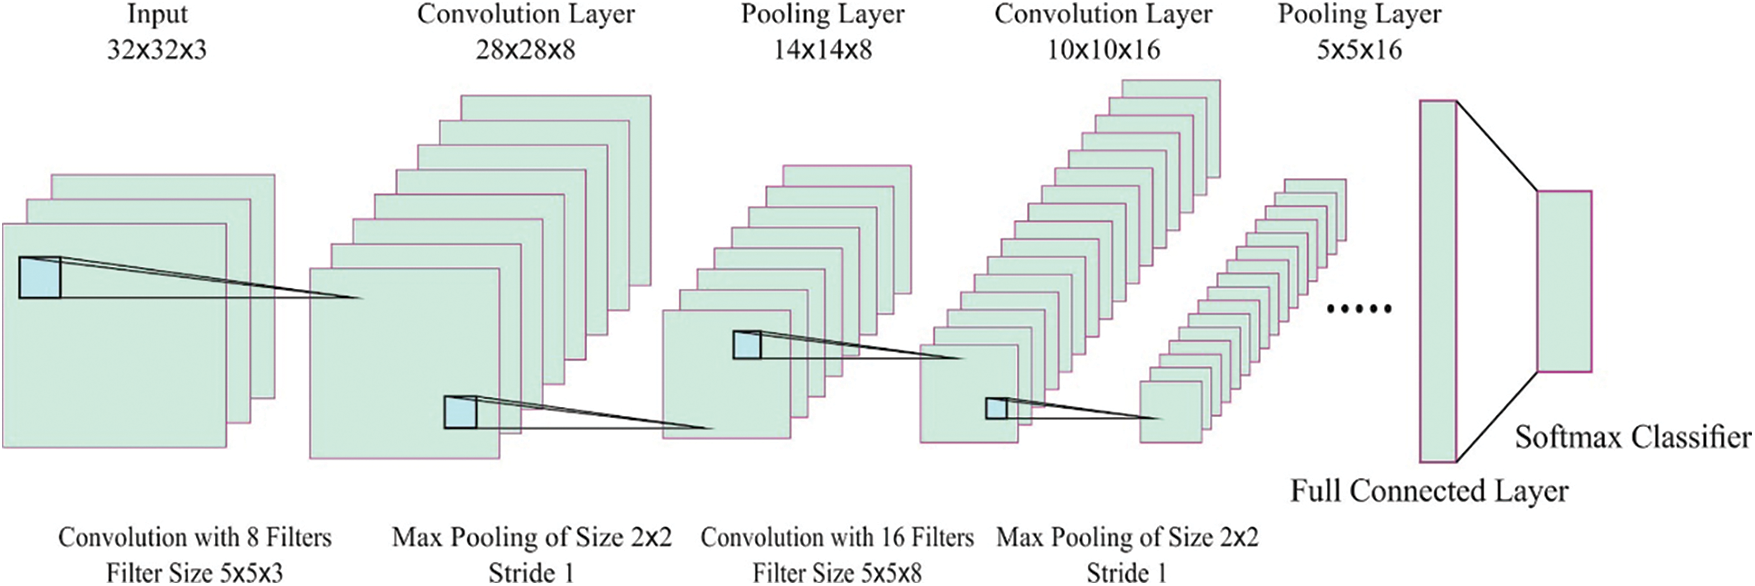
Figure 2: Structure of the CNN method
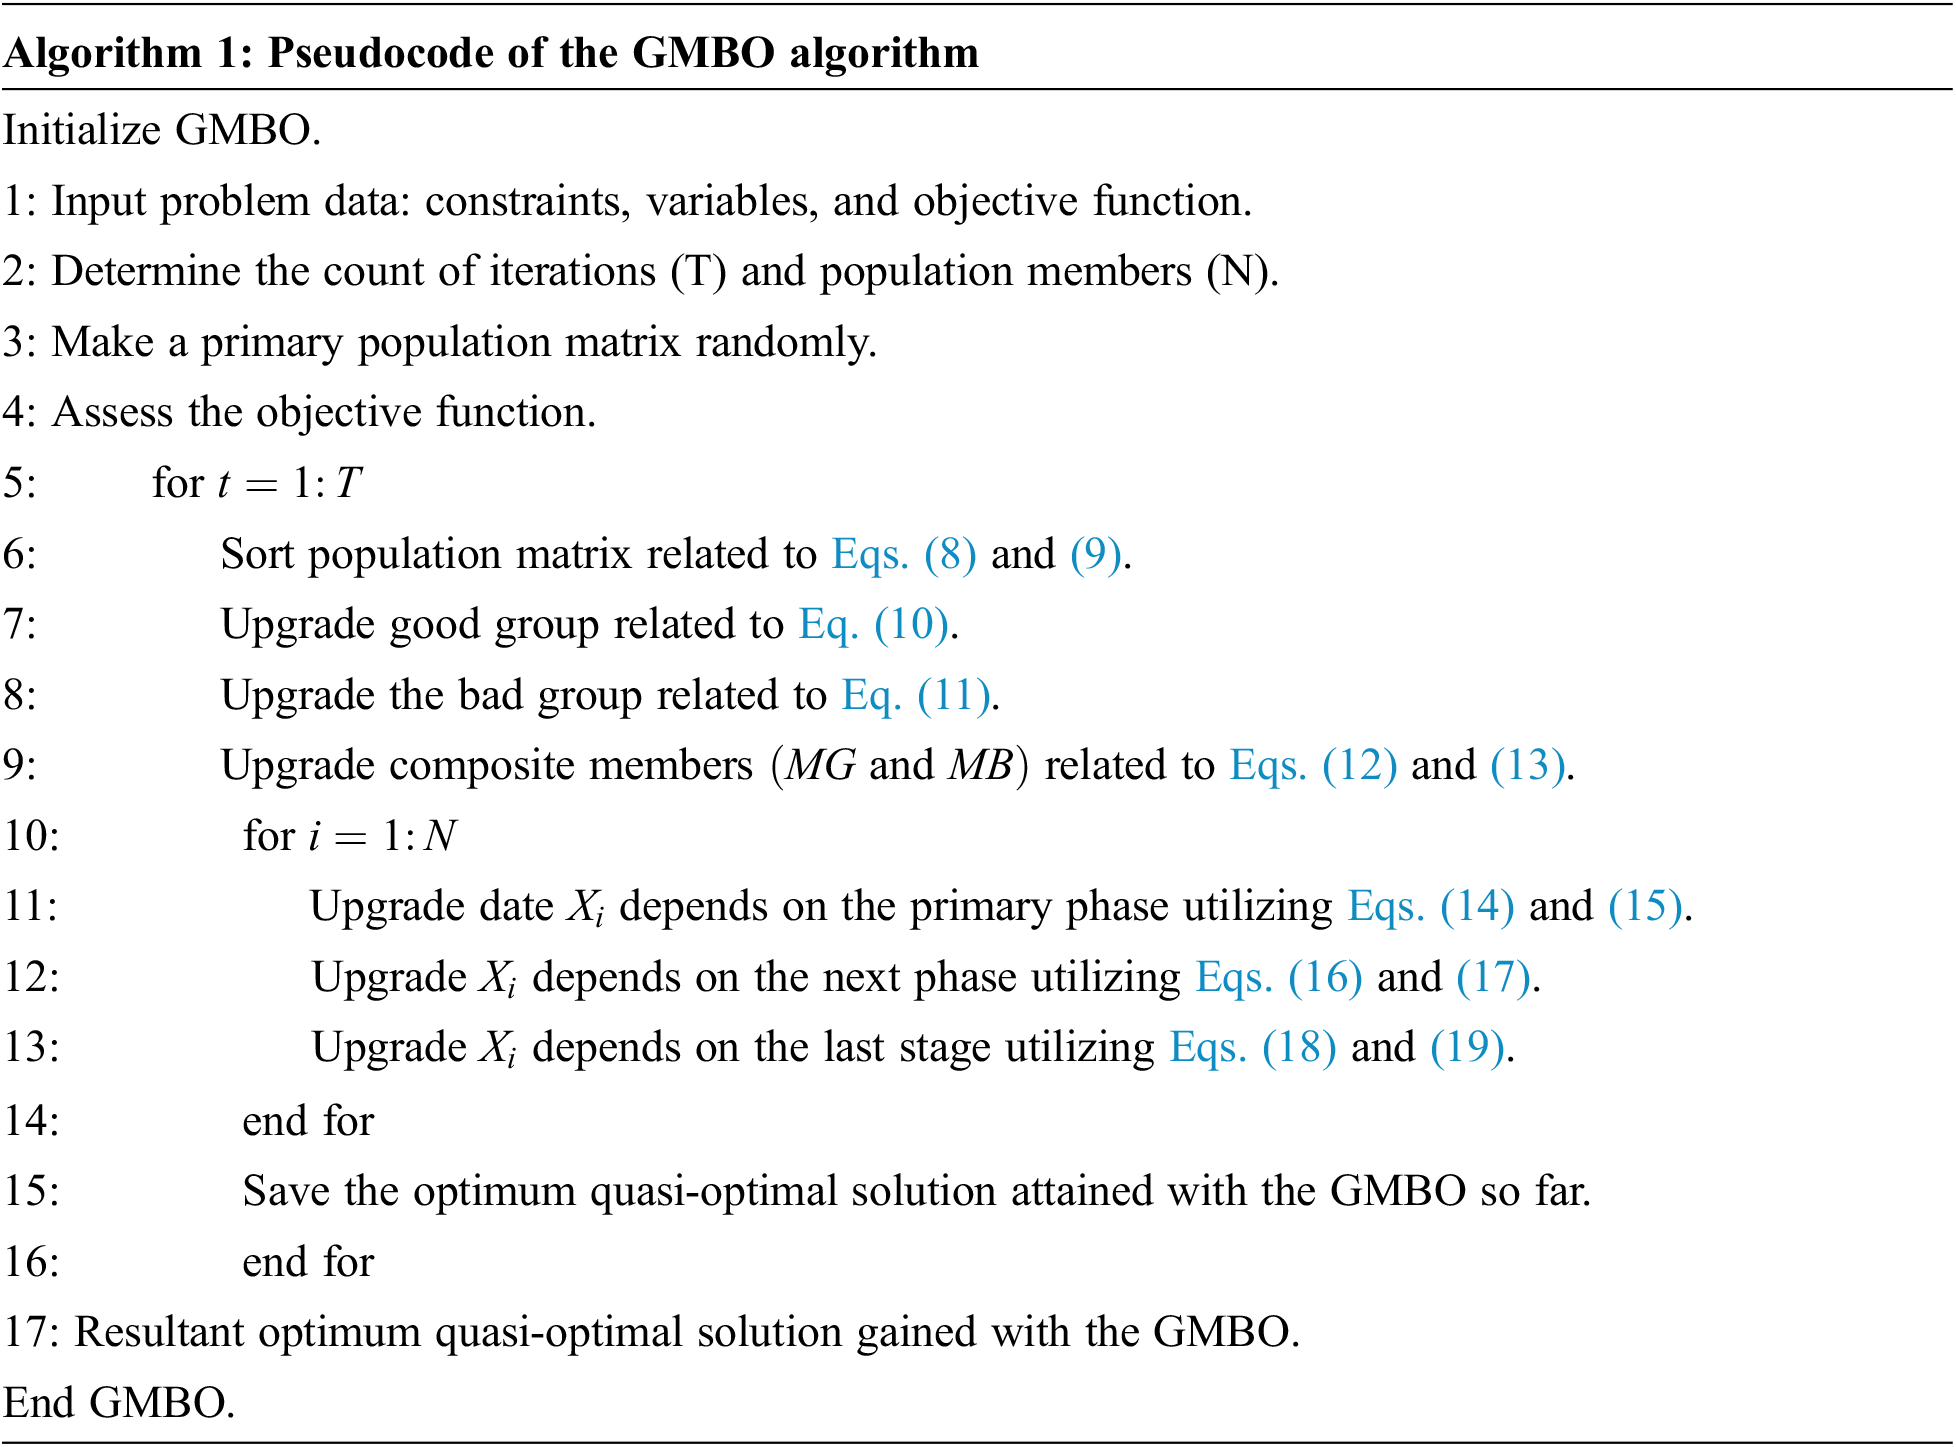
3.2 Hyperparameter Optimization Using GMBO Algorithm
In order to enhance the overall efficiency of the GCNN model, the GMBO algorithm is utilized to adjust the GCNN parameters appropriately. GMBO is a population-based optimization method proposed earlier based on efficiently using population member data when upgrading a model [18]. In all the iterations, two groups of members are chosen carefully, such as the bad group members and the good group members, with a specific number of members in each group. The foremost notion in the development of the presented method is to apply both integrated groups by averaging the number of two group members. The population member in the presented model is recognized using a matrix termed population matrix. The column count in the population matrix indicates the number of parameters in the problem whereas the row count in the population matrix designates the number of members in the algorithm. As a population member, every row of the population matrix is the solution proposed to resolve the optimization issue, which is determined as follows.
Now, X denotes the population matrix,
According to the variable value presented by every member of the population, the objective function is estimated. Therefore, the objective function value is defined by the vector as given below.
In Eq. (7), F denotes the vector of the main function, and
In this expression,
In this equation,
Now,
Now,
In this equation,
This section discusses the malware classification results of the proposed OGCNN-MDC method in detail, while the experimental validation was conducted using a standard dataset. Table 1 gives the details of the dataset. The dataset holds a total of 33,269 samples under two classes.
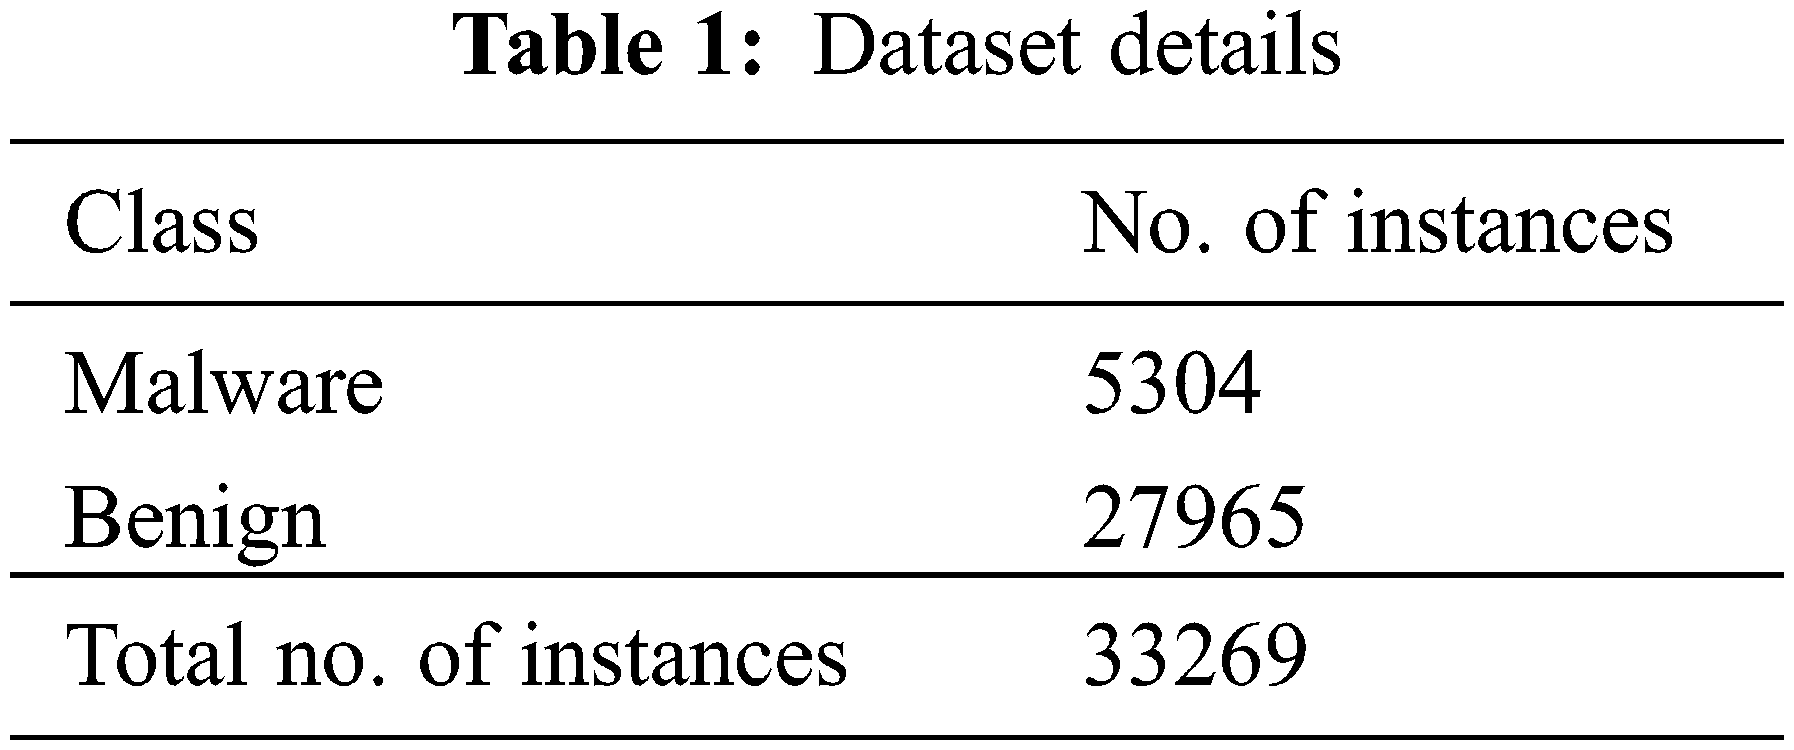
Fig. 3 illustrates the confusion matrices generated by the proposed OGCNN-MDC model during the classification process. With run-1, the proposed OGCNN-MDC model categorized 5,081 samples under the malware class and 27,764 samples under the benign class. Similarly, with run-2, the OGCNN-MDC approach categorized 5,064 samples as a malware class and 27,768 samples as a benign class. Also, with run-3, the proposed OGCNN-MDC technique classified 5,049 samples under the malware class and 27,778 samples under the benign class. Furthermore, with run-4, the proposed OGCNN-MDC technique placed 4,812 samples under the malware class and 27,843 samples under the benign class. Additionally, with run-5, the proposed OGCNN-MDC technique categorized 5,052 samples under the malware class and 27,774 samples under the benign class.
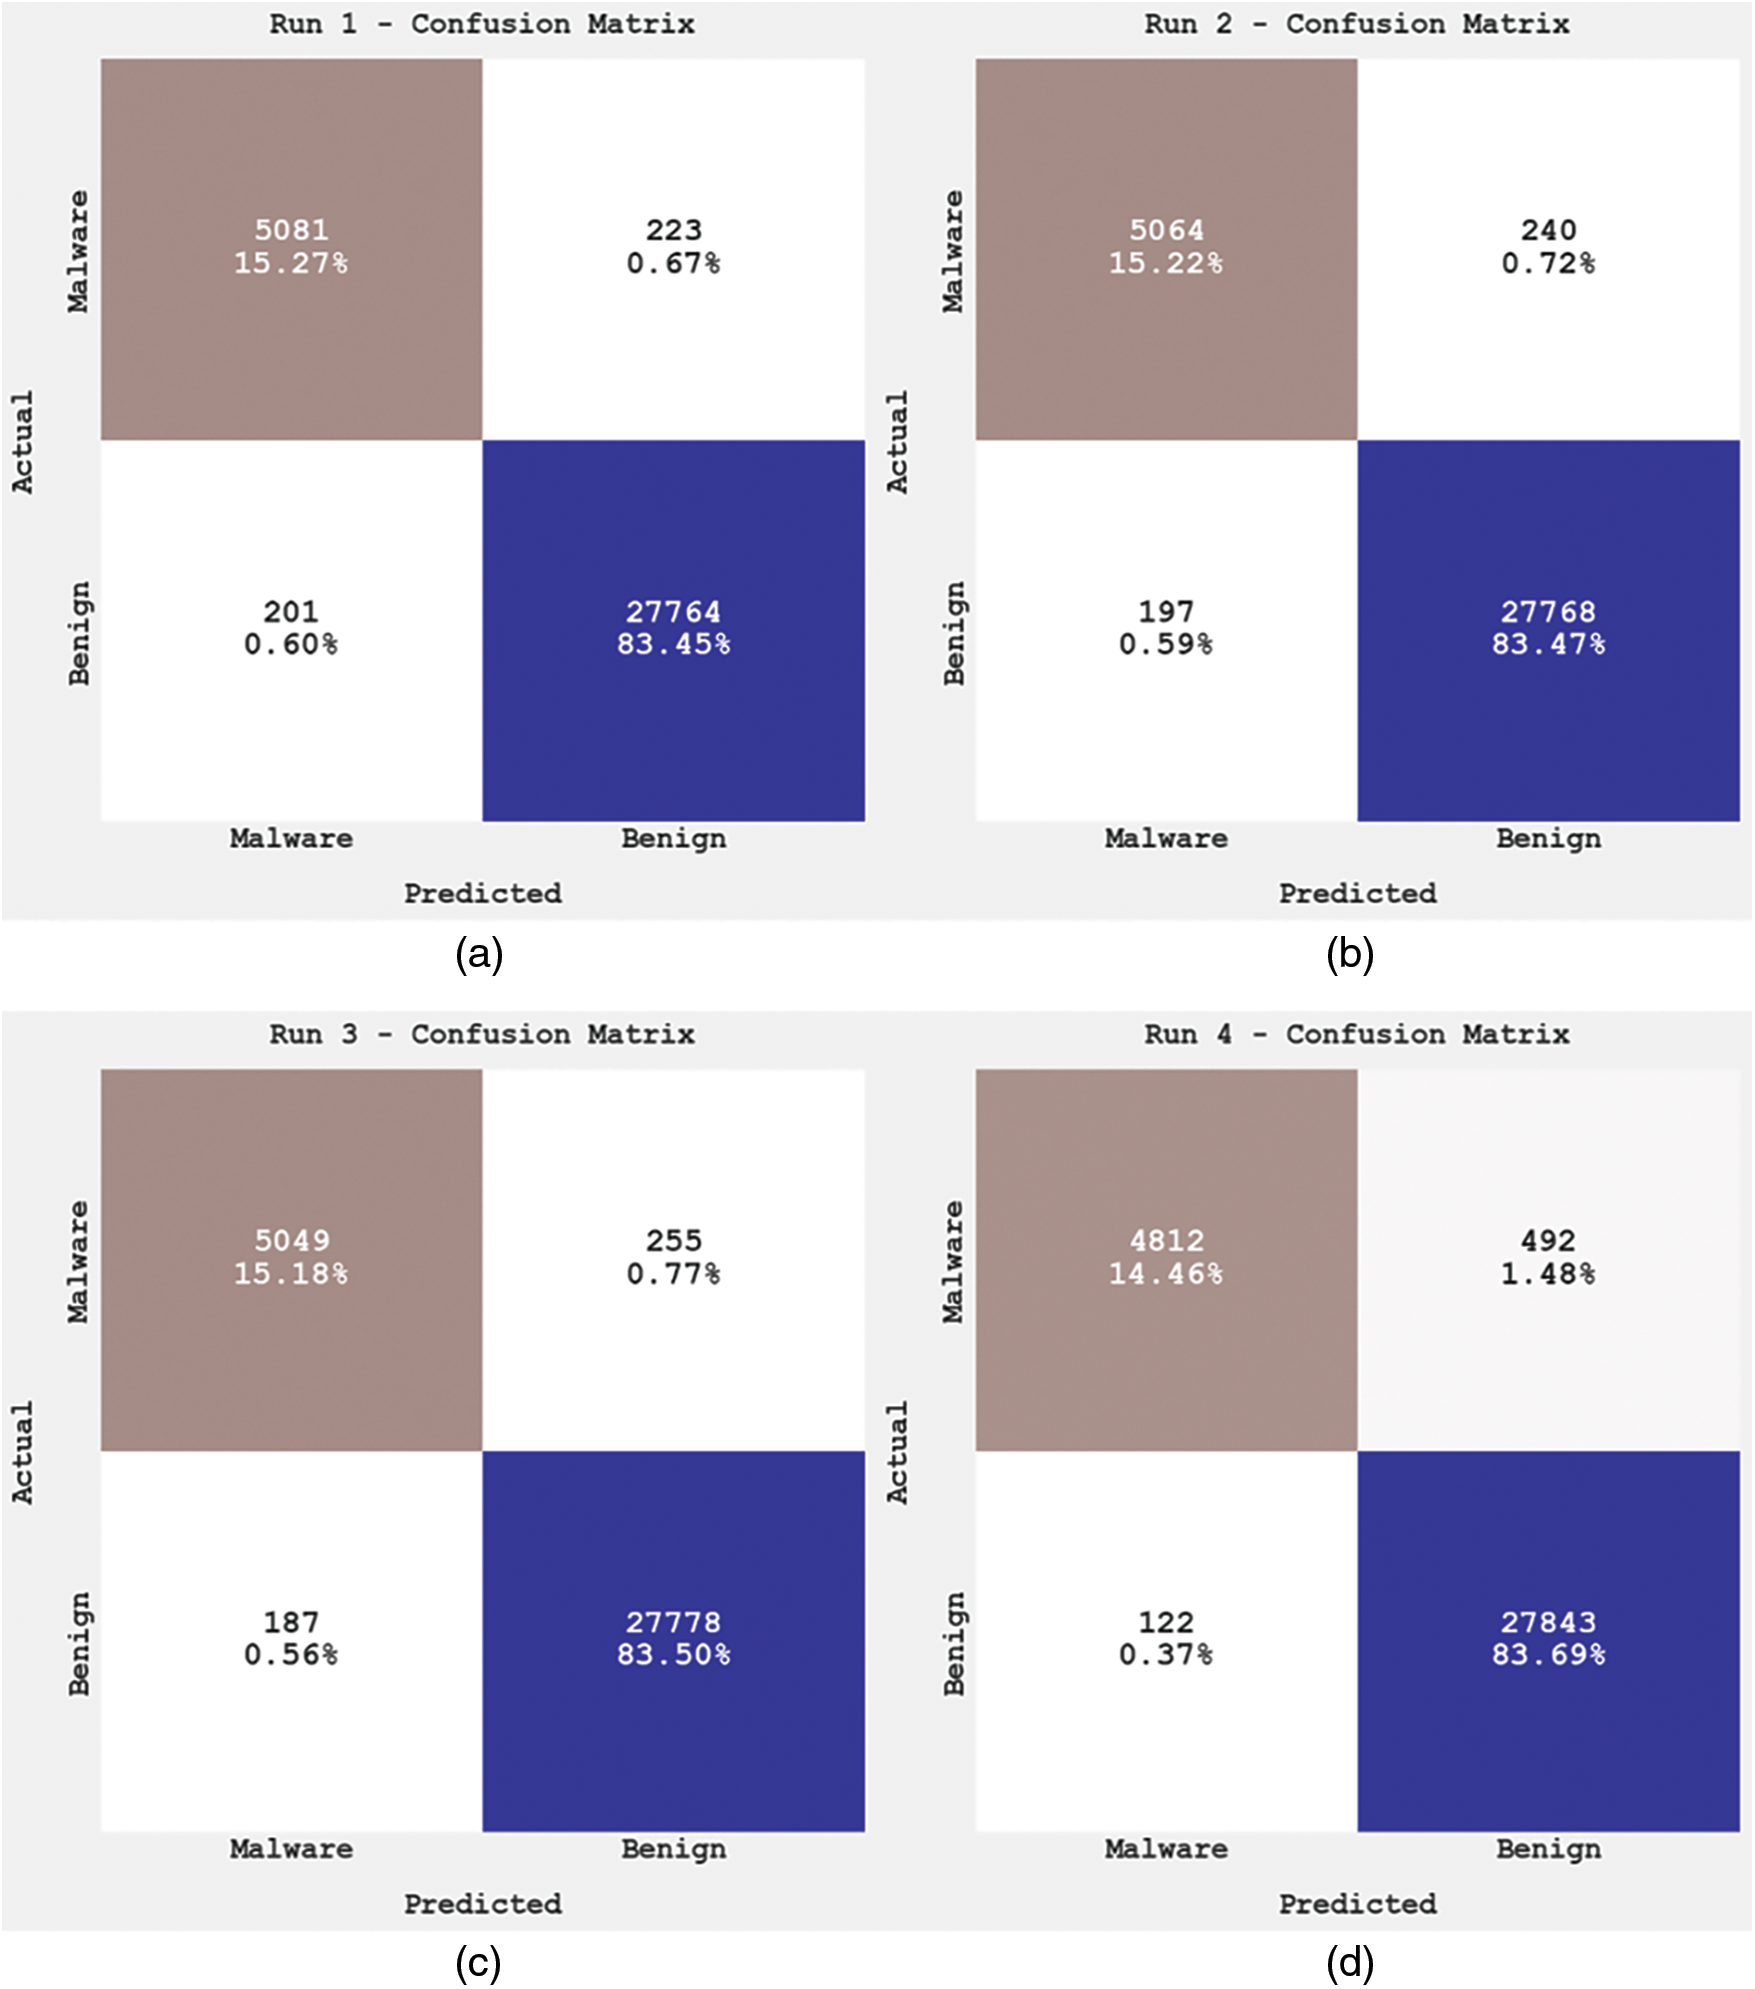
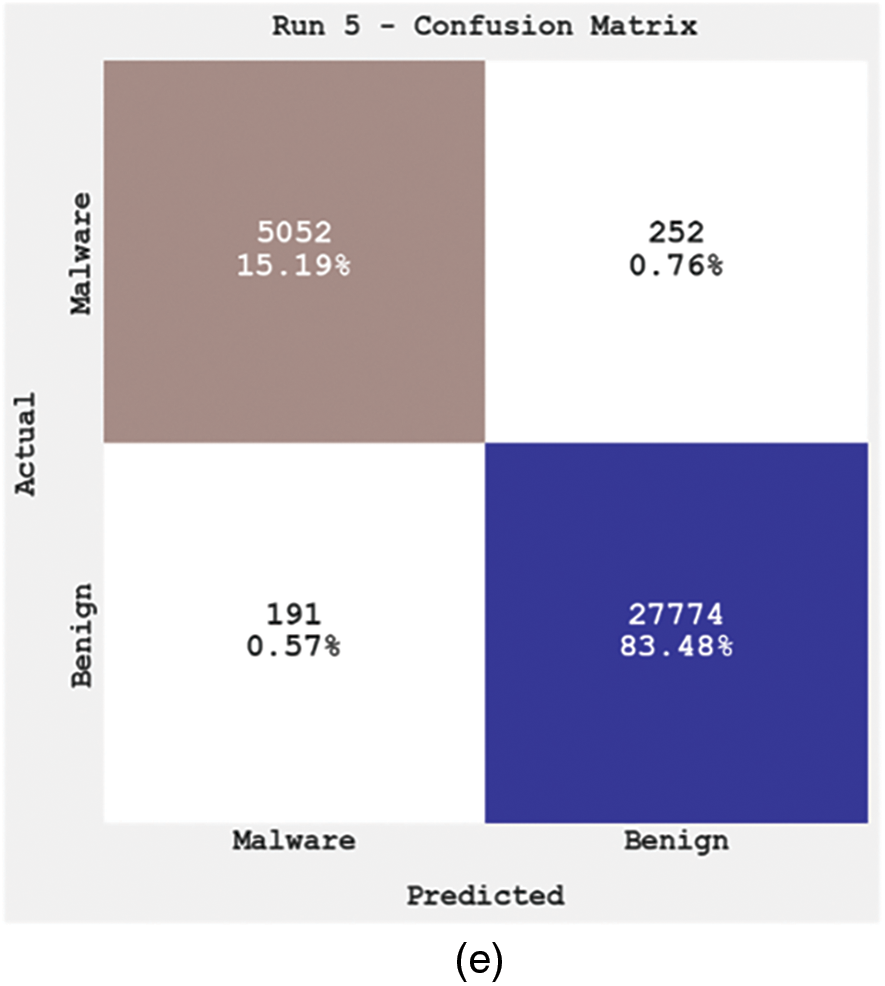
Figure 3: Confusion matrices of OGCNN-MDC approach (a) Run1, (b) Run2, (c) Run3, (d) Run4, and (e) Run5
The overall cyberattack classification results of the proposed OGCNN-MDC model under distinct runs are given in Table 2.
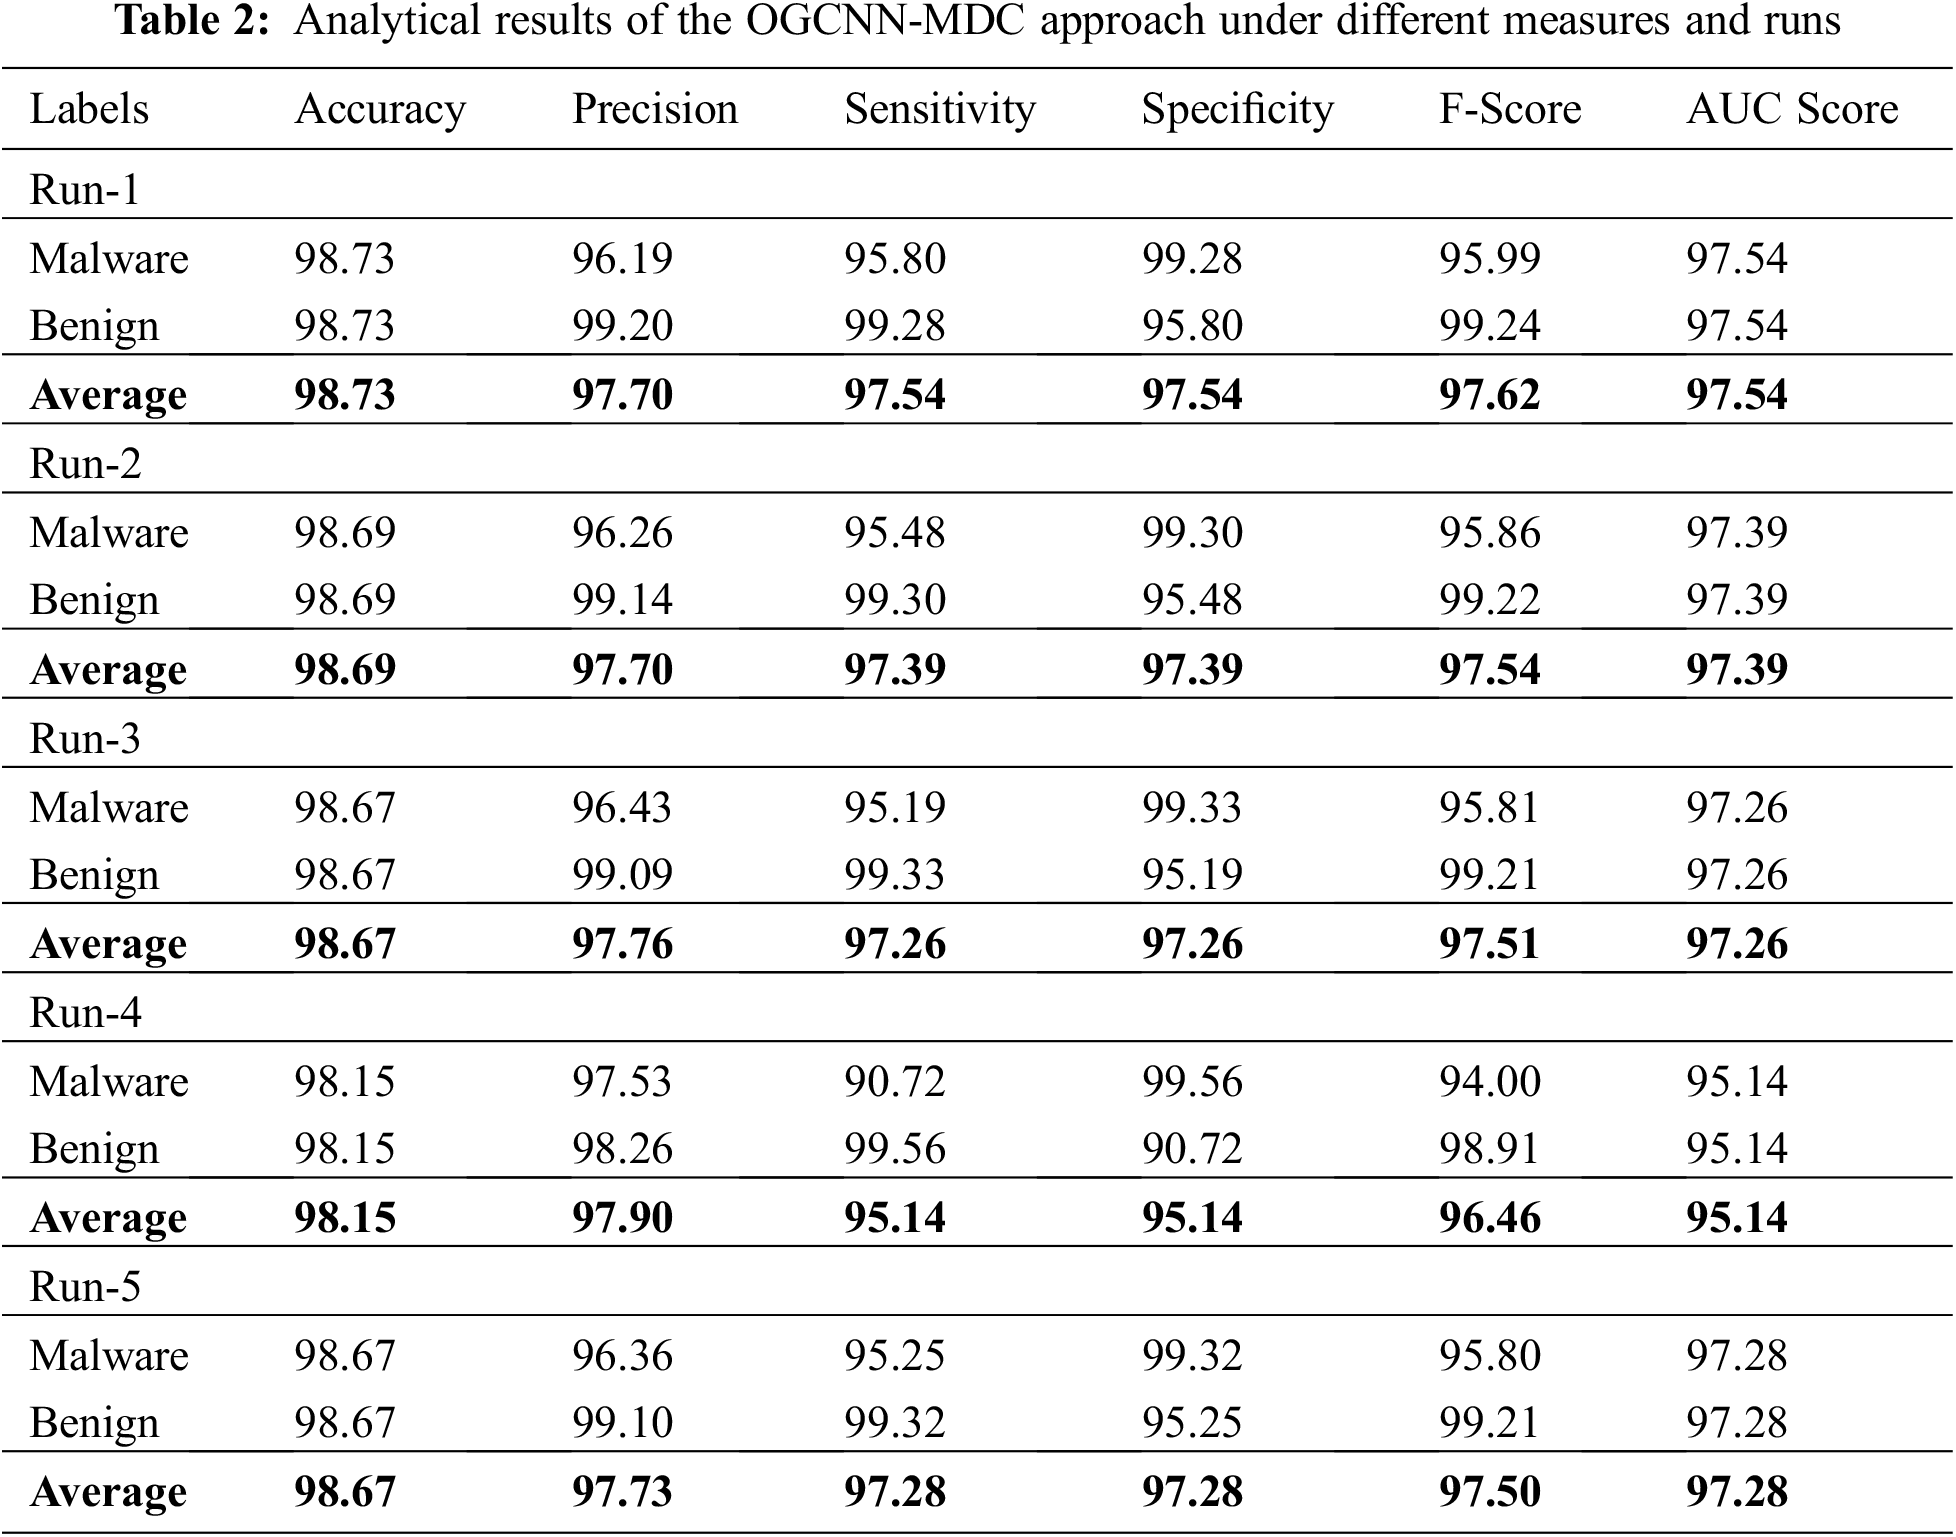
Fig. 4 showcases the run-1 results of the proposed OGCNN-MDC model on both class labels. The figure denotes that the proposed OGCNN-MDC method proficiently identified both malware and benign classes. In malware class, the OGCNN-MDC model attained
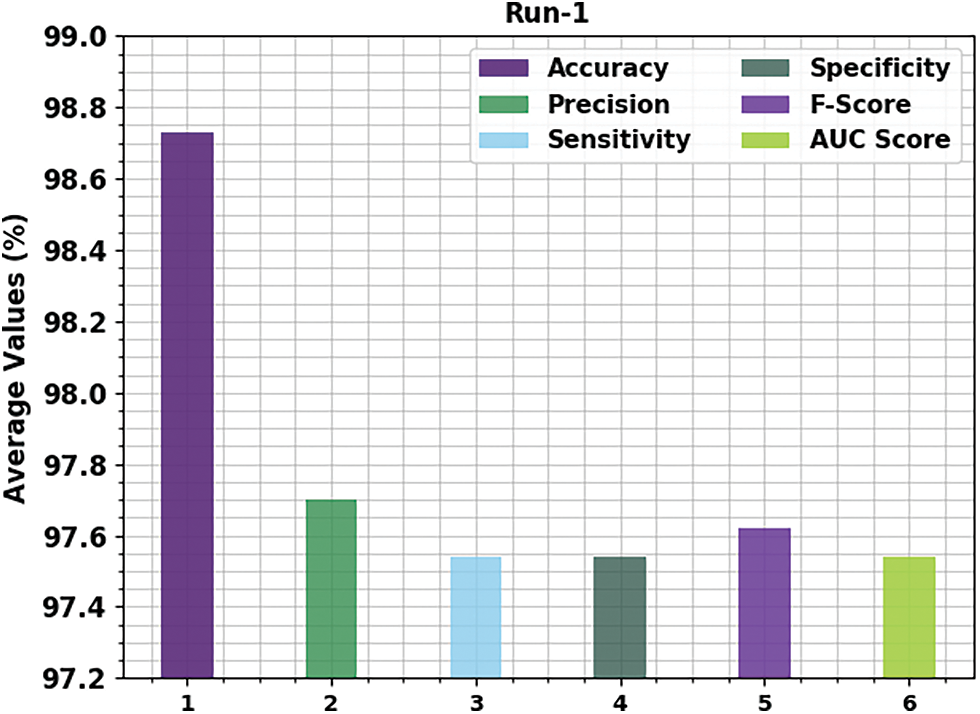
Figure 4: Average analysis results of the OGCNN-MDC approach under Run-1
Fig. 5 displays the run-2 results of the proposed OGCNN-MDC approach on both class labels. The figure is implicit that the OGCNN-MDC algorithm proficiently identified both malware and benign classes. In the malware class, the proposed OGCNN-MDC technique obtained
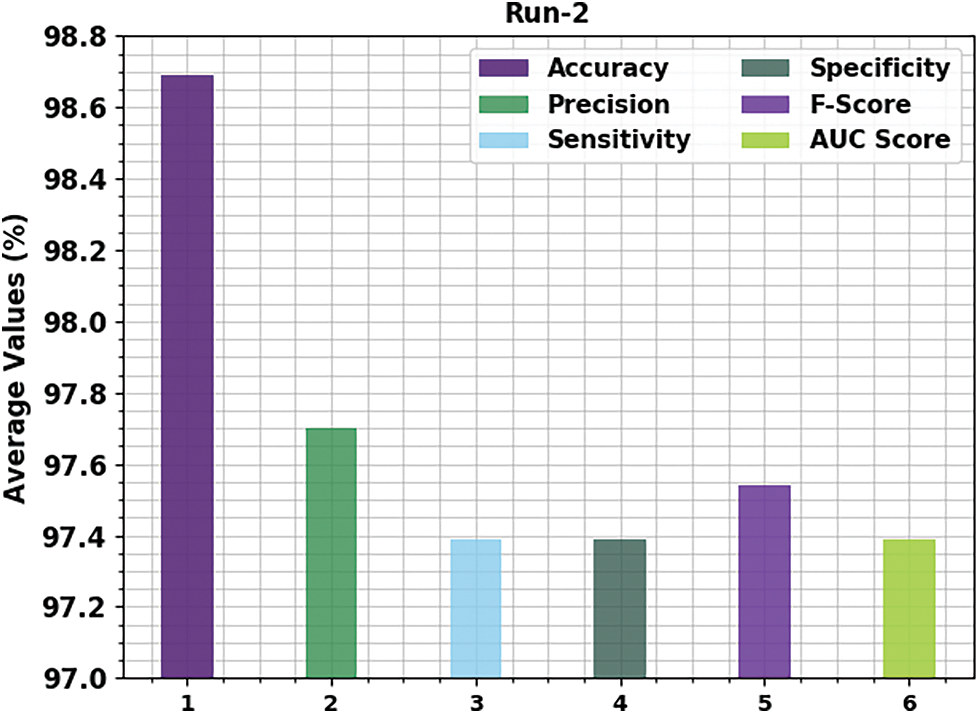
Figure 5: Average analysis results of the OGCNN-MDC approach under Run-2
Fig. 6 exemplifies the run-3 results of the proposed OGCNN-MDC approach on both class labels. The figure implies that the proposed OGCNN-MDC method identified both malware and benign classes excellently. In malware class, the proposed OGCNN-MDC technique gained
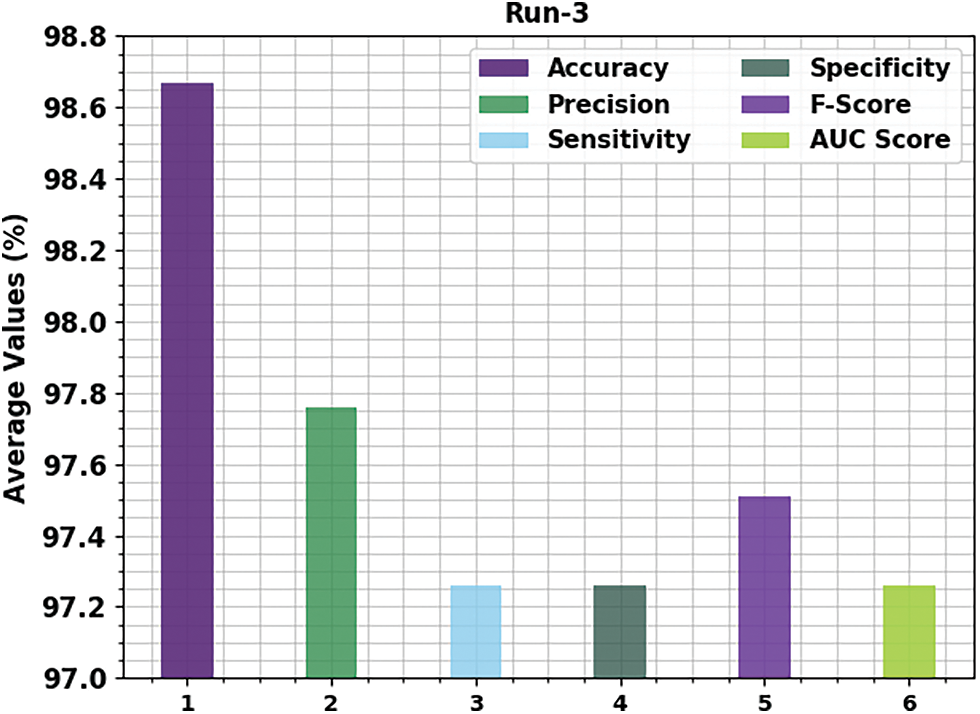
Figure 6: Average analysis results of the OGCNN-MDC approach under Run-3
Fig. 7 displays the run-4 results of the proposed OGCNN-MDC approach on both class labels. The figure infers that the proposed OGCNN-MDC method proficiently identified both malware and benign classes. In the malware class, the proposed OGCNN-MDC algorithm gained
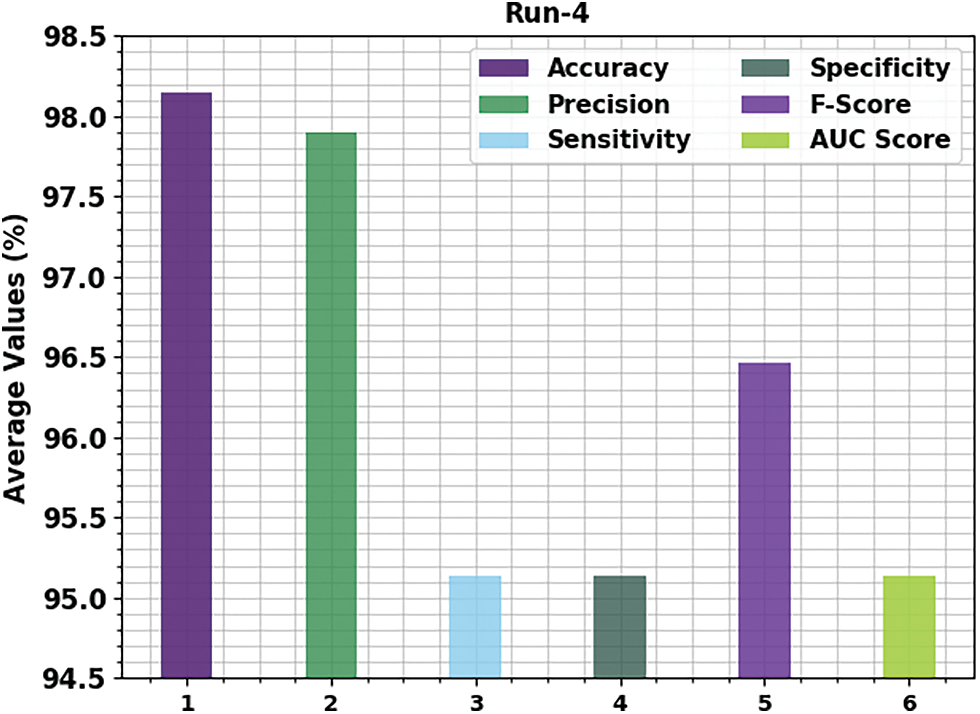
Figure 7: Average analysis results of the OGCNN-MDC approach under Run-4
Fig. 8 portrays the run-5 results of the OGCNN-MDC method on both class labels. The figure denotes that the proposed OGCNN-MDC approach proficiently identified both malware and benign classes. In malware class, the proposed OGCNN-MDC methodology gained
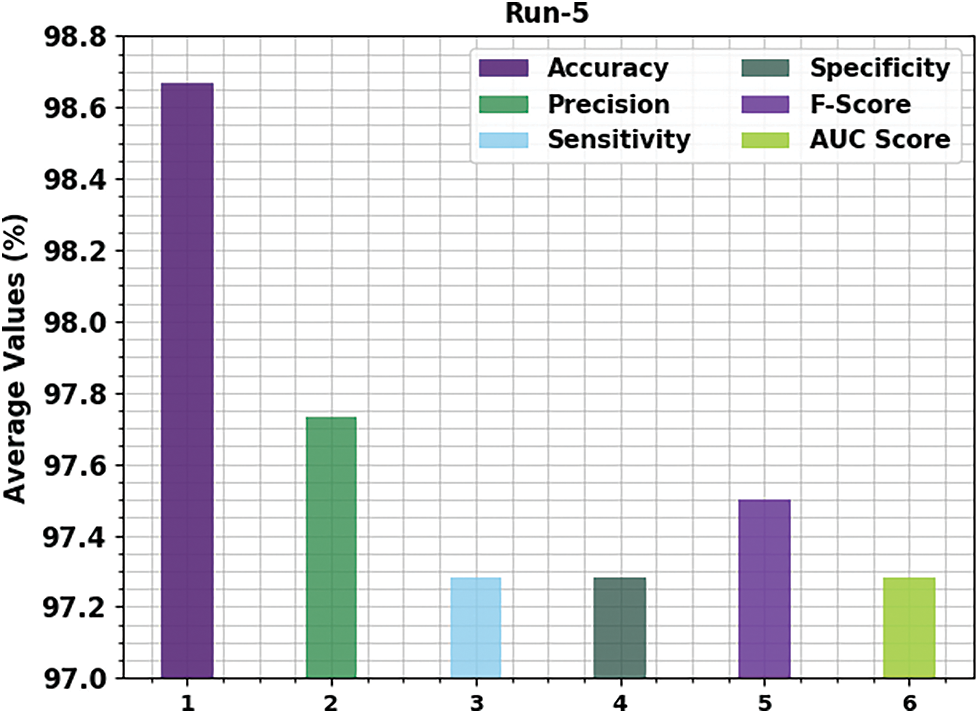
Figure 8: Average analysis results of the OGCNN-MDC approach under Run-5
Both Training Accuracy (TRA) and Validation Accuracy (VLA) values, acquired by the proposed OGCNN-MDC approach on the test dataset, are displayed in Fig. 9. The experimental results infer that the OGCNN-MDC method attained the maximal TRA and VLA values. In contrast, VLA values were higher than the TRA values.
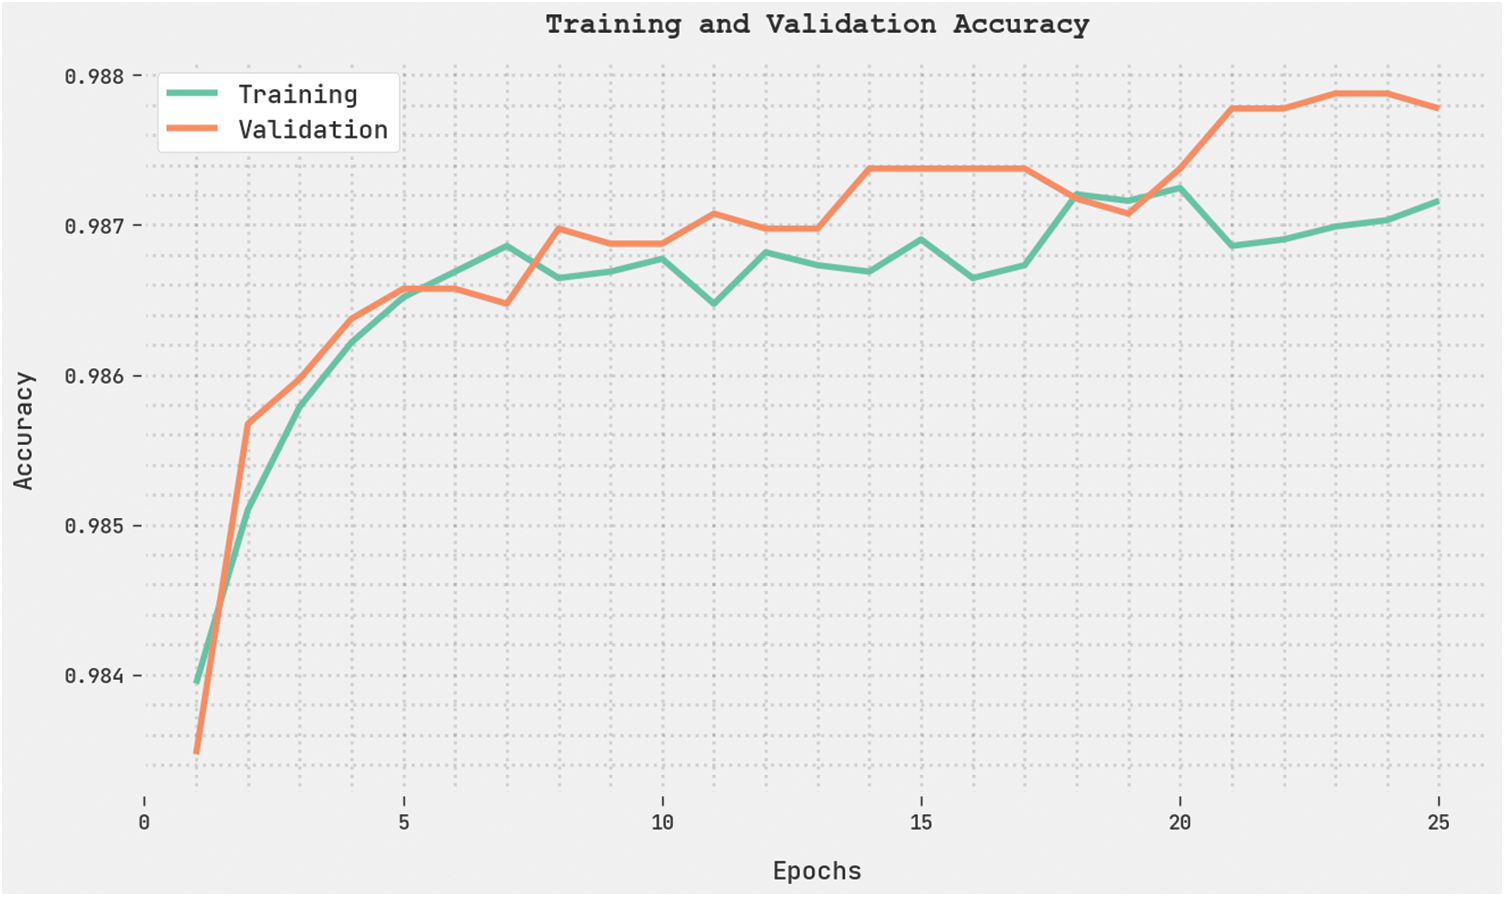
Figure 9: TRA and VLA analyses results of the OGCNN-MDC approach
Both Training Loss (TRL) and Validation Loss (VLL) values attained by the proposed OGCNN-MDC approach on the test dataset are exhibited in Fig. 10. The experimental results denote that the proposed OGCNN-MDC method exhibited the least TRL and VLL values. In contrast, the VLL values were lesser than the TRL values.
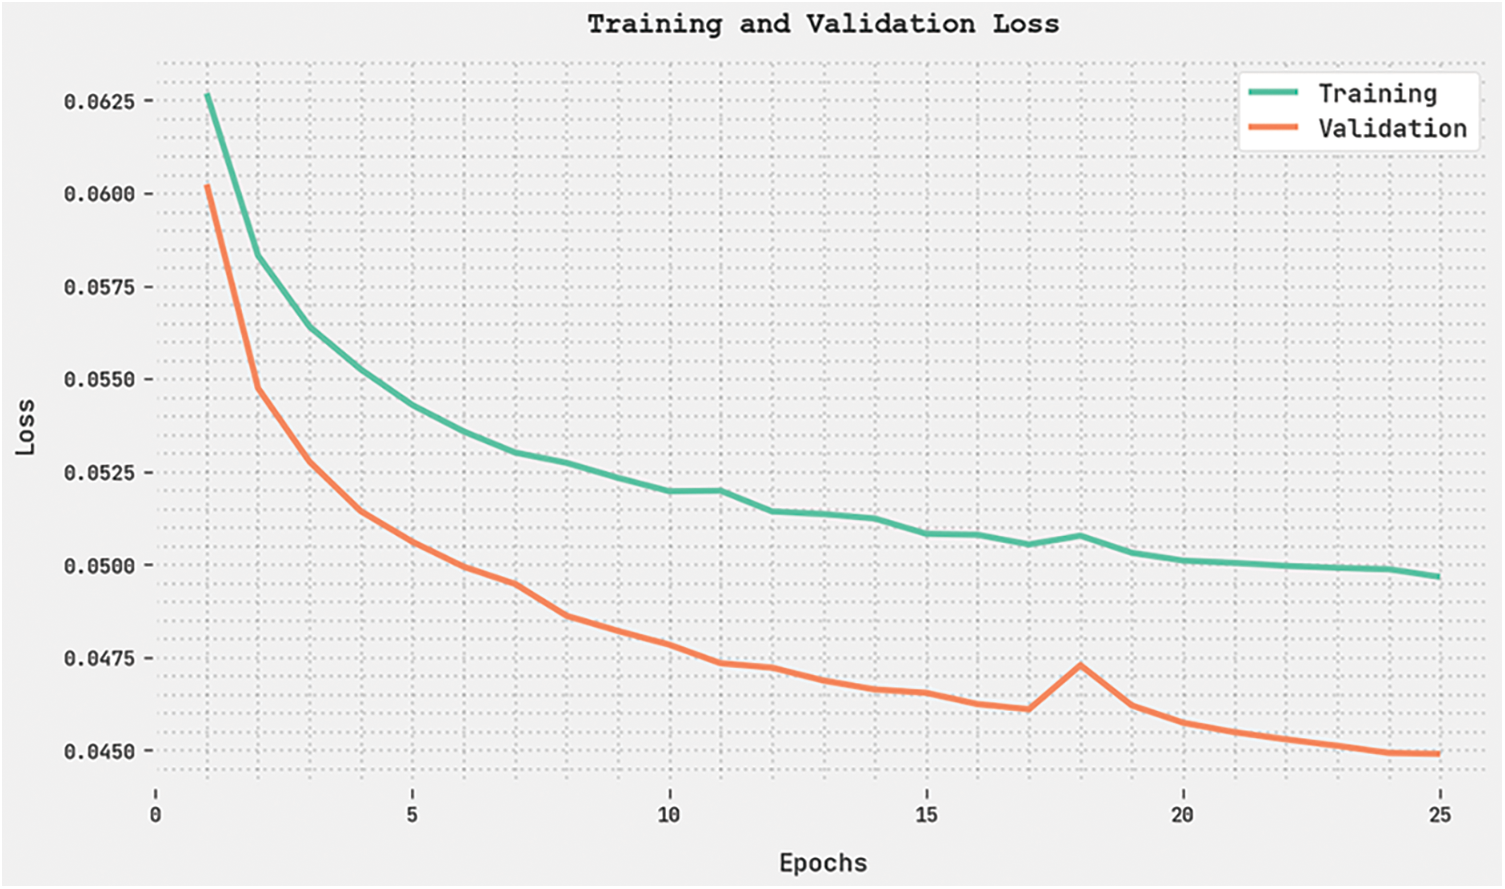
Figure 10: TRL and VLL analyses of the OGCNN-MDC approach
A clear precision-recall analysis was conducted upon the OGCNN-MDC method using the test dataset. The results are portrayed in Fig. 11. The figure shows that the proposed OGCNN-MDC technique produced enhanced precision-recall values under all the classes. A brief ROC analysis was conducted on the proposed OGCNN-MDC technique using the test dataset. The results are shown in Fig. 12. The results represent that the proposed OGCNN-MDC method established its ability to categorise the test dataset under distinct classes.
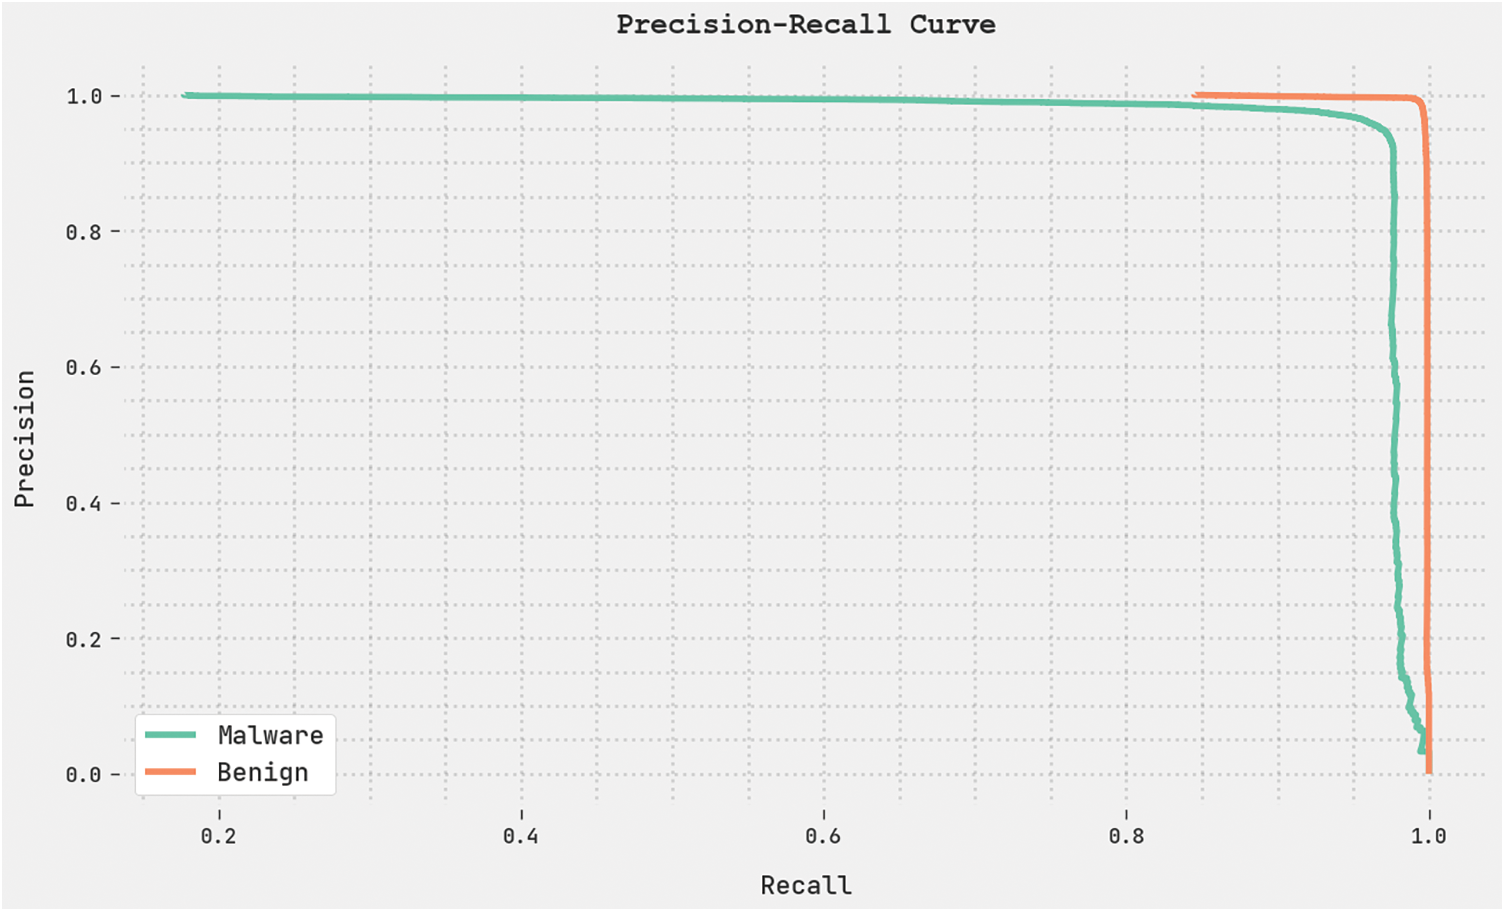
Figure 11: Precision-recall analysis results of the OGCNN-MDC approach
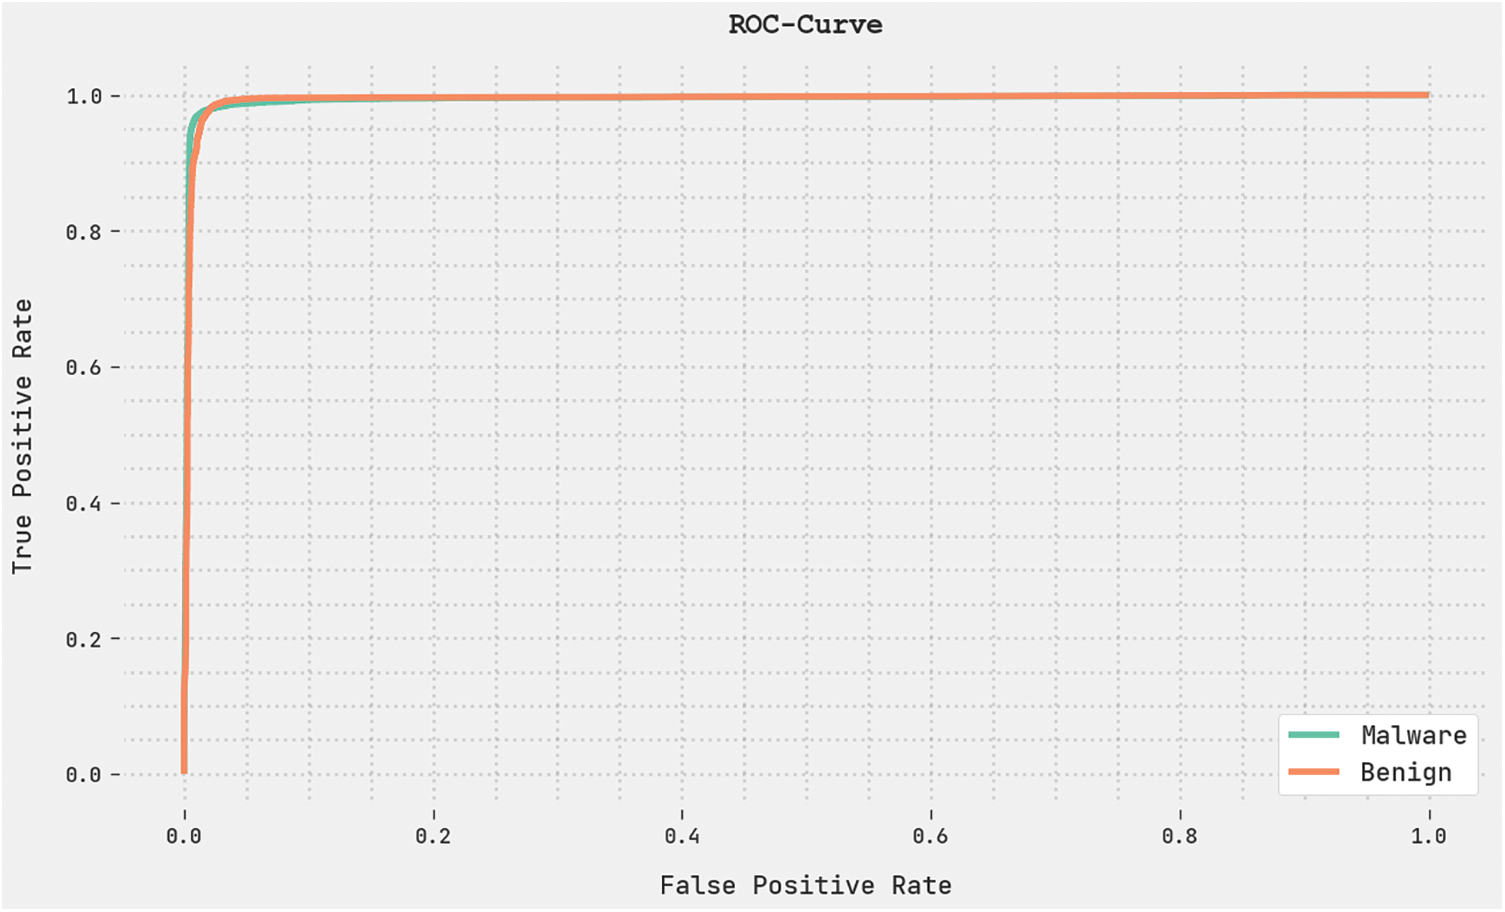
Figure 12: ROC analysis results of the OGCNN-MDC approach
At last, a brief comparative examination was conducted between the OGCNN-MDC method and other ML approaches and the results are provided in Table 3 [19]. Fig. 13 provides the comparative
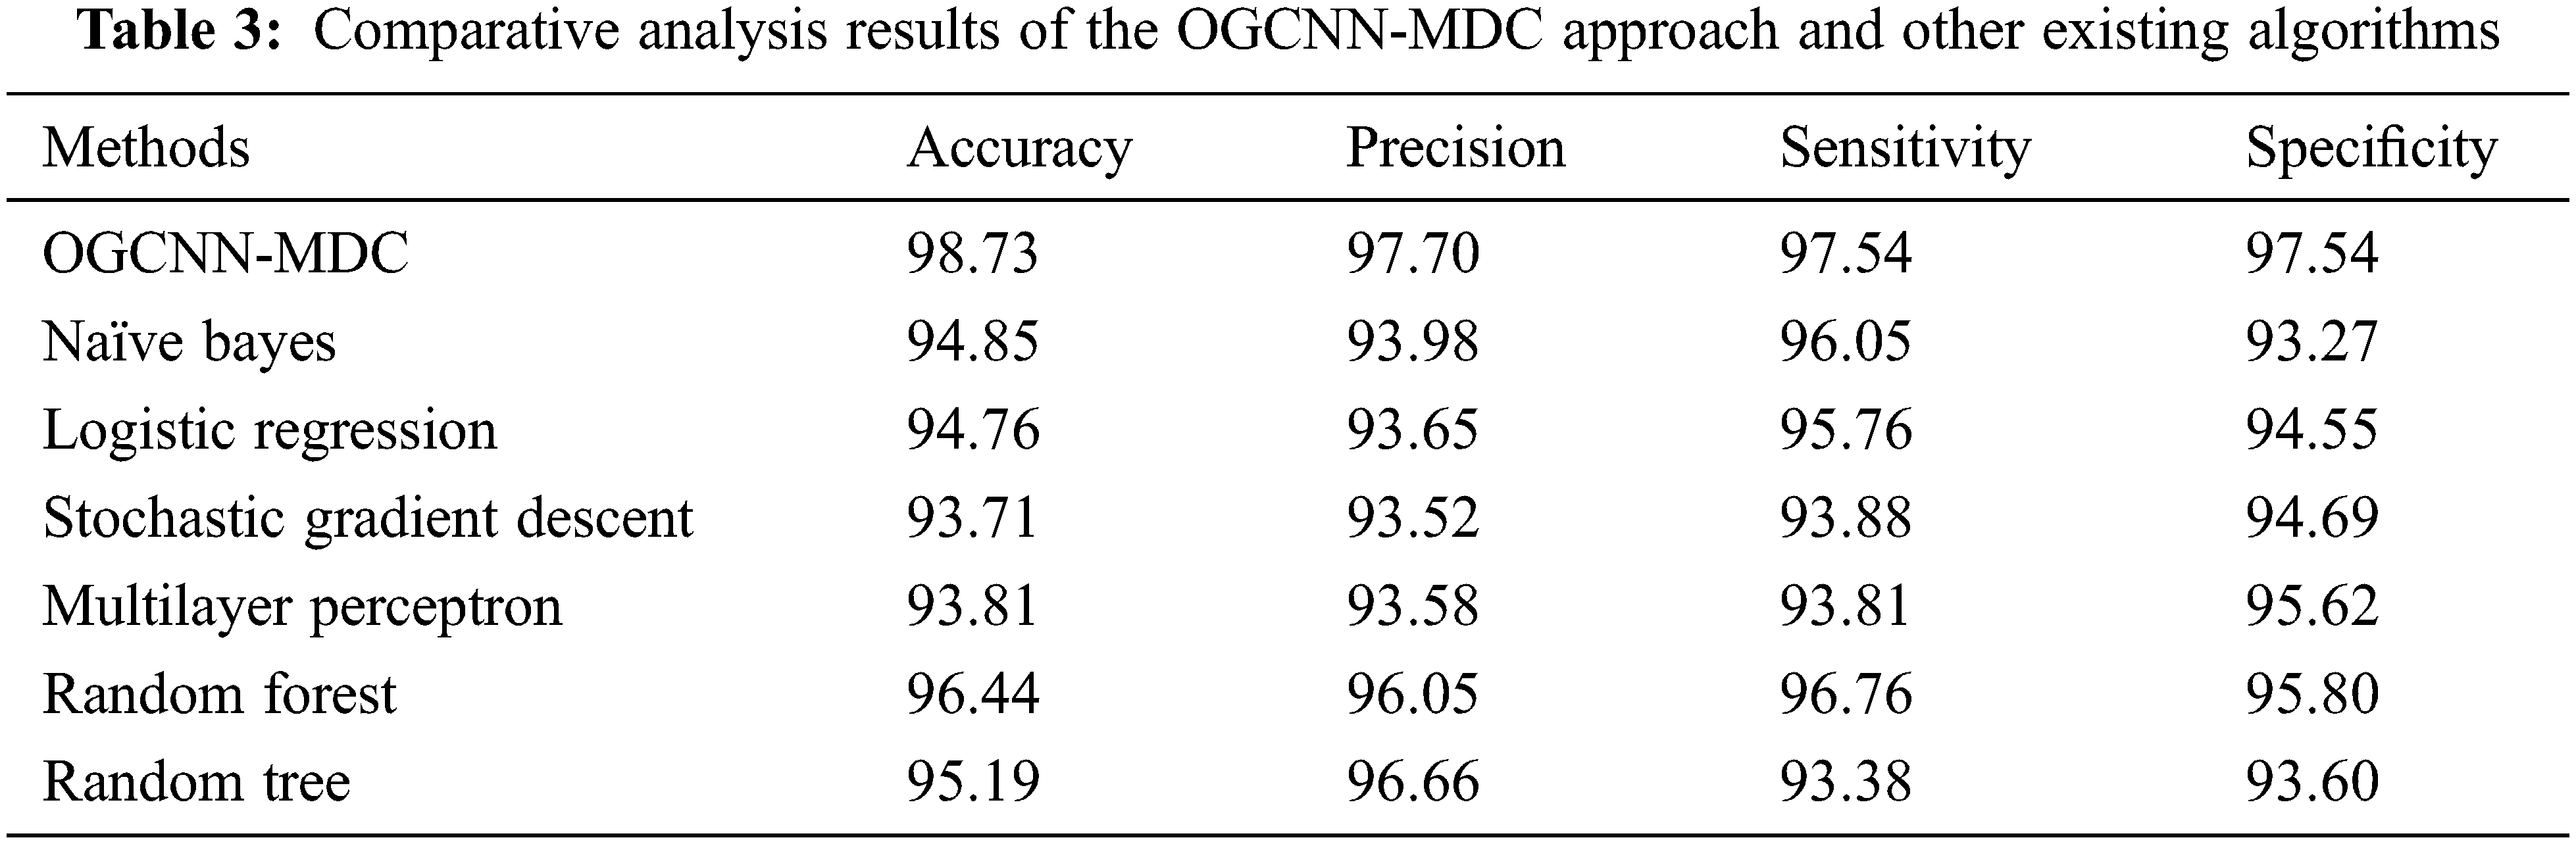
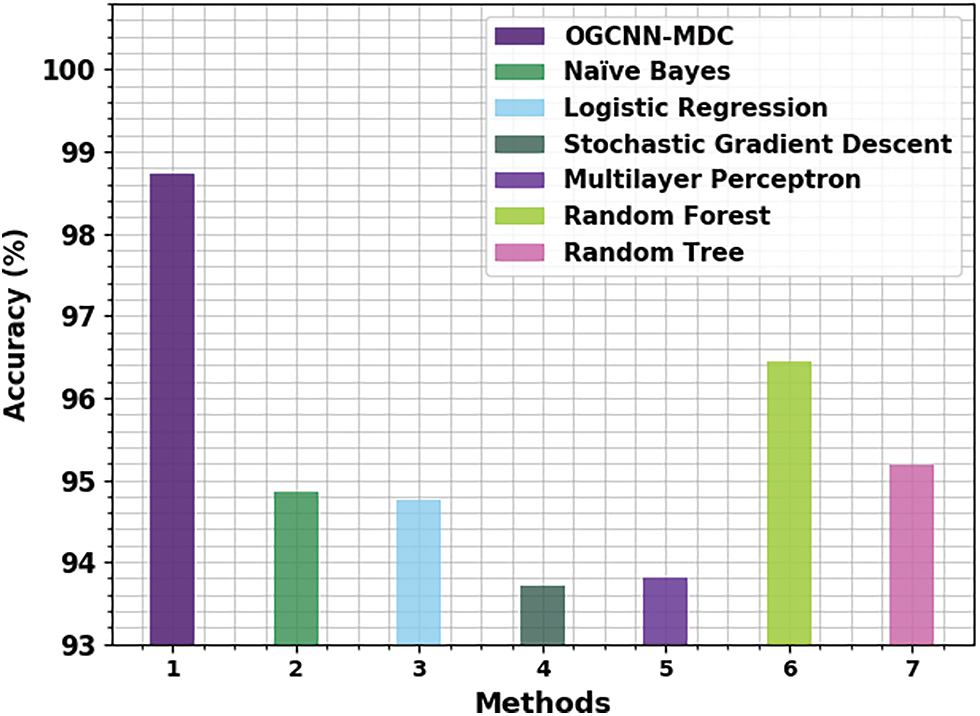
Figure 13:
Fig. 14 presents the detailed comparative
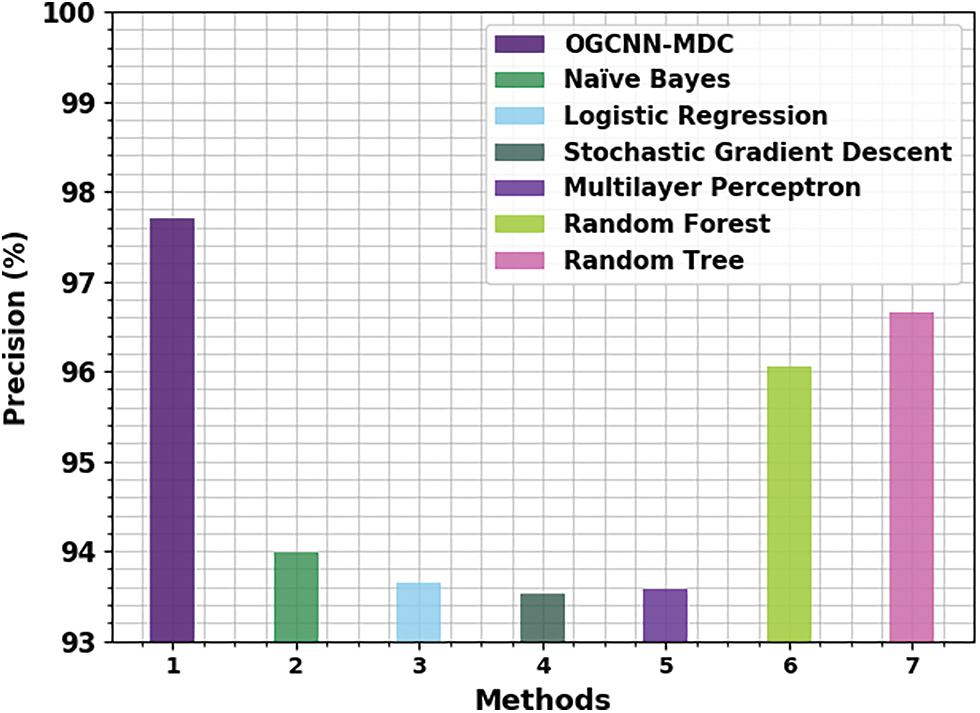
Figure 14:
Fig. 15 illustrates the comprehensive
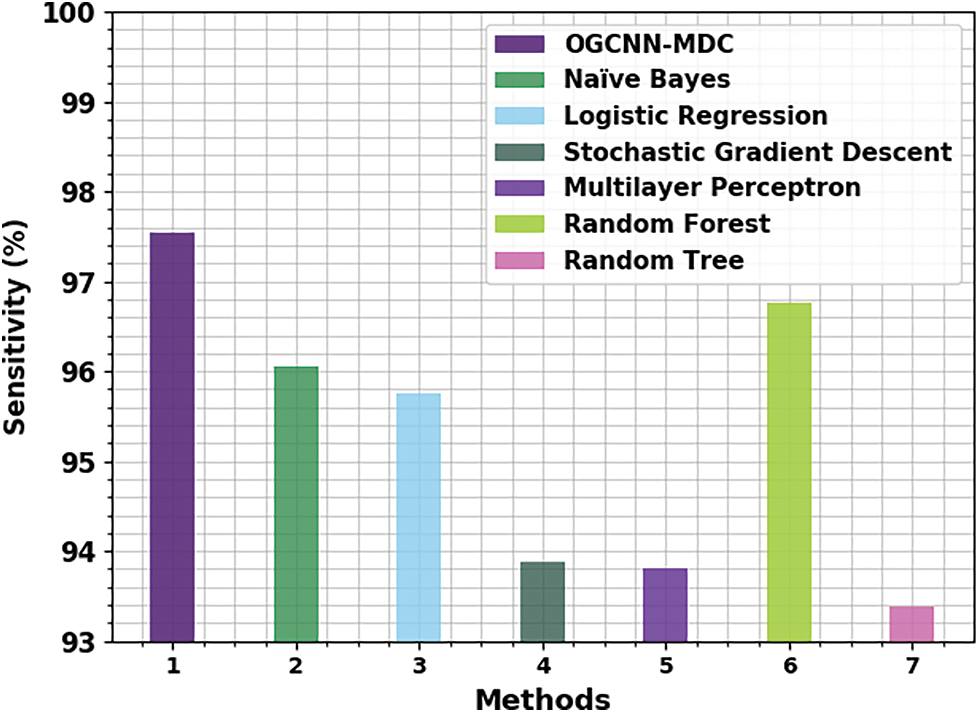
Figure 15:
Fig. 16 demonstrates the comparative
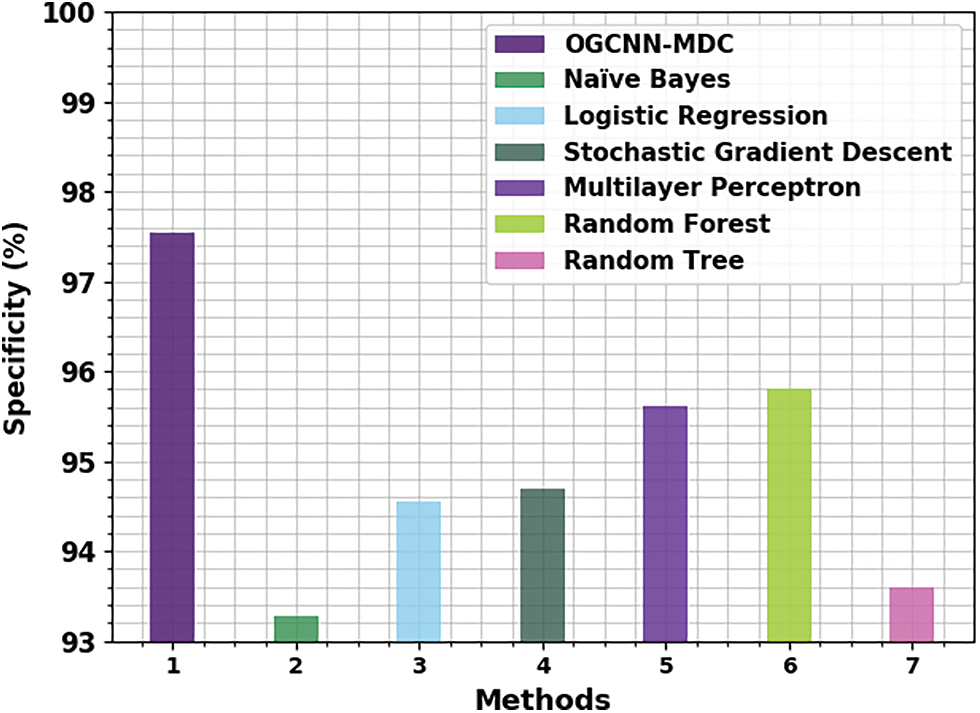
Figure 16:
This article has developed a new OGCNN-MDC model for malware detection and classification in an IoT-enabled cloud environment. The proposed OGCNN-MDC model aims to recognize and categorize the occurrences of malware in the IoT-enabled cloud platform. The presented OGCNN-MDC model has three stages, namely, data pre-processing, malware detection and parameter tuning. To detect and classify the malware, the GCNN model is exploited in this work. To enhance the overall efficiency of the GCNN model, the GMBO algorithm is utilized to adjust the GCNN parameters appropriately. A widespread experimental analysis was conducted to highlight the improvements of the proposed OGCNN-MDC method. A comprehensive comparison study was conducted, and the outcomes confirmed the superiority of the proposed OGCNN-MDC method over other recent approaches with an accuracy of 98.73%.
Funding Statement: Princess Nourah bint Abdulrahman University Researchers Supporting Project number (PNURSP2022R237), Princess Nourah bint Abdulrahman University, Riyadh, Saudi Arabia. The authors would like to thank the Deanship of Scientific Research at Umm Al-Qura University for supporting this work by Grant Code: (22UQU4331004DSR13).
Conflicts of Interest: The authors declare that they have no conflicts of interest to report regarding the present study.
References
1. J. Abawajy, A. Darem and A. A. Alhashmi, “Feature subset selection for malware detection in smart IoT platforms,” Sensors, vol. 21, no. 4, pp. 1374, 2021. [Google Scholar] [PubMed]
2. M. A. Omer, S. R. Zeebaree, M. A. Sadeeq, B. W. Salim, S. X. Mohsin et al., “Efficiency of malware detection in android system: A survey,” Asian Journal of Research in Computer Science, vol. 7, no. 4, pp. 59–69, 2021. [Google Scholar]
3. G. D’Angelo, F. Palmieri, A. Robustelli and A. Castiglione, “Effective classification of android malware families through dynamic features and neural networks,” Connection Science, vol. 33, no. 3, pp. 786–801, 2021. [Google Scholar]
4. J. Jung, J. Park, S. J. Cho, S. Han, M. Park et al., “Feature engineering and evaluation for android malware detection scheme,” Journal of Internet Technology, vol. 22, no. 2, pp. 423–440, 2021. [Google Scholar]
5. A. Mahindru and A. L. Sangal, “MLDroid—Framework for android malware detection using machine learning techniques,” Neural Computing and Applications, vol. 33, no. 10, pp. 5183–5240, 2021. [Google Scholar]
6. V. Sihag, M. Vardhan, P. Singh, G. Choudhary and S. Son, “De-LADY: Deep learning based android malware detection using dynamic features,” Journal of Internet Services and Information Security, vol. 11, no. 2, pp. 34–45, 2021. [Google Scholar]
7. H. Zhu, Y. Li, R. Li, J. Li, Z. You et al., “SEDMDroid: An enhanced stacking ensemble framework for android malware detection,” IEEE Transactions on Network Science and Engineering, vol. 8, no. 2, pp. 984–994, 2020. [Google Scholar]
8. Q. D. Ngo, H. T. Nguyen, V. H. Le and D. H. Nguyen, “A survey of IoT malware and detection methods based on static features,” ICT Express, vol. 6, no. 4, pp. 280–286, 2020. [Google Scholar]
9. S. Baek, J. Jeon, B. Jeong and Y. S. Jeong, “Two-stage hybrid malware detection using deep learning,” Human-Centric Computing and Information Sciences, vol. 11, no. 27, pp. 10–22967, 2021. [Google Scholar]
10. R. Taheri, M. Shojafar, M. Alazab and R. Tafazolli, “FED-IIoT: A robust federated malware detection architecture in industrial IoT,” IEEE Transactions on Industrial Informatics, vol. 17, no. 12, pp. 8442–8452, 2020. [Google Scholar]
11. T. Lei, Z. Qin, Z. Wang, Q. Li and D. Ye, “EveDroid: Event-aware android malware detection against model degrading for IoT devices,” IEEE Internet of Things Journal, vol. 6, no. 4, pp. 6668–6680, 2019. [Google Scholar]
12. X. Liu, X. Du, X. Zhang, Q. Zhu, H. Wang et al., “Adversarial samples on android malware detection systems for IoT systems,” Sensors, vol. 19, no. 4, pp. 974, 2019. [Google Scholar] [PubMed]
13. R. Taheri, R. Javidan and Z. Pooranian, “Adversarial android malware detection for mobile multimedia applications in IoT environments,” Multimedia Tools and Applications, vol. 80, no. 11, pp. 16713–16729, 2021. [Google Scholar]
14. F. Akbar, M. Hussain, R. Mumtaz, Q. Riaz, A. W. A. Wahab et al., “Permissions-based detection of android malware using machine learning,” Symmetry, vol. 14, no. 4, pp. 718, 2022. [Google Scholar]
15. D. T. Dehkordy and A. Rasoolzadegan, “A new machine learning-based method for android malware detection on imbalanced dataset,” Multimedia Tools and Applications, vol. 80, no. 16, pp. 24533–24554, 2021. [Google Scholar]
16. W. Niu, R. Cao, X. Zhang, K. Ding, K. Zhang et al., “Opcode-level function call graph based android malware classification using deep learning,” Sensors, vol. 20, no. 13, pp. 3645, 2020. [Google Scholar] [PubMed]
17. Y. D. Zhang, S. C. Satapathy, D. S. Guttery, J. M. Górriz and S. H. Wang, “Improved breast cancer classification through combining graph convolutional network and convolutional neural network,” Information Processing & Management, vol. 58, no. 2, pp. 102439, 2021. [Google Scholar]
18. M. Dehghani, Z. Montazeri and Š Hubálovský, “GMBO: Group mean-based optimizer for solving various optimization problems,” Mathematics, vol. 9, no. 11, pp. 1190, 2021. [Google Scholar]
19. A. Fournier, F. El Khoury and S. Pierre, “A client/server malware detection model based on machine learning for android devices,” IoT, vol. 2, no. 3, pp. 355–374, 2021. [Google Scholar]
Cite This Article
 Copyright © 2023 The Author(s). Published by Tech Science Press.
This work is licensed under a Creative Commons Attribution 4.0 International License , which permits unrestricted use, distribution, and reproduction in any medium, provided the original work is properly cited.
 Downloads
 Citation Tools