
 Submit a Paper
 Propose a Special lssue
 Open Access
ARTICLE

Determined Reverberant Blind Source Separation of Audio Mixing Signals
1 School of Intelligent Engineering, Shaoguan University, Shaoguan, 512026, China
2 Guangdong Provincial Key Laboratory of Technique and Equipment for Macromolecular Advanced Manufacturing, South China University of Technology, 510641, China
* Corresponding Author: Songxi Hu. Email:
Intelligent Automation & Soft Computing 2023, 36(3), 3309-3323. https://doi.org/10.32604/iasc.2023.035051
Received 05 August 2022; Accepted 04 November 2022; Issue published 15 March 2023
 View Full Text
 Download PDF
Abstract
Audio signal separation is an open and challenging issue in the classical “Cocktail Party Problem”. Especially in a reverberation environment, the separation of mixed signals is more difficult separated due to the influence of reverberation and echo. To solve the problem, we propose a determined reverberant blind source separation algorithm. The main innovation of the algorithm focuses on the estimation of the mixing matrix. A new cost function is built to obtain the accurate demixing matrix, which shows the gap between the prediction and the actual data. Then, the update rule of the demixing matrix is derived using Newton gradient descent method. The identity matrix is employed as the initial demixing matrix for avoiding local optima problem. Through the real-time iterative update of the demixing matrix, frequency-domain sources are obtained. Then, time-domain sources can be obtained using an inverse short-time Fourier transform. Experimental results based on a series of source separation of speech and music mixing signals demonstrate that the proposed algorithm achieves better separation performance than the state-of-the-art methods. In particular, it has much better superiority in the highly reverberant environment.Keywords
In the classical “Cocktail Party Problem”, the collected sound signals are the mixtures of multiple sounds [1], and it is an important task to separate these sounds independently. Additionally, how to separate the received multiple music signals independently is also a practical and meaningful problem in the studio. Thus, it is necessary to design a novel machine learning method to separate speech and music mixing signals.
When the number of sources is equal to the number of sensors, it is a determined mixture. Taking into the effects of echo and reverberant consideration, the mathematical model of mixing signals can be similar to the convolutive model. To solve the source separation problem of convolutive mixing signals, Blind Source Separation (BSS) is an effective source separation method, which can separate the unknown source signals from the mixing signals without knowing any channel information [2–4]. It has been applied to audio signal processing and biomedical signal processing [5,6]. Independent Component Analysis (ICA) is a mature machine learning framework to solve the source separation problem, which supposes that the source signals are mutually statistically independent [7,8]. Independent Vector Analysis (IVA) is the extension of ICA, which is a fast and stable algorithm framework to blindly recover unknown sources [9–11]. Recently, an independent vector extraction method has been proposed for less reverberant environments [12], and independent low-rank matrix analysis is a fast and stable method based on a time-variant sub-Gaussian source model for determining blind audio source separation, which has a much faster convergence speed and better separation performance [13].
Determined BSS based on time-frequency masking is a very popular speech separation algorithm [14–18]. Fast Independent Component Analysis (FastICA) algorithm [19], Parallel Factor Simultaneous Diagonalization (PARAFAC-SD) algorithm [20], Projection Successive Projection Algorithm (Pro-SPA) algorithm [21], and Low-Rank Nonnegative Matrix Factorization (Low-Rank NMF) algorithm [22] are classical time-frequency BSS algorithms to solve determined convolutive mixture problem. However, the sequence of source signals estimated at the time-frequency point is easy to confuse, and it is difficult to maintain the sequence consistency of source signals, leading to the permutation ambiguity problem. The frequency bin-wise clustering and permutation alignment method is a robust and precise method to solve the permutation problem [23,24]. The direction of arrival method based spatial covariance model can mitigate the effect of spatial aliasing at high frequencies [25–27]. Recently, a consistent blind canonical polyadic decomposition based on the direction of arrival estimate method is proposed for acoustic vector sensor arrays [28]. The multichannel NMF method can avoid the permutation ambiguity problem by using directivity-aware jointly-diagonalizable spatial covariance matrices [29,30]. In addition, tensor decomposition technical by using coupled frequency bins can eliminate the permutation ambiguity [31]. Nonnegative tensor decomposition model and sparse analysis method have been applied to audio signal separation [32–34]. However, audio source separation in the reverberant environment has always been a hot unsolved problem.
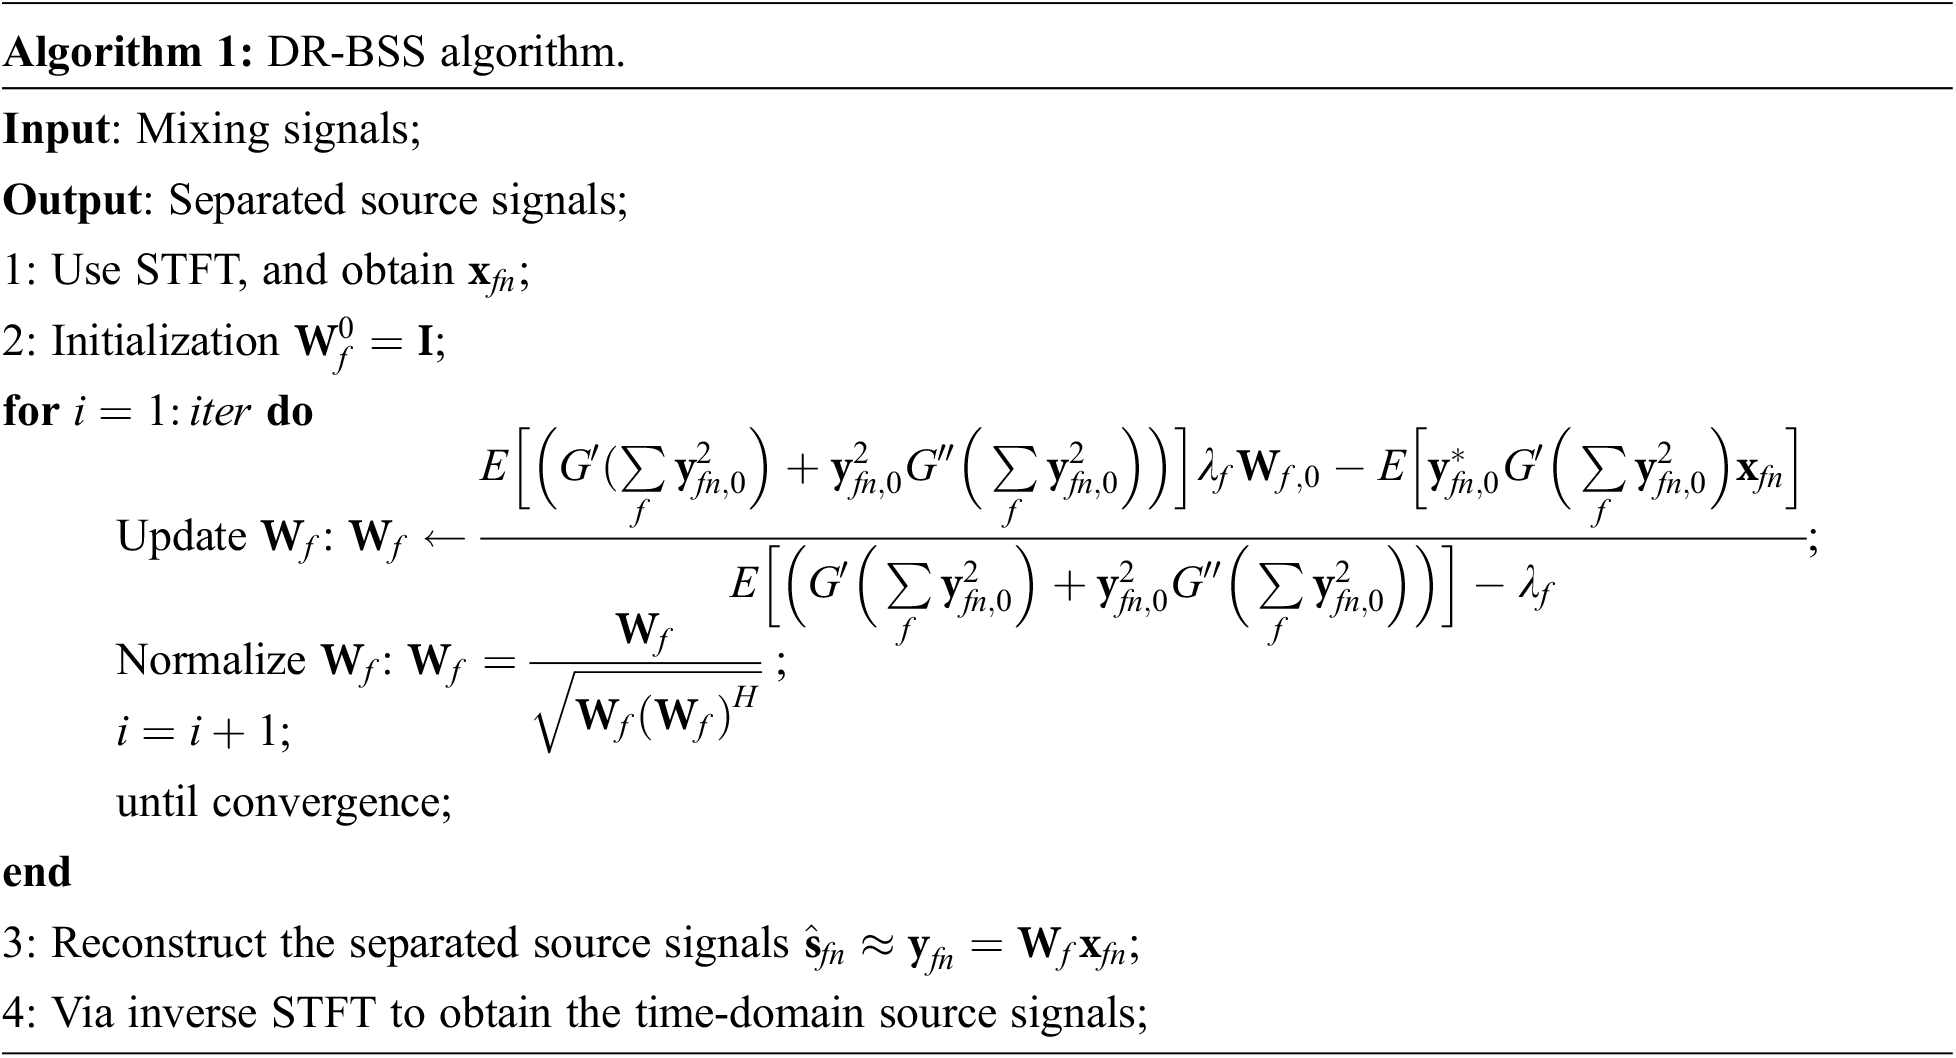
In this paper, we propose a novel Determined Reverberant Blind Source Separation (DR-BSS) algorithm to separate the speech and music mixing signals for the convolutive mixture case. First of all, the time-domain reverberant convolutive mixing signals are transformed into frequency-domain linear mixing signals via Short Time Fourier Transform (STFT). In order to obtain the accurate demixing matrix, a new cost function is built and the update rule of the demixing matrix is derived using Newton gradient descent method. To avoid local optima problem, the identity matrix is used as the initial demixing matrix for the iterative updating process. The frequency-domain sources are reconstructed based on the demixing matrix. Then, the time-domain sources are obtained using inverse STFT.
The main novelty of this paper can be summarized as:
• DR-BSS algorithm is designed, where the update rules of the demixing matrix are obtained via strict mathematical theory derivation. Frequency-domain sources are obtained using the real-time iterative update of the demixing matrix.
• Experimental results show that source separation performance of this proposed DR-BSS algorithm is better than the state-of-the-art methods, especially in much higher reverberation circumstances.
This article starts with an introduction, the remaining is organized as follows. Section 2 describes the reverberant convolutive system model. Section 3 proposes the DR-BSS algorithm to separate speech and music mixing signals. Experimental results based on source separation performance of speech and music convolutive mixtures will be demonstrated in Section 4. Finally, conclusions are proposed in Section 5.
The reverberant mixing model can be represented as the convolution of each source
where
Using the STFT, the source signals and mixing signals in each time-frequency slot are defined as
where
where
where
2.3 Overall Structure of the Study
The overall structure of the study is summarized as follows. First of all, the mixing signals in the time domain are transmitted into the frequency domain by using STFT. Then, a new cost function is built to obtain the accurate demixing matrix. Furthermore, the update rule of the demixing matrix is derived using the Newton gradient descent method. Through the real-time iterative update of the demixing matrix, the frequency-domain sources are obtained. Finally, the time-domain sources can be obtained using inverse STFT.
In order to obtain the accurate demixing matrix
where
where the point of Taylor expansion changes from
where
so that
where
Substitute Eq. (13) into the Eq. (12), using the reduction of fractions to a common denominator, we can get
Then, using the normalization:
Additionally, by using Newton gradient descent method and Taylor expansion (7)–(11), the convergence behavior is guaranteed. To avoid local optima, we use the identity matrix as the initial unmixing matrix, i.e.,
In the experimental section, the proposed algorithm is applied to speech and music signal separation problems, the convolutive mixing signals used in the experiments are generated in a virtual room with artificial RIRs [36], where the dimensions are
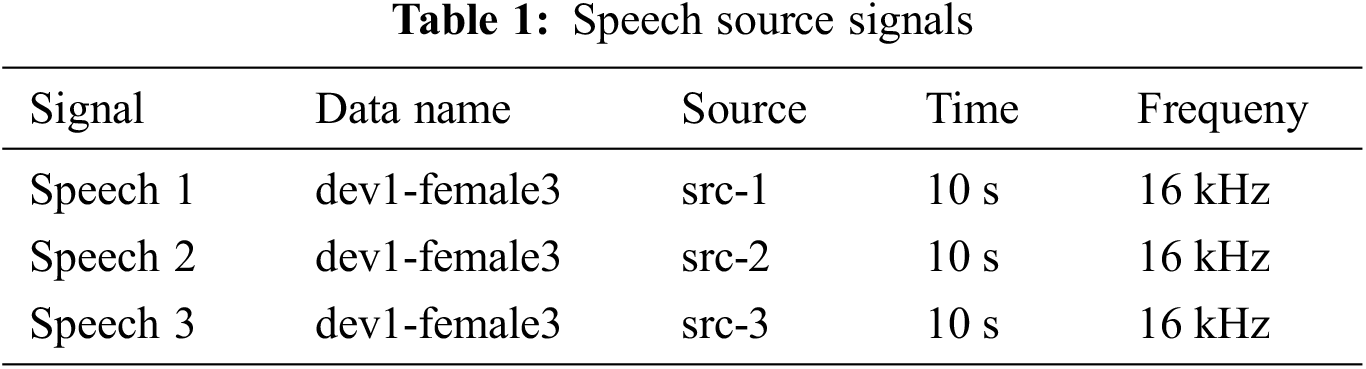
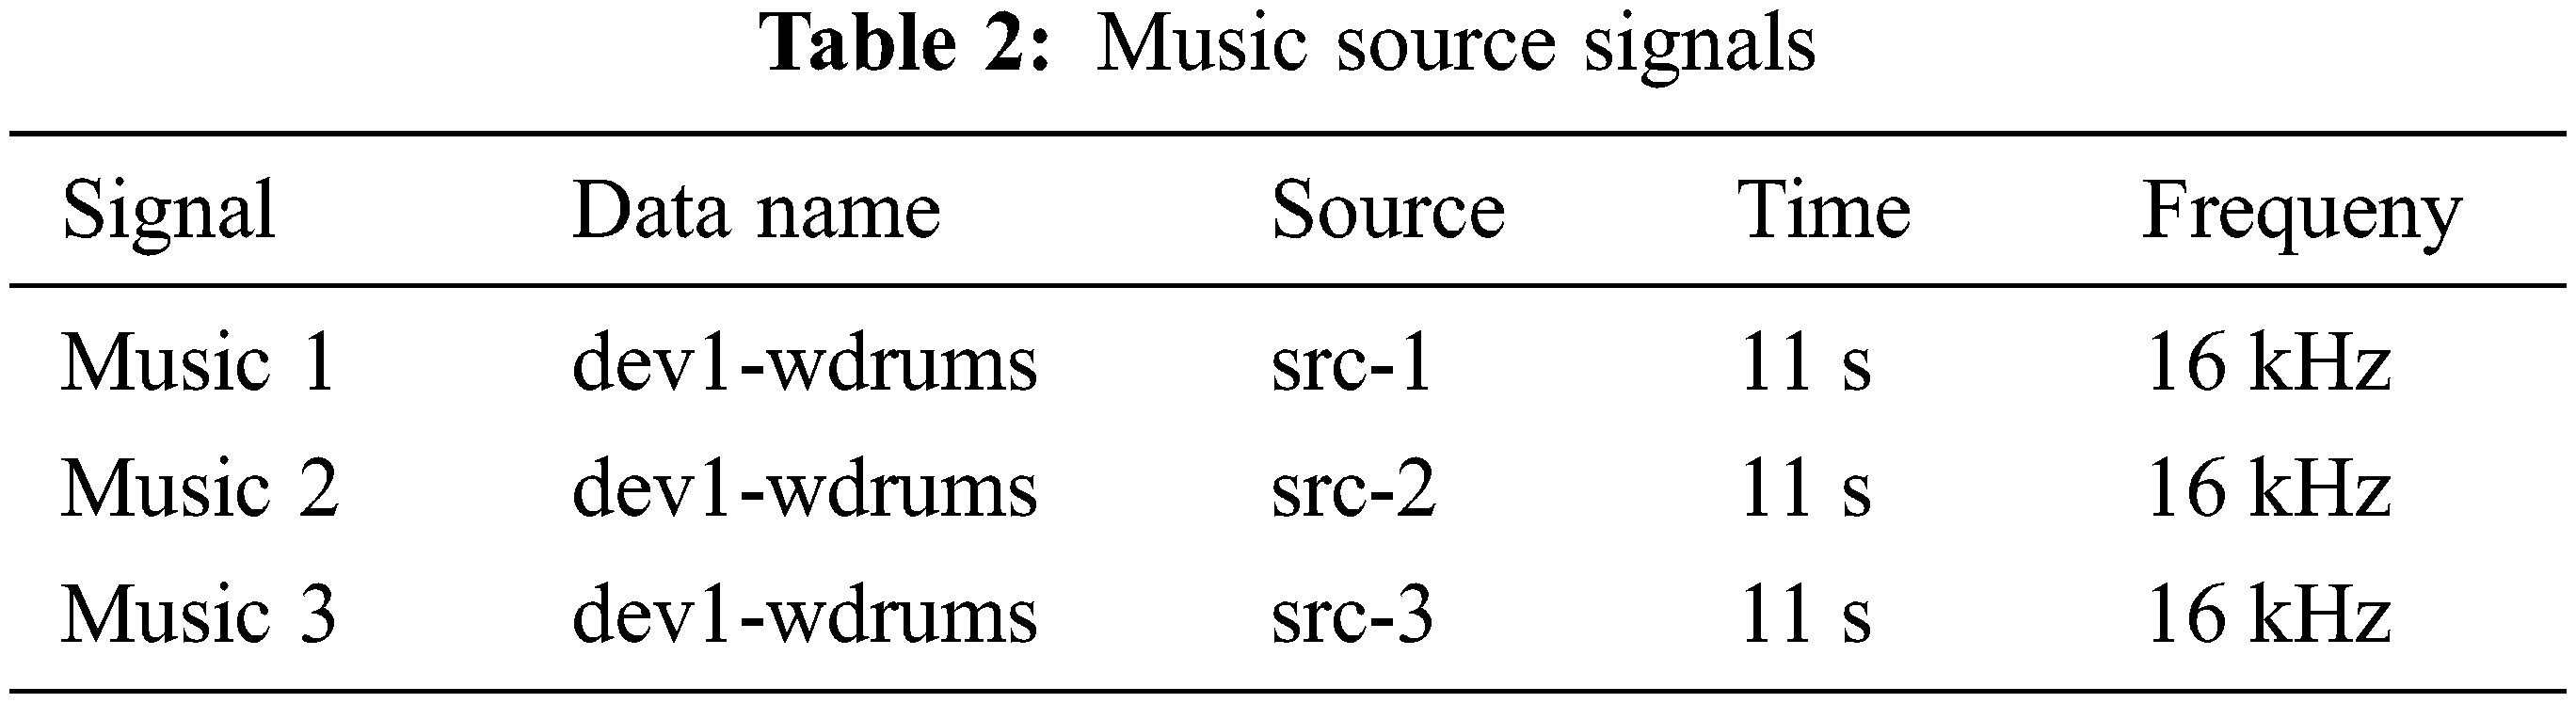
The dataset comes from the public development dataset of the 2011 Signal Separation Evaluation Campaign (SISEC 2011) [37]. We select two types of signals for evaluation: speech and music signals. The speech sources used in the following experiments are shown in Table 1, and the music sources are shown in Table 2, respectively.
To evaluate the separation performance, signal-to-interference ratio (SIR) is selected as the evaluation criteria, which is defined as [20]
The average SIR determines the amount of cross-talk and is an established evaluation technique. The higher the value is, the better the separation performance is. Therefore, the discussion of the separation performance is mainly based on the average SIR in the following experiments.
To show the superiority of the proposed DR-BSS algorithm, the FastICA algorithm [19], PARAFAC-SD algorithm [20], Pro-SPA algorithm [21], and Low-Rank NMF algorithm [22] are used for comparison. These general algorithm models are the same, but the designed methods are different. FastICA is a time-domain algorithm, which combines multichannel spatio-temporal prewhitening with novel adaptive procedures to solve the blind separation of convolutive mixtures. PARAFAC-SD is a frequency-domain technique based on tensor decomposition to perform multichannel convolutive speech mixture BSS. Pro-SPA is a covariance-domain algorithm, which exploits convex geometry for blind separation of quasi-stationary sources. Low-Rank NMF is using IVA and NMF techniques to solve determined convolutive BSS. By comparing the state-of-the-art algorithms, it will show the superiority of the proposed DR-BSS algorithm.
4.3 Source Separation Experiments on Speech Mixing Signals
Due to the experimental environment is affected by multiple mixed factors, including reverberation time, the distance between microphones, the distance between sound sources, the distance between microphones and sound sources, and the number of sound sources and microphones, such that the separation results did not show a certain regularity. In the following experiment, the distance between microphones is fixed at 0.5 m and the distance from the sound source to the microphone is fixed at 1 m.
First of all, we consider the effect of reverberation time RT60 to source separation performance, the number of sources is 2 and the number of sensors is also 2. The reverberation time RT60 varies from 100 to 900 ms. RT60 of a room is defined as the time it takes for sound to decay 60 dB, which reflects the convolution complexity. The locations of sources and sensors in the room are shown in Fig. 1. The separation performance SIR vs. RT60 and different algorithm comparison is shown in Fig. 2. It is seen that SIR results of the proposed algorithm are better than the compared algorithms. Especially in the high reverberation environment, when RT60 varies from 300 to 900 ms, the DR-BSS algorithm improves 2.51, 3.07, 3.17, 3.12, 3.22, 3.57, 3.22 dB compared with the best separation results at present, respectively.
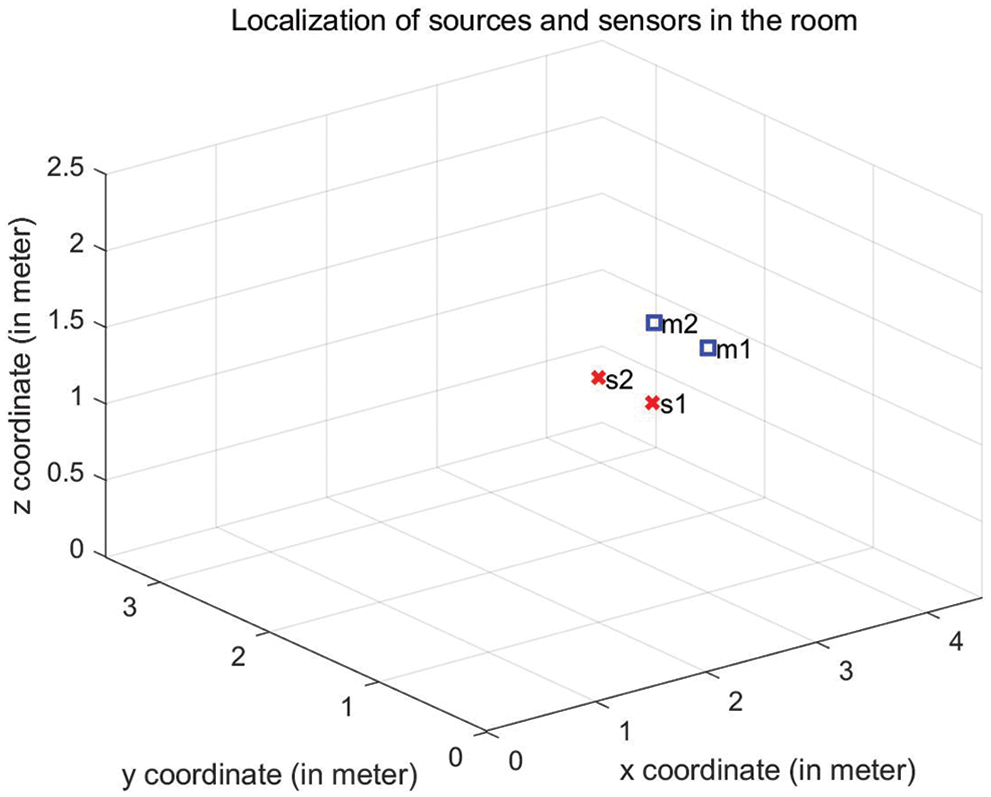
Figure 1: Locations of sources and sensors (
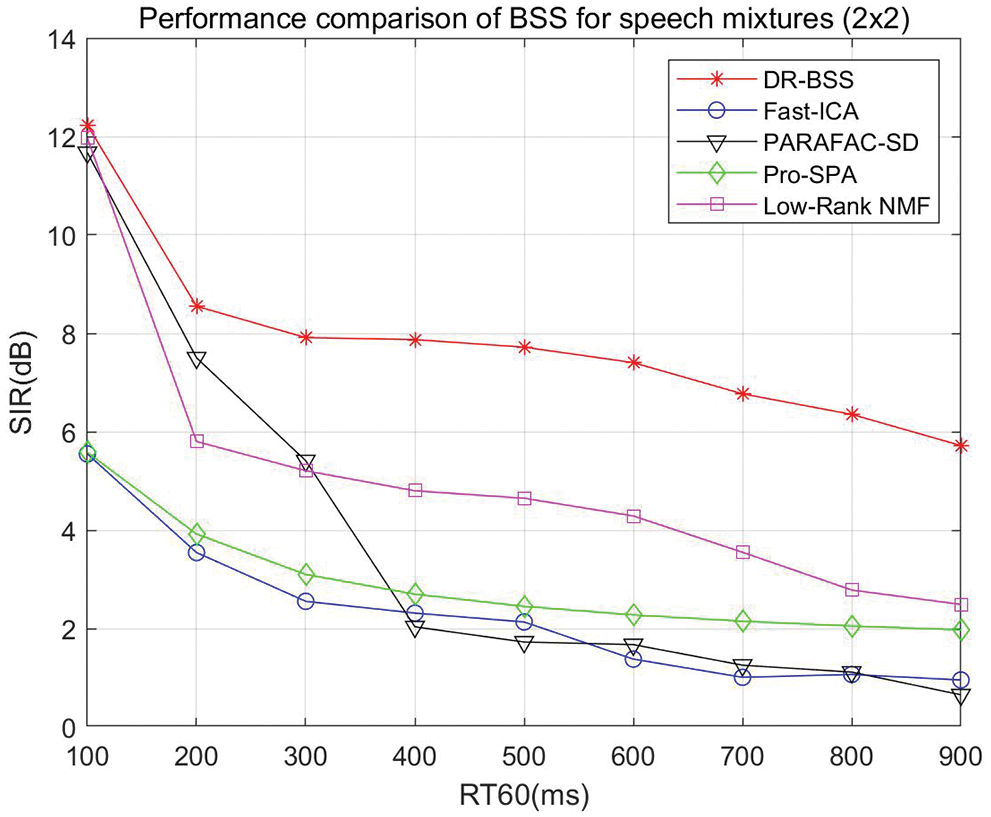
Figure 2: Source separation performance of speech mixtures (
In order to visualize the separation results, we compare the separated speech sources with the origin speech source signals. Separation results are shown in Fig. 3, where the impulse response is set as 200 ms shown in Fig. 3a, the mixing signals are seen in Fig. 3b, the origin source signals are seen in Fig. 3c, and the separated source signals are seen in Fig. 3d. Compared the Fig. 3c with the Fig. 3d, it can be seen that the two speech source signals have been separated successfully. The separation results of speech-1 and speech-2 are 9.78 and 6.29 dB, respectively.
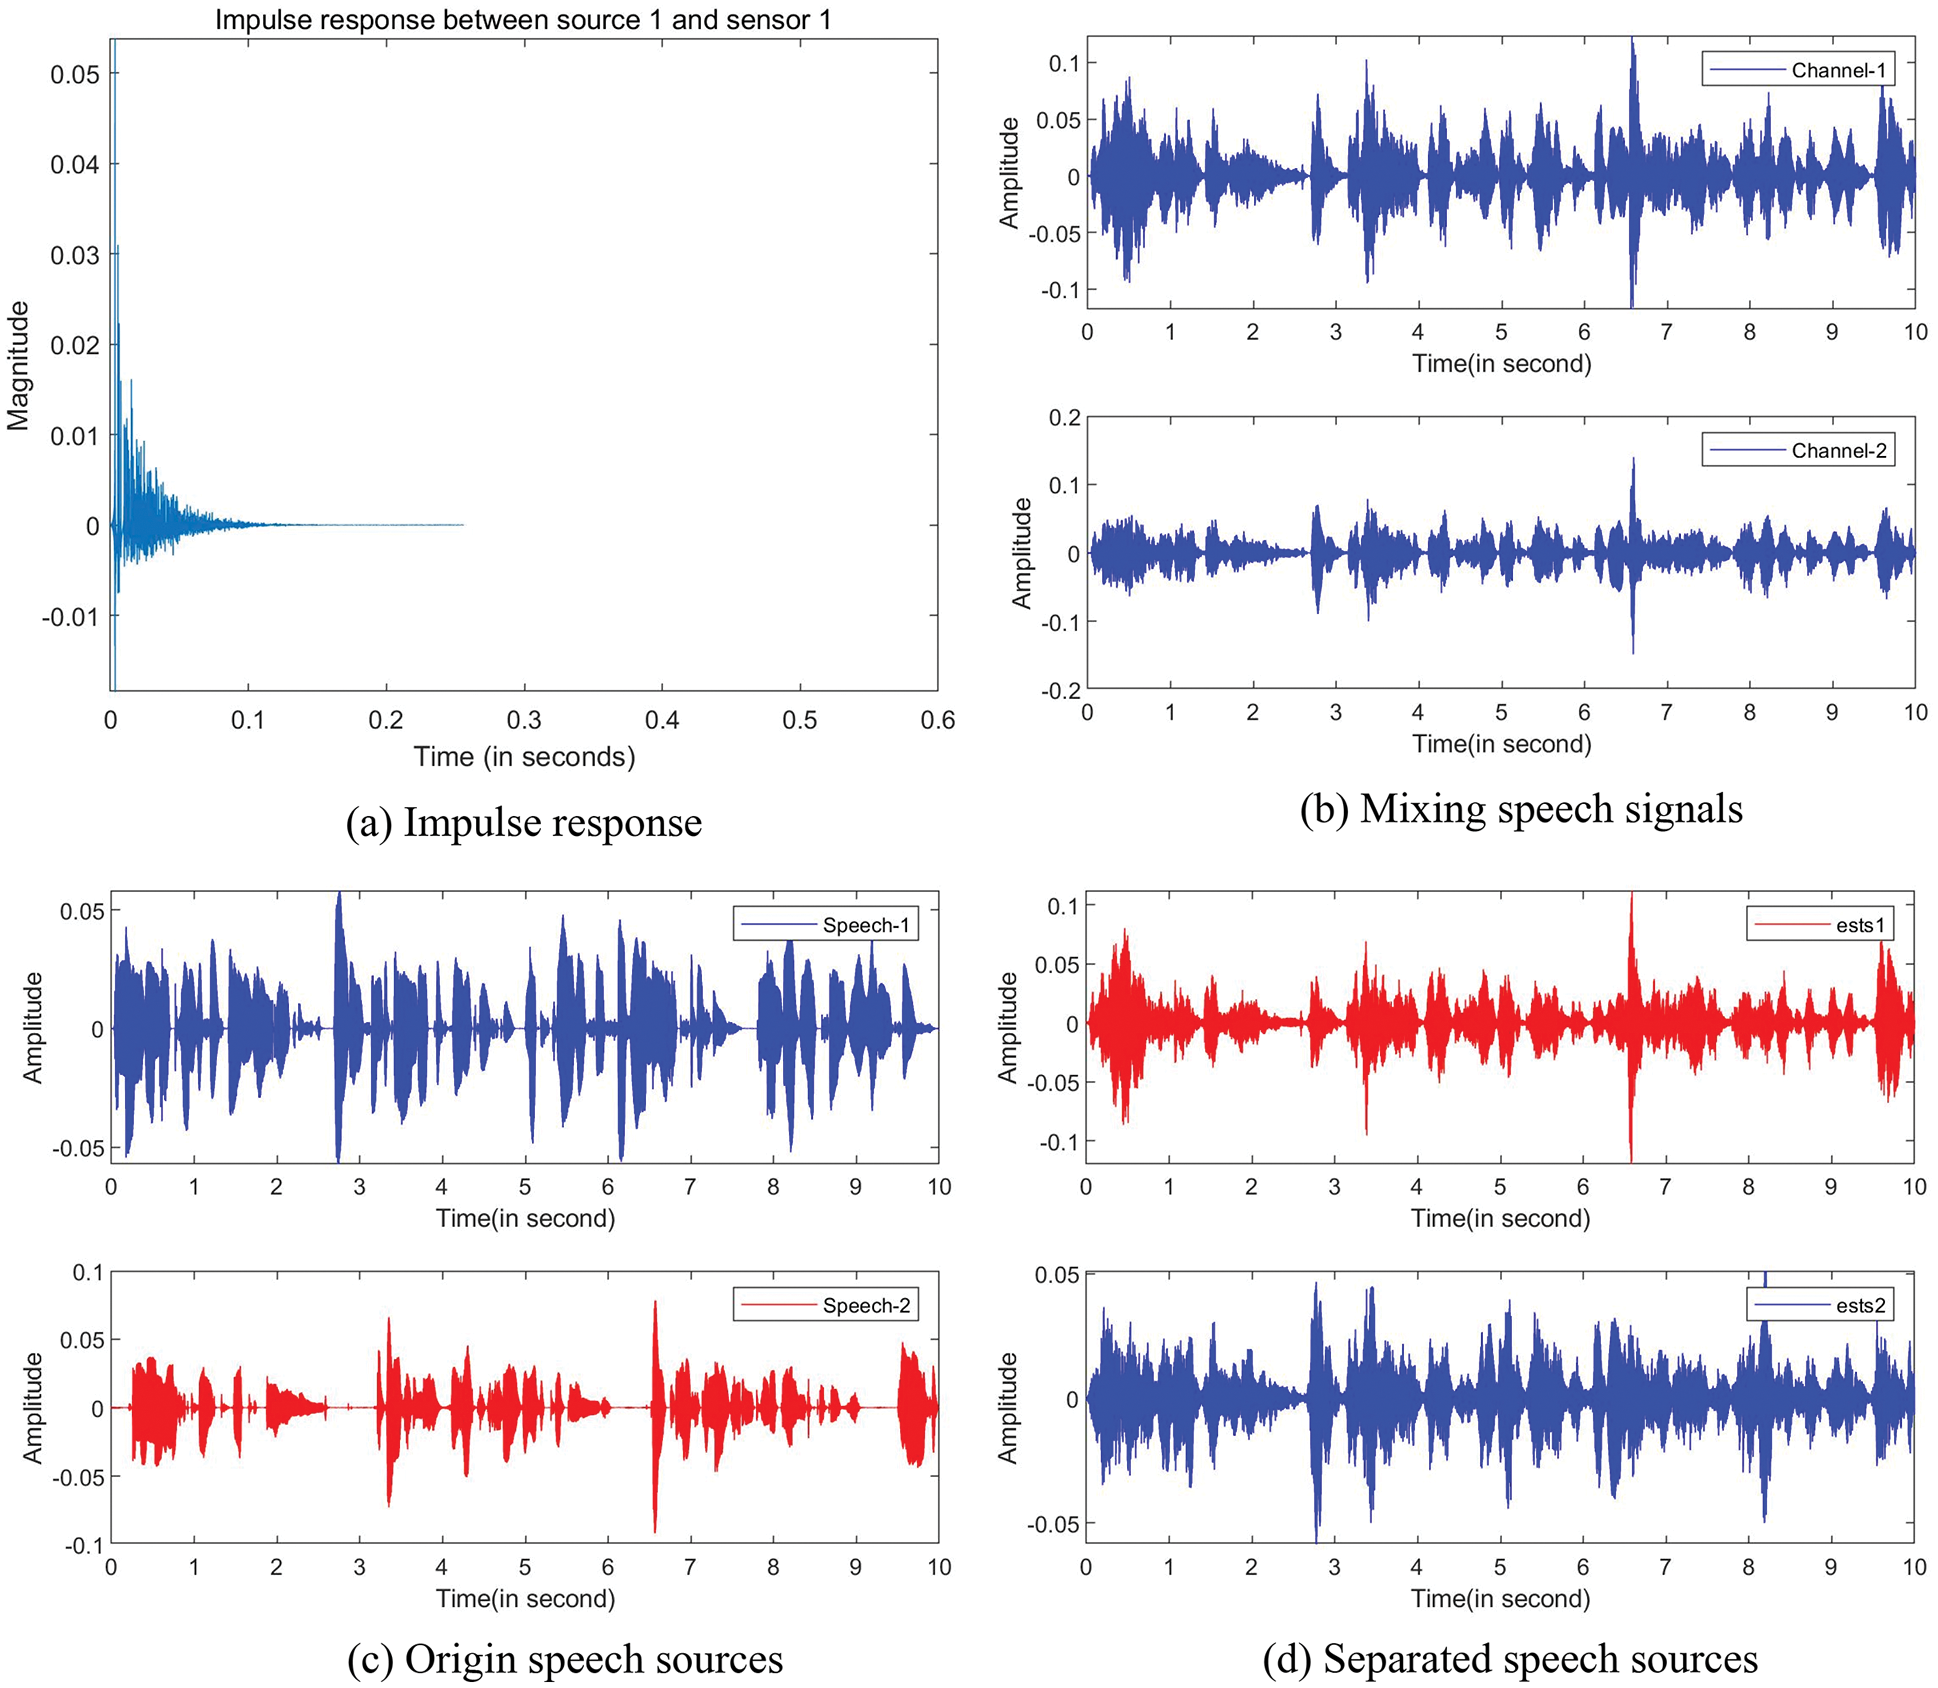
Figure 3: Speech separation: (a) Impulse response (200 ms), (b) Waveforms of the mixing speech signals, (c) Waveforms of the origin speech source signals, (d) Waveforms of the separated speech source signals
Then, we test the convolutive speech mixtures where the number of sources is 3 and the number of sensors is also 3. The reverberation time RT60 varies from 100 to 500 ms, and the locations of sources and sensors in the room are shown in Fig. 4. The source separation performance SIR vs. RT60 and different algorithm comparison is shown in Fig. 5. It can be seen that SIR results gradually decrease with the increase of reverberation time RT60, when the reverberation time exceeds 500 ms, the separation performance is invalid. However, the proposed algorithm always outperforms the compared algorithms. When RT60 varies from 100 to 500 ms, DR-BSS algorithm improves 2.01, 0.47, 0.57, 0.44, 0.21 dB compared with the best separation results at present, respectively.
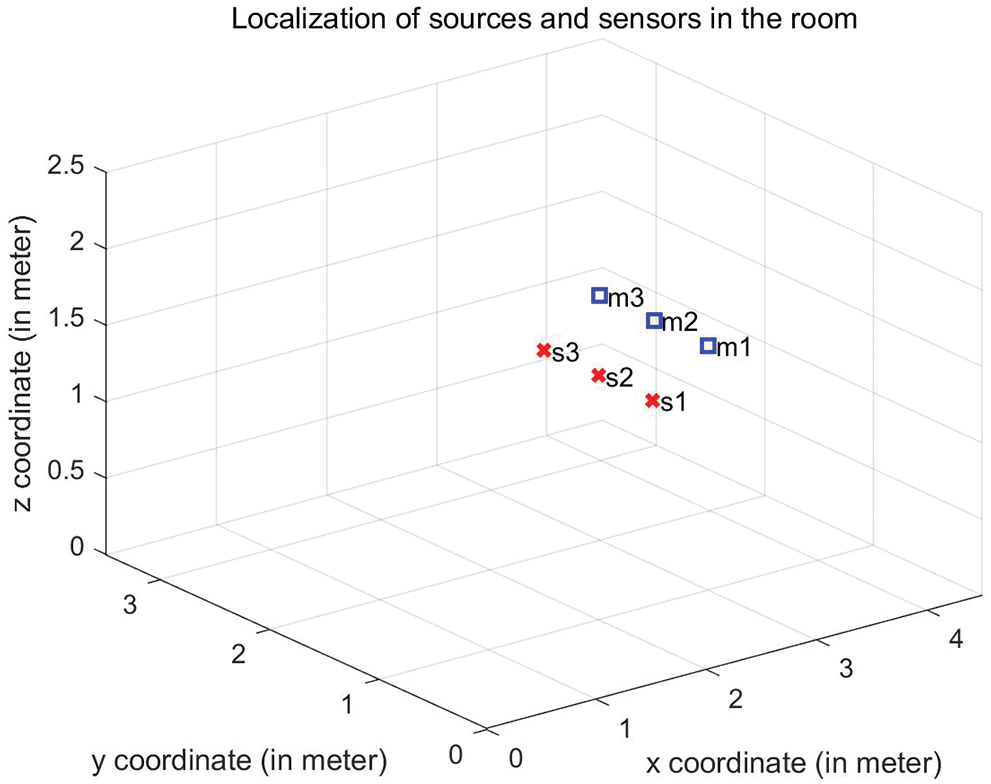
Figure 4: Locations of sources and sensors (3 × 3) in the room
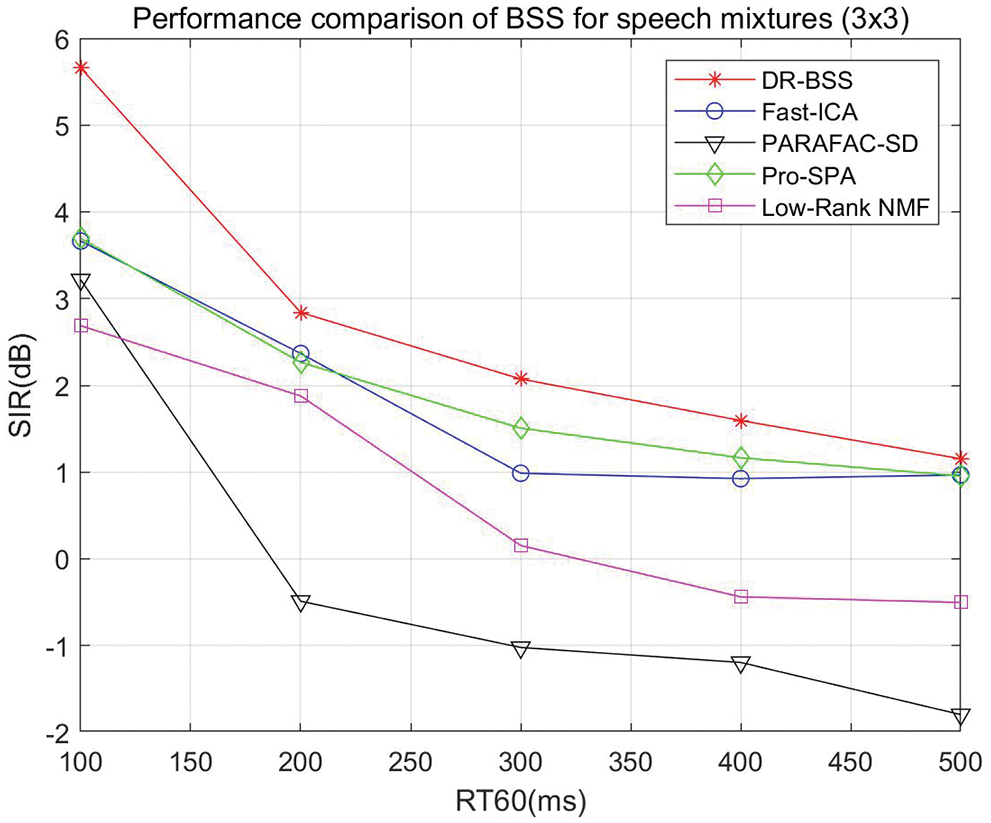
Figure 5: Source separation performance of speech mixtures (
4.4 Source Separation Experiments on Music Mixing Signals
In the following section, we consider the source separation performance of music mixtures, the convolutive environments are the same as the speech convolutive environments. Firstly, we test the two-music mixtures, experimental results are shown in Fig. 6. It can be seen that the SIR results of the proposed algorithm are superior to the compared algorithms, particularly it is still valid in the high reverberation condition. When RT60 varies from 200 to 900 ms, DR-BSS algorithm improves 3.42, 2.74, 2.39, 2.85, 2.80, 2.42, 2.24, 1.76 dB compared with the best separation results at present, respectively.
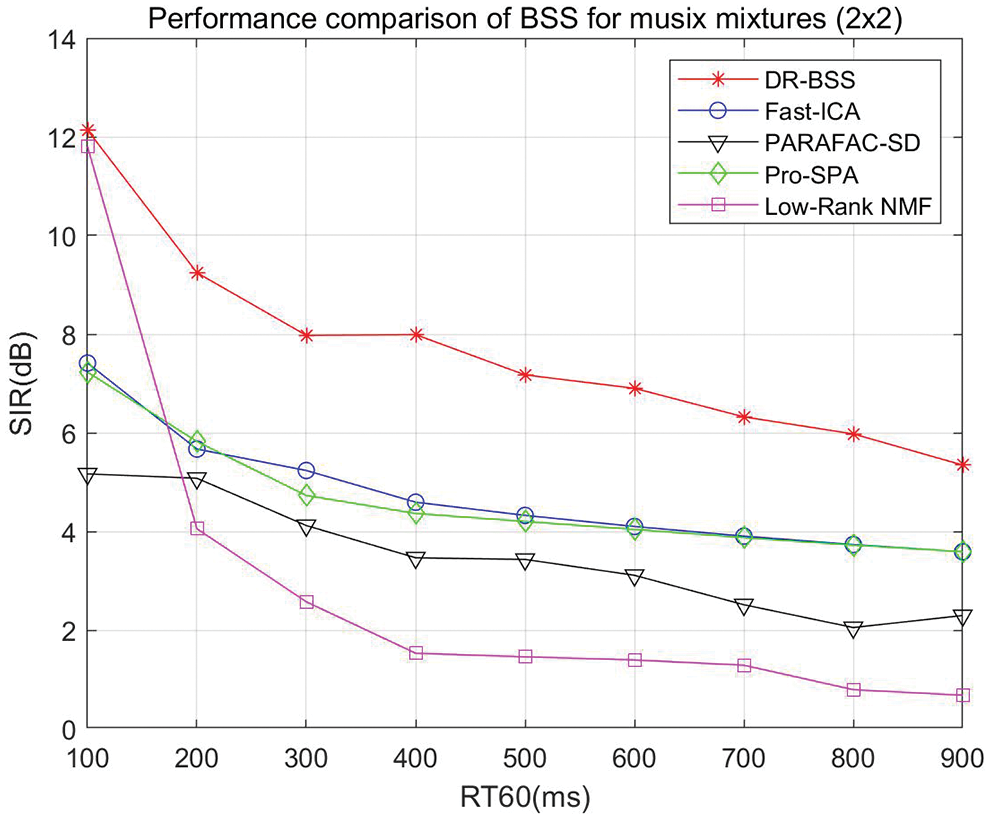
Figure 6: Source separation performance of music mixtures (
Additionally, we compare the separated music sources with the origin music source signals. Separation results are shown in Fig. 7, where the impulse response is set as 200 ms shown in Fig. 7a, the mixing signals are seen in Fig. 7b, the origin source signals are seen in Fig. 7c, and the separated source signals are seen in Fig. 7d. Compared the Fig. 7c with the Fig. 7d, it can be seen that the two music source signals have been separated successfully. The separation results of music-1 and music-2 are 8.99 and 7.99 dB, respectively.
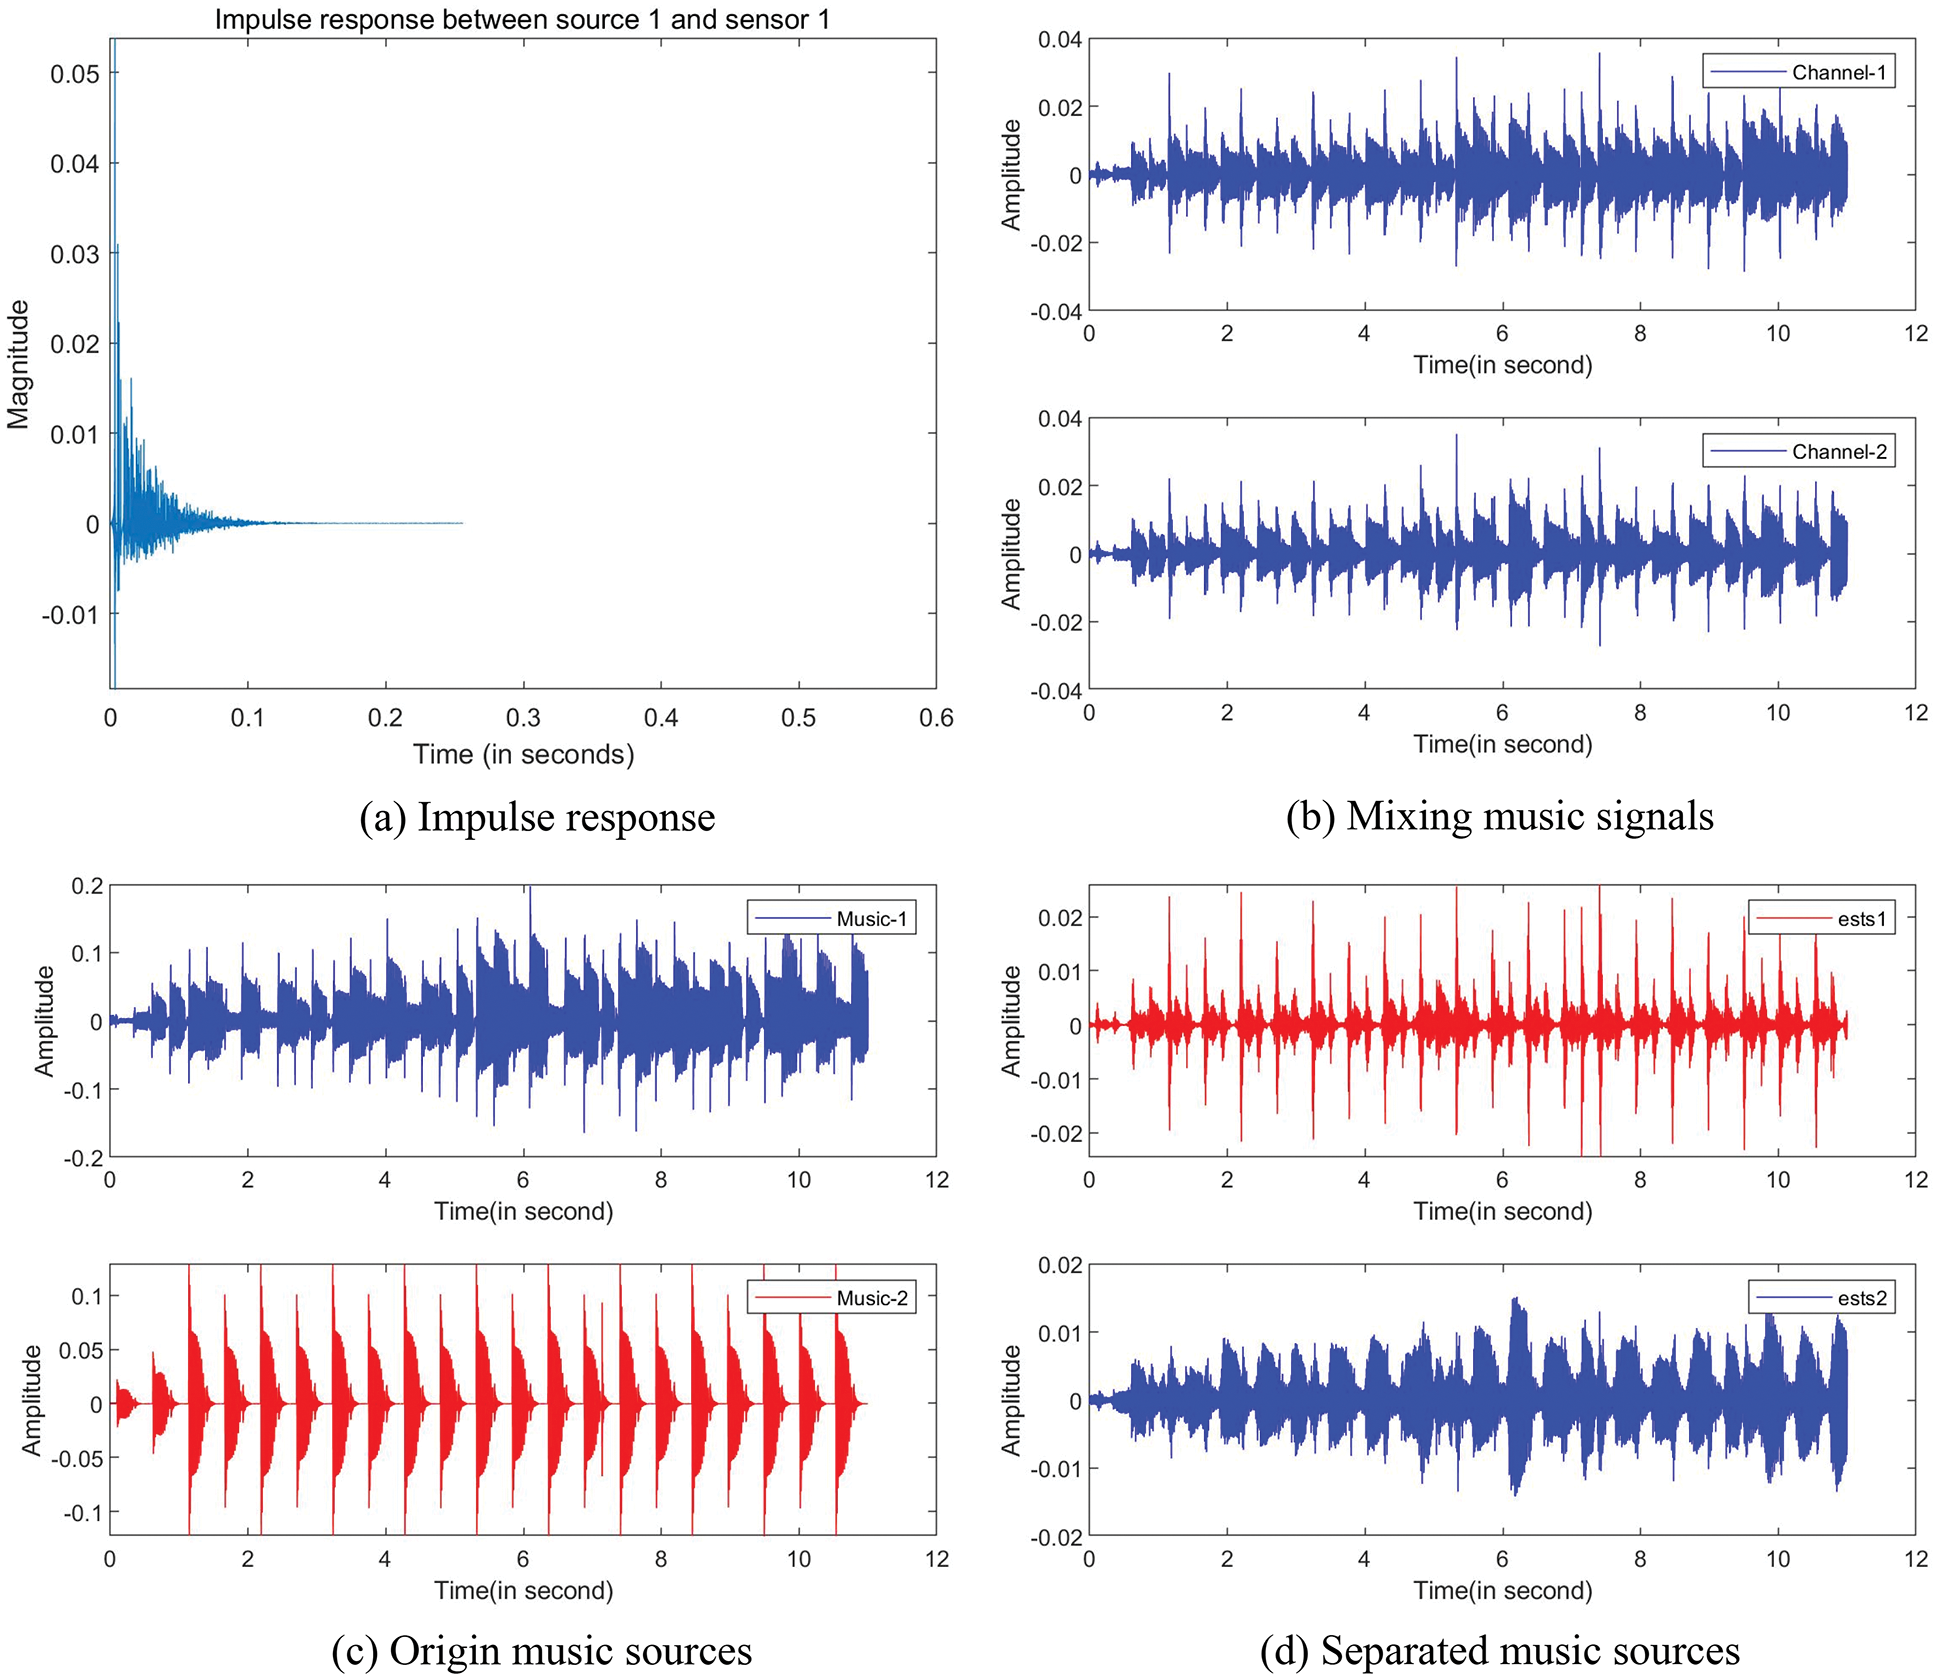
Figure 7: Music separation: (a) Impulse response (200 ms), (b) Waveforms of the mixing music signals, (c) Waveforms of the origin music source signals, (d) Waveforms of the separated music source signals
Secondly, we test the convolutive music mixtures where the number of sources is 3 and the number of sensors is also 3. The source separation performance SIR vs. RT60 and different algorithm comparison is shown in Fig. 8. It can be seen that the separation performance of the proposed algorithm is valid with the increase of reverberation time RT60. However, the compared algorithms have been invalid in the low reverberation environment except for Low-Rank NMF when RT60 < 300 ms. When RT60 varies from 100 to 500 ms, the DR-BSS algorithm improves 1.01, 3.18, 2.87, 2.76, 3.19 dB compared with the best separation results at present, respectively.
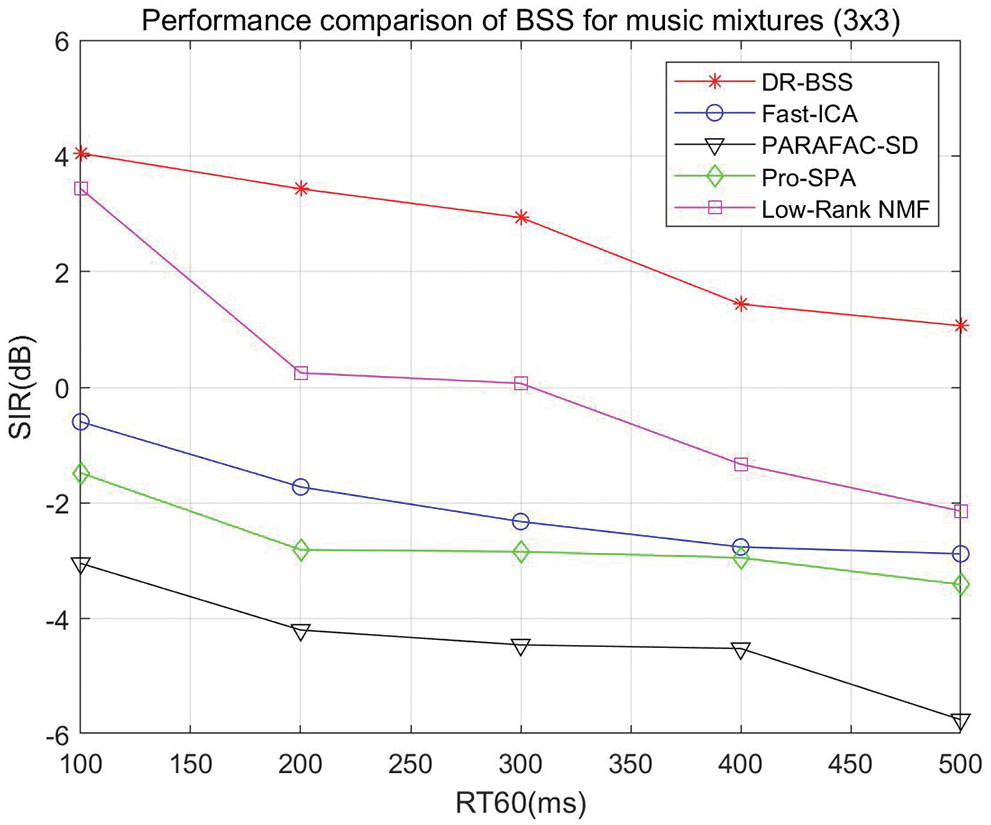
Figure 8: Source separation performance music mixtures (
According to above experimental results, the proposed algorithm can be used to separate convolutive speech and music mixing signals in the different reverberate environments. Especially, for the two-channel convolutive mixture situation, the advantage of algorithm is still suitable for a much higher reverberate environment. However, the shortcoming of this algorithm is that the separation performance of the algorithm decreases with the increase of the number of channels and reverberation time. In addition, with more sensors and sources, it brings the complexity of convolutive mixtures, resulting in the gradual decrease of SIR value. Thus, the SIR value decreases with more sensors and sources. In addition, due to the complexity of the real-life environment, the model can not fully describe the actual problem, which leads to inaccurate modeling of the actual problem, thus the design algorithm is limited. To better improve the accuracy of the model, it is necessary to establish an adaptive mathematical model according to specific practical problems.
Firstly, the computational complexity of the algorithms is considered to compare the proposed method with other existing methods. All the experiments are conducted on a computer with Intel(R) Core (TM) i9- 10900 CPU@2.80 GHz, 16.00 GB memory under Windows 10 system and the programs are coded by Mat- lab R2019a installed in a computer workstation. A two-channel convolutive mixed speech signal is tested, where the reverberation time RT60 is selected as 300 ms. The mean test time of the proposed algorithm, FastICA, PARAFAC-SD, Pro-SPA, and Low-Rank NMF for 400 trials are 7.69, 7.75, 7.78, 0.35, 10.10 s respectively. Compared with the computational time, it indicates that the computational complexity of proposed algorithm is better than Low-Rank NMF and weaker than Pro-SPA. However, the proposed algorithm achieves better separation performance than the compared methods.
In order to test the effect of Gaussian white noise on the source separation performance of the algorithm, Gaussian white noise is added to the two-channel convolutive mixed speech signals. The reverberation time RT60 is selected as 300 ms, and source-to-noise ratio (SNR) varies from 5 to 30 dB. Experiments are performed for 400 trials, the average value is used to analyze the effect of noise on source separation performance. The effect of noise on source separation performance of different algorithms is shown in Fig. 9. It is demonstrated that the SIR results of the proposed algorithm increase gradually with the increase of SNR and are always better than the compared algorithm.
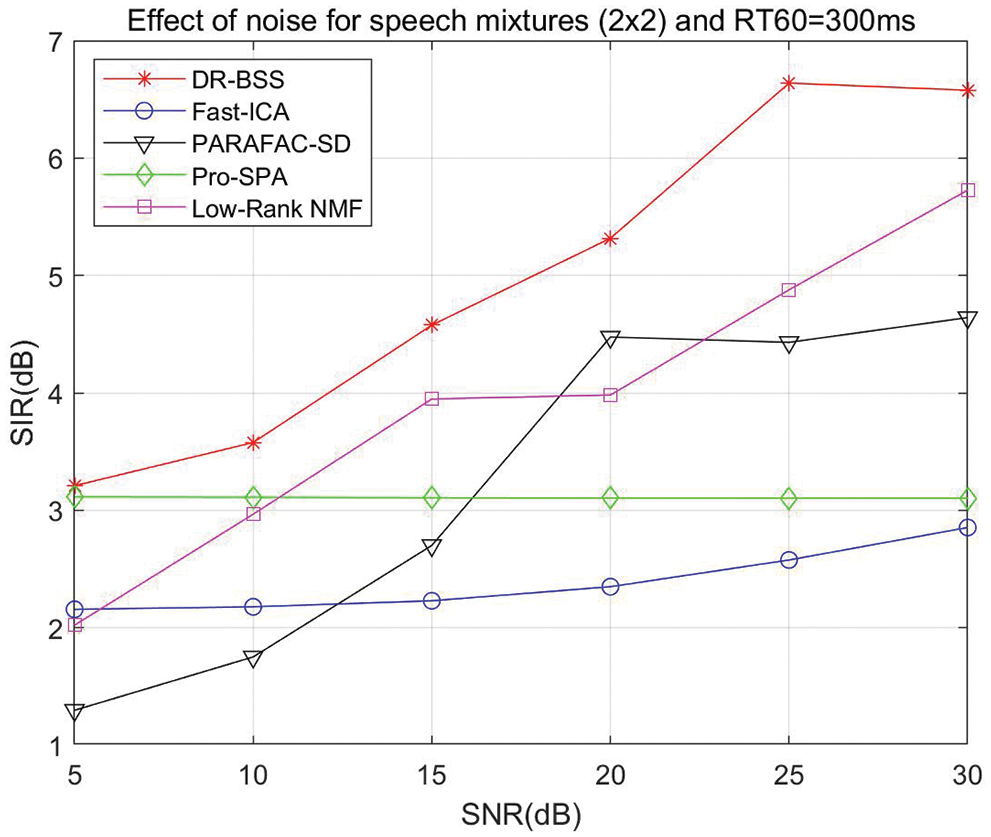
Figure 9: Effect of noise on source separation performance: SIR vs. SNR, and different algorithm comparison
In the paper, we proposed a DR-BSS algorithm to separate speech and music mixing signals. By building a new cost function, the novel update rule of demixing matrix was derived using Newton gradient descent method. Then, the frequency-domain source signals were obtained using the updated demixing matrix. By testing the separation performance of speech and music mixing signals, experimental results verify the effectiveness of DR-BSS algorithm. By comparing the state-of-the-art algorithms, the DR-BSS algorithm achieves better superiority and robustness. Thus, the DR-BSS algorithm designed in this paper has better advantages in solving the determined reverberation environment. It can be applied not only to audio signal separation but also to communication signal processing and biological signal processing.
It is worth noting that the mixing matrix of DR-BSS algorithm must be invertible. When the number of sources is less than or equal to the number of sensors, the DR-BSS algorithm is effective. However, when the number of sources is greater than the number of sensors, the mixing matrix is irreversible. It is invalid in the underdetermined mixture case. Therefore, the underdetermined convolutive BSS problem needs to be further studied in future work.
Funding Statement: This research was partially supported by the National Natural Science Foundation of China under Grant 52105268, Natural Science Foundation of Guangdong Province under Grant 2022A1515011409, Key Platforms and Major Scientific Research Projects of Universities in Guangdong under Grants 2019KTSCX161 and 2019KTSCX165, Key Projects of Natural Science Research Projects of Shaoguan University under Grants SZ2020KJ02 and SZ2021KJ04, and the Science and Technology Program of Shaoguan City of China under Grants 2019sn056, 200811094530423, 200811094530805, and 200811094530811.
Conflicts of Interest: The authors declare that they have no conflicts of interest to report regarding the present study.
References
1. C. P. Demo and J. Sarela, in Cocktail Party Problem. New York: Springer, 2015. [Google Scholar]
2. S. Schulze, J. Leuschner, and E. King, “Improved swarm intelligent blind source separation based on signal cross-correlation,” Sensors, vol. 12, no. 1, pp. 118, 2022. [Google Scholar]
3. J. Zi, D. Lv, J. Liu, X. Huang, W. Yao et al., “Blind source separation in polyphonic music recordings using deep neural networks trained via policy gradients,” Signals, vol. 2, no. 2, pp. 637–661, 2021. [Google Scholar]
4. L. Zhou, Y. Xu, T. Wang, K. Feng and J. Shi, “Microphone array speech separation algorithm based on tc-resnet,” Computers, Materials & Continua, vol. 69, no. 2, pp. 2705–2716, 2021. [Google Scholar]
5. L. Zhou, K. Feng, T. Wang, Y. Xu and J. Shi, “Binaural speech separation algorithm based on deep clustering,” Intelligent Automation & Soft Computing, vol. 30, no. 2, pp. 527–537, 2021. [Google Scholar]
6. Y. Xie, K. Xie, Q. Yang, and S. Xie, “Reverberant blind separation of heart and lung sounds using nonnegative matrix factorization and auxiliary function technique,” Biomedical Signal Processing and Control, vol. 69, no. 7, pp. 102899, 2021. [Google Scholar]
7. D. S. Huang and J. X. Mi, “A new constrained independent component analysis method,” IEEE Transactions on Neural Networks, vol. 18, no. 5, pp. 1532–1535, 2007. [Google Scholar] [PubMed]
8. Z. D. Wy, M. Sarkis, J. Hagenauer, and J. C. Mueller, “Fine-scale genetic mapping using independent component analysis,” IEEE/ACM Transactions on Computational Biology and Bioinformatics, vol. 5, no. 3, pp. 448–460, 2008. [Google Scholar]
9. I. Lee, T. Kim, and T. W. Lee, “Fast fixed-point independent vector analysis algorithms for convolutive blind source separation,” Signal Processing, vol. 87, no. 8, pp. 1859–1871, 2007. [Google Scholar]
10. T. Kim, “Real-time independent vector analysis for convolutive blind source separation,” IEEE Transactions on Circuits and Systems I: Regular Papers, vol. 57, no. 7, pp. 1431–1438, 2010. [Google Scholar]
11. M. Anderson, G. S. Fu, R. Phlypo and T. Adali, “Independent vector analysis: Identification conditions and performance bounds,” IEEE Transactions on Signal Processing, vol. 62, no. 17, pp. 4399–4410, 2014. [Google Scholar]
12. R. Ikeshita and T. Nakatani, “Independent vector extraction for joint blind source separation and dereverberation,” IEEE Signal Processing Letters, vol. 28, pp. 972–976, 2021. [Google Scholar]
13. S. Mogami, N. Takamune, D. Kitamura, H. Saruwatari, Y. Takahashi et al., “Independent low-rank matrix analysis based on time-variant Sub-Gaussian source model for determined blind source separation,” IEEE/ACM Transactions on Audio, Speech, and Language Processing, vol. 28, pp. 503–518, 2020. [Google Scholar]
14. O. Yilmaz and S. Rickard, “Blind separation of speech mixtures via time-frequency masking,” IEEE Transactions on Signal Processing, vol. 52, no. 7, pp. 1830–1847, 2004. [Google Scholar]
15. M. Cobos and J. J. Lopez, “Improving isolation of blindly separated sources using time-frequency masking,” IEEE Signal Processing Letters, vol. 15, pp. 617–620, 2008. [Google Scholar]
16. Q. Guo, G. Ruan, and Y. Liao, “A time-frequency domain underdetermined blind source separation algorithm for mimo radar signals,” Symmetry, vol. 9, no. 7, pp. 104, 2017. [Google Scholar]
17. S. Chakrabarty and E. A. P. Habets, “Time frequency masking based online multi-channel speech enhancement with convolutional recurrent neural networks,” IEEE Journal of Selected Topics in Signal Processing, vol. 13, no. 4, pp. 787–799, 2019. [Google Scholar]
18. K. Yatabe and D. Kitamura, “Determined bss based on time-frequency masking and its application to harmonic vector analysis,” IEEE/ACM Transactions on Audio, Speech, and Language Processing, vol. 29, pp. 1609–1625, 2021. [Google Scholar]
19. S. C. Douglas, M. Gupta, H. Sawada, and S. Makino, “Spatio temporal fastica algorithms for the blind separation of convolutive mixtures,” IEEE Transactions on Audio, Speech and Language Processing, vol. 15, no. 5, pp. 1511–1520, 2007. [Google Scholar]
20. D. Nion, K. N. Mokios, N. D. Sidiropoulos, and A. Potamianos, “Batch and adaptive parafac-based blind separation of convolutive speech mixtures,” IEEE Transactions on Audio, Speech, and Language Processing, vol. 18, no. 6, pp. 1193–1207, 2010. [Google Scholar]
21. X. Fu, W. K. Ma, K. Huang, and N. D. Sidiropoulos, “Blind separation of quasi-stationary sources: Exploiting convex geometry in covariance domain,” IEEE Transactions on Audio, Speech, and Language Processing, vol. 63, no. 9, pp. 2306–2320, 2015. [Google Scholar]
22. D. Kitamura, N. Ono, H. Sawada, H. Kameoka, and H. Saruwatari, “Determined blind source separation unifying independent vector analysis and nonnegative matrix factorization,” IEEE Transactions on Audio, Speech, and Language Processing, vol. 24, no. 9, pp. 1626–1641, 2016. [Google Scholar]
23. H. Sawada, R. Mukai, S. Araki, and S. Makino, “A robust and precise method for solving the permutation problem of frequency-domain blind source separation,” IEEE Transactions on Audio, Speech, and Language Processing, vol. 12, no. 5, pp. 530–538, 2004. [Google Scholar]
24. H. Sawada, S. Araki, and S. Makino, “Underdetermined convolutive blind source separation via frequency bin-wise clustering and permutation alignment,” IEEE Transactions on Audio, Speech, and Language Processing, vol. 19, no. 3, pp. 516–527, 2011. [Google Scholar]
25. A. Randazzo, M. A. Khousa, M. Pastorino, and R. Zoughi, “Direction of arrival estimation based on support vector regression: Experimental validation and comparison with music,” IEEE Antennas and Wireless Propagation Letters, vol. 6, pp. 379–382, 2007. [Google Scholar]
26. W. J. Zeng, X. L. Li, and X. D. Zhang, “Direction-of-arrival estimation based on the joint diagonalization structure of multiple fourth-order cumulant matrices,” IEEE Signal Processing Letters, vol. 16, no. 3, pp. 164–167, 2009. [Google Scholar]
27. J. Nikunen and T. Virtanen, “Direction of arrival based spatial covariance model for blind sound source separation,” IEEE/ACM Transactions on Audio, Speech, and Language Processing, vol. 22, no. 3, pp. 727–739, 2014. [Google Scholar]
28. A. Weiss, “Blind direction-of-arrival estimation in acoustic vector-sensor arrays via tensor decomposition and kullback-leibler divergence covariance fitting,” IEEE/ACM Transactions on Audio, Speech, and Language Processing, vol. 69, pp. 531–545, 2021. [Google Scholar]
29. J. C. Orti, J. Nikunen, T. Virtanen, and P. V. Candeas, “Multichannel blind sound source separation using spatial covariance model with level and time differences and nonnegative matrix factorization,” IEEE/ACM Transactions on Audio, Speech, and Language Processing, vol. 26, no. 9, pp. 1512–1527, 2018. [Google Scholar]
30. K. Sekiguchi, Y. Bando, A. A. Nugraha, K. Yoshii, and T. Kawahara, “Fast multichannel nonnegative matrix factorization with directivity-aware jointly-diagonalizable spatial covariance matrices for blind source separation,” IEEE/ACM Transactions on Audio, Speech, and Language Processing, vol. 28, pp. 2610–2625, 2020. [Google Scholar]
31. K. Xie, G. Zhou, J. Yang, Z. He, and S. Xie, “Eliminating the permutation ambiguity of convolutive blind source separation by using coupled frequency bins,” IEEE Transactions on Neural Networks and Learning Systems, vol. 31, no. 2, pp. 589–599, 2020. [Google Scholar] [PubMed]
32. Y. Xie, K. Xie, and S. Xie, “Underdetermined convolutive blind separation of sources integrating tensor factorization and expectation maximization,” Digital Signal Processing, vol. 87, pp. 145–154, 2019. [Google Scholar]
33. Y. Mitsufuji, N. Takamune, S. Koyama, and H. Saruwatari, “Multichannel blind source separation based on evanescent-region-aware non-negative tensor factorization in spherical harmonic domain,” IEEE/ACM Transactions on Audio, Speech, and Language Processing, vol. 29, pp. 607–617, 2021. [Google Scholar]
34. Y. Xie, K. Xie, and S. Xie, “Underdetermined blind separation of source using lp-norm diversity measures,” Neurocomputing, vol. 411, pp. 259–267, 2020. [Google Scholar]
35. N. Duong, E. Vincent, and R. Gribonval, “Under-determined reverberant audio source separation using a full-rank spatial covariance model,” IEEE Transactions on Audio, Speech, and Language Processing, vol. 18, no. 7, pp. 1830–1840, 2010. [Google Scholar]
36. J. B. Allen and D. A. Berkley, “Image method for efficiently simulating small-room acoustics,” Journal of the Acoustical Society of America, vol. 65, no. 4, pp. 943–950, 1979. [Google Scholar]
37. S. Araki, F. Nesta, E. Vincent, Z. Koldovsky, G. Nolte et al., “The 2011 signal separation evaluation campaign (SiSEC2011):- Audio source separation,” in Proc. Int. Conf. on Latent Variable Analysis and Signal Separation, Berlin, Heidelberg, pp. 414–422, 2012. [Google Scholar]
Cite This Article
 Copyright © 2023 The Author(s). Published by Tech Science Press.
This work is licensed under a Creative Commons Attribution 4.0 International License , which permits unrestricted use, distribution, and reproduction in any medium, provided the original work is properly cited.
 Downloads
 Citation Tools