
 Submit a Paper
 Propose a Special lssue
 Open Access
ARTICLE

Bug Prioritization Using Average One Dependence Estimator
1 Department of IT and Computer Science, Institute of Applied Sciences and Technology, PakAustriaFochhshule, Haripur, Pakistan
2 Faculty of Computer Sciences and Information Technology, Superior University, Lahore, 54660, Pakistan
3 Department of Computer Science, Shaheed Benazir Bhutto University, Sheringal, Upper Dir, Khyber Pakhtunkhwa, Pakitan
4 School of Computing, Gachon University, 1342, Seongnam-daero, Sujeong-gu, Seongnam-si, 13120, Korea
* Corresponding Authors: Ikram Syed. Email: ; Jaehyuk Choi. Email:
Intelligent Automation & Soft Computing 2023, 36(3), 3517-3533. https://doi.org/10.32604/iasc.2023.036356
Received 27 September 2022; Accepted 06 December 2022; Issue published 15 March 2023
 View Full Text
 Download PDF
Abstract
Automation software need to be continuously updated by addressing software bugs contained in their repositories. However, bugs have different levels of importance; hence, it is essential to prioritize bug reports based on their severity and importance. Manually managing the deluge of incoming bug reports faces time and resource constraints from the development team and delays the resolution of critical bugs. Therefore, bug report prioritization is vital. This study proposes a new model for bug prioritization based on average one dependence estimator; it prioritizes bug reports based on severity, which is determined by the number of attributes. The more the number of attributes, the more the severity. The proposed model is evaluated using precision, recall, F1-Score, accuracy, G-Measure, and Matthew’s correlation coefficient. Results of the proposed model are compared with those of the support vector machine (SVM) and Naive Bayes (NB) models. Eclipse and Mozilla datasetswere used as the sources of bug reports. The proposed model improved the bug repository management and outperformed the SVM and NB models. Additionally, the proposed model used a weaker attribute independence supposition than the former models, thereby improving prediction accuracy with minimal computational cost.Keywords
Software development is an umbrella term used to refer to the complete process that comprises several phases, such as coding, documentation, and testing; it applies to both the development and maintenance of application programs and frameworks. To maintain software quality, bug reports are submitted in the software bug repository containing attributes of the software bugs. The software bug reports are submitted by the end-user or a member of the development team [1]. A bug repository, also known as the bug tracking system (BTS), stores information regarding the bugs and plays a vital role in bug resolution. The large amount of new bug reports that are entered in repositories makes it difficult for the developer to manage them. Software companies spend excessive time and resources dealing with the incoming bug reports and about 45% of their costs on handling software bugs [2]. The analysis and management of bug reports are known as bug triaging and the person dealing with them is called a bug triager [3]. Researchers analyze the bug reports to determine duplicate, important, unimportant, and real bugs [4].
The bug reports contain several nominal and textual attributes [5]: platform, bugid, assignee, component, severity, status, priority, reporter, date of submission, product, resolution, operating system, cc-list, summary, and long description [3]. Among these, severity is considered the most important attribute for assigning priority to the bug report [6]. Severity has seven types: major, minor, blocker, normal, critical, trivial, and enhancement. Severity determines the criticality of solving a particular bug at the early stages. Sometimes priority field is left blank because of insufficient technical knowledge of the user regarding bugs [1]. Priority states the importance and urgency of fixingthe bugfor the developer. Priority can be classified into five levels: P1–P5, where P1 shows the highest and P5 is the lowest priority [7].
The priority levels depend on the need of the developers. In bug triaging, the software development team determines the urgency of the bugs to be fixed using different categories. Most developers use 5-level priorities, whereas some use 4-levels [8]. In this study, to make the bug prioritization more robust and cover more range of bug scenarios, we prioritize 5 levels: P1 being the most urgent, P2 can be handled before the release of the next product, P3 may be deferred, P4 level bugs may be handled at a later time as this bug does not affect the product, and P5 bugs may remain unresolved because they do not disturb the life cycle of the software. If the triager is uncertain about the bug priority or severity, the priority can be set to the default priority of P3 and will be appropriately adjusted later by the assigned developer.
Proper prioritization of the bug reports reduces the fixing time and optimizes resource allocation, whereas poor prioritization may postpone the resolution of critical bugs. Therefore, a bug prediction system that can anticipate the priority of an incoming bug is critical [9].
This study proposes an approach to prioritize bug reports using the average one dependence estimator (AODE). The contribution of this paper is thus two-fold:
1. Exploring AODE for bug prioritization.
2. Comparing different machine learning techniques for prioritizing bug reports using various evaluation criteria.
The remainder of the paper is organized as follows. Section 2 presents the background study related to bug prioritization and automatic bug triage. Section 3 provides an overview of the bug triage process and bug report features. Section 4 presents the proposed classification-based approach and classification techniques used to build the classifier. Section 5 describes the experiment and the results of the proposed model. A threat to validity is presented in Section 6. Conclusion and future work are described in Sections 7 and 8, respectively.
Bug report prioritization helps resolve critical bugs early to keep the software running. This study aims to explore machine learning techniques in a single framework for bug prioritization. Many studies have been conducted on bug prioritization. Each technique has its strengths and weaknesses. We summarize the related work in chronological order. The problem of developer prioritization has been addressed in [10], which ranks the contribution of developers based on the product, evolution over time, and tolerance of uproarious or noisy comments. The authors investigated two aspects: demonstrating the designer prioritization in the bug archive and helping predictive tasks with their proposed model. They analyzed the outcomes on two large open-source software, Eclipse and Mozilla, using precision, recall, F-measure, and accuracy as evaluation metrics. Their proposed model improved Eclipse by 10.89% and 2.88% for support vector machine (SVM) and Naive Bayes (NB), respectively, and Mozilla by 13.64% and 2.30% for SVM and NB, respectively.
Wong et al. [2] reduced the data in the report for bug triage by minimizing the scale of the bug and improving the accuracy of bug triage. The authors combined instance selection (IS) with feature selection (FS) to reduce the word and bug dimensions data scale. They examined data reduction performance on open-source projects, i.e., Eclipse and Mozilla, on approximately 600,000 reported bugs using accuracy as an evaluation measure and revealed that data reduction could efficiently decrease the scale of data and improve accuracy.
Zhou et al. [8] proposed a new approach of merging text mining and machine learning techniques to automatically predict the bug report. The authors first used the text mining algorithm (multinomial Naïve Bayes) to examine the summary attributes of the bug report and analyzed the result into three levels (low, mid, and high). Bayesian net classifier was used in the second step that receives data from the first step. Data grafting technique was used to combine the two stages. The authors used seven popular open-source software for their experiments, and precision, recall, and F-measure as evaluation metrics. Combining text mining and machine learning improved the results of the proposed approach.
Rocha et al. proposed a new technique to find similar bugs in a report [9]. The new technique called NextBug uses two attributes for the bug report: the project component and a short description. The authors used the Mozilla dataset to evaluate the results. They developed a field study to supervise one-week bug reports of the Mozilla dataset. Emails were sent to developers regarding the performance of NextBug and feedback from 40% of the developers reported that the technique was working well.
Sapphire Paul et al. proposed combining the IS technique with FS to solve the problem of bug prioritization [11]. The Bayesian classification technique was used for the prioritization of bug reports. Results of their proposed method showed that the reduction in data effectively cut back the proportion of knowledge and enhanced the quality of software sorting.
Govindasamy et al. [12] achieved data reduction in bug triage by inducting the representative values of the bug dataset and the statistical values [12]. They used Eclipsedataset and K-mean clustering algorithm and achieved better accuracy results than those of Naïve Bayes classifier.
Uddin et al. surveyed the literature on automatically and systematically prioritizing bug reports [4]. They presented a detailed study for the reported bug to inspire the need for effort on the reported bug prioritization. The current study also discusses reported bug prioritization and the likely problems associated with it.
Choudhary et al. used an artificial neural network technique to develop prediction models [13] for five different versions (2.0, 2.1, 3.0, 3.1, and 3.2) of Eclipse that assigns priority levels based on the information provided in each bug report. The collected dataset was used to train and test classification algorithms. Receiving operator characteristic (ROC) and F-measure were used to interpret the result of the proposed model with Naïve Bayes.
Umer et al. proposed an emotion-based approach that automatically prioritizes bug reports in the bug repository [7]. Initially, the authors used preprocessed algorithms to get the concrete data from the summary of a bug report, then identified emotion words and assigned them emotion values. A feature vector was created for emotion values and priority was predicted using a machine learning classifier. They used SVM on Eclipse open-source software and compared the result with linear regression, Naïve Bayes, and multinominal Naïve Bayes. The proposed model showed more than 6% improvement in the F1 score.
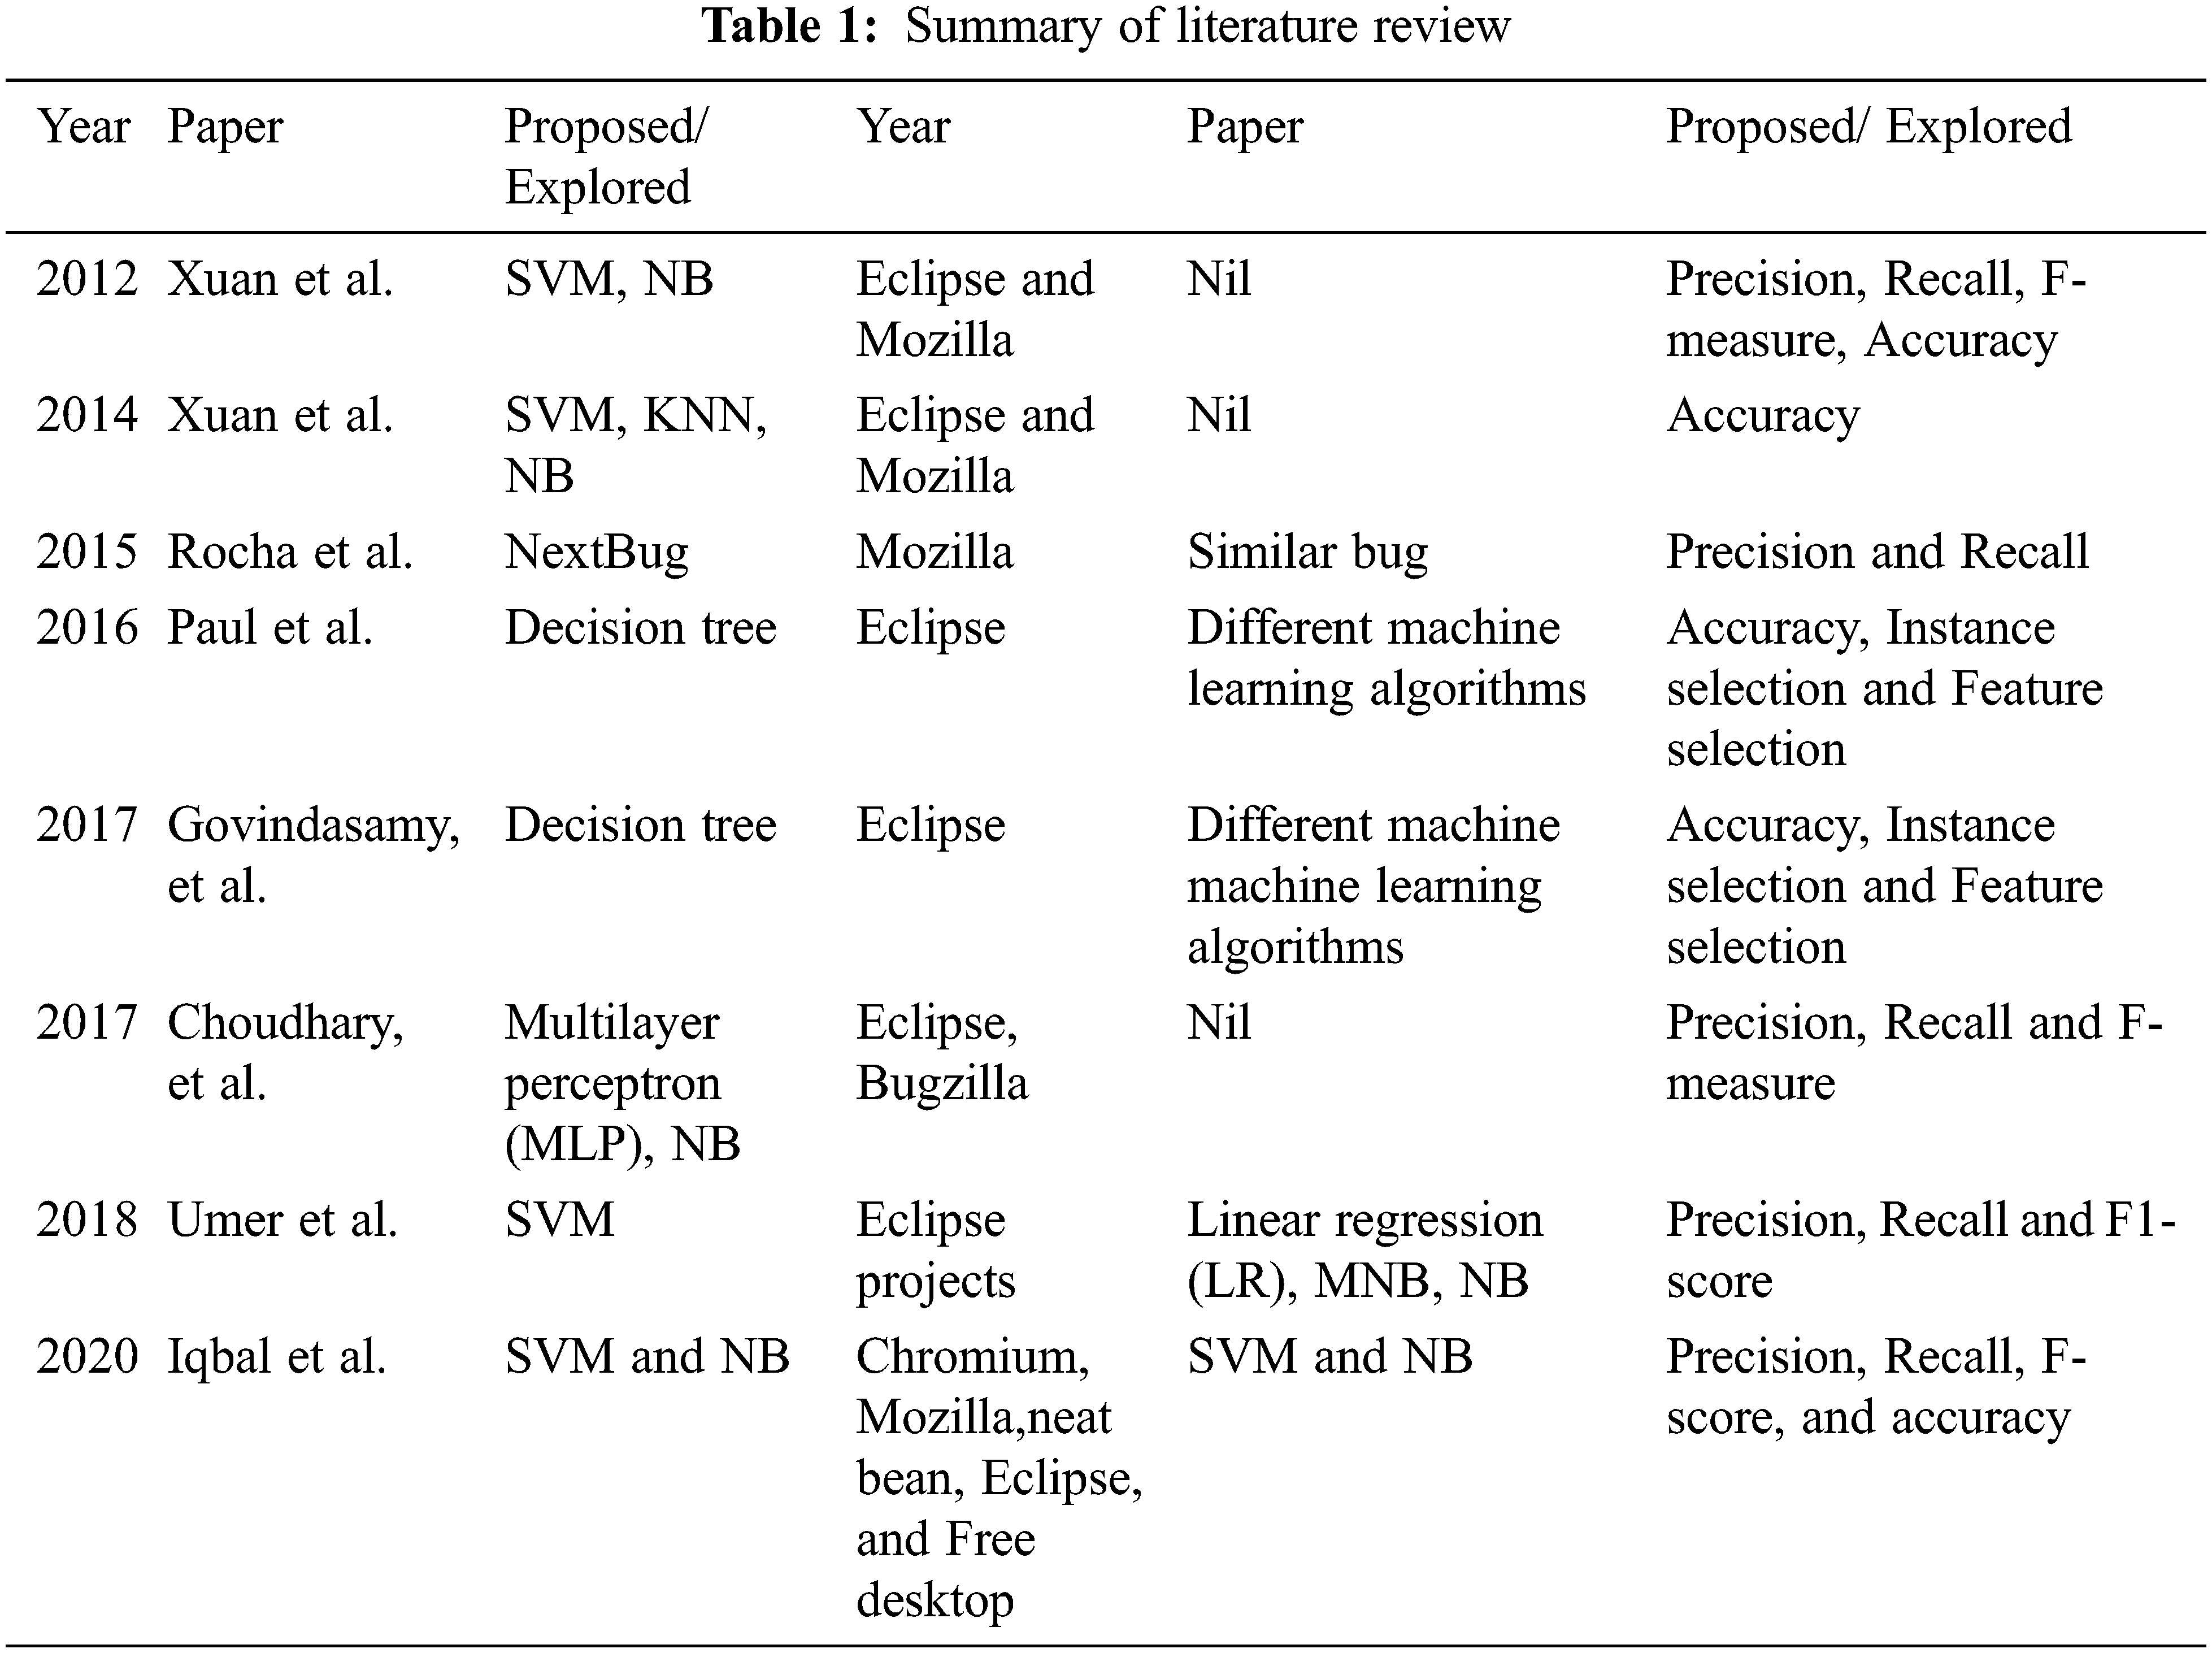
Iqbal et al. [14] proposed a model that combined feature reduction, clustering, and classification algorithm. They first used clustering techniques on all and then reduced the features, while SVM and NB were used last for classification purposes. They used Chromium, Mozilla, Eclipse, Net beans, and Free desktop for their experiment. Precision, recall, F-score, and accuracy are used as evaluation metrics. 22.46%, 8.32%, 30.93%, 25.79%, and 37.78% improvement in accuracy was achieved with Chromium, Eclipse, Free desktop, Mozilla, and Net bean, respectively. The literaturereview is summaried in Table 1.
The bug repository software is an application software that keeps records of the reported bugs during software development projects. The repository helps to manage and assign bug reports to specific developers during software development projects.
The repository contains bug reports submitted by the end-user when problems arise with the software product. The bug reports are then forwarded to the concerned developer to resolve the bugs. A sample of the bug report is shown in Fig. 1 and presents the following details:
a) The Bug was reported on 5th January 2011 and modified on 2nd September 2015.
b) 1 and 2 in the figure shows the title and importance of the bug report, respectively.
c) The bug report contains both categorical and textual data.
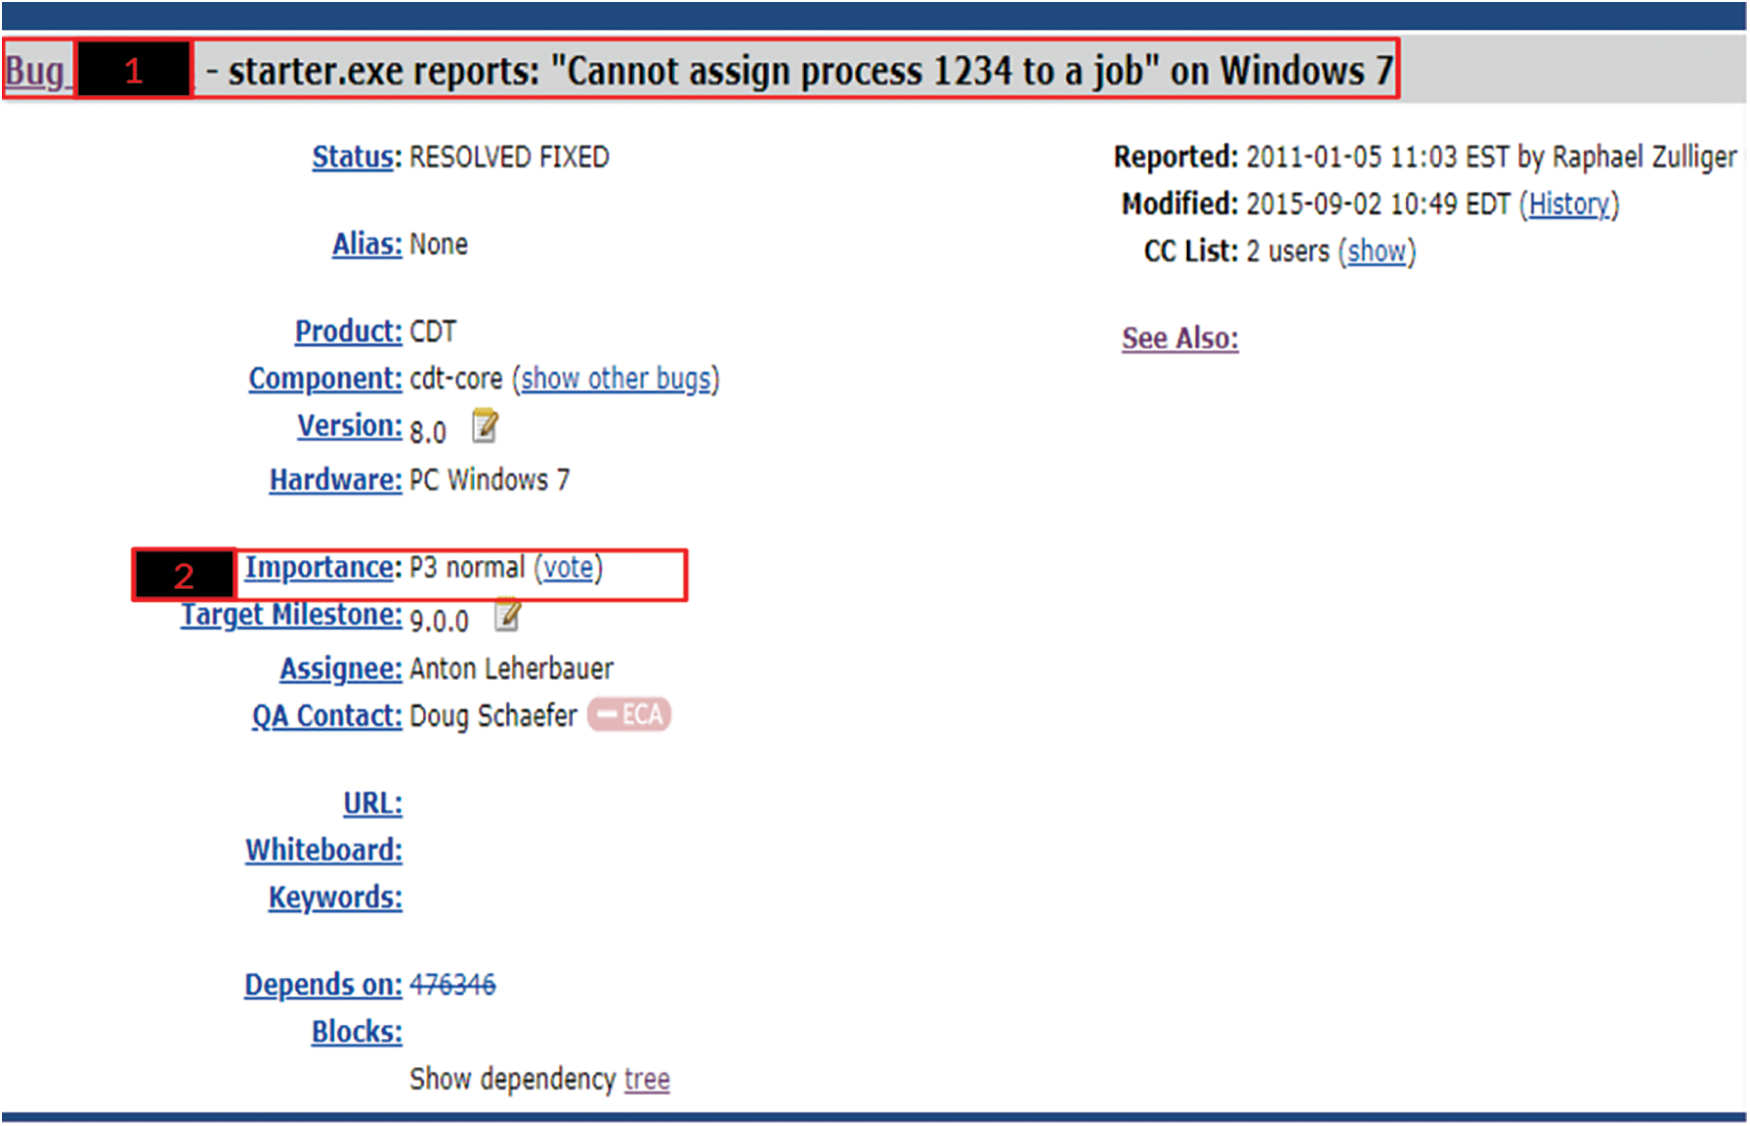
Figure 1: Eclipse bug report sample
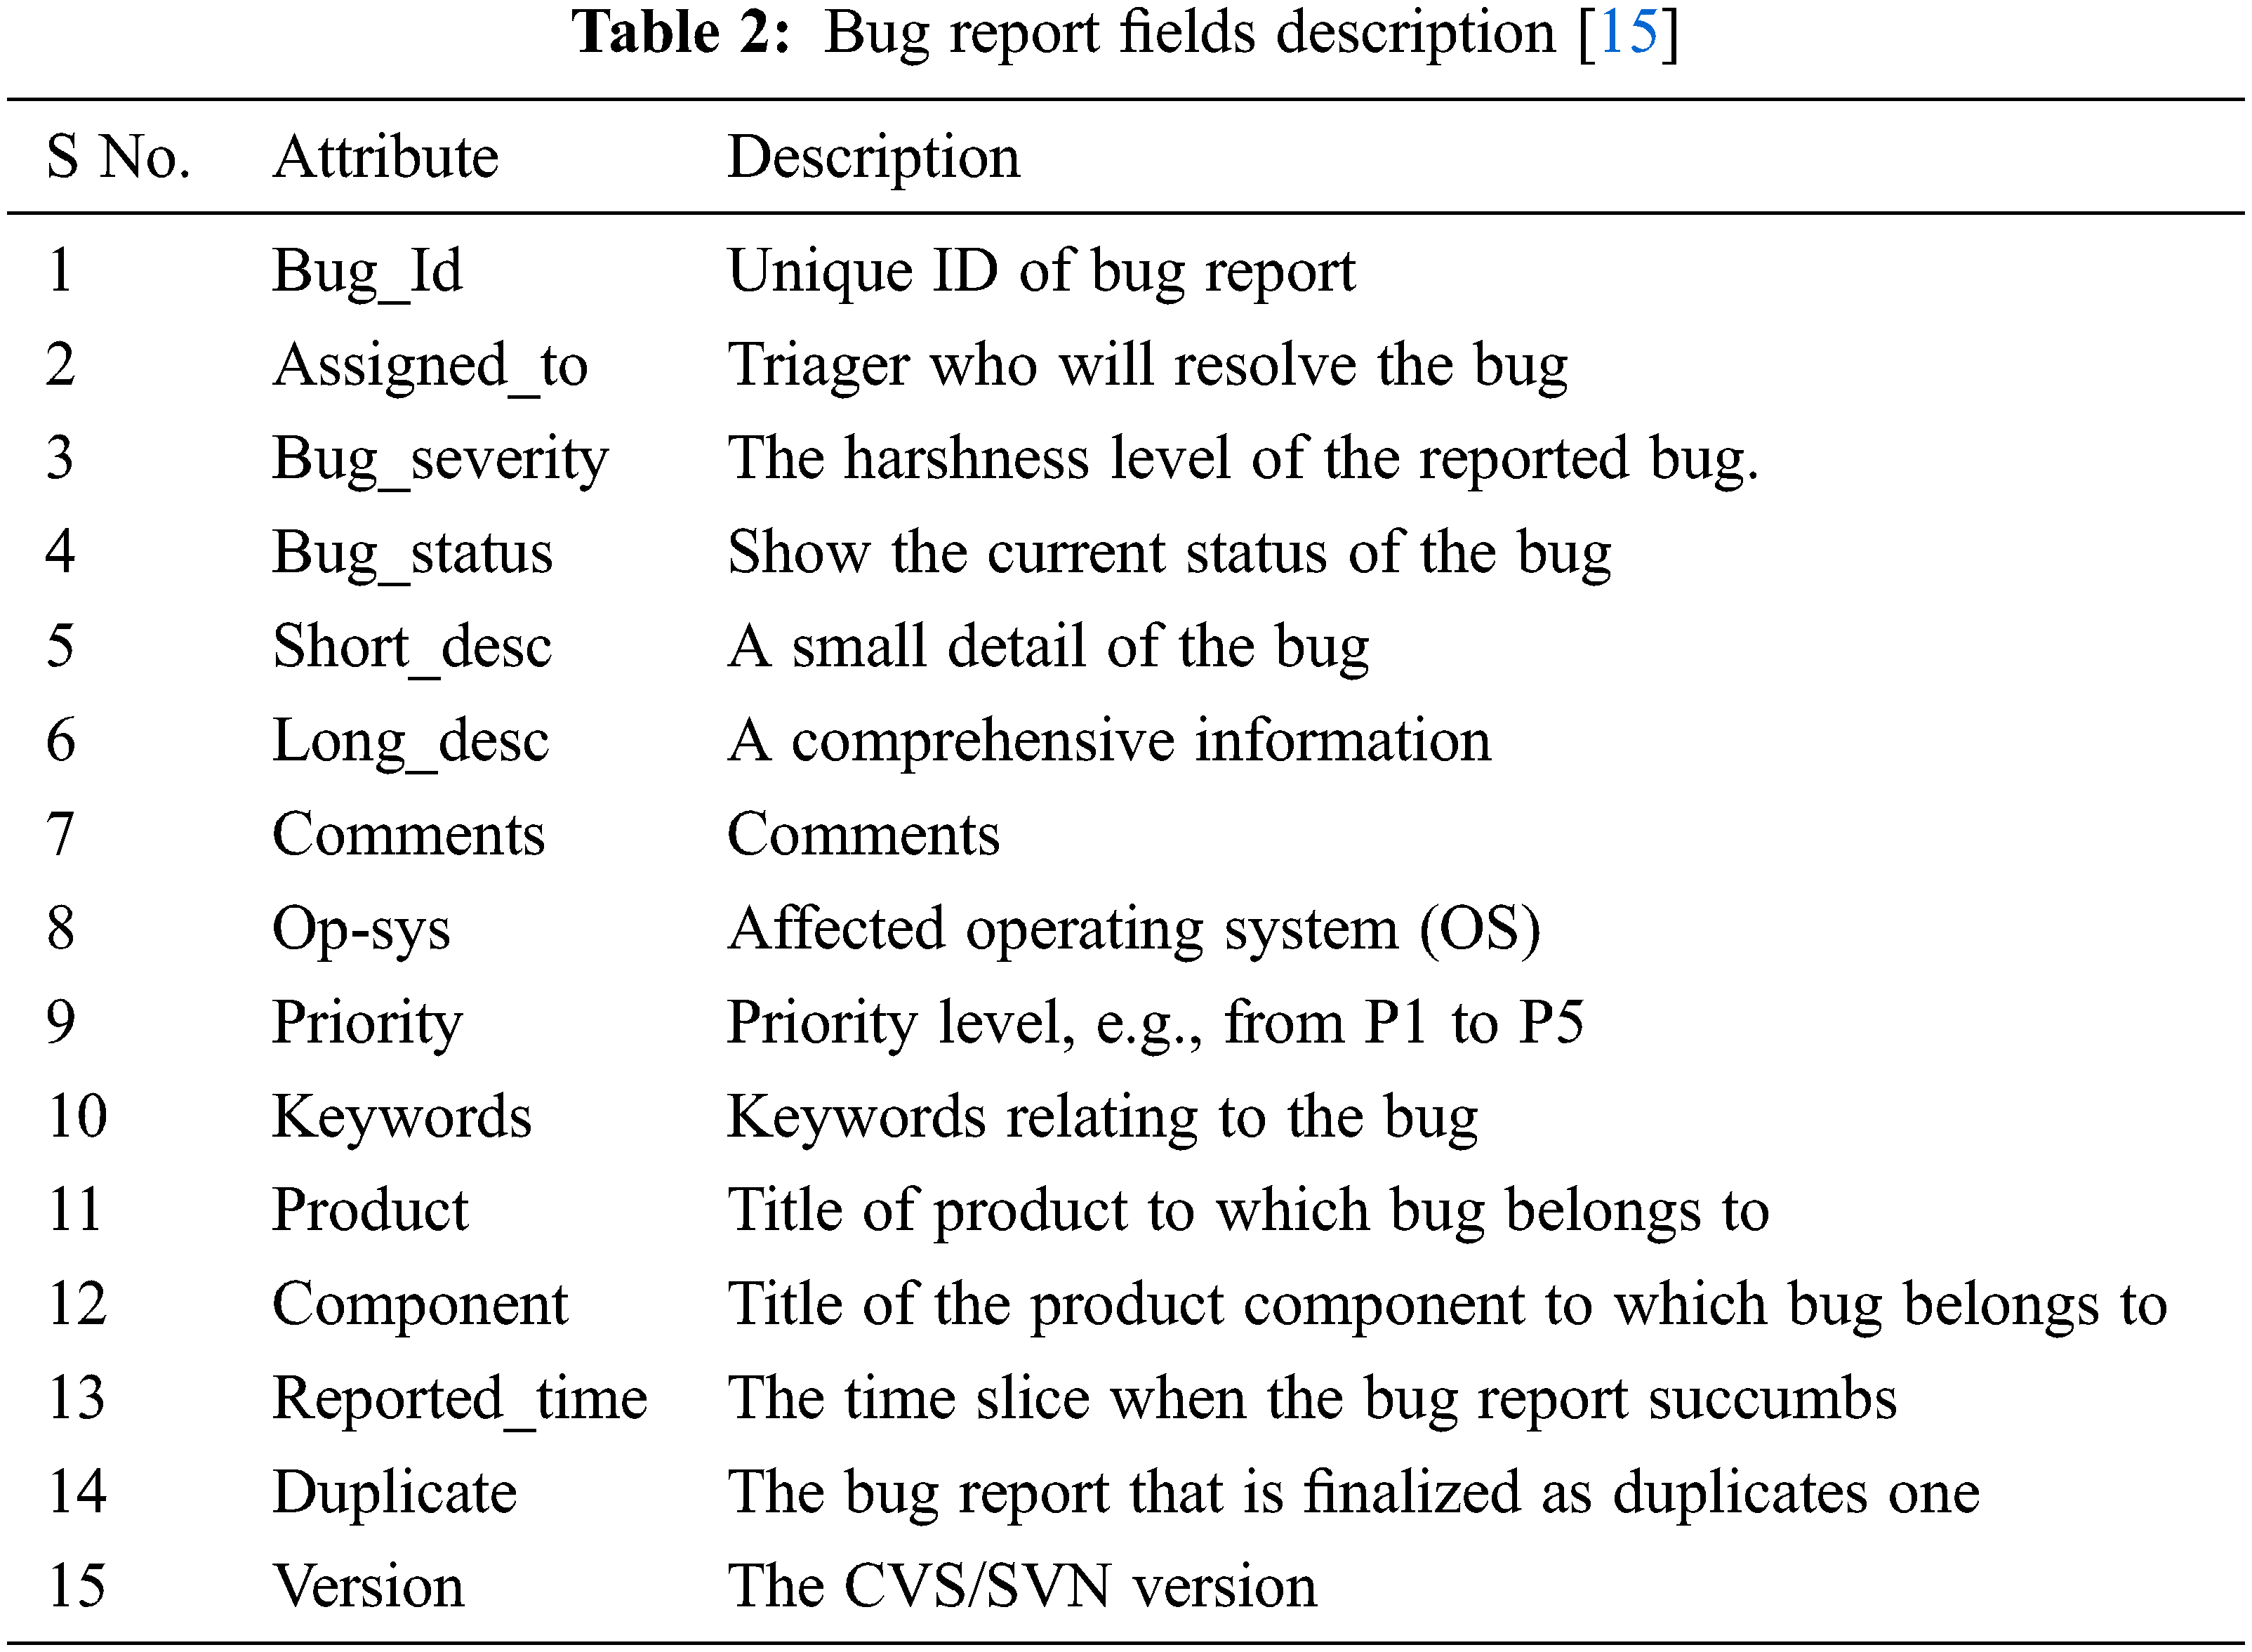
The comprehensive bug report, its attributes and description are shown in Table 2. The second column of the table shows a list of attributes of the bug report, while the third column represents a description of the bug attribute.
The bug life cycle is also known as a defect life cycle. There are several states that the bug report encounters in its complete life cycle [16]. Fig. 2 represents the complete life cycle of bugs. In the bug life cycle, the first stage when a bug is reported is called the new state. When a bug is triaged and allotted to a triager, the state is altered to Assigned. When terminating the concerning bug, the state is marked as Verified, Resolved, or Closed. Determination of the bug is checked in many ways: the resolution status shows how the bug was resolved; if it is because of variation in code, then it is checked as Fixed; if the concerned report is not a real bug or will not be fixed, it is set to Invalid or Wontfix, respectively. When the bug is measured as a duplicate, it is set to Duplicated. If a bug has been resolved but is still not finalized, it is set as Reopened [17].
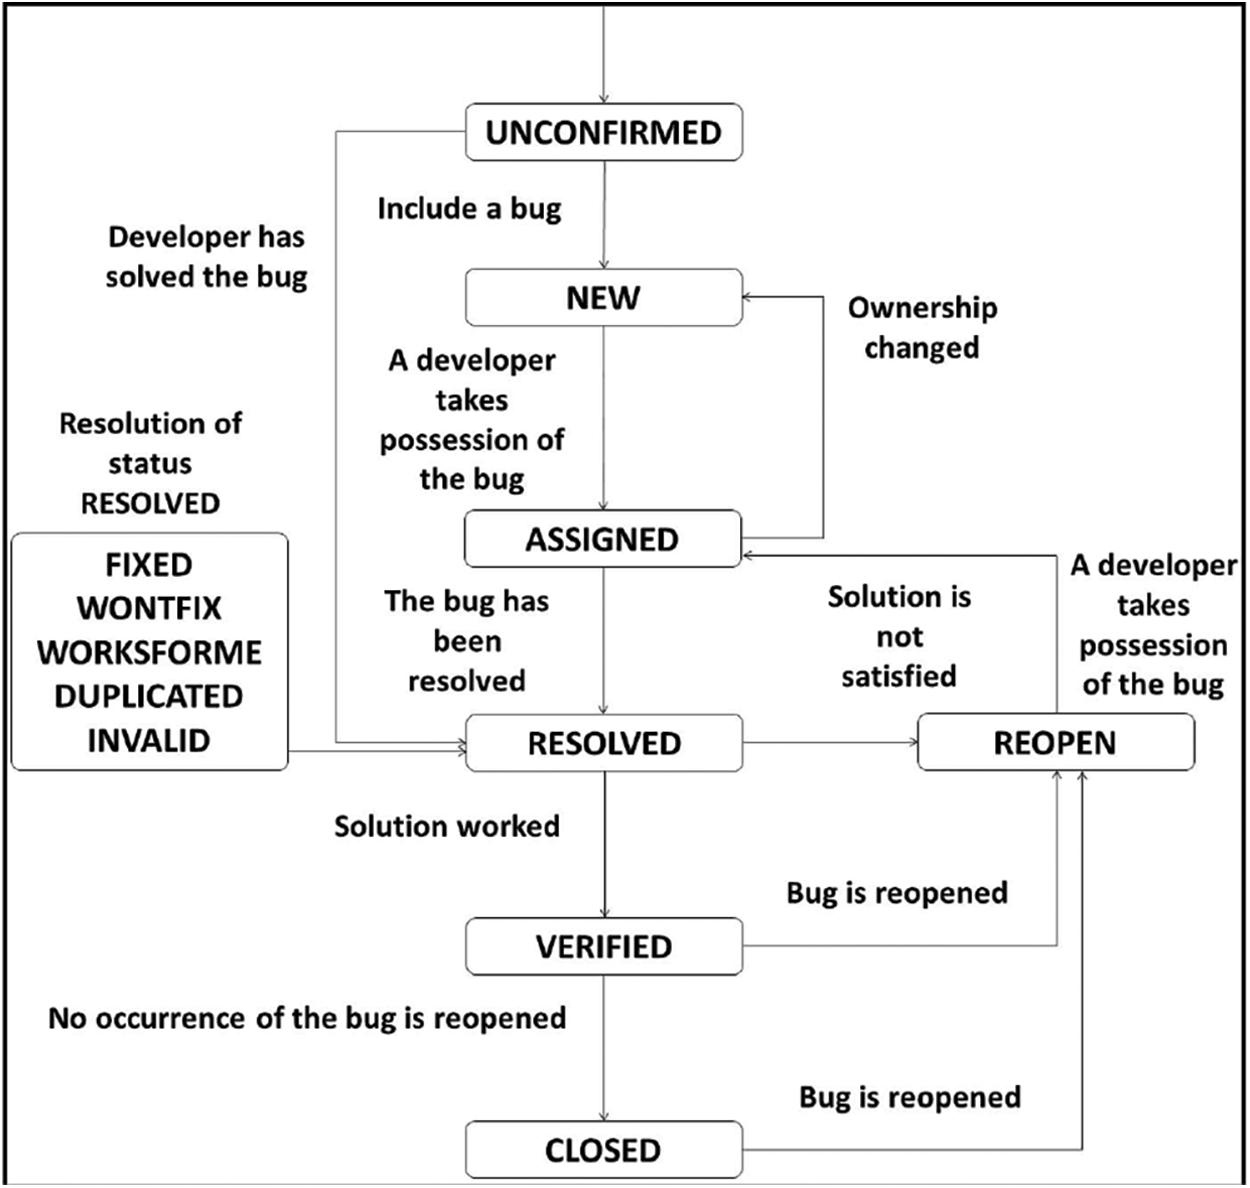
Figure 2: Bug report lifecycle [18]
In the bug triage process, a triager checks the bugs that arrived in the bug repository in two ways. Fig. 2 shows the process of Bug Triage. In repository-oriented decisions, when it finds out whether it is a duplicate bug, the analyst analyses the report for cogency, such as whether the report is normal or not [14]. This step is to clear away those bug reports that are not important. The rest of the reports are scrutinized for development-oriented decisions in which the severity and priority levels of the bugs have been checked by the triager [4]. These levels can be changed by triager if incorrect, so that time and resources can be allocated to important bugs.
In this section, we describe the proposed approach for developing the priority recommender.
In this study, we used two datasets Eclipse1 and Mozilla2, from the GITHUB3 data repository. Fifteen attributes were used in both datasets as listed in Table 2.
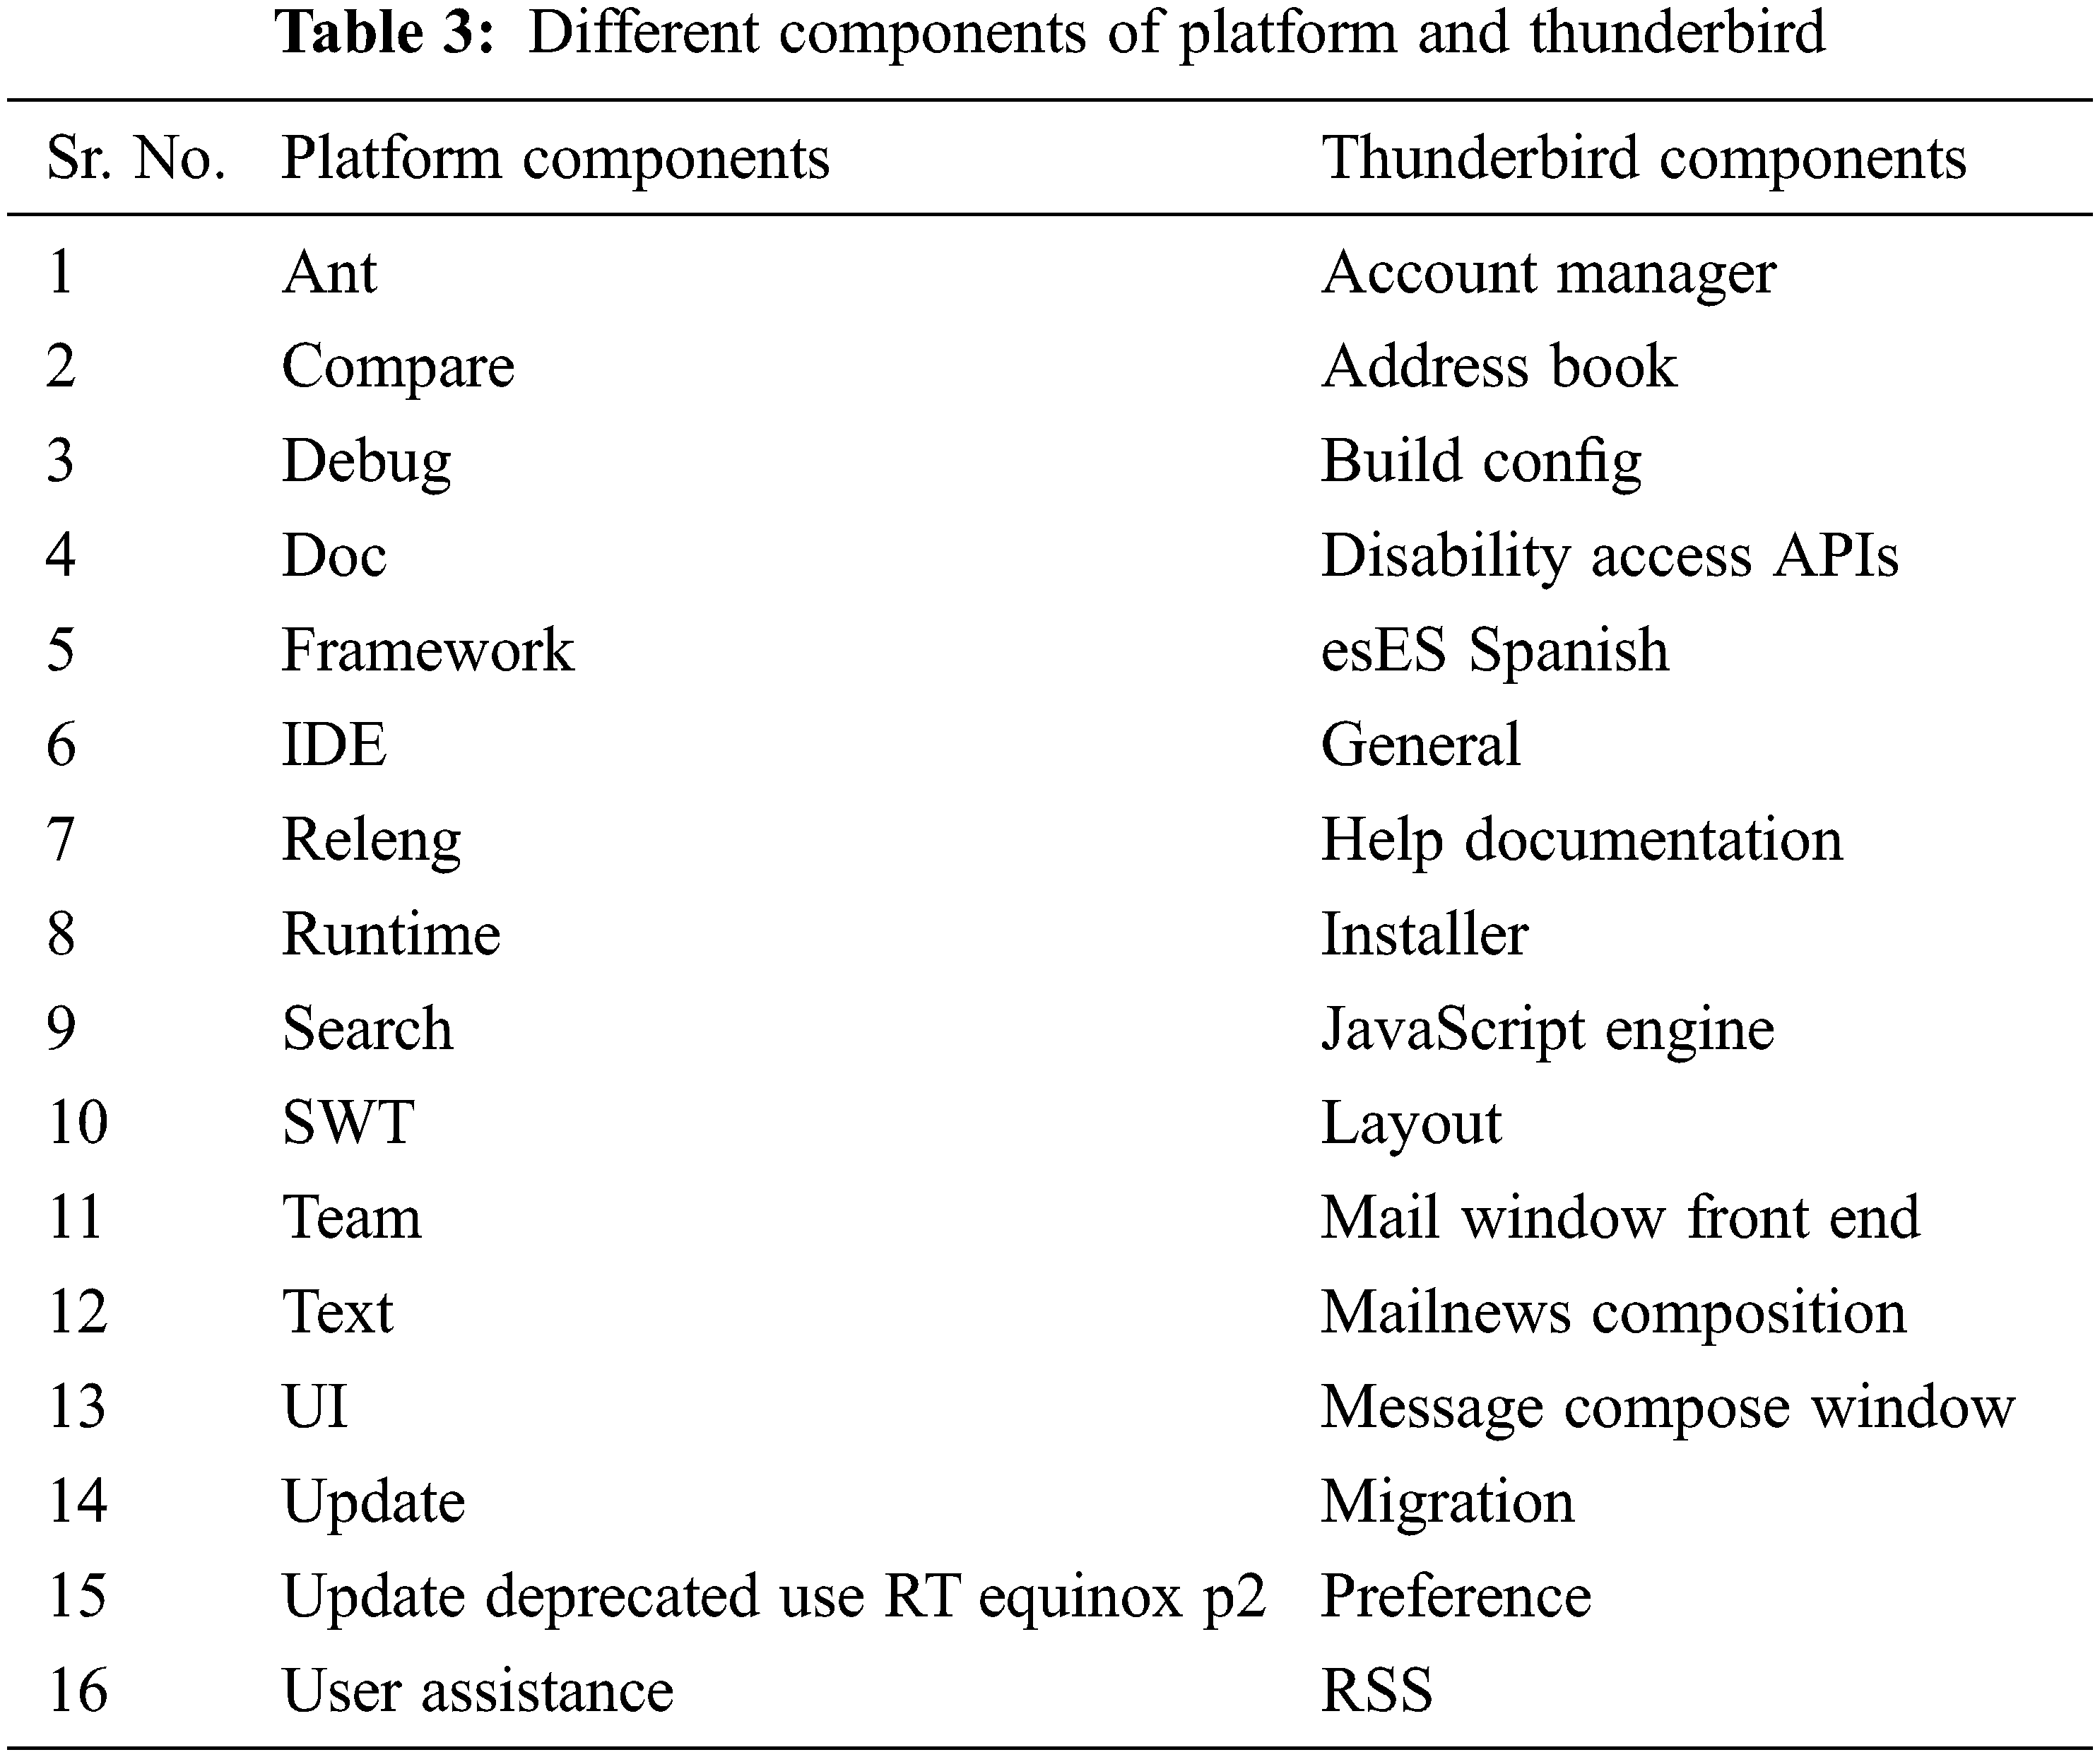
Eclipse is a development environment tool that includes integrated development environment and a plug-in system. The Eclipse tool provides a development platform with extensible tools, frameworks, and runtimes for creating and managing a software in its whole life. Mozilla is an internet application suite that contains classic products, such as the Firefox browser and Thunderbird email client. We have used platform products for Eclipse, and Thunderbird for Mozilla, with 16 components shown in Table 3. These components contain the maximum number of bugs in the software bug repository.
Preprocessing techniques—stemming, tokenization, and removal of stop words—get meaningful data from the dataset and apply to textual data.
Stemming: This technique is applied to the data to convert a word to its 1st form, like “gone” is converted to “go.” Different words have the same meaning; hence they are likely to convert into a single form (e.g., treatment and treats are converted to treat).
Tokenization: It is a process of breaking up a series of texts into words. Each word in this process is called a token.
Stop-Word Removal: Words that do not carry any meaning (like a, the, there, and they) are called stop words. These words must be removed from the set of tokens received from the previous step.
4.3 Classification-Based Approach
Many machine learning techniques, such as SVM and NB, have been used for bug prioritization (see Section 2). SVM has high algorithmic complexity and considerable memory requirements in large-scale tasks [19]. Also, it does not perform well on very large-scale datasets because the training time increases with the size of the dataset used. SVM might also be prone to overfitting some of the noise in the dataset. NB is biased towards incomplete datasets and does not work well where attributes are dependent on each other [3].
4.4 Averaged One Dependence Estimator
AODE is a semi-Naïve Bayes classifier. In AODE, each attribute of the dataset depends on two attributes: one is the target class attribute, and the other is selected from the list of attributes [20]. AODE technique ignores more complex dependency connections involving three or more values while permitting mutual reliance between pairs of values inside the input vector. As a result, the technique somewhat reduces the “naivety” of the NB classifier. With a lot of (training or input) data items, AODE works well. However, it is not possible to apply the AODE technique with high-dimensional vectors since all pairs of input values are taken into account in a combinatorial manner (each data item has many input values). It may make sense to only utilize dependency estimators in situations with a large number of input values where interdependence is known to exist or is at least conceivable. In general, estimating probability needs an x-dependence estimator furnished by the class value, target attribute value, and the values of the x other attributes based on which the target is conditioned. It estimates the probability of each class ‘y,’ given a specified set of features x1,…,xn, P(Y|x1,…,xn), and is formulated as in Eq. (1).
where,
Research Question 1: Why is there a need to use AODE?
Answer: AODE performs classification by averaging all stiffened class of classifiers [12]. The classifier takes one attribute as the super-parent attribute from the list of attributes and target attribute. The result of the super-parent attribute depends on the rest of the attributes, whereas the target or class attribute that classifies the instance depends on the super-parent attribute. A key point with this classifier is that it takes two attributes from the list of attributes for decision making. The more the attributes for decision making, the more likely will be the result of the classifier.
By averaging over all models in which all attributes rely on the class and a single other attribute, AODE defeats the Naïve Bayes assumption of attribute independence. Another benefit is the ability to seamlessly incorporate useful prior information into the estimate. Within a strong decision theory framework, it offers a natural and logical method of fusing previous knowledge with facts. You may create a prior distribution for future analyses by using historical data about a parameter. The previous posterior distribution might be utilized as a prior when fresh data become avaable. From the Bayes theorem, all conclusions are logically justified.
The proposed model uses AODE to prioritize bug reports. The main objective of the proposed model is to improve accuracy by reducing the error rate. The evaluation metrics used to evaluate the proposed model are precision, recall, F1-score, G-measure, MCC, ROC, and accuracy. Fig. 3 shows the flowchart of the proposed model.
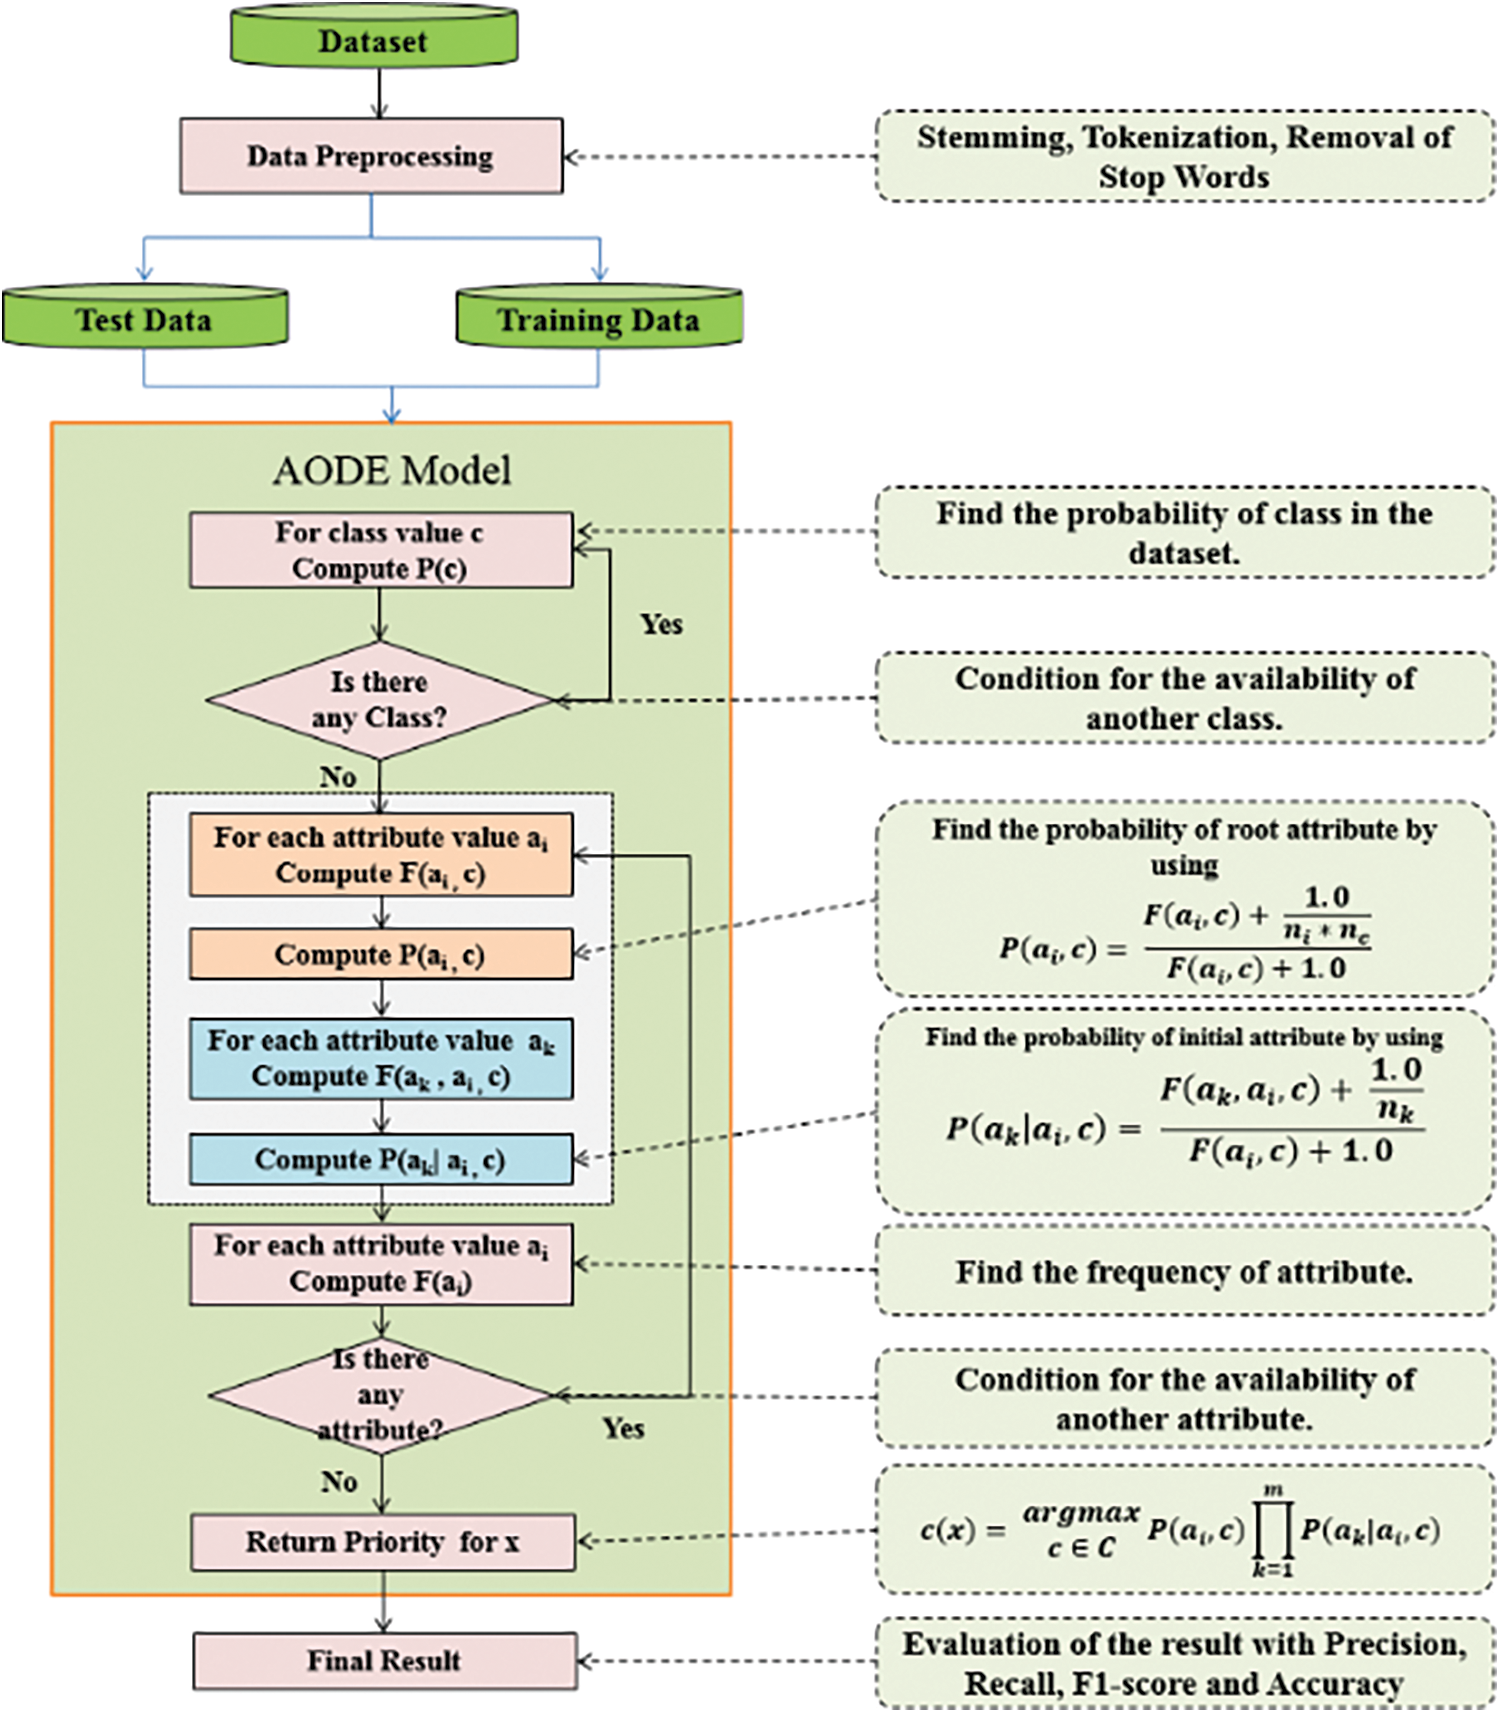
Figure 3: Flow chart of the proposed model
Precision, recall, F1-score, G-measure, MCC, ROC area, and accuracy are used as evaluation metrics to check the performance of the proposed model.
Precision can be considered as the amount of exactness (The percentage of instances labeled as positive are positive).
where TP is the true positive, which refers to the positive tuples correctly classified by the classifier, and FP is the false positive, which means negative tuples incorrectly classified as positive by the classifier.
Recall can be considered a measure of completeness (The percentage of positive instances is labeled as positives).
where FN is the false negative, the classifier mislabeled positive instances as negative. F1-score is the balance and discrepancy between precision and recall.
G-measure is the mean of specificity and recall.
MCC is the correlation coefficient between predicted and actual class.
Accuracy is the percentage of tuples that are correctly classified by the classifier.
To retrieve labels from multiple classes, averaging the output of evaluation metrics gives a view of the general results. For that purpose, micro-averaged and macro-averaged are two measures used to average the results of precision, recall, and F1-score. Their formulas are given in Eqs. (8)–(13), respectively [7].
5 Results Analysis and Discussion
Results for the AODE employed on the Eclipse and Mozilla dataset using confusion matrix are shown in Tables 4 and 5.
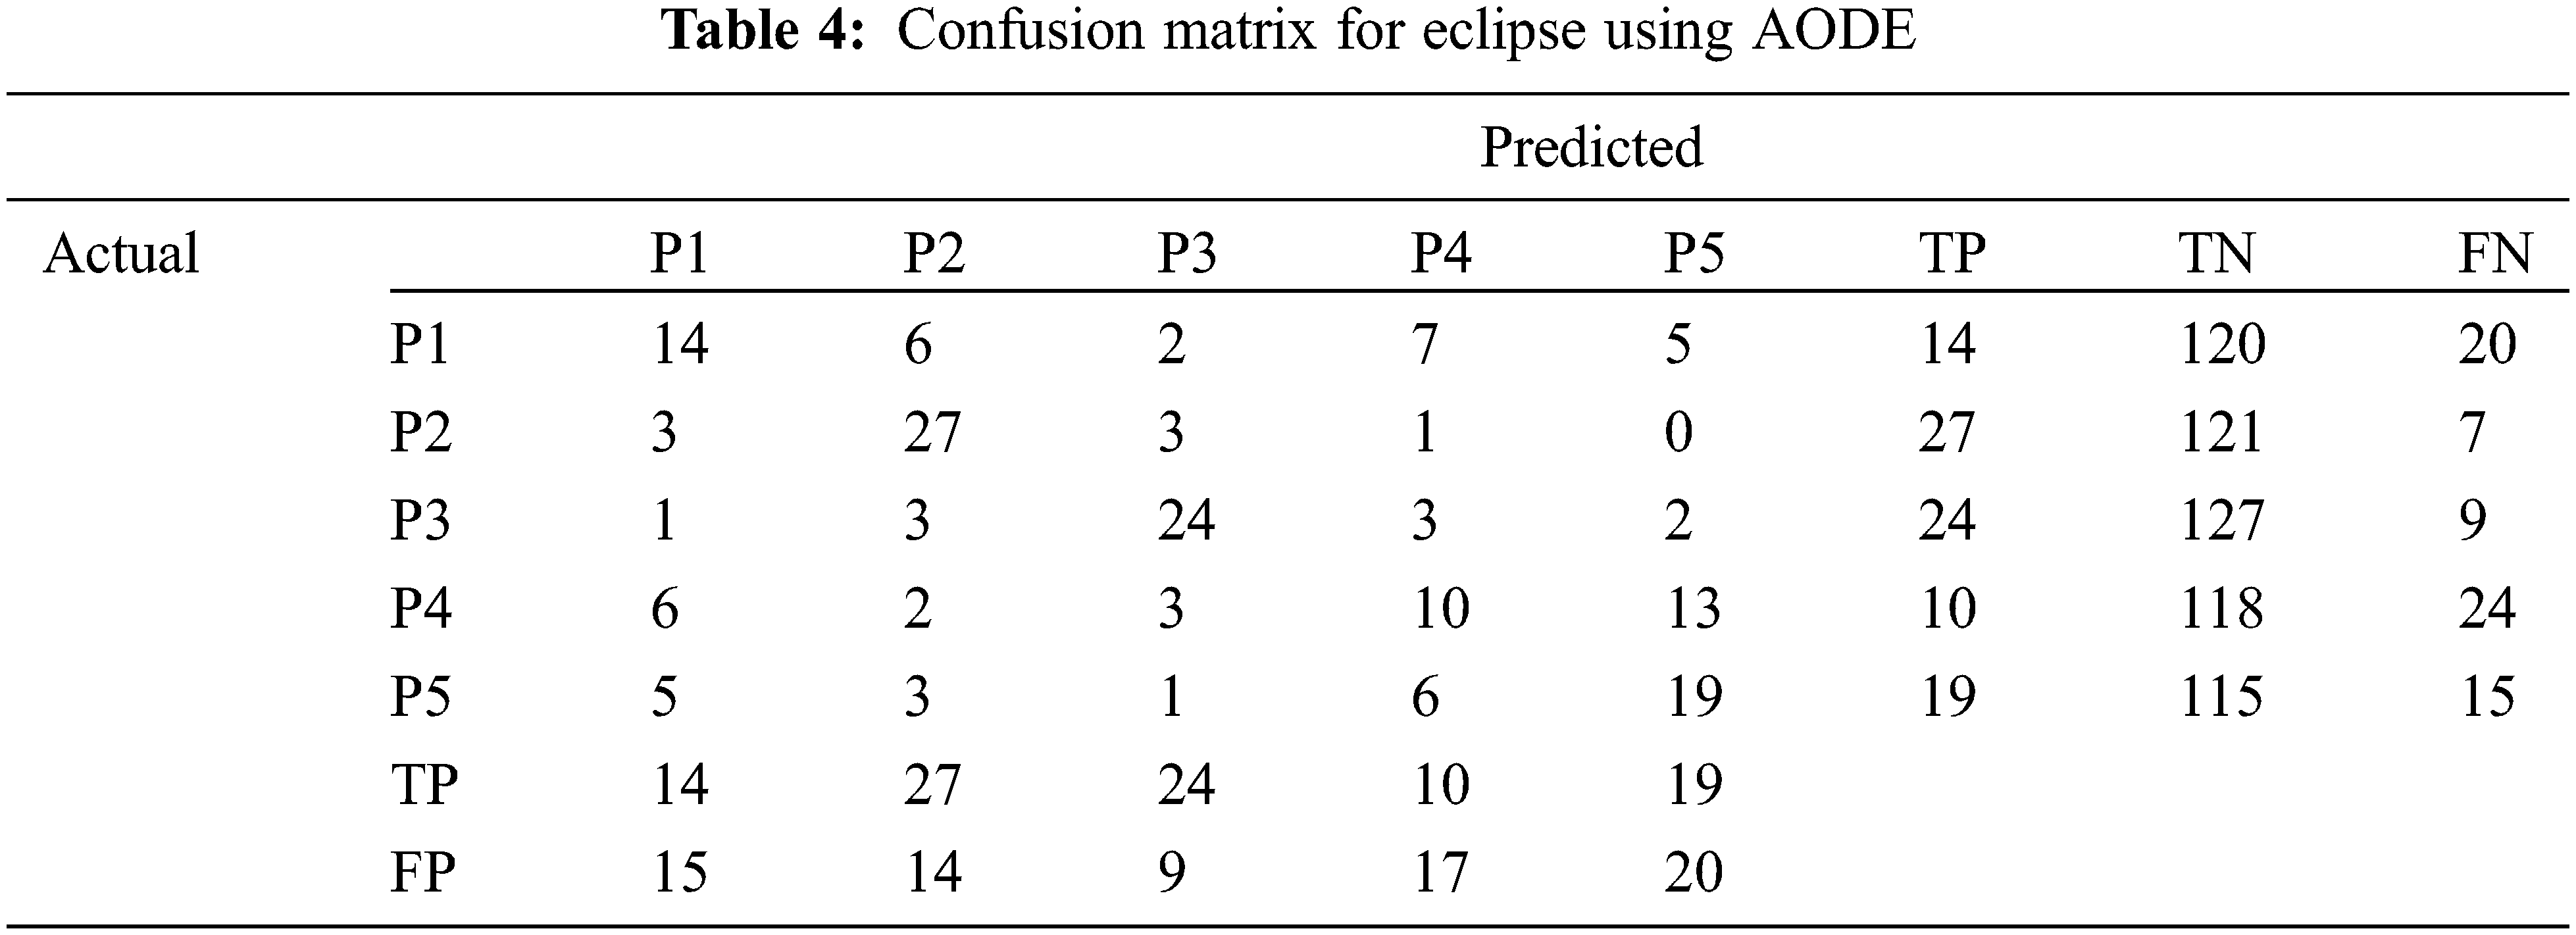
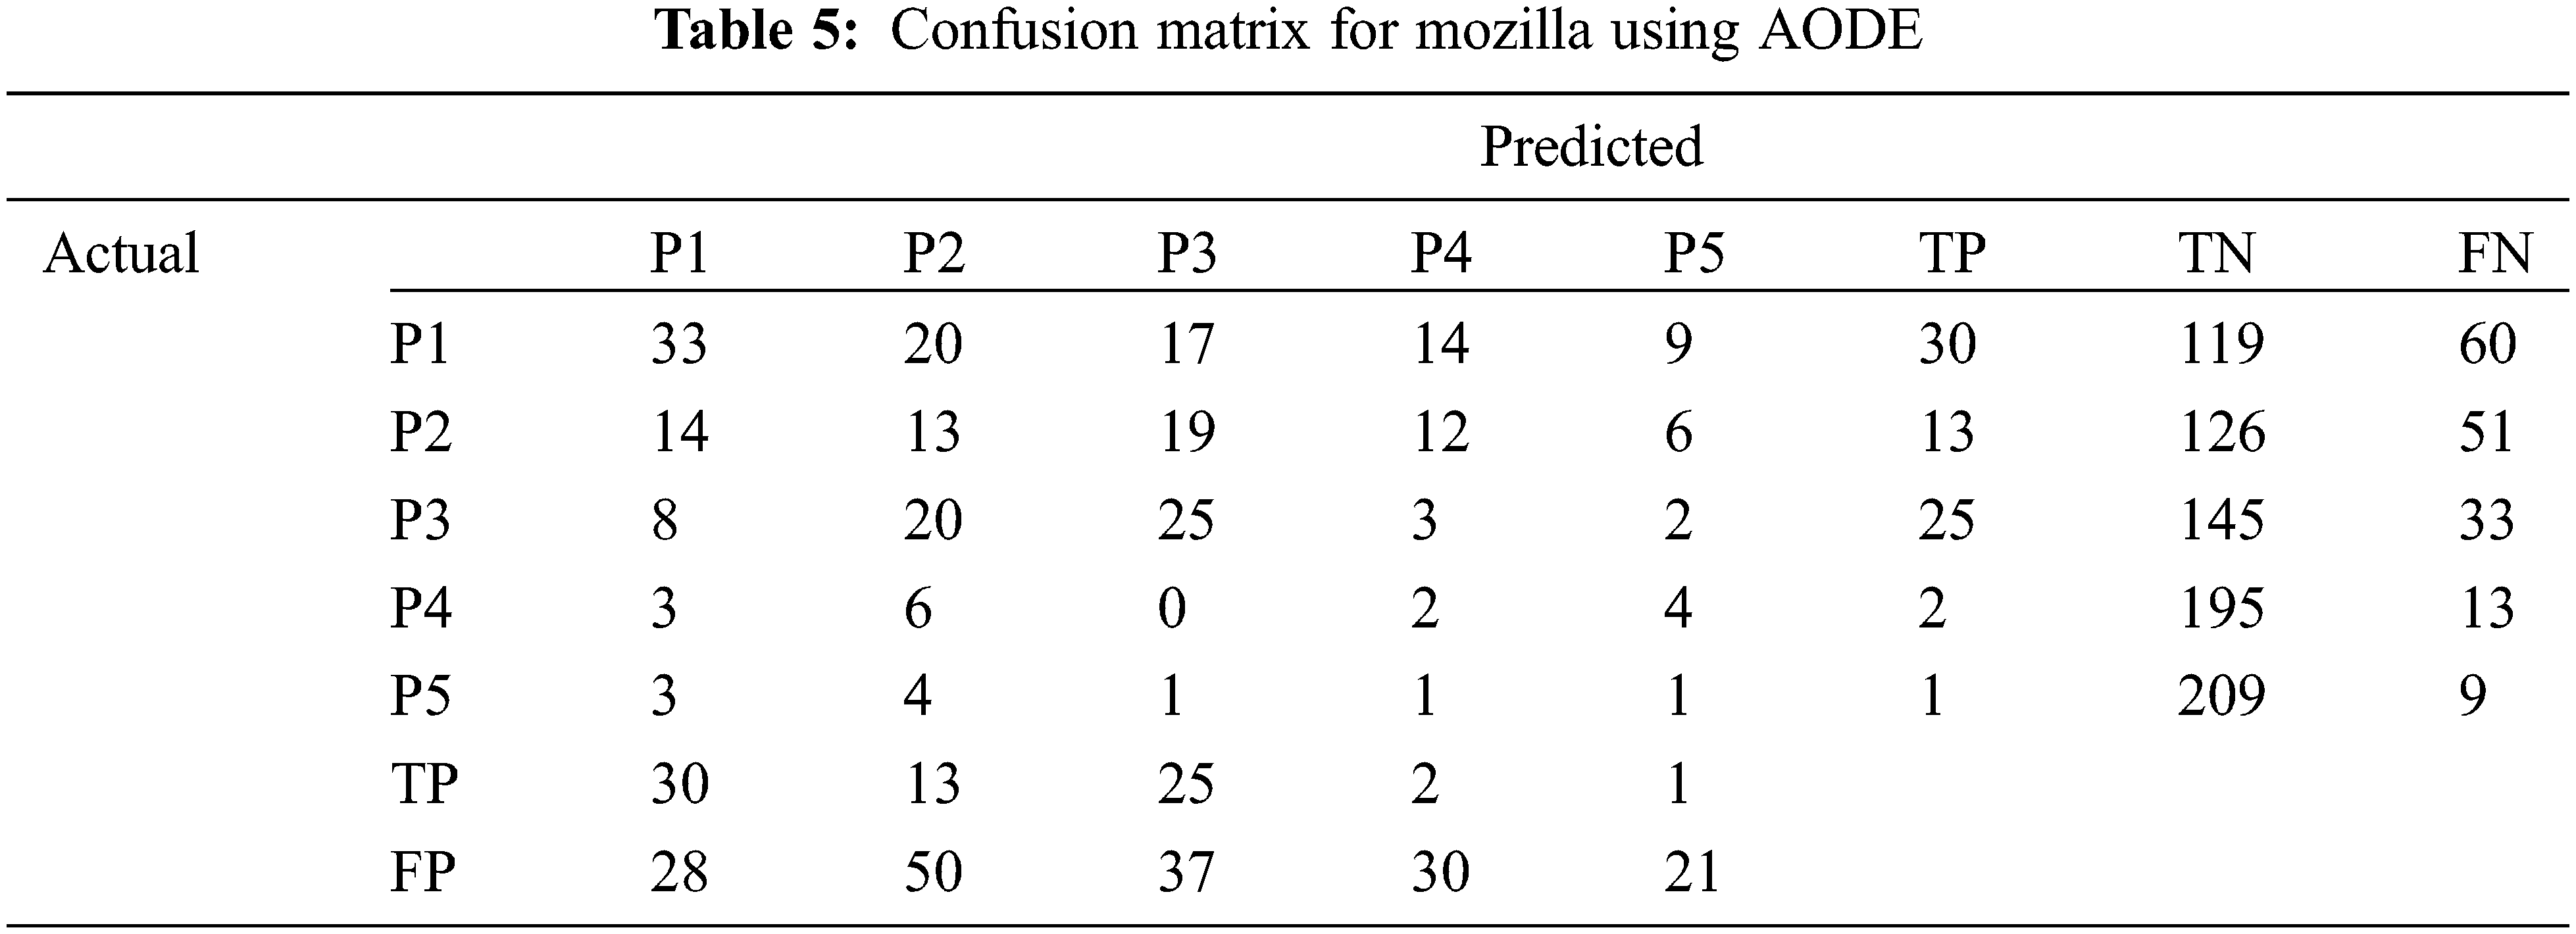
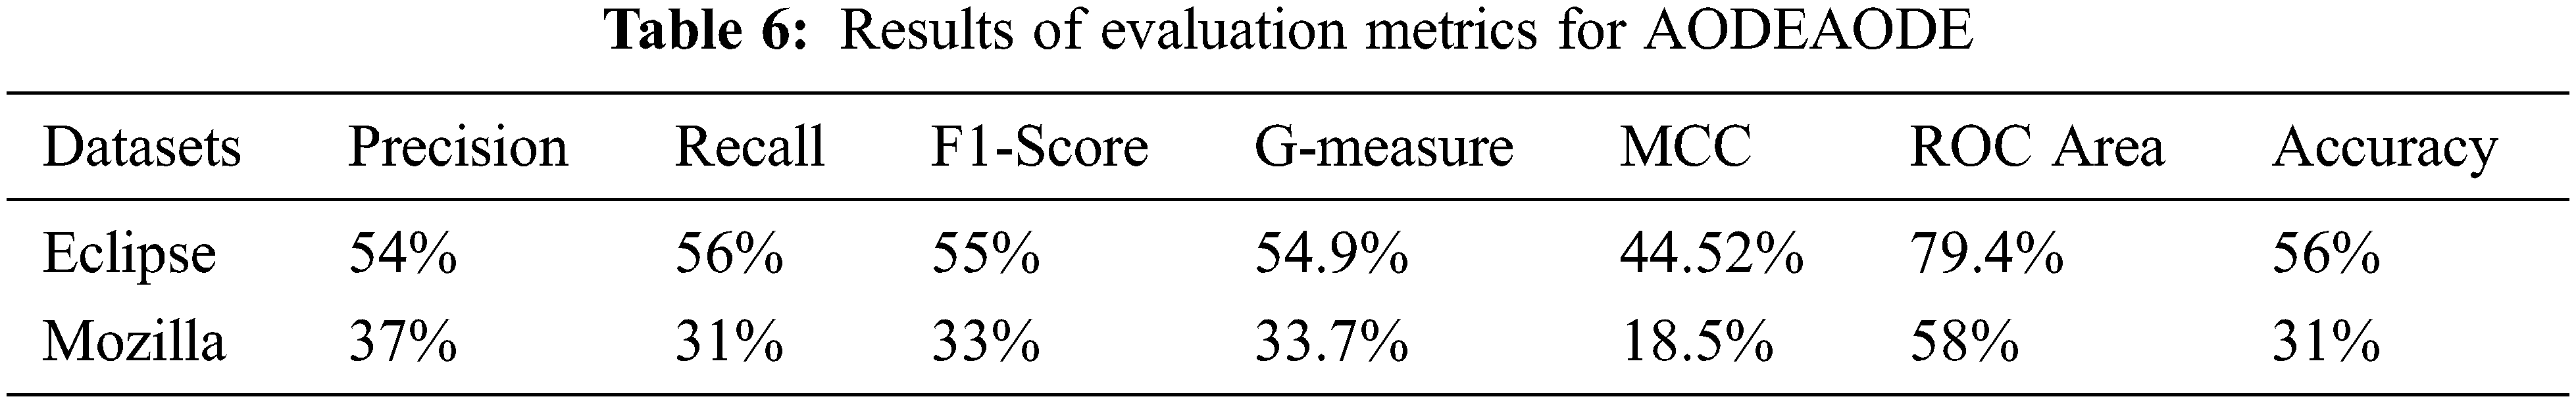
Here P1 is the highest priority and P5 is the lowest priority. Table 6 shows the results of AODE for both Eclipse and Mozilla datasets. The columns of the table show the results of the evaluation metrics, which are precision, recall, F1-score, G-measure, MCC, ROC Area, and accuracy. Rows indicate a comparison in the output of both datasets.
5.1 Comparison with SVM and NB Using Eclipse Dataset
The performance of AODE is compared with SVM and NB, and experimental results are shown in Table 7. The percentage difference is calculated in the last two columns of the table, which shows the difference in the results (precision, recall, F1-score, G-measure, MCC, ROC Area, and accuracy) of both the classifiers. Percentage difference is computed using Eq. (14):
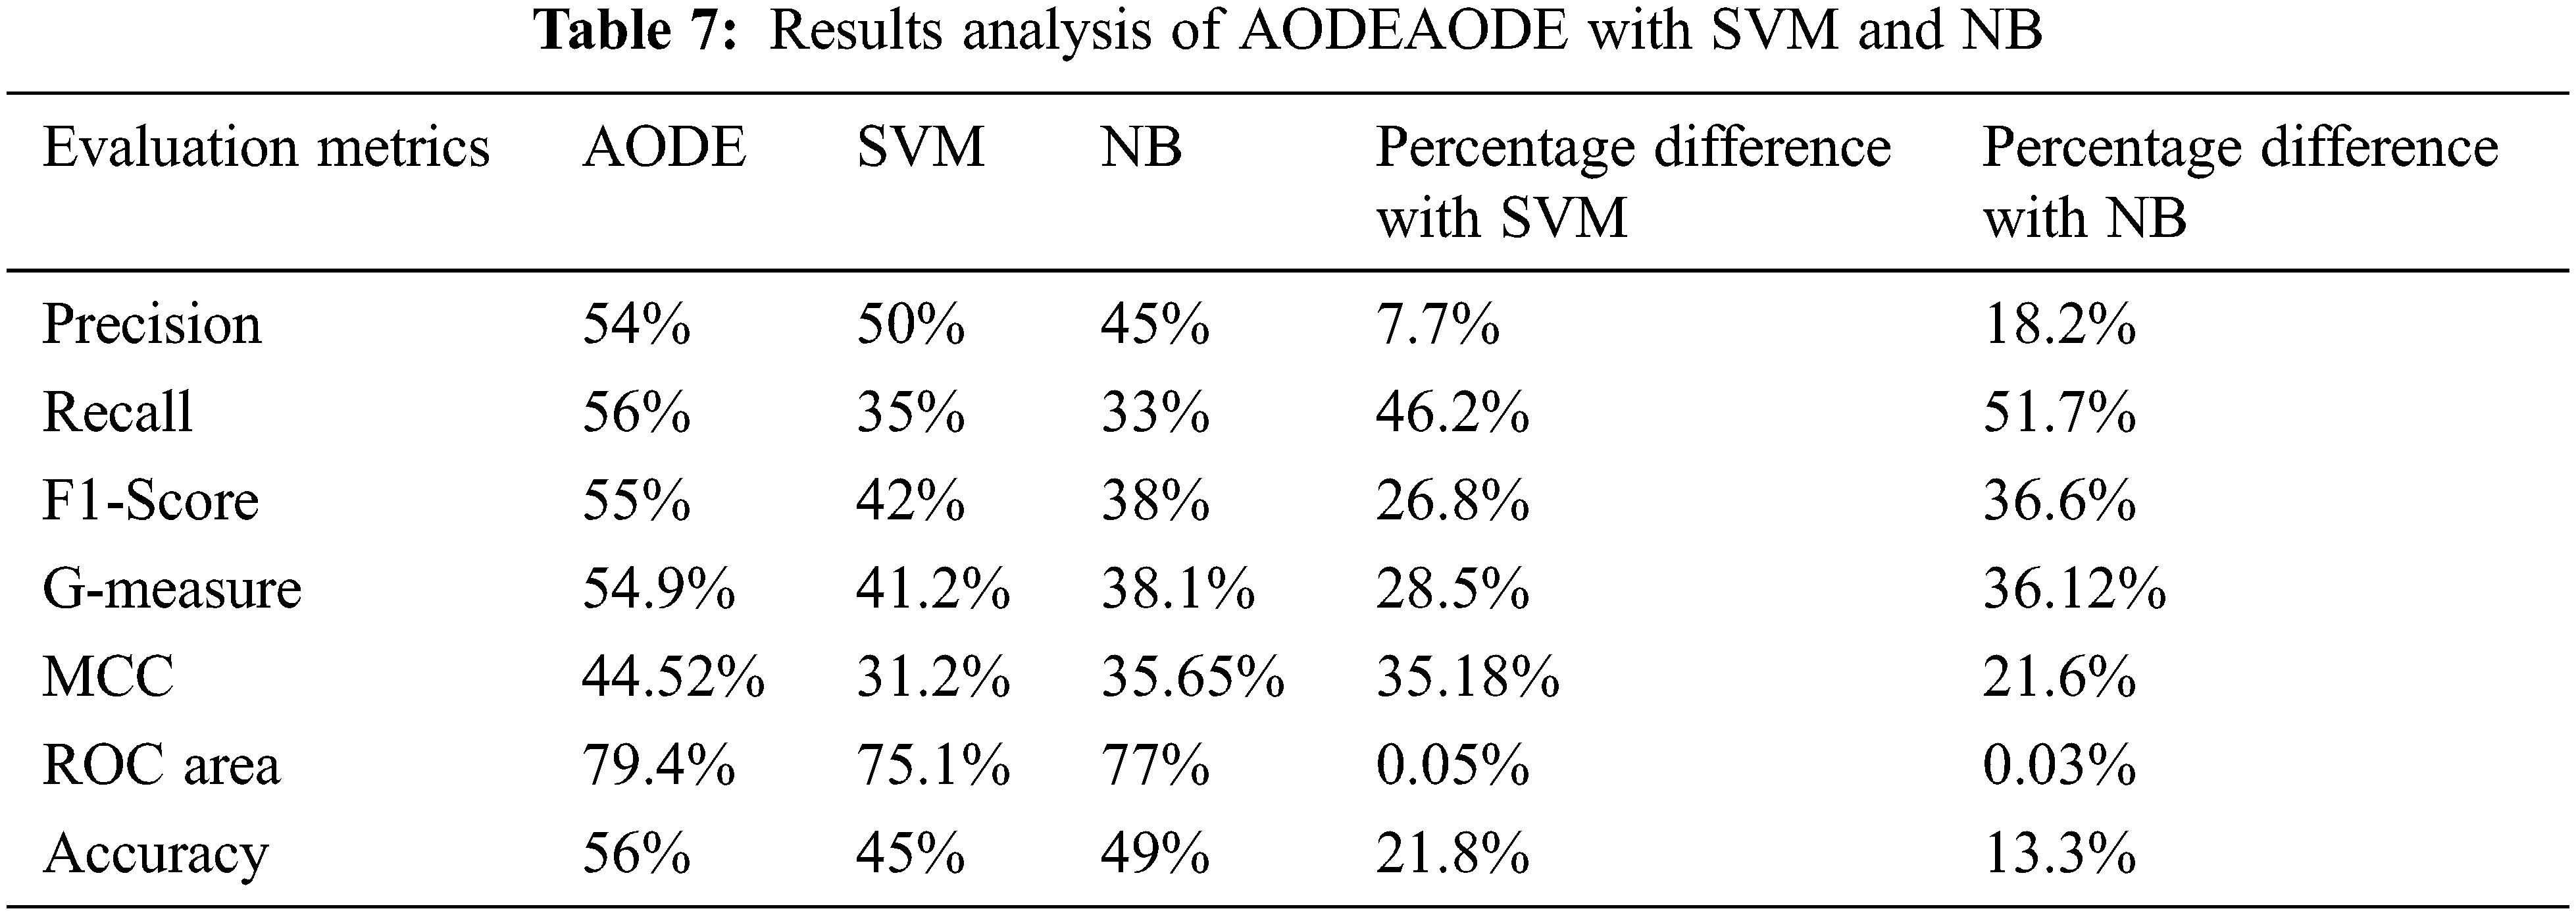
where vi and vj are the values where the difference is required.
Percentage difference represents the total difference between the results of AODE, with SVM and NB. Better performance of AODE over SVM and NB is observed in Table 7. The result shows that AODE outperforms the SVM in overall results based on the criteria (precision, recall, F1-score, G-measure, MCC, ROC area, and accuracy). The results show more than 20% percentage difference for recall, F1-score, G-measure, MCC, and accuracy, while the percentage difference for precision and ROC area is 7.7% and 0.05%, respectively. The results of AODE using precision, recall, F1-score, G-measure, MCC, ROC area, and accuracy improved by 18.2%, 51.7%, 36.6%, 36.12%, 21.6%, 0.03%, and 13.3% respectively over NB. Fig. 4 shows the comparison of AODE with SVM and NB using the Eclipse dataset. The difference represents the total difference between the results of AODE and SVM and NB. Better performance of AODE over SVM and NB is observed in Table 7. The result shows that AODE outperforms the SVM in overall results based on the criteria (precision, recall, F1-score, G-measure, MCC, ROC area, and accuracy). The results show more than a 20% percentage difference for recall, F1-score, G-measure, MCC, and accuracy, while the percentage difference for precision and ROC area is 7.7% and 0.05%, respectively. Results of AODE using precision, recall, F1-score, G-measure, MCC, ROC area, and accuracy improved by 18.2%, 51.7%, 36.6%, 36.12%, 21.6%, 0.03%, and 13.3% respectively over NB. Fig. 4 shows the comparison of AODE with SVM and NB on the Eclipse dataset.
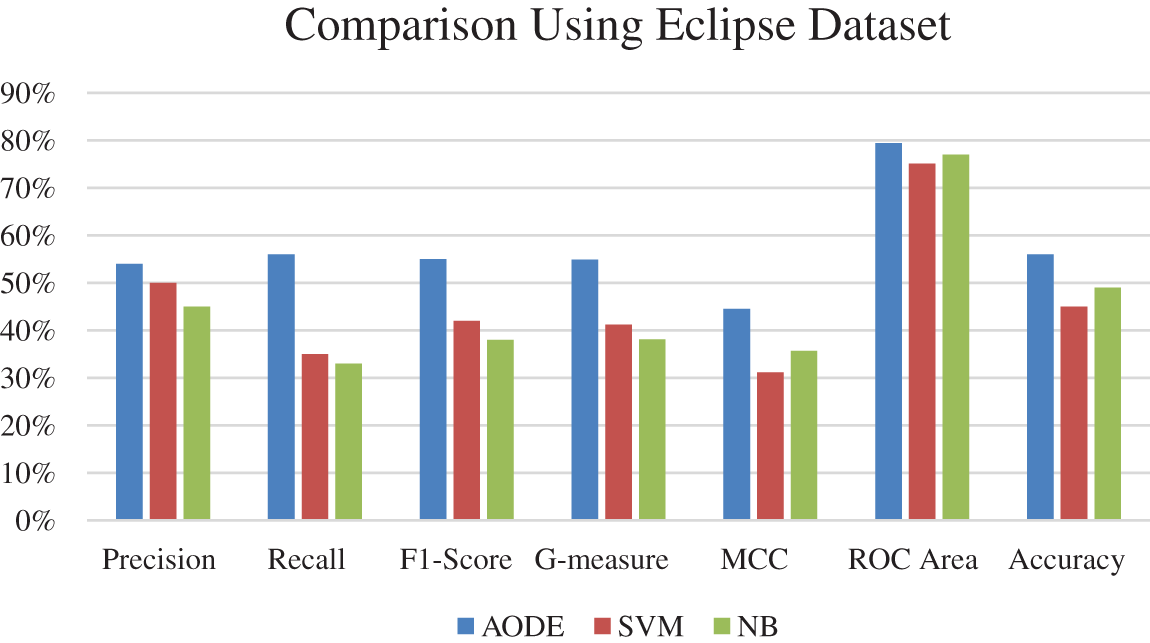
Figure 4: Comparison of AODE with SVM and NB using eclipse dataset
5.2 Comparison with SVM and NB Using Mozilla Dataset
The results of AODE with SVM and NB on the Mozilla dataset for Precision, Recall, F1-score, G-Measure, MCC, ROC Area, and Accuracy are shown in Table 8. The last two columns of the table show the percentage difference between the classifier’s results. It is clear from Table 8 and Fig. 5 that AODE gives better results than SVM and NB.
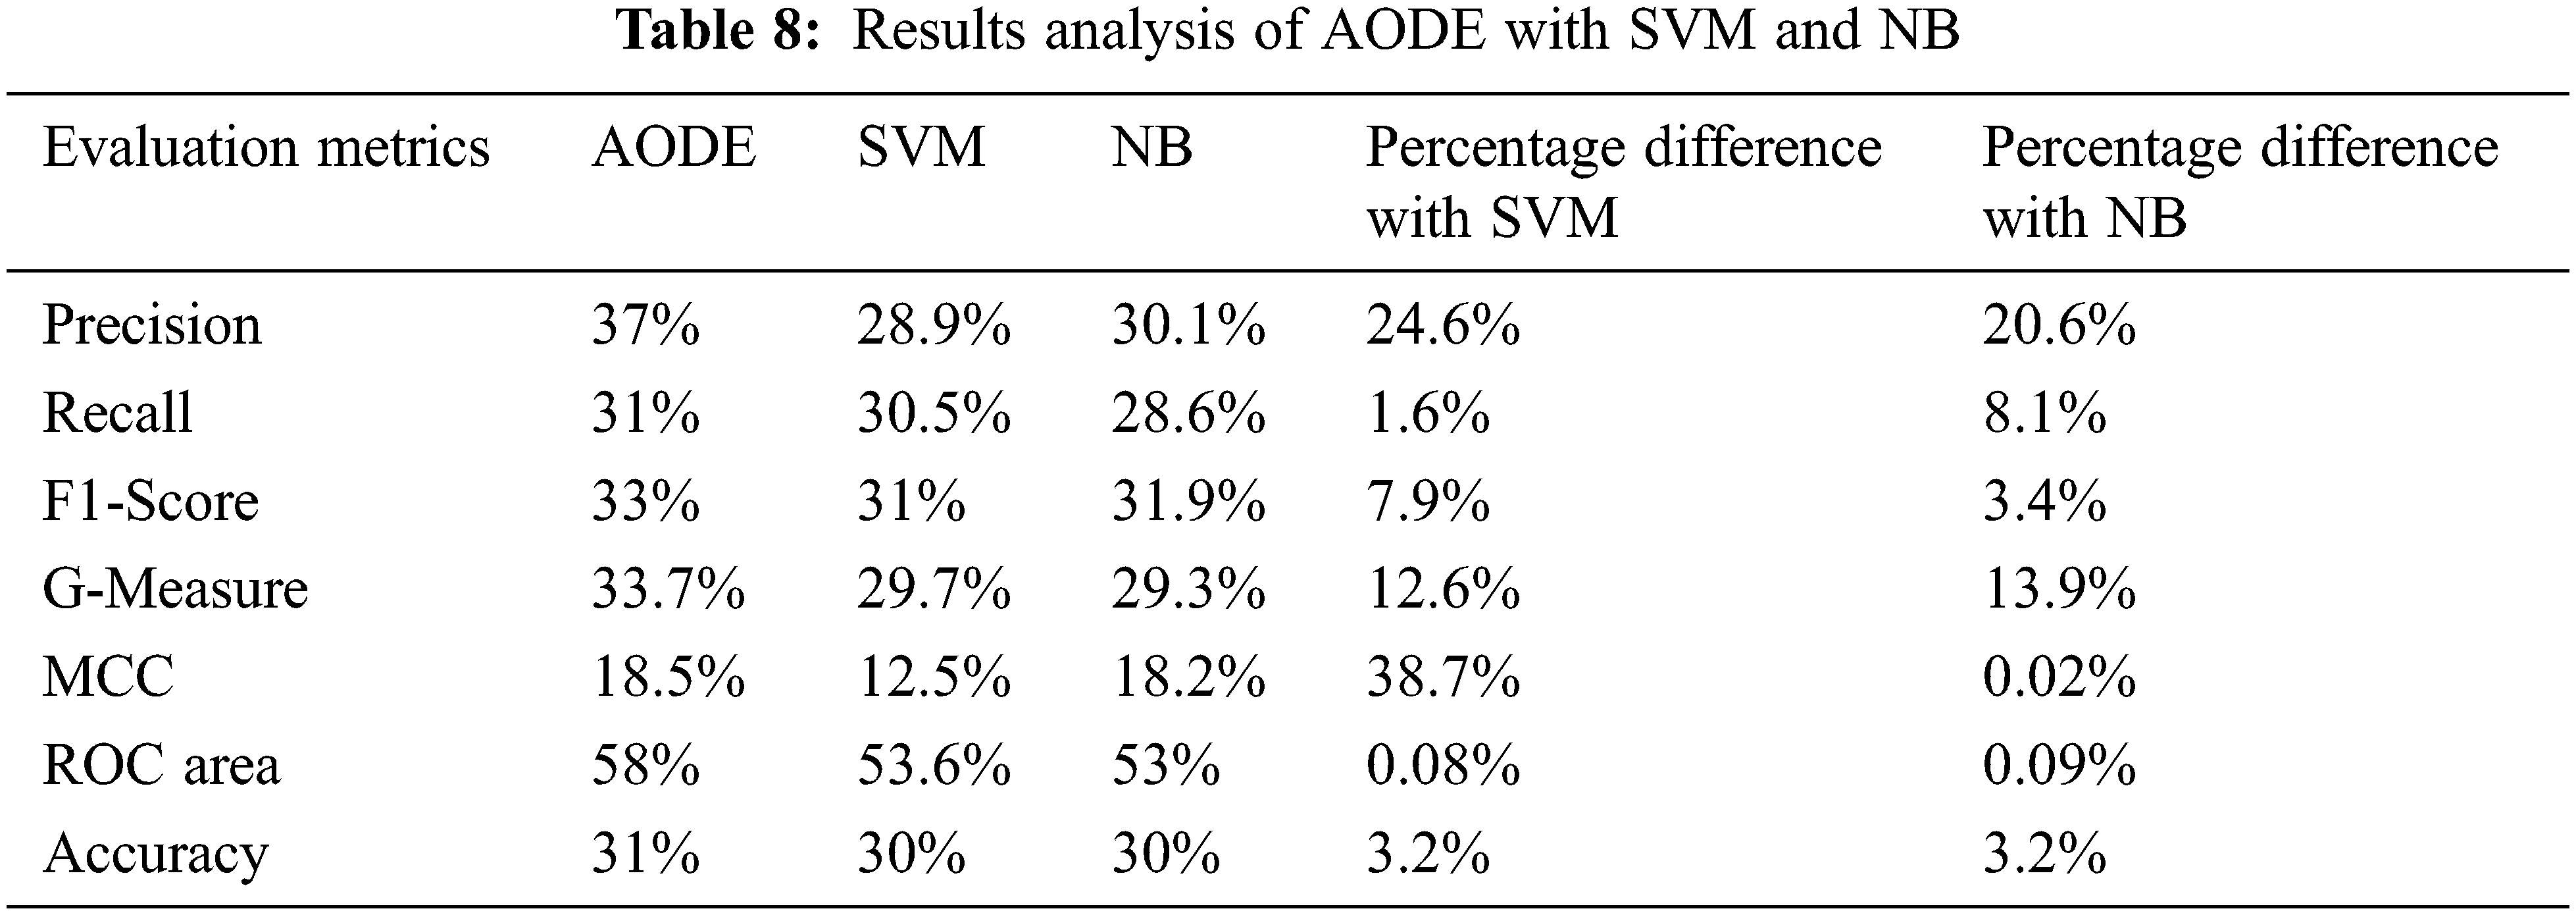
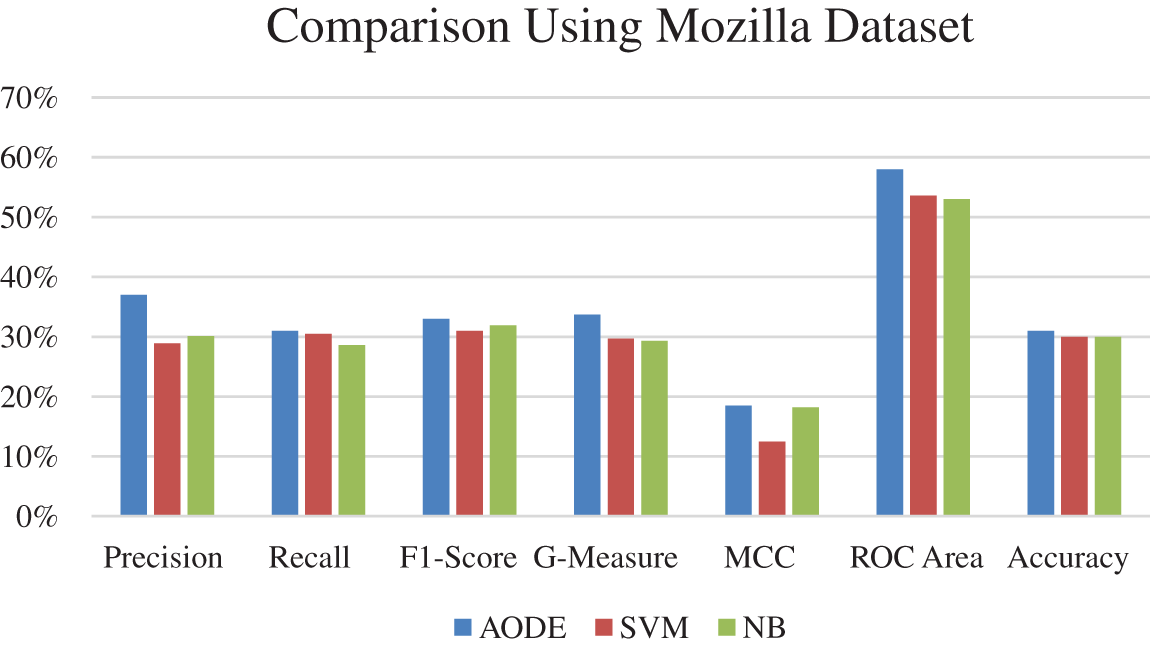
Figure 5: Comparison of AODE with SVM and NB using mozilla dataset
5.3 Comparison of Results of Both the Datasets
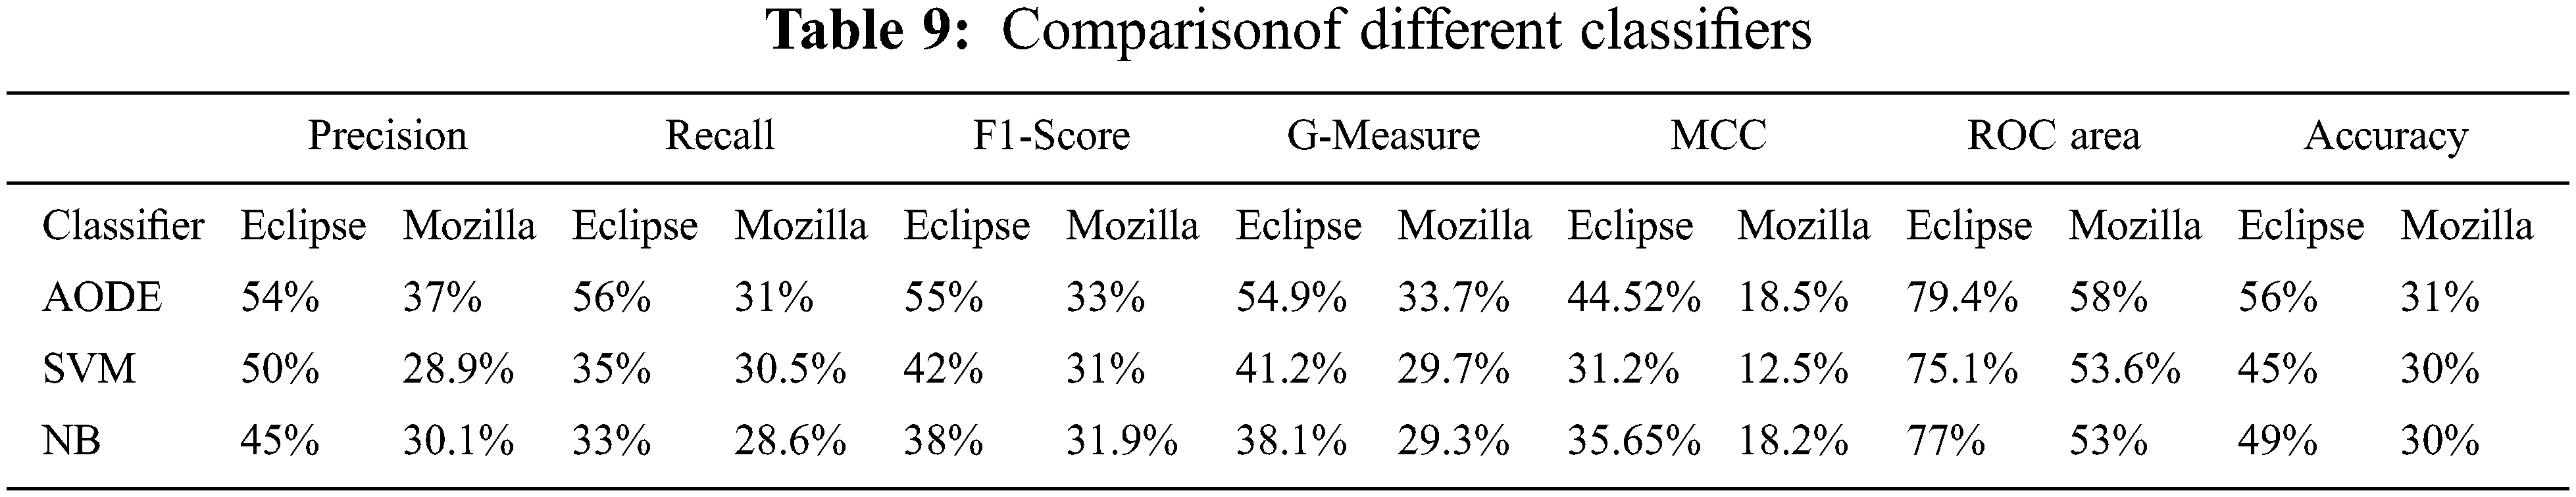
Precision, recall, F1-Score, G-Measure, MCC, ROC area, and accuracy were calculated for both Eclipse and Mozilla datasets for AODE, SVM, and NB are shown in Table 9. Columns of the table present the results of evaluation metrics for both the datasets, and rows show calculated outcomes for AODE, SVM, and NB. The proposed approach outperforms both the SVM and NB models. The accuracy of AODE on the Eclipse dataset improved by 11% and 7% over SVM and NB, respectively, and 1% over both classifiers on the dataset of Mozilla.
5.4 Macro and Micro-Averaged Analysis for Both the Datasets
Macro and micro-averaged values are calculated using Eqs. (8)–(13). Table 10 shows the averaged values of precision, recall, and F1-score for macro and micro analysis from the above confusion matrices for Eclipse and Mozilla, respectively. The columns of the table show the macro and micro analysis of precision, recall, and F1-score. Whereas the rows of the table show performance of AODE, SVM, and NB.
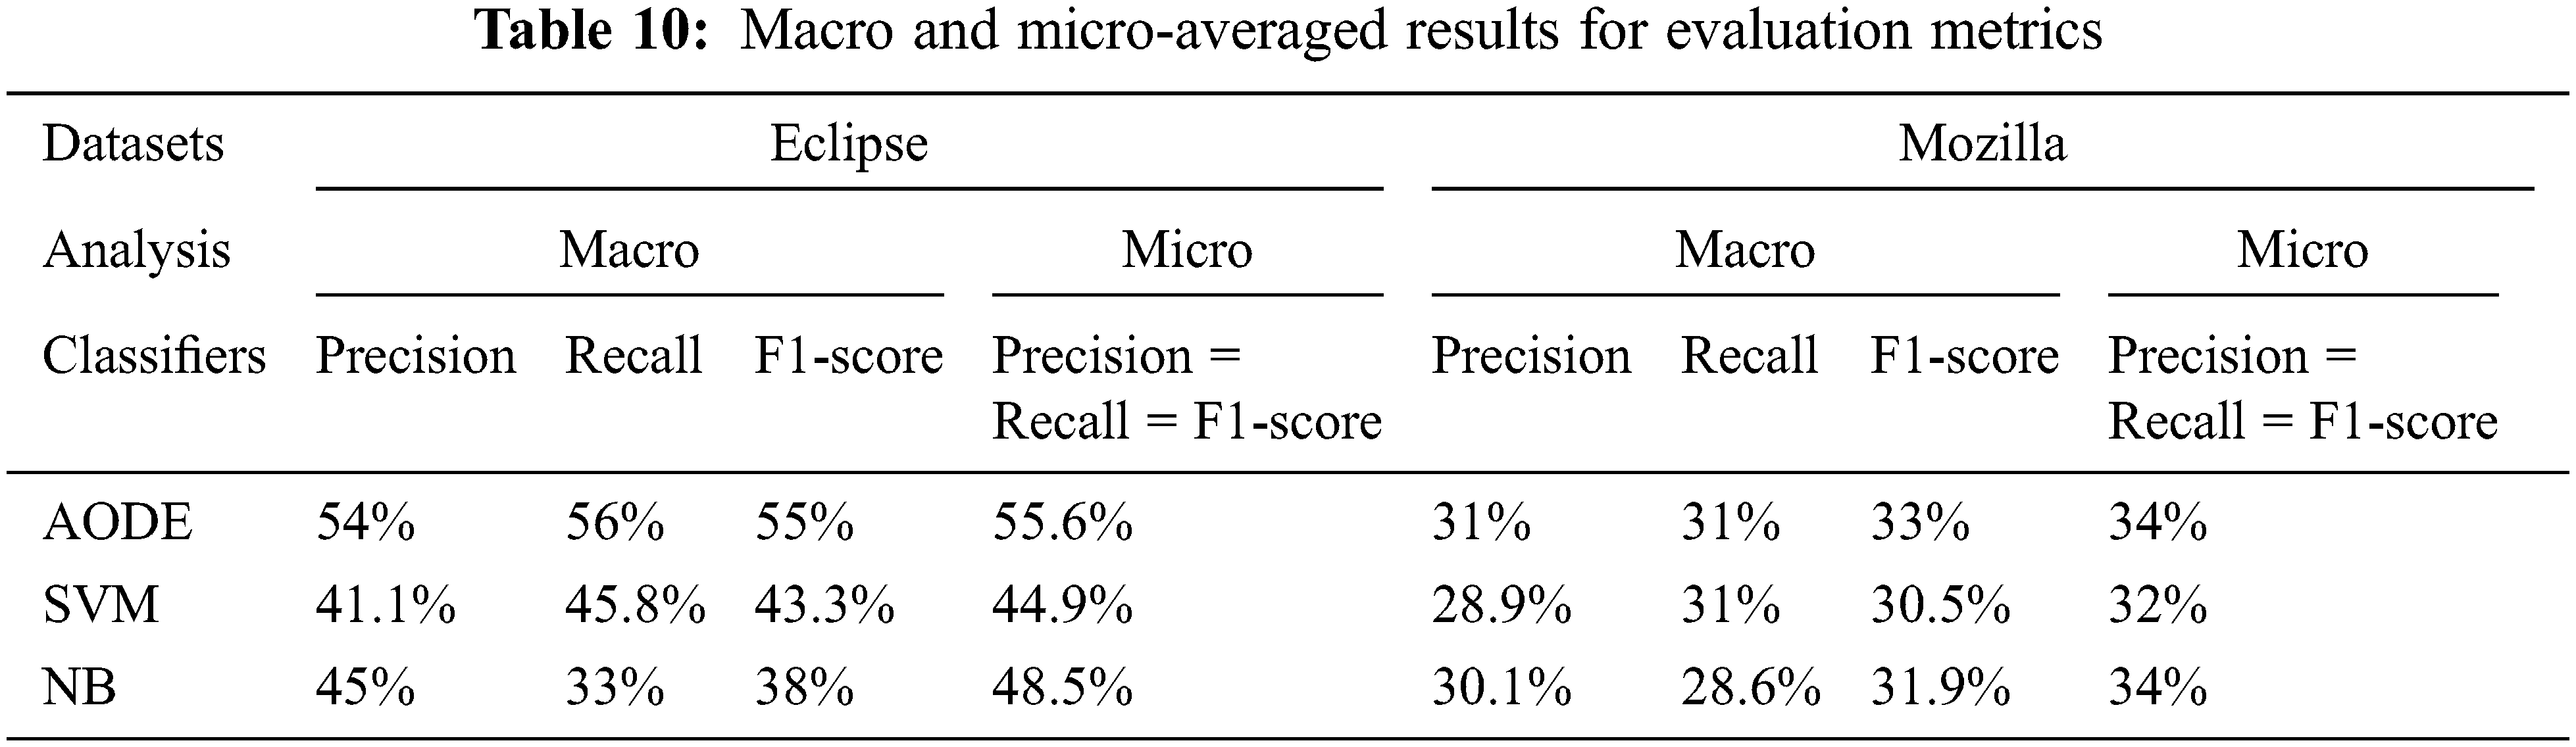
From Table 10, AODE achieved better results than SVM and NB. The value of micro-averaged analysis for precision, recall, and F1-score are the same because TP and FN values are the same in both datasets.
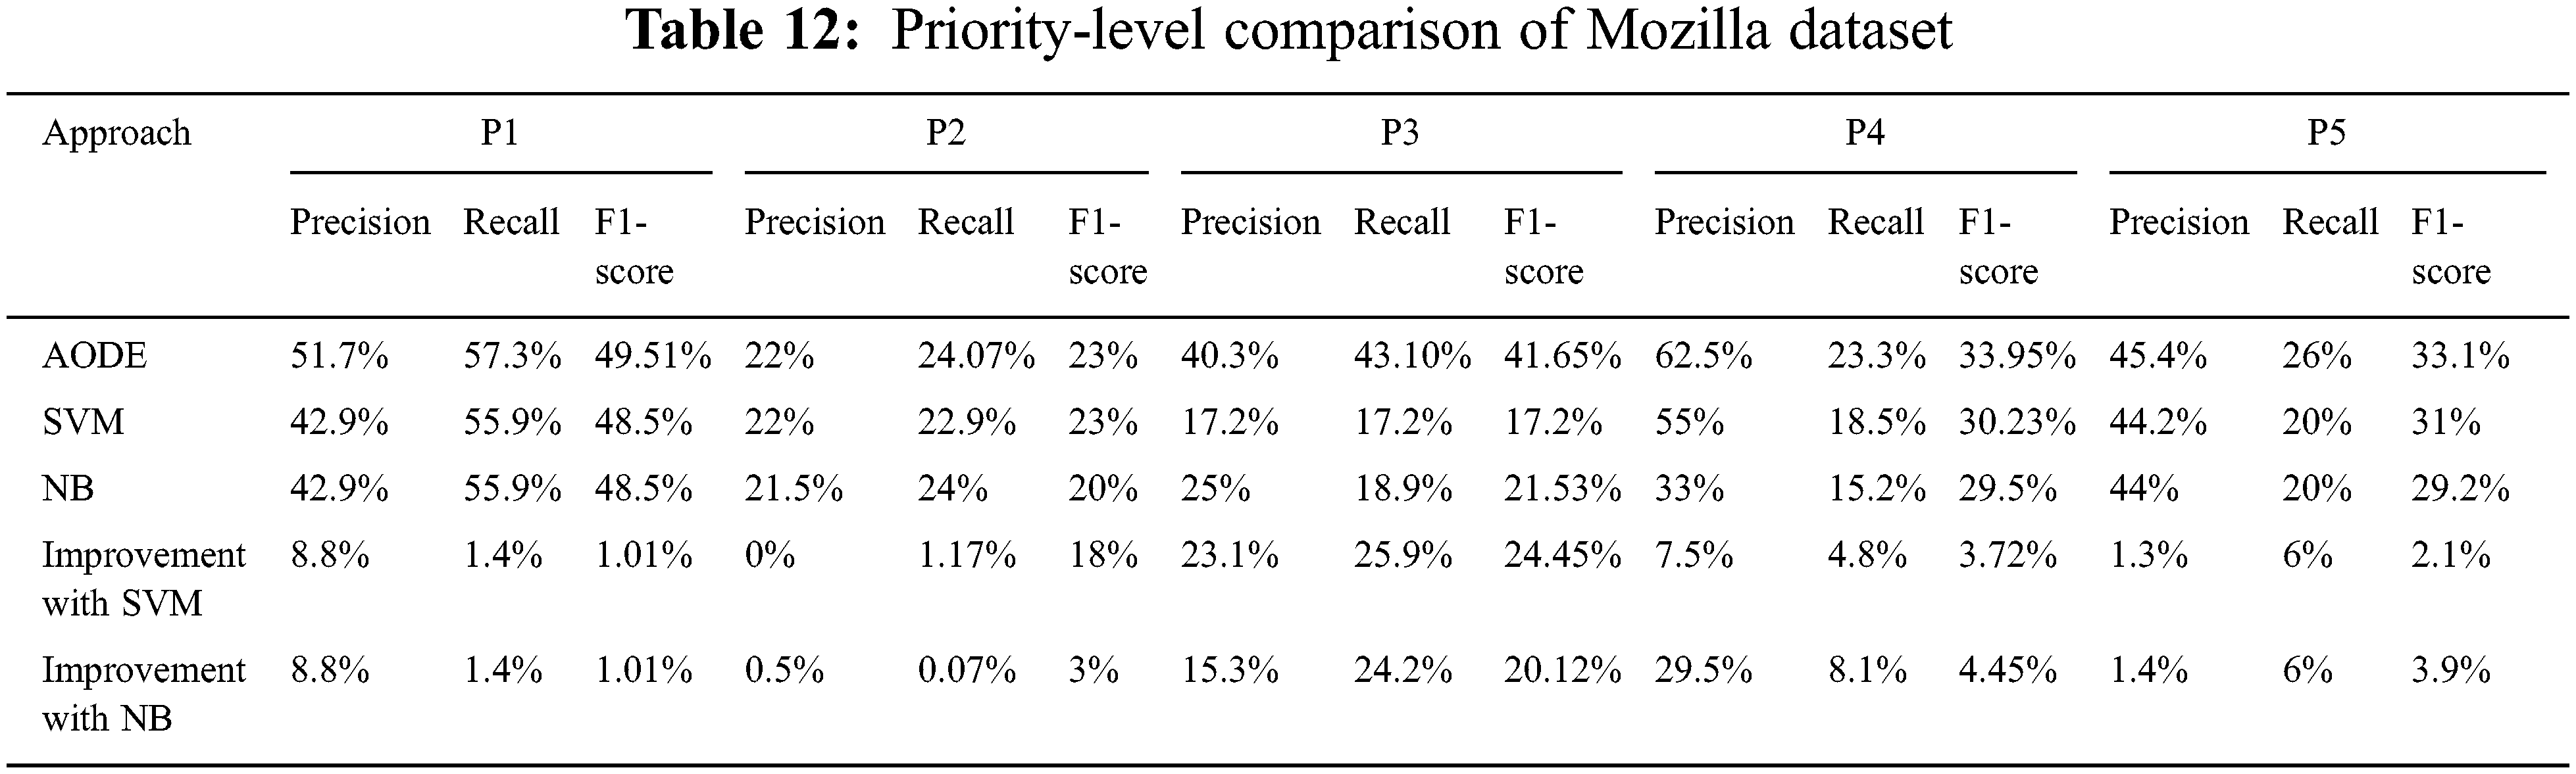
5.5 Priority-Level Comparison of Both the Datasets
Priority-level comparison is shown in Tables 11 and 12 for Eclipse and Mozilla datasets. Columns of the tables show the values of precision, recall, and F1-score for each priority. At the same time, rows show the output of AODE, SVM, and NB.
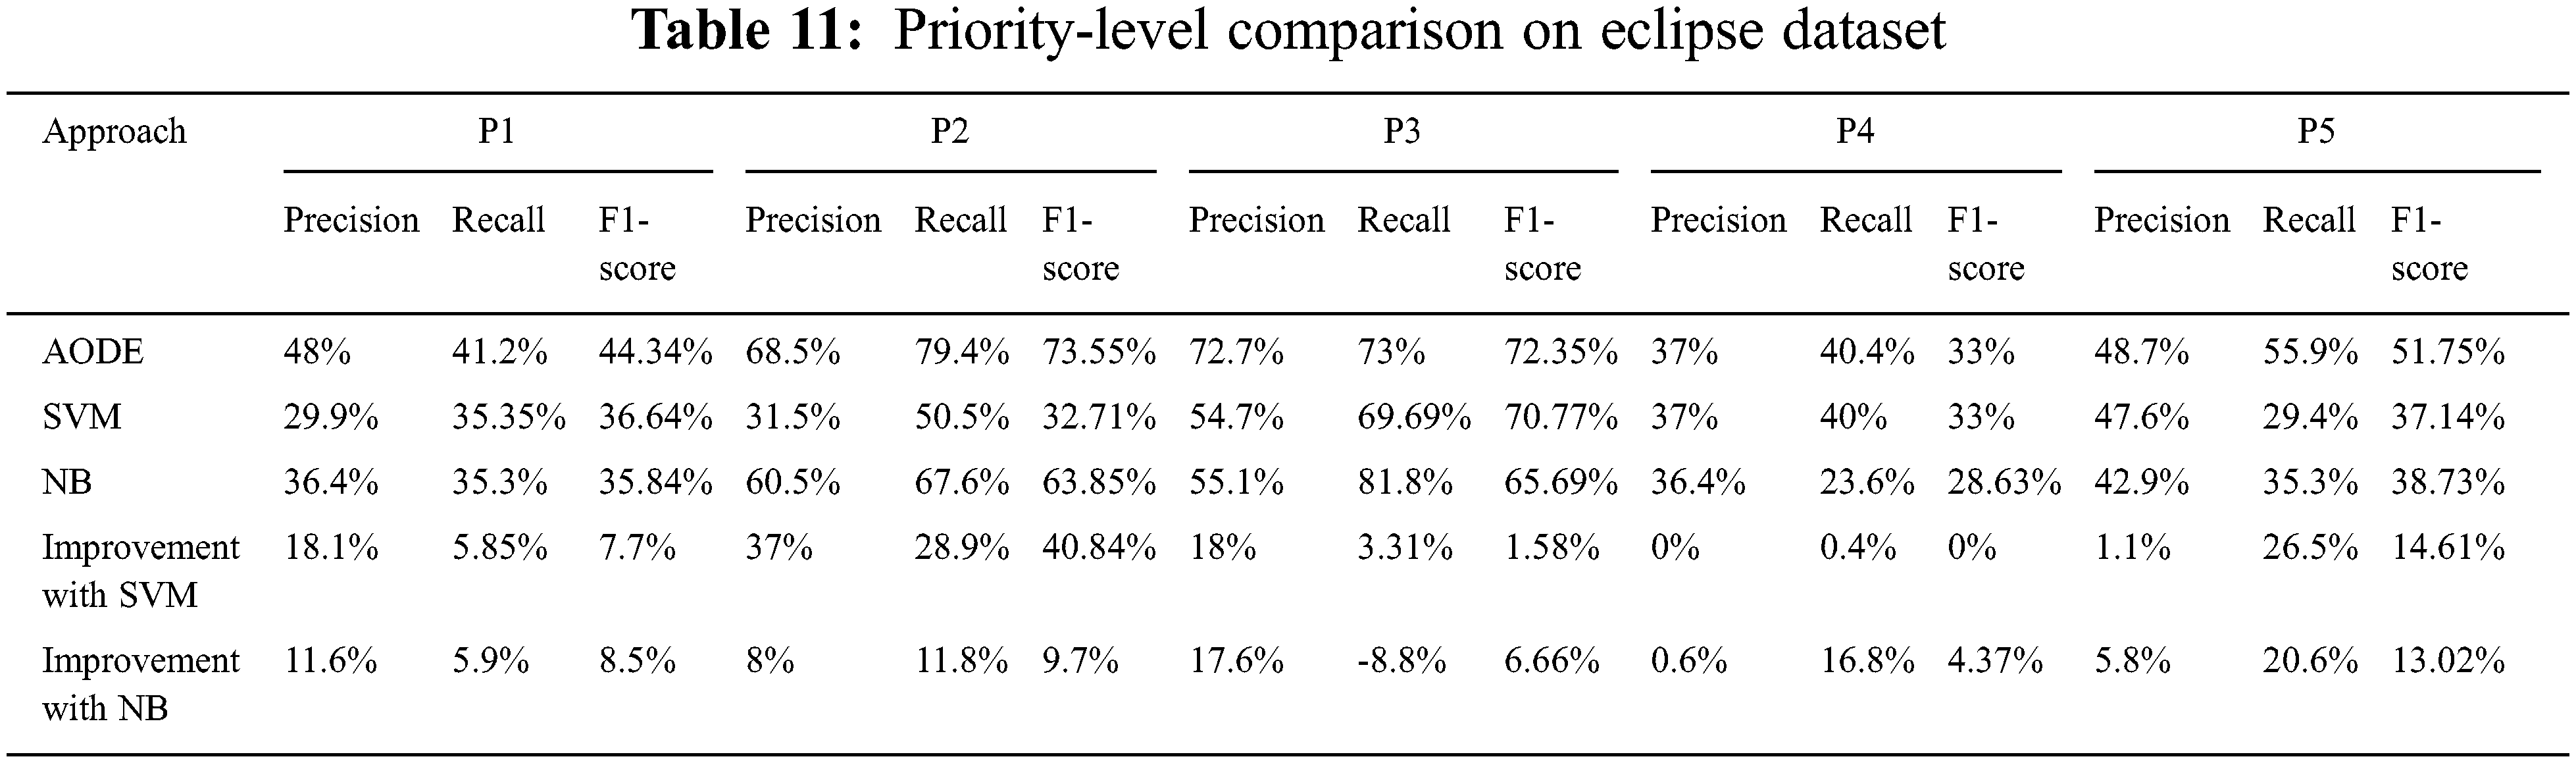
The proposed approach achieves significant improvement in performance on each priority level over the results of SVM. The improvement in results for Eclipse dataset varies from 0% to 37% for precision, 0.4% to 28.9% for recall, and 0% to 40.84% for F1-score.
Significant improvement was achieved by the proposed model over NB on the Eclipse dataset. Results vary from 0.6% to 17.6% for precision, 5.9% to 20.6% for recall, and 4.37% to 13.02% for F1-score. By using the Mozilla dataset, improvements in results over SVM are from 0% to 23.1% for precision, 1.17% to 25.9% for recall, and 1.01% to 24.45% for F1-score. Whereas achievements over NB on the Mozilla dataset are from 0.5% to 29.5% for precision, 0.07% to 24.2% for recall and 1.01% to 20.12% for F1-score.
The AODE reveals significant zero-one loss performance. It significantly reduces computational cost and improves accuracy. AODE sustains the robustness and much of the efficiency of NB and at the same time, achieves higher classification accuracy for many datasets. It has the potential to be a valuable substitute for NB over a considerable range of classification tasks. The AODE outperforms other employed models due to its appealing qualities and effectiveness. With the exception of two explicit assumptions attribute independence and precise frequency-based estimates it is demonstrably the best solution.It is good with small error rate and allows incremental learning, allowing the classifier to be effectively updated as new examples become available with their information. Instead of only predicting one class, it predicts class probabilities, enabling the user to decide how confidently each classification may be done.
This subsection discusses the factors that may influence the results of our approach and the steps we took to minimize their impact.
The bug prioritization in the proposed method is based on the assumption that there is a connection between the bug report features and bug priority. The study was not limited to a small number of features (e.g., summary, long description); it also included categorical and textual features. However, the proposed approach may not perform well if the summary or the long description does not provide sufficient information or is left blank.
The Eclipse and Mozilla datasets are used in this study to evaluate the results of the proposed approach. From the literature review, different researchers used Eclipse and Mozilla datasets for their experiments. We have only considered and analyzed the bug reports related to the projects of Eclipse and Mozilla from the Bugzilla BTS. Other bug tracking systems report the bug differently, which may affect the performance of the proposed model.
Our approach uses the bug report written in English. Therefore, it might not work for the bug reports written in other languages.
The AODE depends on the FS and its output values. If the contents of the bug report are wrong, the prioritization of the bug report is affected. In case of incorrect bug report contents, the right prioritization of bug reports is negatively influenced. However, for Eclipse, the user base comprises mostly developers, therefore it is expected that the bug reports are filled cautiously, prompting fewer errors. But if end-users submit the reports, there are increased chances of wrong bug reports, which leads to a decrease in the performance of the proposed approach.
We observed from the literature that several types of studies on bug report prioritization were reported; however, it is still a challenge for the developers. In this study, we used the AODE classification algorithm as a bug priority classifier to automatically assign priority to the bug report. We focused on improving the results by reducing the error rate of evaluation metrics using the AODE model. Datasets from the GITHUB repository were selected Eclipse and Mozilla. Precision, recall, F1-score, and accuracy were used as evaluation metrics for bug prioritization to compare the result of AODE with those of SVM and NB. The AODE can also be hybridized with ANN, SVM, or any other classification algorithms to improve the accuracy of bug prioritization and to reduce the error rate of evaluation metrics. Data reduction technique can help reduce the size of the data. Then, the DM technique can efficiently utilize the data for prioritization purposes, which helps in saving time and improves the performance in terms of accuracy. Studies on bug prioritization can be extended to include more datasets with different classifiers for better results.
In the future, the meta-heuristic technique can be used to deal with the problem of bug prioritization, when dealing with an imperfect or incomplete set of data. The most severe bug is the blocking bug. If this bug is resolved at the first stage, then the performance in terms of accuracy and effort will improve for the rest of the bugs.
Funding Statement: This work was supported in part by the National Research Foundation of Korea (NRF) grant funded by the Korea government (MSIT) (No. NRF-2020R1A2C1013308).
Conflicts of Interest: The authors declare that they have no conflicts of interest to report regarding the present study.
References
1. J. Kanwaland and O. Maqbool, “Bug prioritization to facilitate bug report triage,” Journal of Computer Science and Technology, vol. 27, no. 2, pp. 397–412, 2012. [Google Scholar]
2. T. -T. Wong and P. -Y. Yeh, “Reliable accuracy estimates from K-fold cross validation,” IEEE Transactions on Knowledge and Data Engineering, vol. 32, no. 8, pp. 1586–1594, 2020. [Google Scholar]
3. J. Kanwal and O. Maqbool, “Managing open bug repositories through bug report prioritization using SVMs,” in Proc. of the 4th Int. Conf. on Open-Source Systems and Technologies, London, pp. 1–7, 2010. [Google Scholar]
4. J. Uddin, R. Ghazali, M. M. Deris, R. Naseem and H. Shah, “A survey on bug prioritization,” Artificial Intelligence Review, vol. 47, no. 2, pp. 145–180, 2017. [Google Scholar]
5. J. Anvik and G. C. Murphy, “Reducing the effort of bug report triage,” ACM Transactions on Software Engineering and Methodology, vol. 20, no. 3, pp. 1–35, 2011. [Google Scholar]
6. H. M. Tran, S. T. Le, S. Nguyen and P. T. Ho, “An analysis of software bug reports using machine learning techniques,” SN Computer Science, vol. 1, no. 4, pp. 1–9, 2020. [Google Scholar]
7. Q. Umer, H. Liu and Y. Sultan, “Emotion based automated priority prediction for bug reports,” IEEE Access, vol. 6, pp. 35743–35752, 2018. [Google Scholar]
8. Y. Zhou, Y. Tong, R. Gu and H. Gall, “Combining text mining and data mining for bug report classification,” in IEEE Int. Conf. on Software Maintenance and Evolution, British Columbia, Canada, pp. 311–320, 2014. [Google Scholar]
9. H. Rocha, M. T. Valente, H. Marques-Neto and G. C. Murphy, “An empirical study on recommendations of similar bugs,” in IEEE Int. Conf. on Software Analysis, Evolution, and Reengineering, Montreal, Canada, pp. 46–56, 2015. [Google Scholar]
10. J. Xuan, H. Jiang, Z. Ren and W. Zou, “Developer prioritization in bug repositories,” in Int. Conf. on Software Engineering, Zurich, Switzerland, pp. 25–35, 2012. [Google Scholar]
11. J. Sapphire Paul, E. Brumancia and S. J. Samuel, “A survey on effective bug prioritizing using instance selection and feature selection techniques,” Indian Journal of Science and Technology, vol. 9, no. 31, pp. 1–8, 2016. [Google Scholar]
12. V. Govindasamy, V. Akila and G. Anjanadevi, “Data reduction for bug triage using effective prediction of reduction order techniques,” in Int. Conf. on Computation of Power, Energy, Information and Communication, Melmaruvathur, India, pp. 85–90, 2016. [Google Scholar]
13. Choudhary, P. Awana and S. Singh, “Neural network basedbug priority prediction model using text classification techniques,” International Journal of Advanced Research in Computer Science, vol. 8, no. 5, pp. 1315–1319, 2017. [Google Scholar]
14. S. Iqbal, R. Naseem, S. Jan, S. Alshmrany, M. Yasar et al., “Determining bug prioritization using feature reduction and clustering with classification,” IEEE Access, vol. 8, pp. 215661–215678, 2009. [Google Scholar]
15. K. Liu, H. B. K. Tan and H. Zhang, “Has this bug been reported?,” in 20th Working Conf. on Reverse Engineering, Germany, pp. 82–91, 2013. [Google Scholar]
16. M. Alenezi and S. Banitaan", “Bug reports prioritization: Which features and classifier to use?,” in Int. Conf. on Machine Learning and Applications, Florida, USA, pp. 112–116, 2013. [Google Scholar]
17. D. Cubranic and G. C. Murphy, “Automatic bug triage using text categorization,” in Int. Conf. on Software Engineering & Knowledge Engineering, Alberta, Canada, pp. 92–97, 2004. [Google Scholar]
18. J. Zhang, X. Wang, D. Hao, B. Xie, L. Zhang et al., “A survey on bug-report analysis,” Science China Information Sciences, vol. 58, no. 2, pp. 1–24, 2015. [Google Scholar]
19. H. Han and X. Jiang, “Overcome support vector machine diagnosis overfitting,” Cancer Informatics, vol. 13, pp. 145–158, 2014. [Google Scholar]
20. L. Wang, S. Wang, X. Li and B. Chi, “Extracting credible dependencies for averaged one-dependence estimator analysis,” Mathematical Problems in Engineering, vol. 2014, pp. 1–11, 2014. [Google Scholar]
Cite This Article
 Copyright © 2023 The Author(s). Published by Tech Science Press.
This work is licensed under a Creative Commons Attribution 4.0 International License , which permits unrestricted use, distribution, and reproduction in any medium, provided the original work is properly cited.
 Downloads
 Citation Tools