
 Submit a Paper
 Propose a Special lssue
 Open Access
ARTICLE

A Deep Learning Model of Traffic Signs in Panoramic Images Detection
1
International University, Ho Chi Minh City, Vietnam-Vietnam National University, Ho Chi Minh City, 700000, Vietnam
2 Department of Computer Science, The Superior University, Lahore, Pakistan
3 Ho Chi Minh City University of Foreign Languages and Information Technology, Ho Chi Minh City, 700000, Vietnam
* Corresponding Author: Thien Khai Tran. Email:
Intelligent Automation & Soft Computing 2023, 37(1), 401-418. https://doi.org/10.32604/iasc.2023.036981
Received 18 October 2022; Accepted 13 January 2023; Issue published 29 April 2023
 View Full Text
 Download PDF
Abstract
To pursue the ideal of a safe high-tech society in a time when traffic accidents are frequent, the traffic signs detection system has become one of the necessary topics in recent years and in the future. The ultimate goal of this research is to identify and classify the types of traffic signs in a panoramic image. To accomplish this goal, the paper proposes a new model for traffic sign detection based on the Convolutional Neural Network for comprehensive traffic sign classification and Mask Region-based Convolutional Neural Networks (R-CNN) implementation for identifying and extracting signs in panoramic images. Data augmentation and normalization of the images are also applied to assist in classifying better even if old traffic signs are degraded, and considerably minimize the rates of discovering the extra boxes. The proposed model is tested on both the testing dataset and the actual images and gets 94.5% of the correct signs recognition rate, the classification rate of those signs discovered was 99.41% and the rate of false signs was only around 0.11.Keywords
Recognizing traffic signals correctly is one of the ways to limit traffic accidents and help drivers be more active when being in traffic. Building applications to identify traffic signals to support drivers always proves a topic of interest. Currently, Global Positioning System (GPS) is widely used and is a popular tool to determine directions, but warnings from traffic signals on the road have not been integrated synchronously. The traffic signs can be identified by traffic lights and traffic signals. Traffic sign detection has become one of the current research topics of interest in the fields of image processing as well as intelligent traffic. Factually, the published papers are all used for a specific country. And for specific traffic signs in Vietnam, they have not been studied while the traffic situation is still at a warning level. In Vietnam, traffic jams as well as traffic accidents due to non-compliance with traffic signals are increasing. Detecting traffic signals to give reminders is a necessary requirement not only for Vietnam. Recently, the development of Convolutional Neural Network (CNN) has suggested solutions for detecting traffic signs [1,2]. Based on the efficiency of CNN and Mask R-CNN [3], this research proposes a new model for detecting traffic signs in panoramic images using a combination of these two models, data augmentation and normalization of the images. On a panoramic image, there will be more than one traffic sign, while the CNN model can only be applied to classify one traffic sign in a close-up image. Furthermore, the CNN model cannot be used to identify the position of signs on a panoramic image. Therefore, we need another method to recognize the image position and combine it with the CNN model to classify each sign. The proposed model utilizes CNN for the traffic sign classification problem. However, because CNN is difficult to execute on a panoramic image, Mask R-CNN has been improved and used to locate and extract signs from the panoramic image dataset. These signs will be transmitted back to the trained network based on CNN to accomplish the goal of detecting traffic signs. Other strategies utilized to increase accuracy in this suggested model include data augmentation in the classification model, normalizing contrast and brightness in the model for identifying and extracting signs and reducing billion currencies to detect redundant boxes.
The ultimate goal of this paper is to build a new deep learning model for detecting traffic signs in panoramic photos. The model aims at simplification but can always handle the position recognition of images in poor illumination conditions or being blurred, and classify well even damaged, distorted, or degraded traffic signs. To build the model effectively, several steps have been performed to identify the problems that need to be addressed in the big problem of detecting interface signs from the panorama. Specifically, all the problems are as follows:
• A panoramic image may have one or more traffic signs or not contain any traffic signs at all, making it challenging to develop a CNN model to detect the traffic signs on the panoramic image. The two problems given by the detection model of traffic signs on panoramic images are effective sign classification and accurate identification of sign position on the panoramic imagery.
• In fact, outside operations, such as weather, maintenance mode, will cause traffic signs to gradually deteriorate in quality or signs may be partially obscured by trees making classification more difficult.
• Images in low light or blurred conditions can make identification more difficult.
• Images with too many markers or other objects will make the detection of bounding boxes noisy.
The paper proposes a deep learning model to solve the challenges posed previously in traffic sign detection. The model applies CNN to classify traffic signs learned from the dataset. Data augmentation used in the classification model helps the model work well on distorted, or damaged signs. The problem of location recognition and extraction of boxes and masks of traffic signs will be solved by implementing the Mask R-CNN model [3]. Since the final model pursues implementation simplification, the Mask R-CNN model will undergo a few changes intentionally made. To increase recognizability and reduce the rate at which excess boxes are found, contrast and brightness normalization will be applied in the image processing. The final model uses the results of signs extracted from Mask R-CNN to accurately classify traffic signs in the CNN model. To solve the two challenges posed in identifying and classifying traffic signs on panoramic images, the study proposes a new model based on CNN to classify traffic signs and the Mask R-CNN model for location recognition and signs extraction. In the classification model, data augmentation will be performed to increase the classification of signs and use Bottleneck Residual Block to help build a deeper model and avoid the vanishing gradient when manipulating many convolution layers. At the same time, Depthwise-Convolution reduces the computational cost by 1900 times compared to using normal convolution.
The following are the contributions of this paper: The paper implements the Mask R-CNN model and trains on the panorama dataset to recognize the location and extract traffic signs. The images used for training should all be contrast and brightness normalized to minimize the detection of redundant boxes. The extracted traffic signs will be converted to the classification model to complete the identification of traffic signs on the panoramic images. This paper builds a basic Graphical User Interface (GUI) in Python to support user operations.
The remainder of the paper will proceed as follows. Section 2 presents literature review. Section 3 shows the traffic sign detection model, and Section 4 gives our experiments and evaluations. Finally, Section 5 is devoted to our conclusion and introduces directions for future research.
Deep learning has brought many brilliant results to computer vision problems in many fields from medical [4,5], to engineering [6]. Traffic signs detection has been a topic of interest to many researchers because of its applicability and development of supportive theories and technologies. In the past five years, research on traffic signal detection has been continuously interesting. Traffic signs detection based on the combination of Histograms of Oriented Gradients (HOG) and Boolean Convolutional Neural Networks (BCNN) was proposed in 2017 in which the doubted regions to be false traffic signs would be detected by the HOG-trained classifier [1]. These regions would be passed to the BCNN to remove the false ones. In the BCNN, the stochastic gradient descent method is also applied to limit the misdetection of true and false regions of traffic signs.
A model of Faster R-CNN in which the object recognition at the highest level being represented without image feature extraction can detect the regions belonging to traffic signs [2]. The method can get the mean average precision value of approximately 0.35. However, this is not the best result but a new approach in the field. In the same year, a multilayer perceptron neural network, which combines color filters, morphological operators and edges detectors, is used to locate the traffic signs [7]. This method bears training and testing with five traffic signs for instructions at a distance of 2 m and diameter of 20 cm. Arifin et al. proposed a Traffic Sign Detection (TSD) system using Speeded-Up Robust Features to extract traffic sign features and Support Vector Machine to classify and recognize the traffic signs [8]. The system displays the meaning of signs in two languages, Indonesian and English. Also based on the method of feature extraction, another TSD system extracts crossing points, termination points and bifurcation points from an Adaptive Neuro Fuzzy Inference System [9]. The system sets the color threshold when detecting the signs. The results obtained from the system prove good performance with the changes on lights of the traffic signs.
Besides, there exist many other nominate solutions for TSD such as applying the Single Shot Detection algorithm in the VGG-16 model [10], analyzing semantically on objects [11], building a structure of detection, refinement and classification [12], deploying a single CNN architecture [13], combining a detector and semantics segmentation to address traffic signs [14], applying models of You only look once (YOLO) [15,16] or YOLO4 [17] and improved Mask R-CNN model. The traffic signs detection can also be researched in other ways using deep learning [18–24].
However, the identification and classification of traffic signs on panoramic images remains a big challenge, which is the problem that this paper means to solve.
3 Traffic Sign Detection Model
The model of detecting traffic signs on panoramas will be implemented following the steps in Fig. 1. Fig. 1 depicts the full procedures for developing a model to detect and classify traffic signs in four sections:
• Section 1 will go through the process of investigating, selecting, and evaluating datasets, called “Dataset”.
• Section 2 will go through the steps involved in creating a CNN-based traffic sign classification model in great depth. This procedure is described in full below:
– Investigate and implement data augmentation
– Create a traffic sign categorization model
• Test the model: If the model does not produce the expected outcomes, the model-building procedure will be analyzed and retested until the best results are obtained.
• Section 3 would be through the process of creating a location identification model and extracting traffic signs from a panoramic image in great detail. This procedure is discussed in full as follows:
ο Studying the traditional Mask R-CNN model. o Grouping traffic signs with similar properties.
ο Normalizing the picture and modifying the Mask R-CNN model as needed before running the model on the test set. If the method fails to generate satisfactory results, the model tuning procedure is reviewed and retested until the best possible results come out.
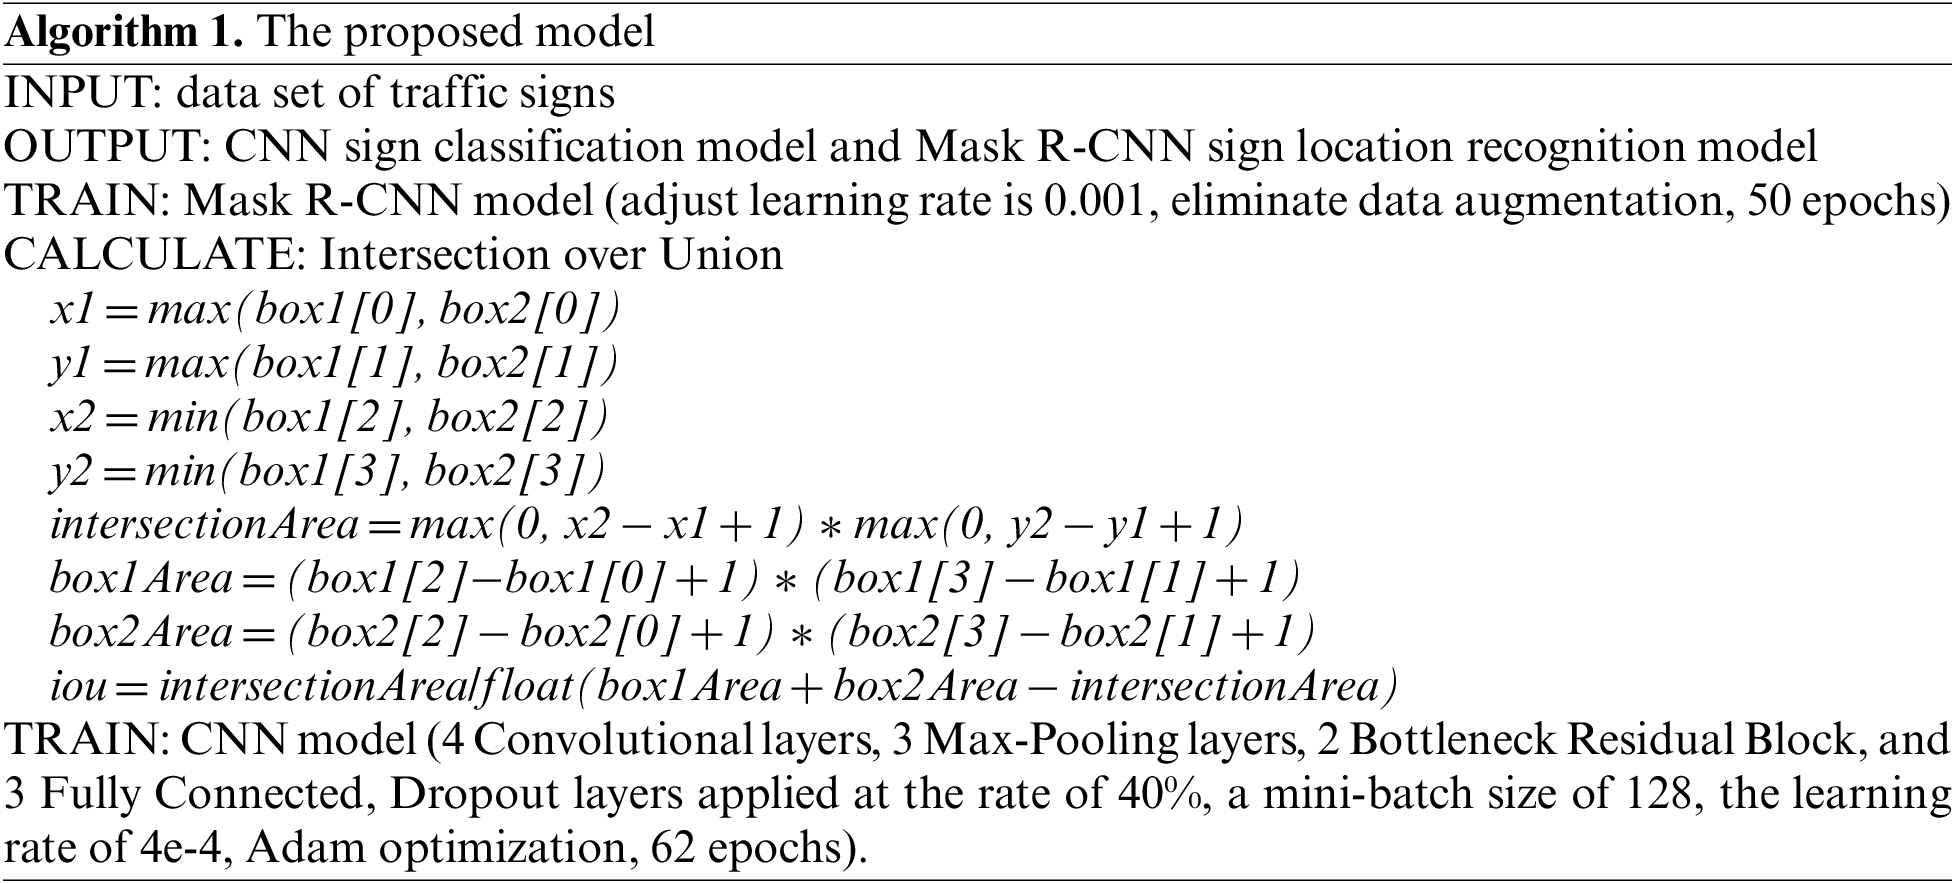
• Section 4: To tackle the problem of traffic sign detection, the results of the signs retrieved from the location recognition model will be fed into the classification model and integrated into a full model. Finally, a GUI will be built to support some basic user operations. The algorithm of the proposed model is shown in Algorithm 1.
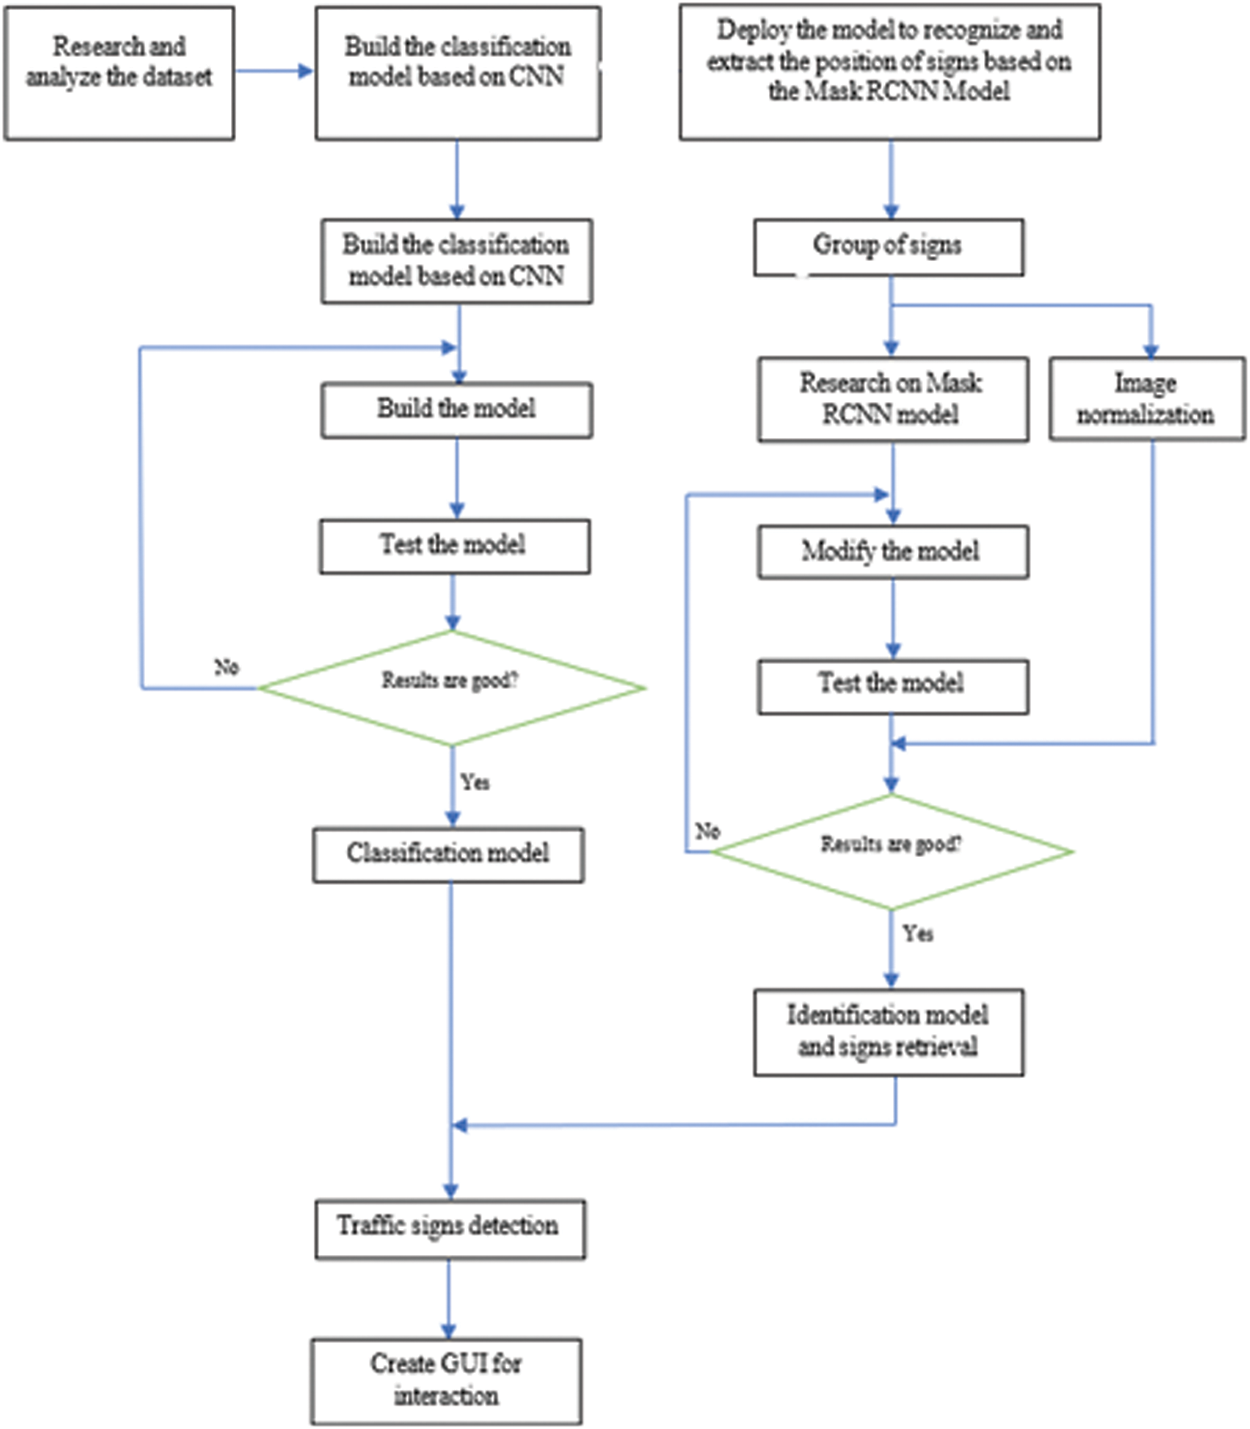
Figure 1: Steps to build a classification model and identify traffic signs
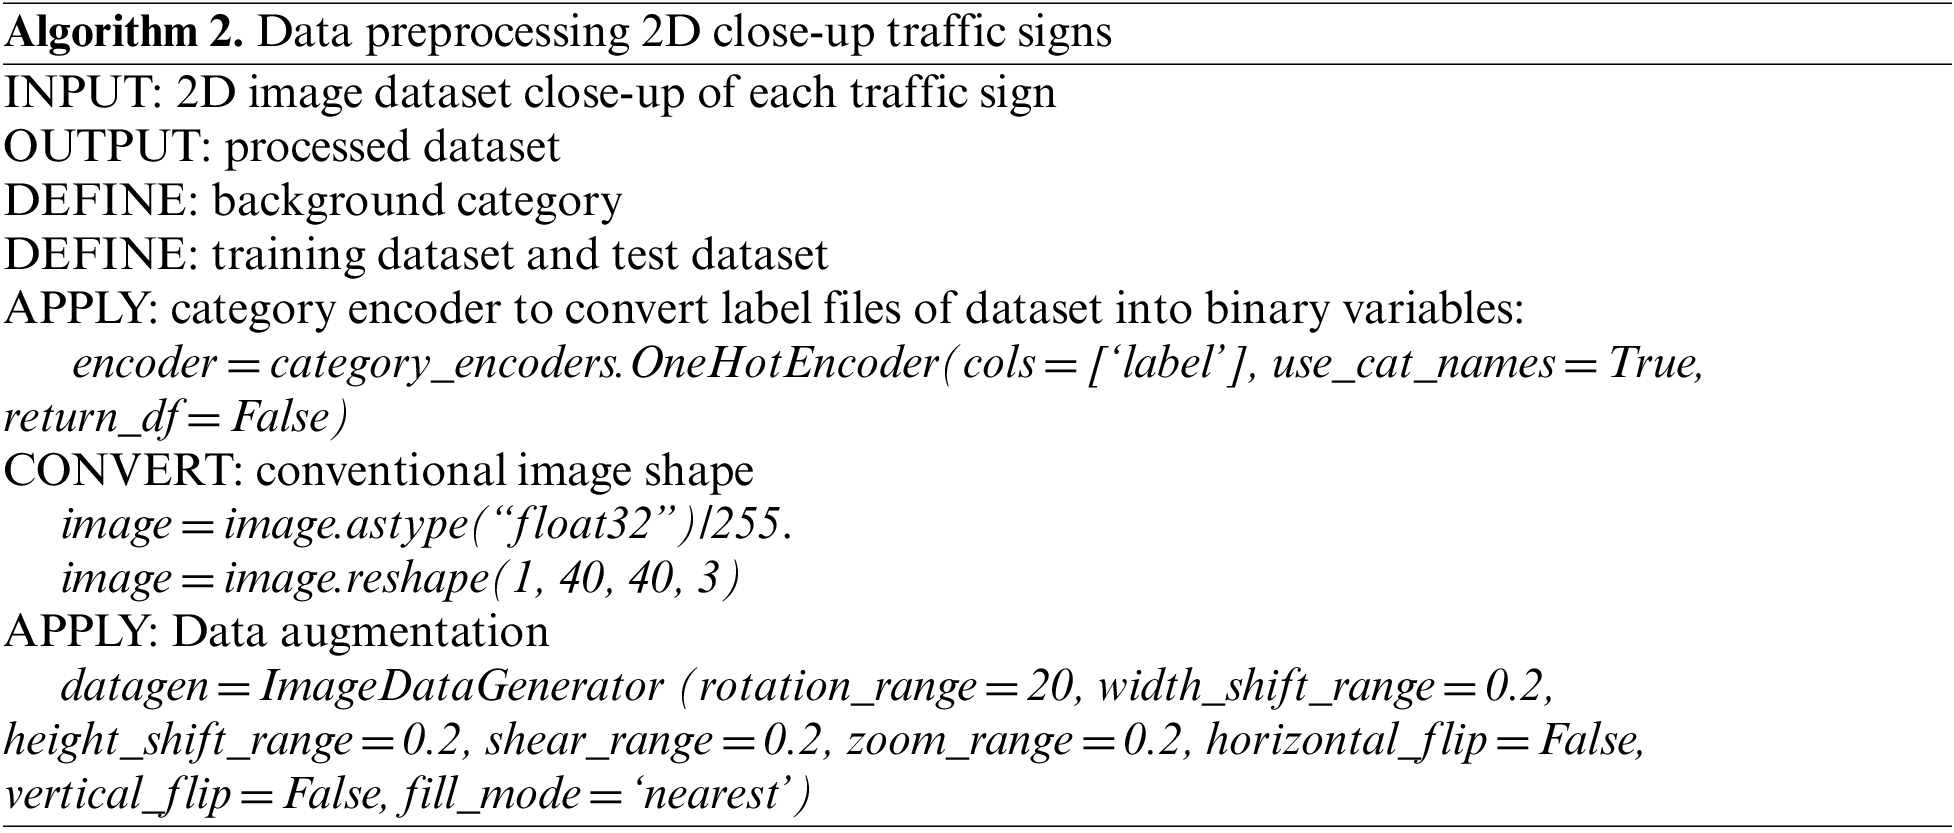
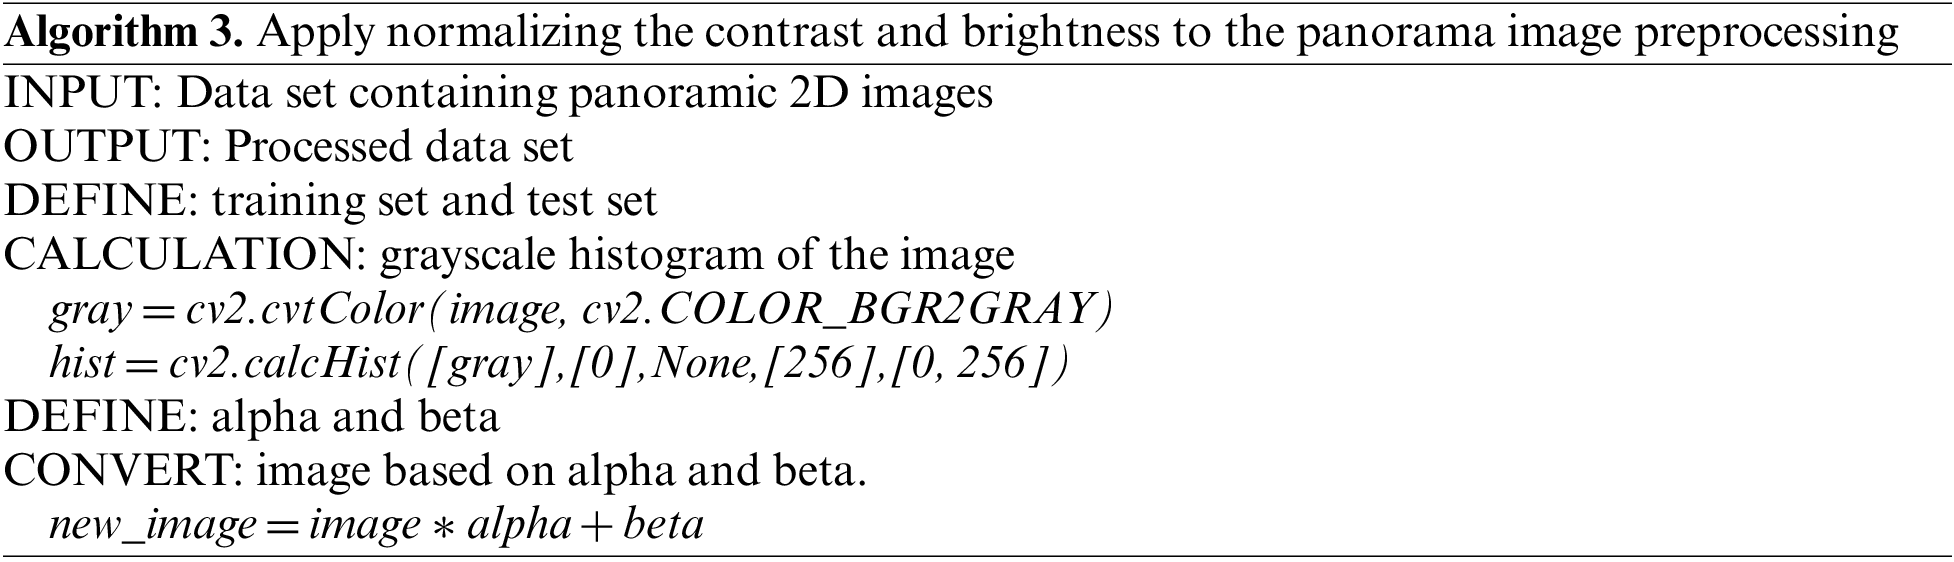
In this model, the data preprocessing consists of two steps: data preprocessing 2D close-up traffic signs and applying Normalizing the contrast and brightness to the panorama image preprocessing which are shown in Algorithm 2 and Algorithm 3, respectively.
After much research on various datasets, two datasets German Traffic Sign Recognition Benchmark [25] and German Traffic Sign Detection Benchmark [26] were chosen because of the diversity of images and the number of images that meet the paper requirements.
German Traffic Sign Recognition Benchmark (GTSRB) [25]. The first dataset utilized in this work is the German Traffic Sign Recognition Benchmark (GTSRB). Researched from the article “The German Traffic Sign Recognition Benchmark: A multi-class classification competition” by Stallkamp et al., this dataset contains around 52000 images for street sign classification. The images range in size from 15 × 15 to 250 × 250 pixels and include 43 distinct signs which might be classified as prohibition signs, mandatory signs, warning signs, and other sorts of signs. The collection also includes .CSV files that detail filenames, image sizes, sign bounding boxes, and class ids. Pre-separation of the data set into training and testing parts was done at a rate of 75% to 25%.
German Traffic Sign Detection Benchmark (GTSDB) [26]. The second dataset is the German Traffic Sign Detection Benchmark (GTSDB). The dataset containing the panorama should be selected as best possible compared to the dataset used for the classification model. Since the two datasets GTSRB and GTSDB have the same distribution, we selected the GTSDB dataset to get the best fit with the GTSRB dataset. The GTSDB dataset includes 1360 × 800 panoramic images. The dataset includes a .CSV file with each row representing a single traffic sign as the file it came from, the coordinates of the bounding box, and the class id for the sign. The panoramic pictures, which vary in clarity and contrast, might include one, many, or no signals at all. Traffic sign distances within the image are not fixed either. The training set consists of the first 600 photographs, while the test set consists of the final 300 images.
3.2 Classification Model Based on Convolutional Neural Network
The CNN model is applied to classify 43 types of traffic signs from the GTSRB dataset. The model deploys a training set and a test set of 43 types of traffic signs and 3000 image segments from the panorama dataset divided by 70% for training and 30% for testing for background recognition. In this case, to avoid the background selected from the panorama image accidentally overlapping the image of the traffic sign, it is necessary to make sure that the randomly cropped training images do not overlap any sign bounding boxes. Data augmentation will be used in image processing used to improve the ability to classify signs in both distorted and obscured conditions. The CNN model is built after many experiences on many different configurations, with four Convolutional layers, three Max-Pooling layers, two Bottleneck Residual Block, and three Fully Connected, Dropout layers applied at the rate of 40%. The final model was trained after 62 epochs with a mini-batch size of 128, the learning rate of 4e-4 was compiled using Adam optimization [27]. Data augmentation. The data provided from the GTSRB dataset is extremely diverse with clear images, images with poor lighting conditions, blurred images but still not giving the best classification results for traffic signs in many different conditions such as deviated, ink smeared, and the images do not show the entire sign. Data augmentation is one way to solve this situation, by artificially enhancing the dataset. The trained images will be rotated, shifted in width and height, cropped, and zoomed randomly. The model, however, does not apply horizontal and vertical image flip since it would influence the features of many other sorts of signs, such as left, right, and straight signs. This method has helped a lot with improving the accuracy and better classifying the images imported from the user.

Note that the above procedure amounts to drawing (x, y) from the joint density f(x, y) using a two variable Gibbs sampler and ignoring the y coordinate. To demonstrate the necessity of dataset enhancement, several predictions are shown before and after applying data enhancement. When not applying data augmentation, the prediction model has many errors even in the images of traffic signs that are clear but distorted or hidden at a certain angle. Convolutional Neural Network model. The Convolutional Neural Network holds one of the primary models of Deep Learning–a collection of algorithms for creating a highly abstracted data model by utilizing numerous layers of complicated structural processing. The diagram below depicts in detail the traffic sign classification model architecture that we built using four Convolutional layers, three Max Pooling layers, two Bottleneck Residual Block layers, and three Fully Connected layers.
The Convolutional Neural Network Layer. This part introduces Convolutional layer, Pooling layer and fully connected layer which are applied in the model.
The Convolutional Layer. The Convolutional Layer is regarded as the most critical layer since it will represent the CNN and do all of the calculations. The model goes through four convolutional layers to scan each feature of the image by assigning a filter map to each part of the image and executing computations on each resultant feature map. After much deliberation, a filter with a kernel size of (3 × 3) is used for all the convolutional layers, the channels will be automatically aligned to match the input image. The image is gradually scaled down after each pass through the convolutional layer, and it can be observed that pixels in the center of the image are learned several times more than pixels on the edge of the image. When some traffic signs were near the edge of the image, the model could miss important information after each scan, and if it wanted to learn them many times, it would take a long time to go through many convolutional layers, which can lead to higher computational costs and slower learning, but may not yield the best results. To prevent the model from missing important information at the edges of the input image, padding = ‘same’ will be used to insert the appropriate amount of additional border to cover all the corners and edges of the input image to ensure that all the information on the edge of the input image won’t be missed. Because practically every convolutional layer in this study has a kernel size of (3 × 3), the number of extra boundaries added will be 1. Padding formula is shown in (1).
The convolutional layer in forward propagation is in (2):
Input:
weight:
filter size:
Activation function:
The convolutional layer in backward propagation is in (3):
Error function: E
Input size: N
The Pooling Layer. Two components of the CNN model require attention: invariance (Location Invariance) and coherence (Compositionality). If the same object is projected in different degrees (translation, rotation, scaling), the accuracy of the algorithm will be significantly affected. The pooling layer will provide invariance to translation, rotation, and scaling. Local associativity gives us lower-to-higher and more abstract levels of information representation through convolution from filters. Furthermore, because of padding = ‘same’, the model keeps the same input image size across each convolutional layer, too large input will make it impossible for the model to achieve its aim of decreasing parameter gliding. Therefore, the Pooling layer is inserted between the convolutional layers to reduce the data size but still retain the important properties. The reduced data size reduces the computation in the model.
Two common types of pooling layers are max pooling and average pooling. Max Pooling is used to get the largest element from the object matrix with the filter size of (2, 2) and stride of 2.
The Fully Connected layer. Finally, the Fully Connected layers are used to convert the feature matrix in the previous layer into a vector, the output of the last Fully Connected layer contains the probabilities of 44 objects that need to be predicted. The highest probability will be the result of the classification of the input image.
Rectified Linear Unit (ReLU) activation function. The ReLU activation function compares and outputs the maximum value of the input and 0. Because of its simplicity, ReLU makes the calculation much faster instead of using exp as of the two sigmoid and tanh functions. The formula of ReLU activation function accordingly is in (4).
Dropout. Dropout is a strategy that eliminates units at random after each iteration at a fixed rate p, allowing the model to deal with smaller neural networks and reduce overfitting when training the model [28]. The dropout approach is used at 40% in the suggested model, which implies that during each iteration, 40% of the units are randomly deleted and 60% of the units preserved. Bottleneck Residual Block. A Bottleneck Residual Block, a residual block type, uses 1 × 1 convolutions to generate a bottleneck [29]. The usage of a bottleneck minimizes the number of parameters and matrices that must be multiplied in order to make residual blocks as thin as possible to maximize depth while having fewer parameters. Bottleneck residual block allows the neural network to learn richer and more complex functions, while also keeping the amount of memory that is the size of the activation function needs to pass from.
Using the depthwise-separable convolution in the bottleneck residual block greatly reduces the computational overhead compared to normal convolution as in (5)
Normal Convolution: The computational cost = 256*3*3*5*5*128 = 1666252800
Depthwise Separable Convolution: The computational cost = (3*3*5*5*256) + (256*5*5*128) = 876800
We get:
It can be seen that the use of depthwise-separable convolution has reduced the computational cost by 1900 times compared to using normal convolution.
Adaptive Moment Estimation Optimizer (Adam). As an algorithm, Adam optimizer combines Root Mean Square (RMS) prop and momentum approaches. For the parameters, the technique employs two internal states of the gradient: momentum (m) and squared momentum (v). The values of m and v are updated using exponential weighted averaging after each training batch. The decryption codes for updating m and v are in (7) and (8), respectively.
in which, beta is considered as a hyperparameter. The theta update formula is in (9).
where alpha is the learning rate, epsilon is the value-added to prevent division by 0.
Based on He et al. [3], in pixel-level image segmentation, Mask R-CNN is an extended variant of Faster R-CNN. The Mask R-CNN model separates the two problems of classification and prediction at the pixel level, making the implementation simpler and completing the challenge posed in recognizing the location and extracting the signs as outlined. In addition, the Mask R-CNN model has improved in enhancing the RoI Pooling layer so that RoI can be more accurately mapped to parts of the original image, adding the RoI Alignment method to find deviations between RoI and extracted features, which is induced in RoI pooling, eliminating hash quantization so that the extracted features can precisely align with the input pixels. Fig. 2 summarizes how the Mask R-CNN model works [30], first, using CNN to extract features from the input image, in this study the signs are extracted according to the general characteristics of the image (shape and color). These calculations will then be passed through a Region Proposal Network (RPN) which will then return bounding boxes at regions that may have objects of different sizes. Then add the RoI Pooling layer with the aim of aggregating all bounding boxes on the same object with different sizes to the same size, and use the RoI Alignment method to find deviations between RoI and extracted features. Finally, use a fully connected layer to classify the common properties and output bounding box for each sign.
• Experimental environment. The Python 3.8 and Pytorch framework are selected as the installation environment. The paper uses Ubuntu 16.04 LTS, Intel Core i7-4790 K, 32 GB of RAM & GeForce GTX 1080.
• Training. Some preparation must be done before training the dataset on the modified Mask R-CNN model to ensure error-free training.
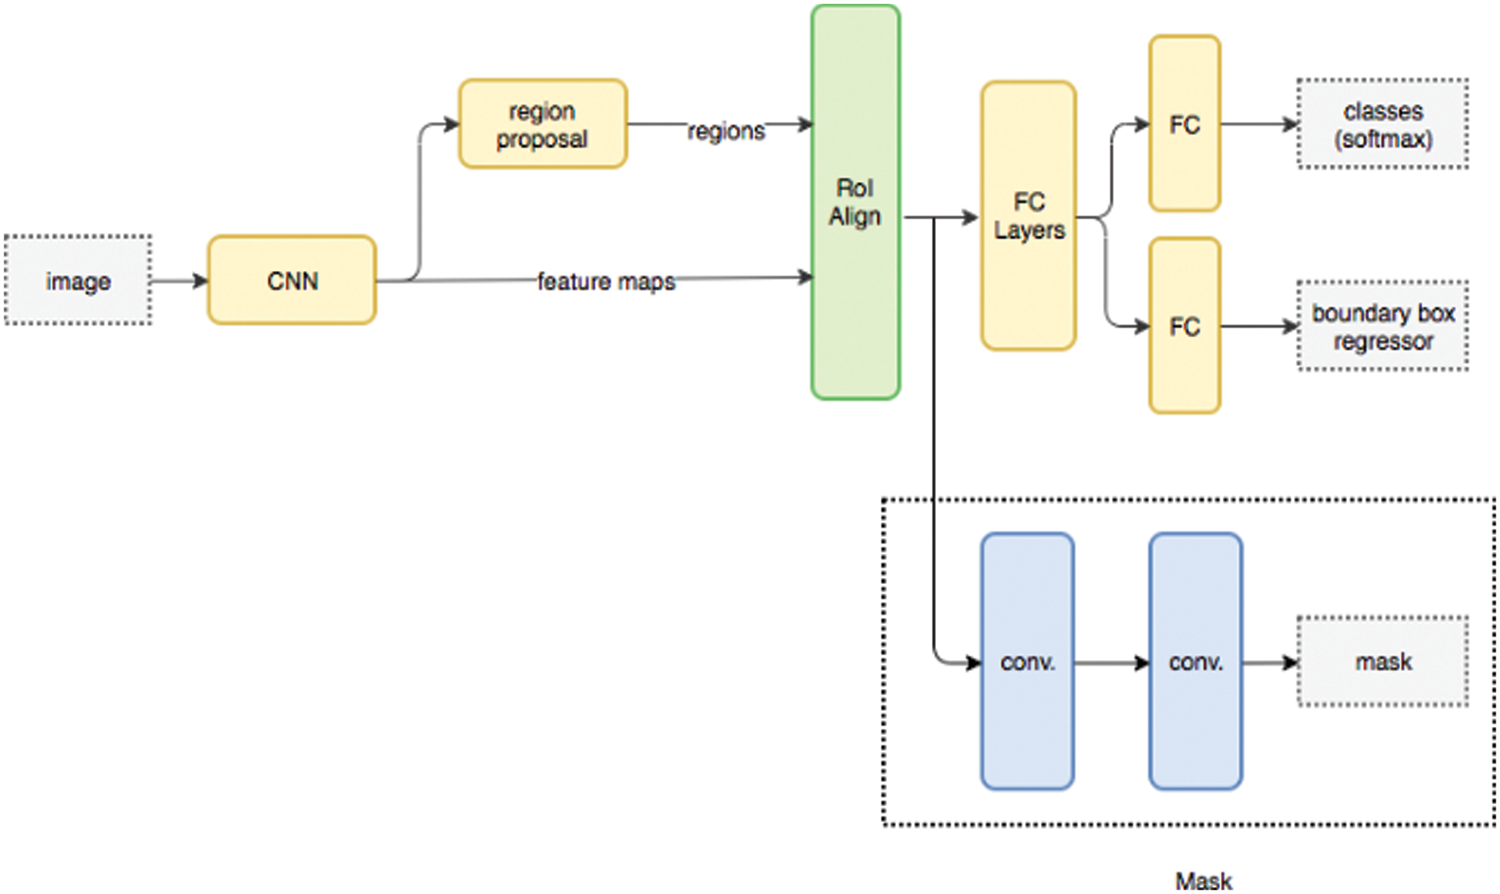
Figure 2: The architecture of Mask R-CNN architecture
Here comes a detailed description of the preparatory activities:
• Division of datasets and retrieval of information: The GTSDB panoramic picture dataset, which contains 900 photos in total, will be separated into 600 images for training and 300 images for testing. All images used are contrast and brightness normalized.
• Retrieving information and masks for images: The model will read information from the annotation files provided by the author of the dataset, including the filename and position of the bounding boxes. Create an array mask for each bounding box received in each image. The panoramic images in the GTSDB dataset may have one or more traffic signs, or they may not contain any at all. As a result, the collection of masks of each image is unique, but they all have the identical array form of [height, width, number of bounding boxes].
• To further correct the mismatches of the Mask R-CNN model, the minimum confidence in sign recognition was set to 0.1 to extract masks.
• Conduct model training on the public parameters set of pre-trained COCO weights to obtain the best fit mask after 50 epochs.
Prediction. The traffic sign localization model generates outputs such as bounding boxes, masks, scores, and class ids. The algorithm then creates bounding boxes on the identified images based on the provided information and saves all of the final predicted results for further evaluation. The final model obtained on the test set is approximately 94.5% of the correct traffic sign identification rate (341 correct boxes were detected out of 361 boxes), the rate of false signs was about 0.11, where background images are confused because they have the same form or color as learned signs such as ivory roof tiles with the shape of an upturned triangle. In addition, some signs that are not included in the data set are also recognized because they have a common feature of circular signs, namely, no stopping sign, stop and parking sign, and holder sign.
3.4 Graphical User Interface (GUI)
After completing the model to detect 43 types of traffic signs on panoramic images, a basic Graphical User Interface (GUI) screen was built in python to support convenient use for users. However, this is just a basic interface, the images` are selected arbitrarily from the user, the screen supports the display of images before and after image recognition, and automatically saves images having just been detected. After uploading the image, the original image will be displayed on the screen. The buttons Next Image, Previous Image, which allow you to flip back and forth between the previous and next image, appear only when the number of photographs imported from the user exceeds one.
The effectiveness of the proposed method is demonstrated in the results that the classification model performed quite well with the results of 99.3% and the detection gets 94.5% at the accuracy. Compared to related methods, this is improved at each stage of classification and detection to achieve overall efficiency, and the method has also been shown to be effective and applied to detect the traffic signs in Vietnam.
The research proposes a new deep learning model to detect traffic signs on panoramic images, applying a Convolutional Neural Network to classify signs and Mask R-CNN to recognize locations and extract signs. The classification model produced results with a 99.3% accuracy, a 0.03 loss on the training set, a 97.4% accuracy, and a 0.15 loss on the test set. The proposed model achieved almost 94.5% of the proper traffic sign detection rate (341 correct boxes were detected out of 361 boxes). The classification rate of signs discovered can reach up to 99.41%. The rate of false signs was around 0.11, with background pictures being misinterpreted because they are similar in shape and color to the learned signs. Furthermore, some signs are not included in the identified data set because they have the same characteristics as the signs learned from the training set such as no parking signs, stop and parking signs, and holder signs are predicted as circular signs. This is considered a promising harbinger for future data set expansion.
The confusion matrix for traffic sign detection in the test dataset is shown in Table 1.
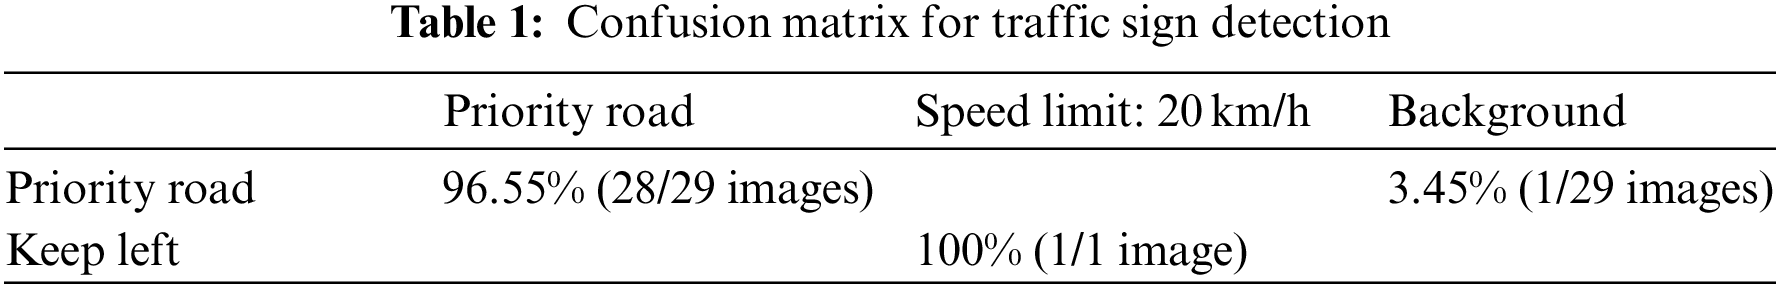
Fig. 3 shows the predicted images from reality. It can be seen that the model has predicted quite well on the images in the test dataset and the real images.
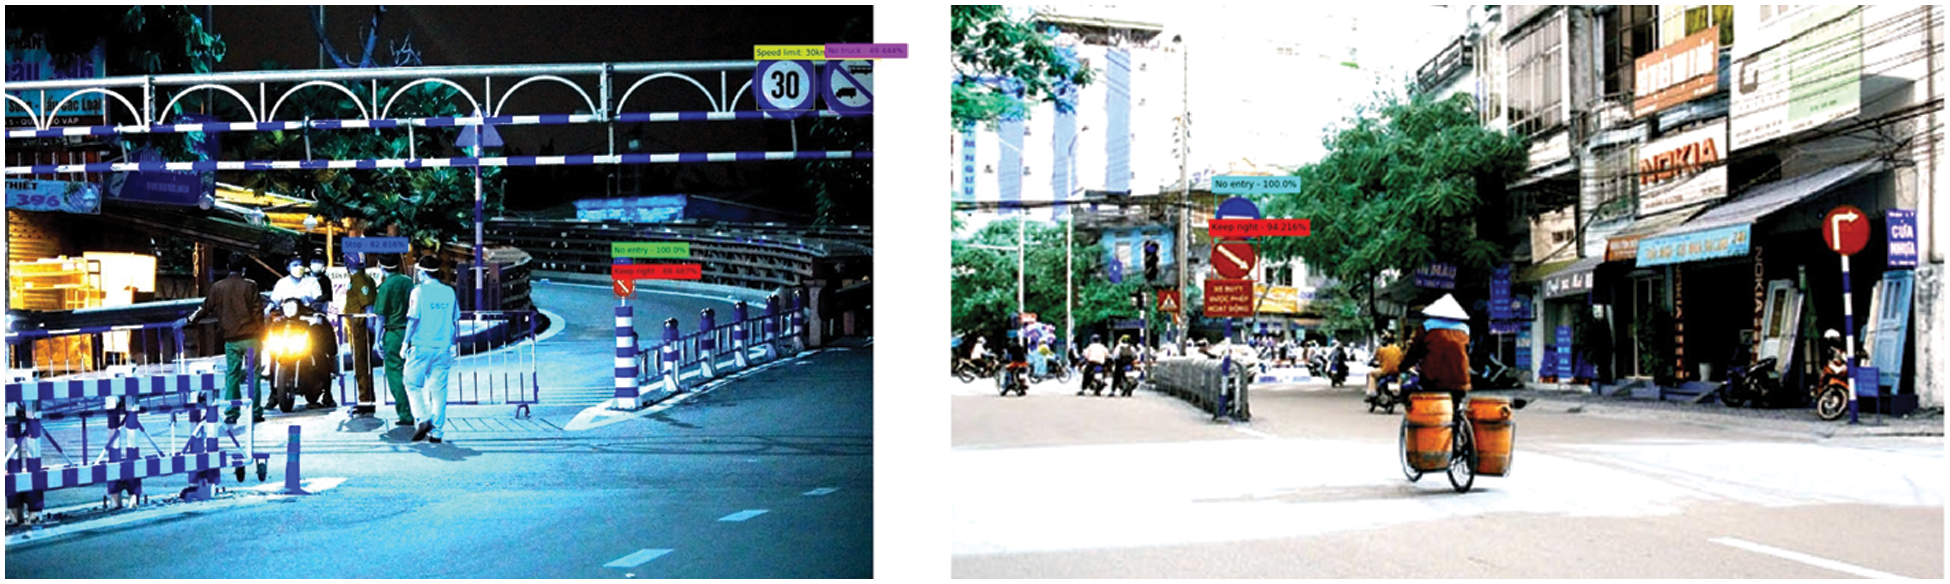
Figure 3: Predicted image from reality
Result of CNN classification model. The classification model produces results with a 99.3% accuracy, a 0.03 loss on the training set, a 97.4% accuracy, and a 0.15 loss on the test set. Using data augmentation has helped the model work better in classifying traffic signs that are blurred, obscured, distorted, degraded. The fraction of wrongly predicted photos was roughly 2.9. Fig. 4 shows the model performance per number of the epochs and Fig. 5 demonstrates the validation set confusion matrix.
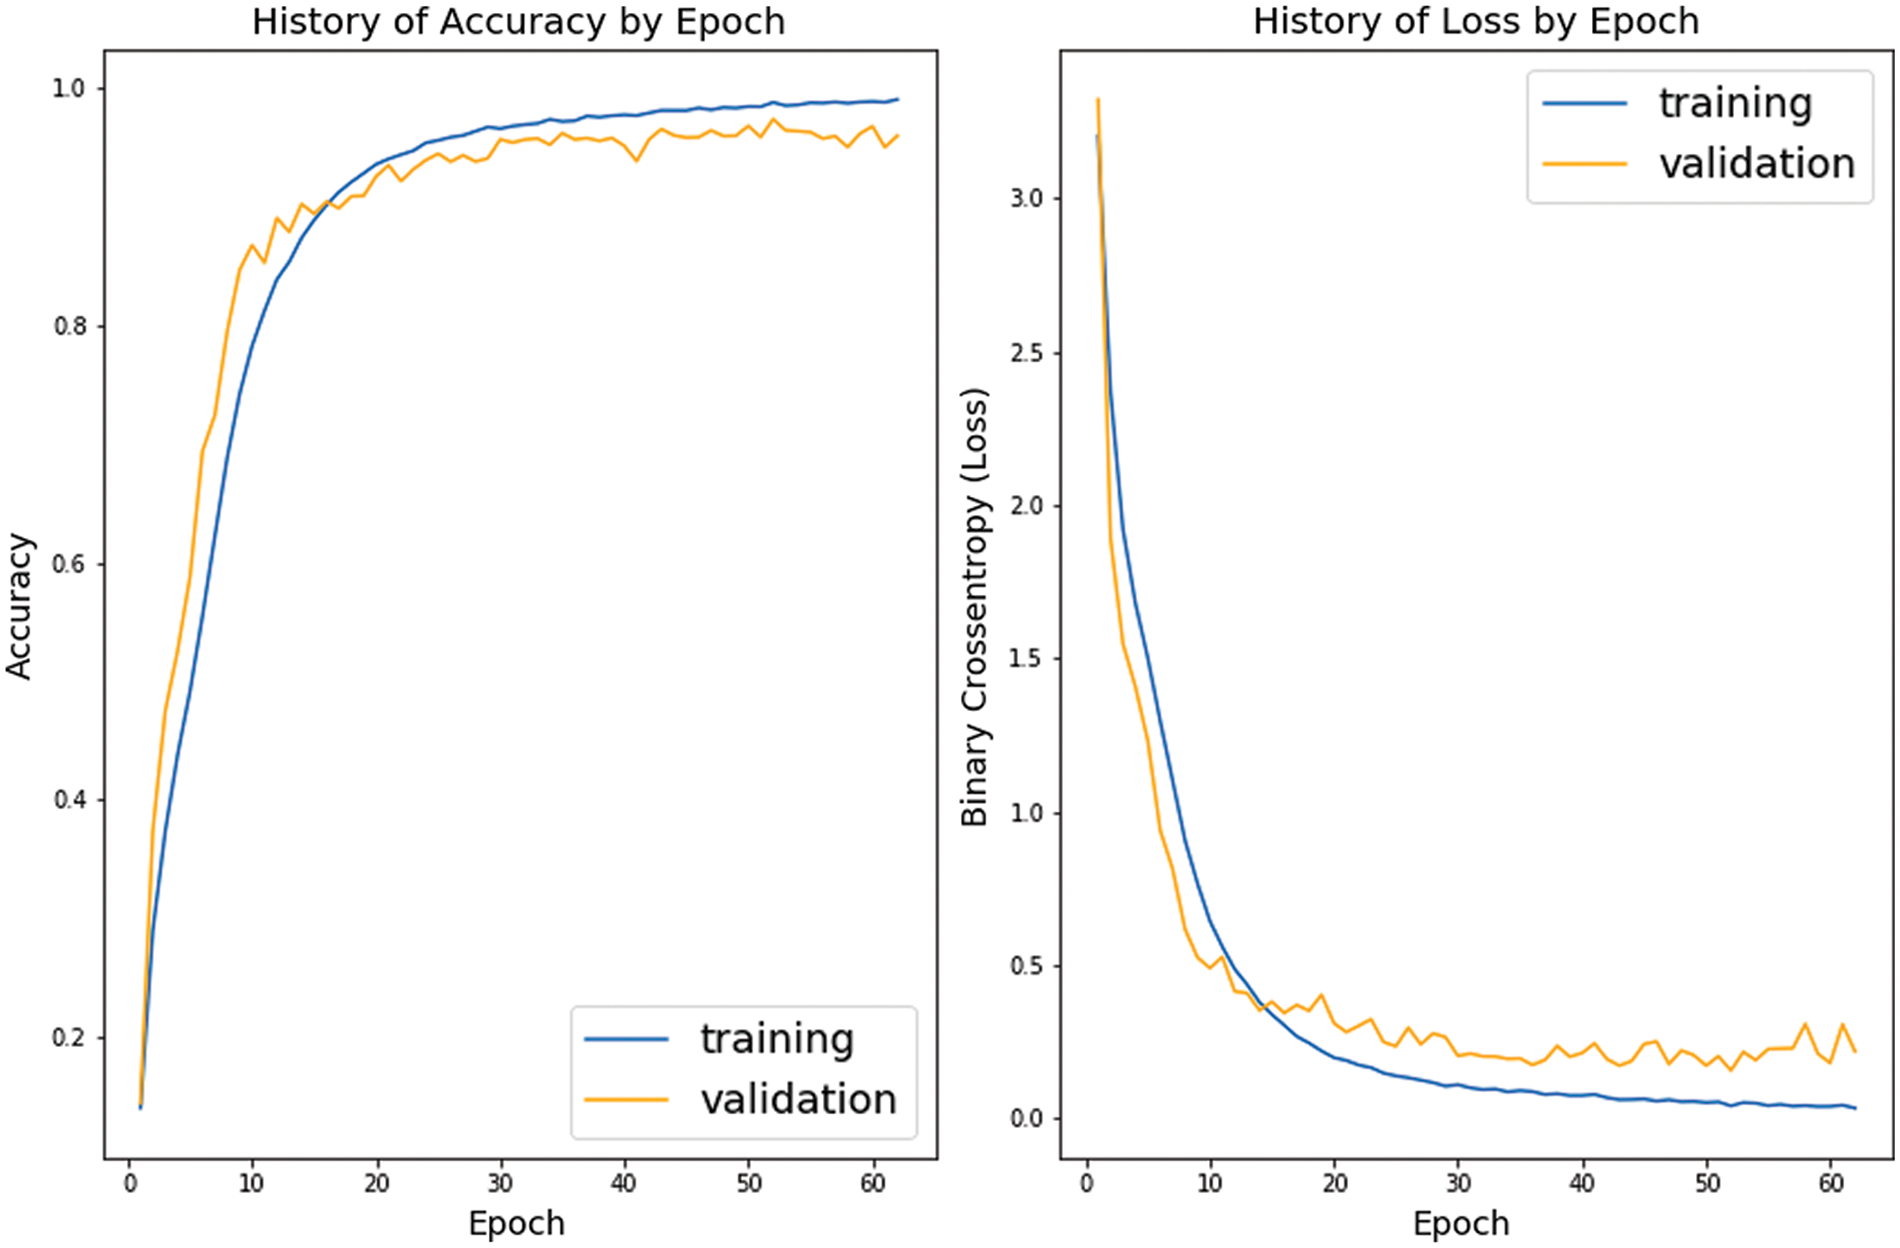
Figure 4: Model performance over 62 epochs
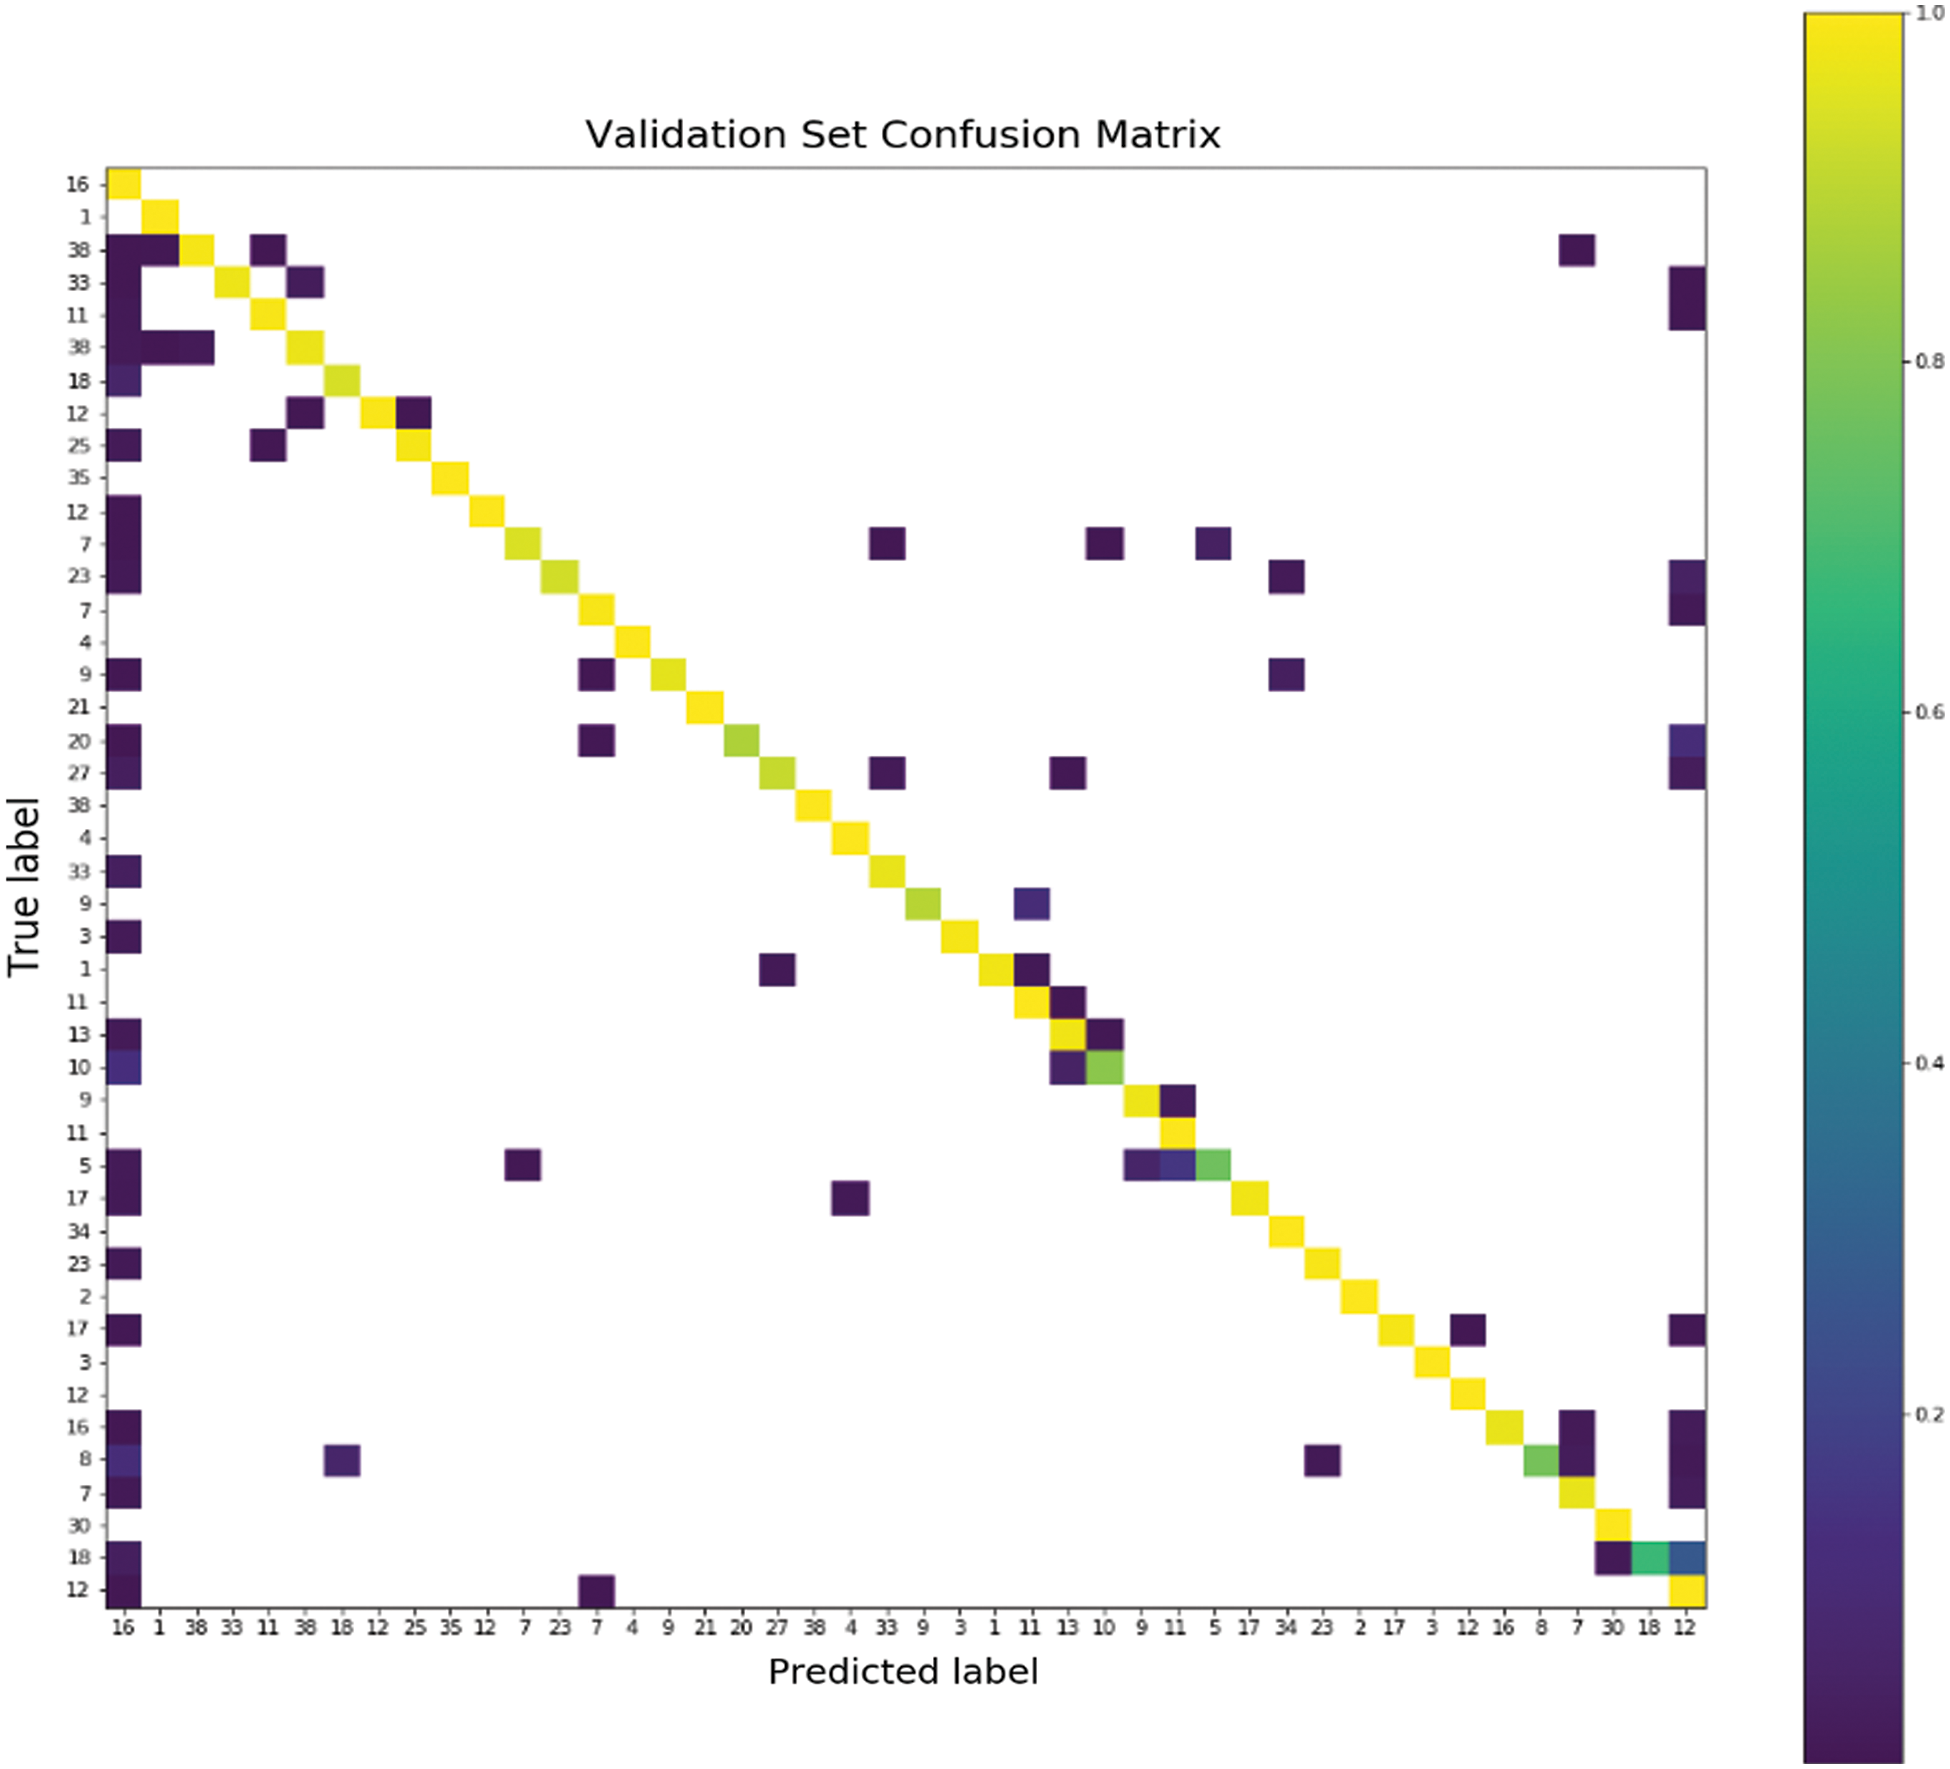
Figure 5: Validation set confusion matrix showing the rating of signs predicted by the proposed model and actual signs
In Fig. 4, the figure on the left shows the accuracy performance per number of epochs. The figure on the right shows the loss performance per number of epochs.
Because the model was trained on the German traffic sign dataset, we also collected a few photos with features comparable to the learned dataset, such as prohibition signs, speed limit signs, and so on by traffic signs in Vietnam. The reported results show that the model performs well on both the test set and actual photos from mobile devices. A model promise of expanding the dataset so that the model can work well on traffic signs in Asian countries like Vietnam.
Result of Mask R-CNN model. The final training model on Mask R-CNN obtained on the test set is approximately 94.5% of the correct traffic sign identification rate (341 correct boxes were detected out of 361 boxes). The false recognition rate is also low, with only 0.11 erroneous sign recognitions per total detected box. Furthermore, when employing all types of signs, normalizing the contrast and brightness of the images aids in sign identification slightly and considerably minimizes the chances of discovering the extra box. By improving the brightness of the photo, boxes containing images from lighting, wires, and roofs can all be improved. The results show that without applying image normalization, the proportion of excess boxes detected on the image ranges from 1 to 3 boxes for an image which greatly affects the results and the target model. When applying contrast and brightness normalization to the image from the idea of our method, the number of misrecognized extra boxes was halved compared to the pre-normalized image. Therefore, the rate of extra boxes detected has improved from approximately 0.5 to 1.3 boxes per image. From the reported results, it can be seen that the location recognition and the extraction of signs using the Mask R-CNN model are performed fairly well even though the results are only at 94.5%. Furthermore, the results obtained from traffic signs that are not included in the training dataset, such as No Parking sign, No Parking and Stopping sign, Holder sign, are identified as circular signs because they have the same shape and are also considered a pretty good starting point in the future dataset expansion.
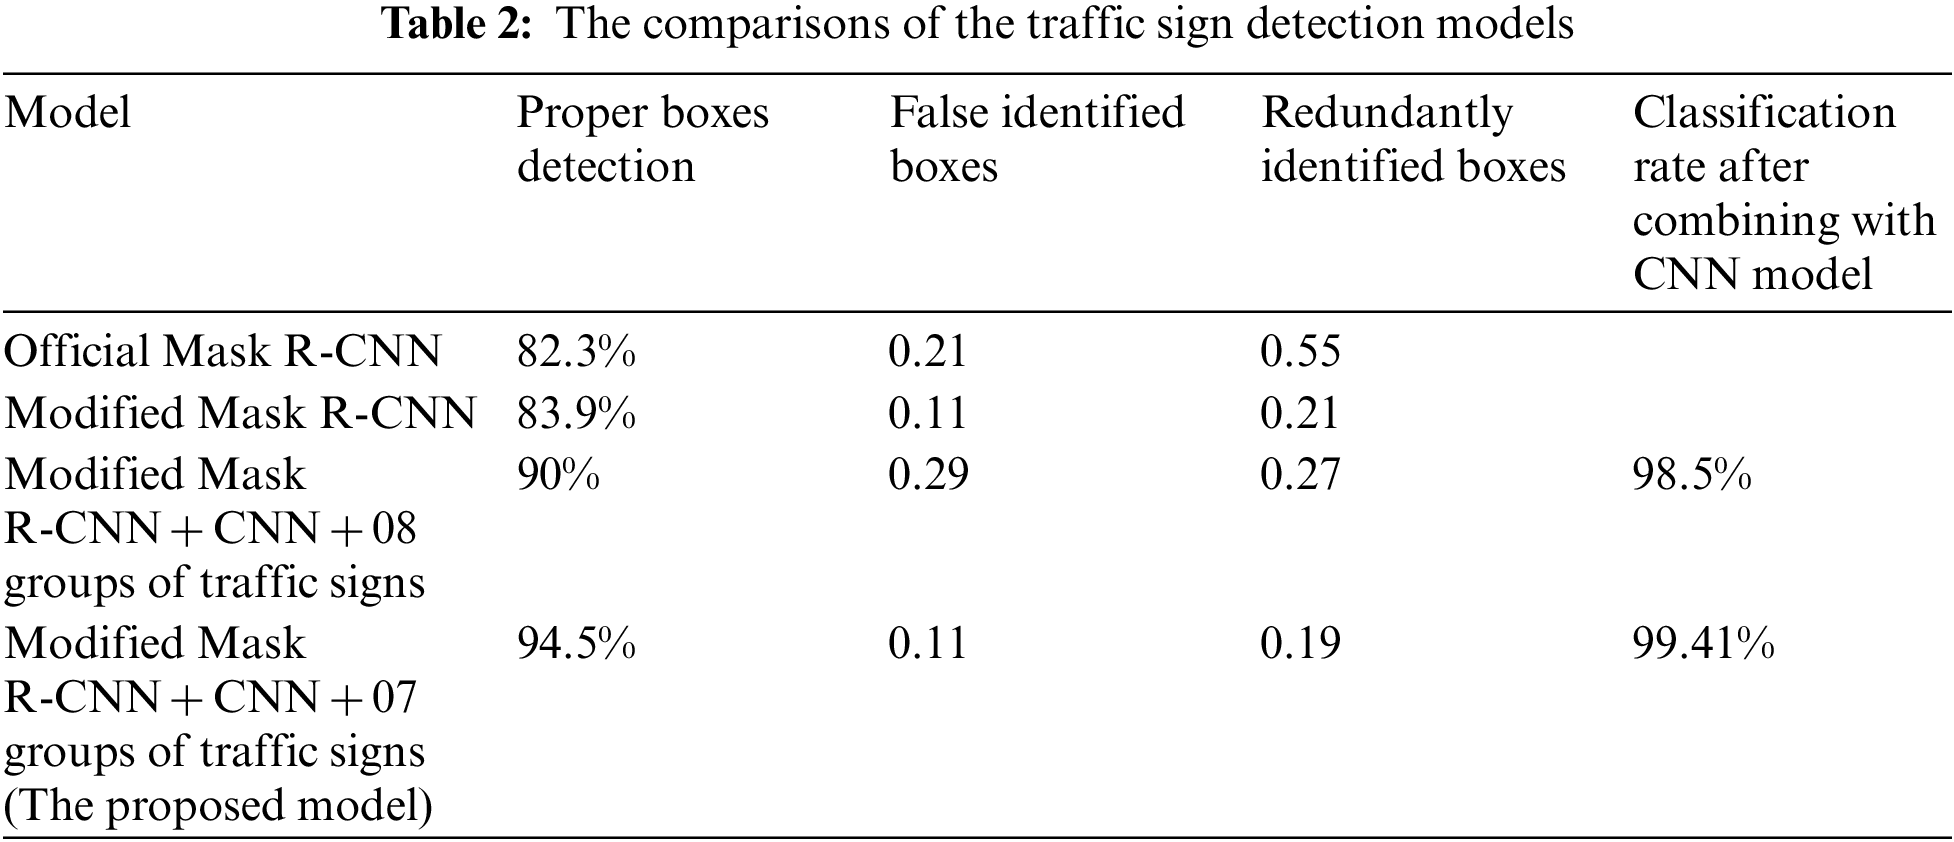
Comparison. The proposed model pursues simplification when deploying and training the model, based on the existing Mask R-CNN model, scale the input image size default, remove the automatic enhancement of the data, tweak the learning rate to 0.01 and manually deploy the bounding box when training instead of using the bounding box information given from the dataset helped the model train better on the mini-batch size, improves the convergence speed and helps in future dataset expansion. The model used the Intersection over Union (IoU) [29] to compute the intersection on the union of two discovered bounding boxes from the Mask R-CNN, with the primary goal of quantifying overlap and screening for non-standard bounding helped to eliminate most of the overlapping bounding boxes. The final result obtained from the modified model is approximately 94.5% of the correct signal identification rate, the amount of false boxes in an image range from approximately 0.5 to approximately 1.3 extra masks per image, and when combined with the CNN classification model, the return result is 0.11 extra boxes not seen as background per image. The comparisons of the traffic sign detection model through many studies with the orthodox Mask R-CNN model are detailed in the comparison Table 2.
Evaluation. From the results obtained from the traffic sign recognition model based on CNN and Mask R-CNN, a few honest assessments are made. The model is built based on two main purposes, which are to classify 43 types of traffic signs based on the CNN classification model and to recognize and extract signs based on the Mask R-CNN model.
In the CNN classification model:
• Data augmentation will be performed to increase the classification of signs. The model performed well on damaged, distorted, or partially defective traffic signs.
• Using Bottleneck Residual Block to help build a deeper model and avoid the vanishing gradient when manipulating many convolution layers. At the same time, Depthwise-Convolution reduces the computational cost by 1900 times compared to using normal convolution.
The classification model can be seen performing quite well with the results of 99.3% accuracy, a 0.03 loss on the training set, a 97.4% accuracy, and a 0.15 loss on the test set.
In Mask R-CNN model:
• Contrast and brightness normalization have improved image quality in low light and medium to high vehicle speeds. As a result, the model slightly improved the ability to recognize signs and significantly reduced the detection rate of redundant boxes.
• The proposed model has been improved in pursuit of simplification, speeding up convergence, and minimizing data explosion.
The foregoing efforts yielded a final result of roughly 94.5% correct traffic sign identification rate and 0.11 erroneous sign recognitions per total detected box. While this is not a flawless result, it is a significant improvement. The model performed well at accurately detecting traffic signs problems, and it still detected a few traffic signs that were not in the data set. This is a fantastic starting point for future improvements to the data collection.
Due to time constraints, the user interface is simply built to serve users with the operations of uploading images according to an arbitrary number, transferring between images by buttons, detecting and displaying the detected results, automatically saving the newly detected images.
Although the model still has some limitations, they are generally limited in terms of data and can be improved easily in the future.
Limitations. From the results obtained, the article details a few limitations that will be better ameliorated in the future below:
• The proposed traffic sign recognition model is trained on the GTSRB dataset for the classification of signs and the GTSDB dataset containing panoramic images for location recognition and sign extraction. As can be observed, the dataset only covers 43 types of traffic signs; nevertheless, this is still restricted in reality with certain other sorts of signals, therefore increasing the dataset is necessary.
• Because the nature of traffic signs varies by nation, it is difficult for the model to accurately identify signs in Vietnam, where only a few indicators with comparable qualities such as speed limit signs, prohibition signs, roundabouts, priority road signs, etc. can be detected.
• Although contrast and brightness normalization has been applied on the images, normalization only works well on images with low light and average vehicle speeds. When the car goes up to 100 km/h, the signs taken will be affected quite a lot. Therefore, the improvement of image quality should be further improved in the future.
The study proposed a model to detect traffic signs on panoramic images, applying a CNN to classify signs and Mask R-CNN to recognize locations and extract signs. The proposed model achieved almost 94.5% of the proper traffic sign detection rate (341 correct boxes were detected out of 361 boxes). The classification rate of signs discovered can reach up to 99.41%. The rate of false signs was around 0.11, with background pictures being misinterpreted because they are similar in shape and color to the learned signs. As can be seen, the model performs admirably in low-light circumstances and at medium to high vehicle speeds, even on photographs imported from mobile devices. Furthermore, the proposed model works well for photos with degraded, distorted, or partially obscured traffic signs. A few signs that were not learned from the dataset but had comparable shapes and features were also recognized as a good starting point for future improvements to the dataset. Even though the user interface is not eye-catching, it has supported key tasks such as picture uploading, image transfer through buttons, and detecting, displaying, and automatically saving identified photographs. Experimental results have shown that Mask R-CNN has the ability to identify and classify panoramic images well. Based on the results, the proposed model for detecting traffic signs on holograms is a reasonable starting point that may be readily enhanced in the future. The following are some future goals to enhance the model: i) Diversify the diversity of the dataset by including more sorts of traffic signals so that the model may learn the types of signs seen in Asian nations. ii) Enhance the quality of the images to improve traffic sign identification in poor weather circumstances such as intense sunlight, rainstorms, and fog. iii) Besides, the utilization and refinement of pre-trained models are also considered [31,32].
Funding Statement: The authors received no funding for this study.
Conflicts of Interest: The authors declare that they have no conflicts of interest to report regarding the present study.
References
1. Z. Xiao, Z. Yang, L. Geng and F. Zhang, “Traffic sign detection based on histograms of oriented gradients and boolean convolutional neural networks,” in 2017 Int. Conf. on Machine Vision and Information Technology (CMVIT), Singapore, pp. 111–115, 2017. [Google Scholar]
2. Z. Zuo, K. Yu, Q. Zhou, X. Wang and T. Li, “Traffic signs detection based on faster R-CNN,” in 2017 IEEE 37th Int. Conf. on Distributed Computing Systems Workshops (ICDCSW), Atlanta, GA, USA, pp. 286–288, 2017. [Google Scholar]
3. K. He, G. Gkioxari, P. Dollár and R. Girshick, “Mask R-CNN,” in 2017 IEEE Int. Conf. on Computer Vision (ICCV), Venice, Italy, pp. 2980–2988, 2017. [Google Scholar]
4. S. Fouladi, M. J. Ebadi, A. A. Safaei, M. Y. Bajuri and A. Ahmadian, “Efficient deep neural networks for classification of COVID-19 based on CT images: Virtualization via software defined radio,” Computer Communications, vol. 176, pp. 234–248, 2021. [Google Scholar] [PubMed]
5. S. Fouladi, A. A. Safaei, N. Mammone, F. Ghaderi and M. J. Ebadi, “Efficient deep neural networks for classification of Alzheimer’s disease and mild cognitive impairment from scalp EEG recordings,” Cognitive Computation, vol. 14, pp. 1247–1268, 2022. [Google Scholar]
6. E. Javaheri, V. Kumala, A. Javaheri, R. Rawassizadeh, J. Lubritz et al., “Quantifying mechanical properties of automotive steels with deep learning based computer vision algorithms,” Metals, vol. 10, no. 2, pp. 163, 2020. [Google Scholar]
7. D. M. Filatov, K. V. Ignatiev and E. V. Serykh, “Neural network system of traffic signs recognition,” in 2017 XX IEEE Int. Conf. on Soft Computing and Measurements (SCM), Saint Petersburg, Russia, pp. 422–423, 2017. [Google Scholar]
8. N. A. Arifin, B. Irawan and C. Setianingsih, “Traffic sign recognition application using speeded-up robust features (SURF) and support vector machine (SVM) based on android,” in 2017 IEEE Asia Pacific Conf. on Wireless and Mobile (APWiMob), Bandung, Indonesia, pp. 52–58, 2017. [Google Scholar]
9. K. T. Phu and L. Lwin Oo, “Traffic sign recognition system using feature points,” in 2018 12th Int. Conf. on Research Challenges in Information Science (RCIS), Nantes, France, pp. 1–6, 2018. [Google Scholar]
10. C. Wang, “Research and application of traffic sign detection and recognition based on deep learning,” in 2018 Int. Conf. on Robots & Intelligent System (ICRIS), Amsterdam, Netherlands, pp. 150–152, 2018. [Google Scholar]
11. D. R. Bruno and F. Santos Osorio, “A comparison of traffic signs detection methods in 2d and 3d images for the benefit of the navigation of autonomous vehicles,” in 2018 Latin American Robotic Symposium, 2018 Brazilian Symposium on Robotics (SBR) and 2018 Workshop on Robotics in Education (WRE), Pessoa, Brazil, pp. 26–32, 2018. [Google Scholar]
12. C. G. Serna and Y. Ruichek, “Traffic signs detection and classification for European Urban environments,” IEEE Transactions on Intelligent Transportation Systems, vol. 21, no. 10, pp. 4388–4399, Oct. 2020. [Google Scholar]
13. H. Ibrahem, A. Salem and H. S. Kang, “Weakly supervised traffic sign detection in real time using single CNN architecture for multiple purposes,” in 2020 IEEE Int. Conf. on Consumer Electronics (ICCE), Las Vegas, NV, USA, pp. 1–4, 2020. [Google Scholar]
14. F. Zhang and Y. Zeng, “D-FCOS: Traffic signs detection and recognition based on semantic segmentation,” in 2020 IEEE Int. Conf. on Power, Intelligent Computing and Systems (ICPICS), Shenyang, China, pp. 287–292, 2020. [Google Scholar]
15. W. Yang and W. Zhang, “Real-time traffic signs detection based on Yolo network model,” in 2020 Int. Conf. on Cyber-Enabled Distributed Computing and Knowledge Discovery (CyberC), Chongqing, China, pp. 354–357, 2020. [Google Scholar]
16. A. Abraham, D. Purwanto and H. Kusuma, “Traffic lights and traffic signs detection system using modified You Only Look Once,” in 2021 Int. Seminar on Intelligent Technology and Its Applications (ISITIA), Surabaya, Indonesia, pp. 141–146, 2021. [Google Scholar]
17. W. H. D. Fernando and S. Sotheeswaran, “Automatic road traffic signs detection and recognition using ‘You Only Look Once’ version 4 (YOLOv4),” in 2021 Int. Research Conf. on Smart Computing and Systems Engineering (SCSE), Colombo, Sri Lanka, pp. 38–43, 2021. [Google Scholar]
18. R. Ayachi, M. Afif, Y. Said and M. Atri, “Traffic signs detection for real-world application of an advanced driving assisting system using deep learning,” Neural Processing Letters, vol. 51, pp. 837–851, 2020. [Google Scholar]
19. R. Biswas, A. Vasan and S. S. Roy, “Dilated deep neural network for segmentation of retinal blood vessels in fundus images,” Iranian Journal of Science and Technology, Transactions of Electrical Engineering, vol. 44, pp. 505–518, 2020. [Google Scholar]
20. T. S. Balaji and S. Srinivasan, “Networking controller based real time traffic prediction in clustered vehicular adhoc networks,” Intelligent Automation & Soft Computing, vol. 35, no. 2, pp. 2189–2203, 2023. [Google Scholar]
21. P. Vigneshwaran, N. Prasath, M. Islabudeen, A. Arun and A. K. Sampath, “Identification and acknowledgment of programmed traffic sign utilizing profound convolutional neural organization,” Intelligent Automation & Soft Computing, vol. 35, no. 2, pp. 1527–1543, 2023. [Google Scholar]
22. S. S. Roy, N. Rodrigues and Y. Taguchi, “Incremental dilations using CNN for brain tumor classification,” Applied Sciences, vol. 10, no. 14, pp. 4915, 2020. [Google Scholar]
23. S. S. Roy, R. Sikaria and A. Susan, “A deep learning based CNN approach on MRI for Alzheimer’s disease detection,” Intelligent Decision Technologies, vol. 13, no. 4, pp. 495–505, 2019. [Google Scholar]
24. V. Rajalakshmi and S. Ganesh Vaidyanathan, “Mlp-pso framework with dynamic network tuning for traffic flow forecasting,” Intelligent Automation & Soft Computing, vol. 33, no. 3, pp. 1335–1348, 2022. [Google Scholar]
25. J. Stallkamp, M. Schlipsing, J. Salmen and C. Igel, “The German traffic sign recognition benchmark: A multi-class classification competition,” in The 2011 Int. Joint Conf. on Neural Networks, San Jose, CA, USA, pp. 1453–1460, 2011. [Google Scholar]
26. S. Houben, J. Stallkamp, J. Salmen, M. Schlipsing and C. Igel, “Detection of traffic signs in real-world images: The German traffic sign detection benchmark,” in The 2013 Int. Joint Conf. on Neural Networks (IJCNN), Dallas, Texas, USA, pp. 1–8, 2013. [Google Scholar]
27. D. P. Kingma and J. Ba, “Adam: A method for stochastic optimization,” in Proc. of the 3rd Int. Conf. on Learning Representations, ICLR (Poster), San Diego, CA, USA, 2015. [Google Scholar]
28. N. Srivastava, G. Hinton, A. Krizhevsky, I. Sutskever and R. Salakhutdinov, “Dropout: A simple way to prevent neural networks from overfitting,” The Journal of Machine Learning Research, vol. 15, no. 1, pp. 1929–1958, 2014. [Google Scholar]
29. H. Rezatofighi, N. Tsoi, J. Gwak, A. Sadeghian, I. Reid et al., “Generalized intersection over union: A metric and a loss for bounding box regression,” in 2019 IEEE/CVF Conf. on Computer Vision and Pattern Recognition (CVPR), Long Beach, CA, USA, pp. 658–666, 2019. [Google Scholar]
30. H. Qian, Y. Ma, W. Chen, T. Li, Y. Zhuo et al., “Traffic signs detection and segmentation based on the improved Mask R-CNN,” in 2021 40th Chinese Control Conf. (CCC), Shanghai, China, pp. 8241–8246, 2021. [Google Scholar]
31. A. H. Vo, L. H. Son, M. T. Vo and T. Le, “A novel framework for trash classification using deep transfer learning,” IEEE Access, vol. 7, pp. 178631–178639, 2019. [Google Scholar]
32. M. T. Vo, A. H. Vo and T. Le, “A robust framework for shoulder implant X-ray image classification,” Data Technologies and Applications, vol. 56, no. 3, pp. 447–460, 2021. [Google Scholar]
Cite This Article
 Copyright © 2023 The Author(s). Published by Tech Science Press.
This work is licensed under a Creative Commons Attribution 4.0 International License , which permits unrestricted use, distribution, and reproduction in any medium, provided the original work is properly cited.
 Downloads
 Citation Tools