
 Submit a Paper
 Propose a Special lssue
 Open Access
ARTICLE

Machine Learning for Hybrid Line Stability Ranking Index in Polynomial Load Modeling under Contingency Conditions
1 Jawaharlal Nehru Technological University, Anantapur, Ananthapuramu
2 JNTUA College of Engineering, Constituent College of
Jawaharlal Nehru Technological Univeristy, Anantapur, Ananthapuramu
* Corresponding Author: P. Venkatesh. Email:
Intelligent Automation & Soft Computing 2023, 37(1), 1001-1012. https://doi.org/10.32604/iasc.2023.036268
Received 23 September 2022; Accepted 11 January 2023; Issue published 29 April 2023
 View Full Text
 Download PDF
Abstract
In the conventional technique, in the evaluation of the severity index, clustering and loading suffer from more iteration leading to more computational delay. Hence this research article identifies, a novel progression for fast predicting the severity of the line and clustering by incorporating machine learning aspects. The polynomial load modelling or ZIP (constant impedances (Z), Constant Current (I) and Constant active power (P)) is developed in the IEEE-14 and Indian 118 bus systems considered for analysis of power system security. The process of finding the severity of the line using a Hybrid Line Stability Ranking Index (HLSRI) is used for assisting the concepts of machine learning with J48 algorithm, infers the superior affected lines by adopting the IEEE standards in concern to be compensated in maintaining the power system stability. The simulation is performed in the WEKA environment and deals with the supervisor learning in order based on severity to ensure the safety of power system. The Unified Power Flow Controller (UPFC), facts devices for the purpose of compensating the losses by maintaining the voltage characteristics. The finite element analysis findings are compared with the existing procedures and numerical equations for authentications.Keywords
Electricity is a necessity for the maximum elementary condition of the contemporary world. Hence, safeguarding the safety of the power system is equally important. The major goal of power system security is to deliver consistent power to the clients short of disruption, harm to the user utilisation, and financial process of the power system. But such a power system is also disposed to numerous problems, like the transmission line outage, the generator outage, the rapid increase in load demand, the loss of a transformer, etc., which are known as contingencies. Safety is a key motivator in the power system. In recent years, blackouts due to power system contingencies have increased. It causes industries to lose money and disrupts people’s daily lives. Thus, it’s important to accept a precise and active measure to stop the blackout’s contingency from spreading to other lines. Contingency analysis is used to quickly guess the system stability right after the outage or any abnormal conditions. The purpose of the contingency plan is to ascertain the change within the device’s functioning that can occur after the fault element is removed. Large violations of inline flow may end in single line outages, which may cause cascading effects of the outages and may also cause overloading on the other lines. If such an overload results from a line outage, there’s an immediate need for the regulator’s action to be taken. Therefore, contingency analysis is one of the most important tasks to be completed by power system planners and operation engineers. Several different methods of ranking potential outcomes, both static and dynamic, are used in the process of contingency screening [1].
Load models may be used to predict how loads will respond to changes in voltage or frequency. It’s important to choose a load model that is easy to understand and can appropriately represent a variety of load response situations while executing. In this study, the effects of steady-state and polynomial load models are examined. This model is less precise than the polynomial load model because it depicts a combination of three different sorts of features in a single load. It is possible to express resistive loads, induction motor loads, and variable-frequency loads in a polynomial load model by using the constant impedance, the constant current, and the constant power. As a result, the polynomial load model is more accurate since it accurately depicts load [2,3]. If there are any disturbances in the system, the stability of the system becomes vulnerable, and there is a high risk of moving towards global instability, total collapse, or even blackout if preventive actions are not taken quickly. When installed and calibrated properly, FACTS devices may alleviate several power system problems, including contingency. FACTS devices are good at solving power system emergencies. An index-based strategy for placing FACTS devices is found to be extremely precise and computationally efficient. Static and dynamic analyses of the system are both possible using this tool. The two most affected parameters due to contingency in a transmission system are line loading and voltage stability. The line overload index and voltage stability index must be combined to estimate system stress in emergency situations. The line stability index is easier to calculate, takes less time, and can identify weak buses [4–6].
UPFC is the most adaptable and versatile FACTS device [7] due to its use of both series and parallel inverters connected by a shared DC connection. FACTS devices are placed on the most severe lines to reduce the severity of the lines. A novel hybrid stability ranking index (HLSRI) has been used for contingency ranking. The position of the UPFC is recommended to be on the line with the greatest chance of severity. UPFC’s are tuned to provide compensation [8]. The proposed method is implemented and tested on IEEE 14 and IEEE 118 bus systems. The step-by-step processes of the work execution are shown in Fig. 1.
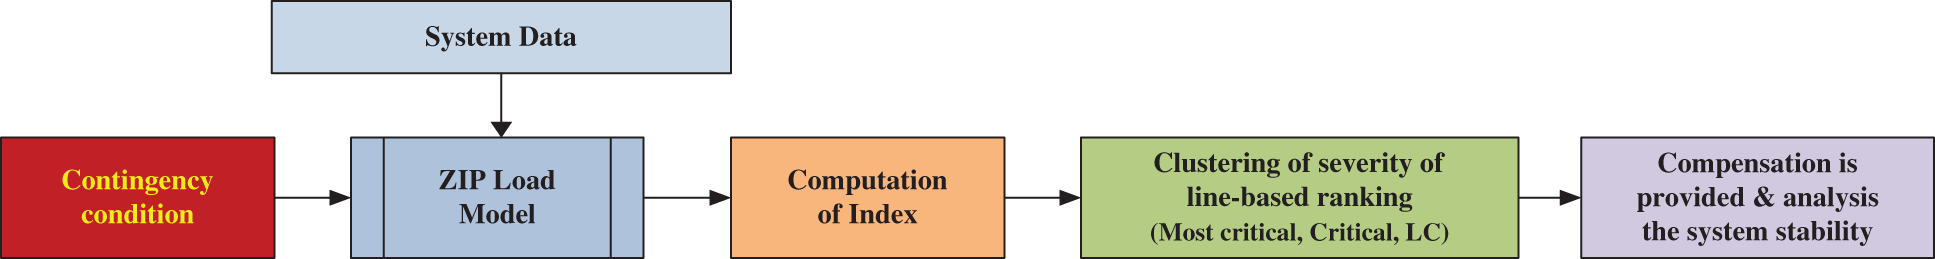
Figure 1: Organization of the work
2 Power System Contingency Ranking Approach
Contingency analysis is a well-known function in modern Energy Management Systems. The system’s contingency analysis could be a major movement in power grid planning and process. Generally, an outage of a single line or transformer may lead to overloads in other branches and also cause sudden system voltage rises or drops [9]. The power system security can be analysed by ranking the contingencies based on the severity of the contingency. It consists of three basic steps to make the analysis easier, as shown in Fig. 2.
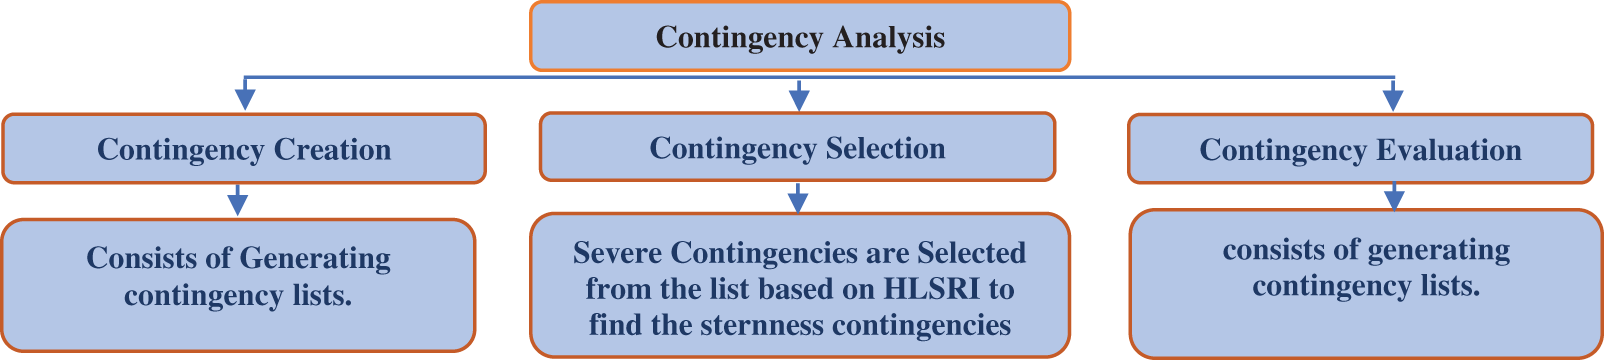
Figure 2: Classification of contingencies
There are various types of contingencies such as generator outages, line outages, bus outages, and transformer outages. Line outages are analysed in this paper as they are the most frequently occurring contingency in the system.
Contingency occurs mainly due to sudden increase or decrease of loads. Load modeling plays a major role in analyzing various types of loads. Load modeling refers to the mathematical illustration of the connection between the power and the voltage in a load bus. It has a significant impact on power system studies.
Two types of load models are considered in this project for analyzing the contingency, which are named as Steady state load model and polynomial load model [10,11].
Steady state load model is also known as constant load model. The active and reactive power equations in this model are represented as shown in (1) and (2).
The diagonal and off-diagonal elements of active power and reactive power are developed.
Polynomial load model is also known as ZIP load model. Z represents constant impedance, which represent constant current and P represents constant power [12,13]. The active and reactive power equations in this model are represented as shown in (3) and (4).
At Bus-i:
At Bus-j:
The diagonal and off-diagonal elements of active power and reactive power at Bus-i and Bus-j are developed. These load models are incorporated with Newton-Raphson power flow solution method. Newton-Raphson method is used as it is faster, more reliable; results are accurate and quadratic type convergence. Jacobian matrix is formed using the developed diagonal and off-diagonal elements. The Jacobian matrix springs the linear connection between the small vagaries in voltage magnitude and phase angle with the small vagaries in real and reactive power as shown in (7)
The variance between the programmed and the designed values known as power residual is given in (8) and (9)
The new estimates for voltage angle and voltage magnitude are shown in (10) and (11)
These two load models are applied to IEEE-118 bus system for analyzing the behavior of the loads. Line stability index gives support to find most severe lines.
2.2 Hybrid Line Stability Ranking Index (HLSRI) for Contingency Ranking
To get the Hybrid Line Stability Ranking Index (HLSRI), we first look at the Line Stability Index and the Fast Voltage Stability Index (FVSI) Then, we showed that the FVSI is a calculation of the LSI, and we went on to figure out the HLSRI, which is faster and more accurate. LSI is given in Eq. (12) [14–17].
where,
The FVSI is derived from LSI when the voltage angle difference between sending and receiving end is assumed to be very small (i.e.,
Therefore, propose to combine (13) and (14) into a single equation to compute a Hybrid line Stability Ranking Index as a switching function β, (14). Each
The HLSRI is given as:
where,
The Large voltage angle differences may signal a blackout or system failure. Angle delta (‘
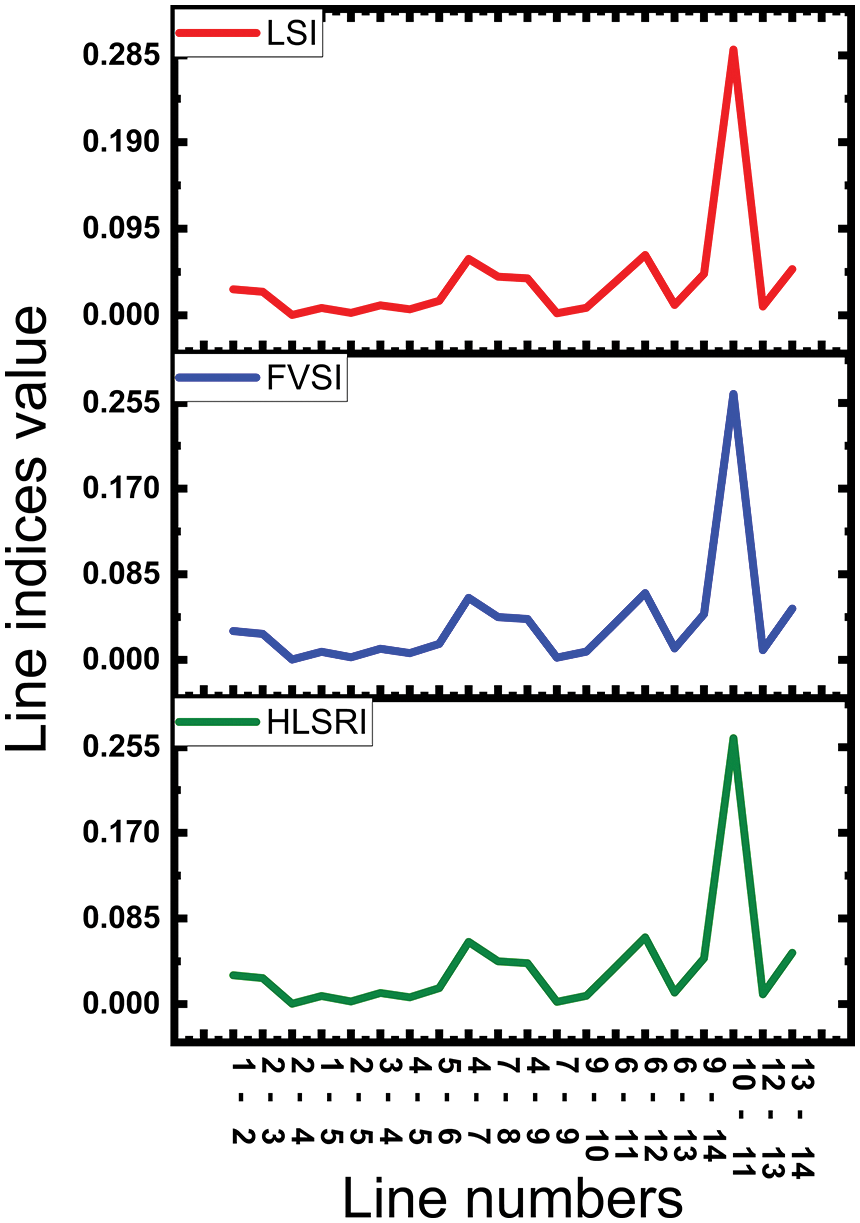
Figure 3: Shows proposed index value with LSI & FVSI using contingency
From the Fig. 3 it is evidence that, instead of using two individual line index, the proposed HLSRI values are very closer to the LSI and FVSI and it is more accuracy then other.
2.3 Power System Contingency Ranking Algorithm
Fig. 4 show the flow chart of contingency ranking algorithm and as follows:
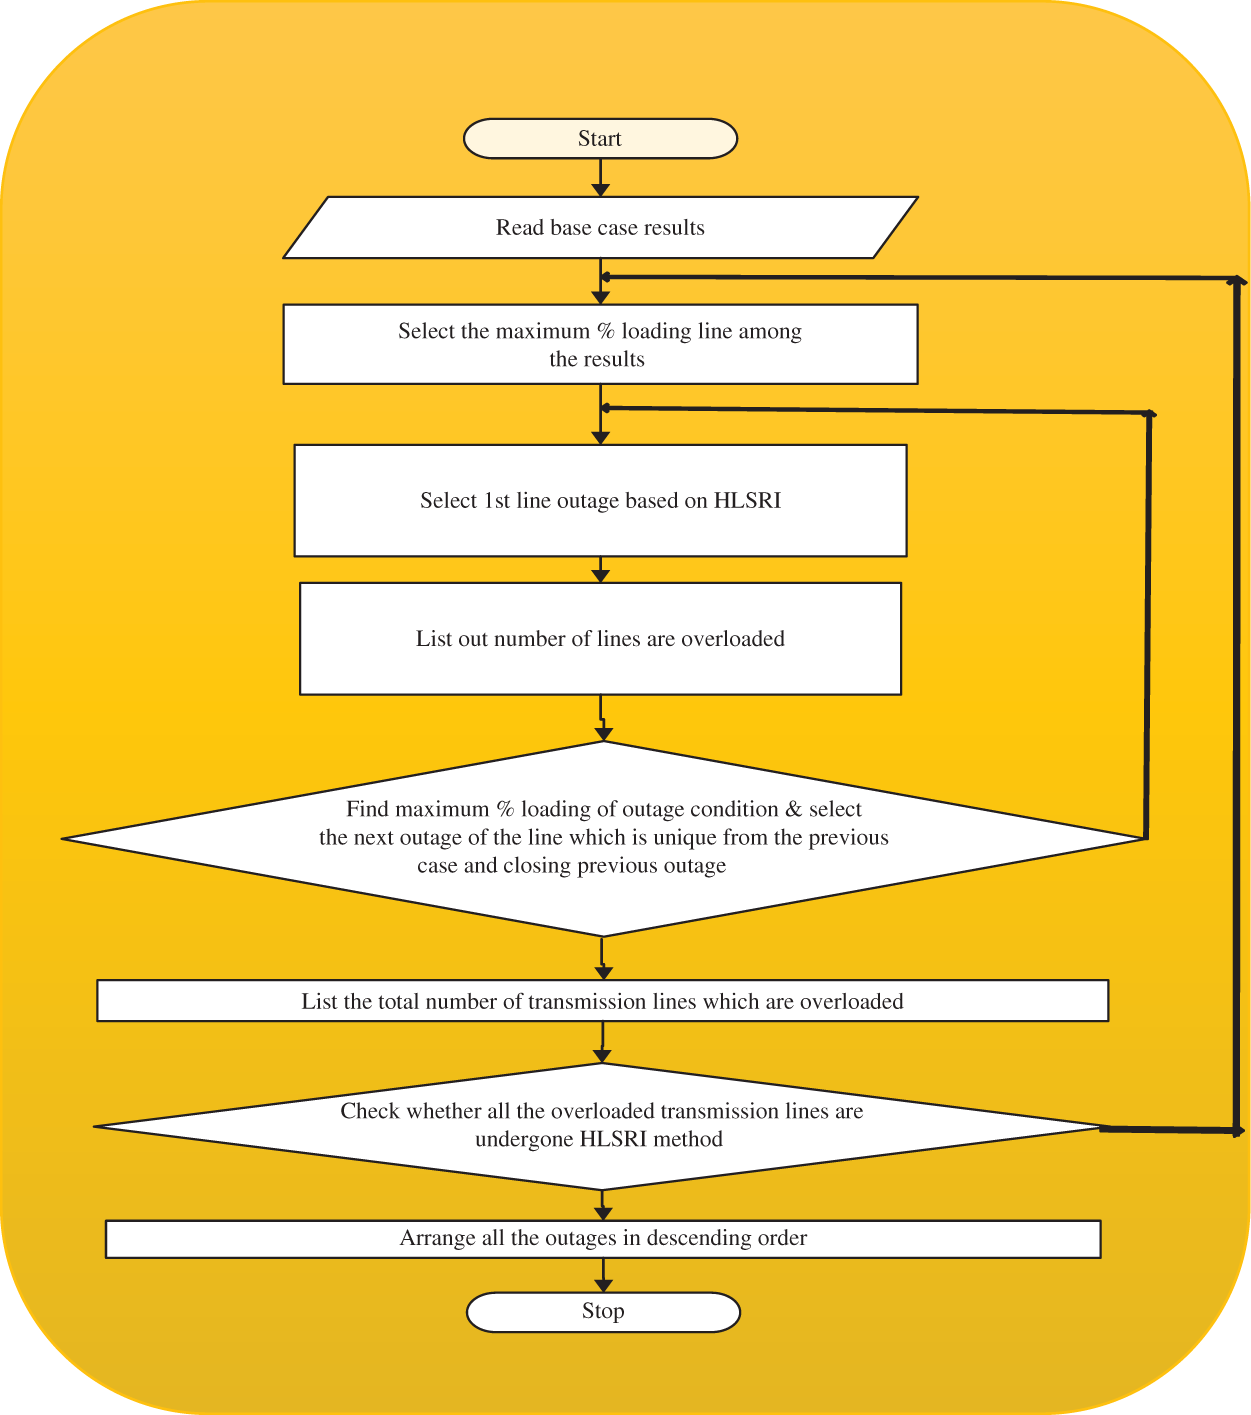
Figure 4: Power system contingency ranking algorithm
The Waikato Environment for Knowledge Analysis (WEKA) was developed at the University of Waikato, New Zealand. The software provides tools for data processing, implementation of several machine learning algorithms, and visualisation tools. It is free, open-source software that provides a range of tools for analysing large amounts of data. Supervised learning refers to ML forecasting methods. Unsupervised learning shows a dataset’s case distribution. Supervised learning methods detect the relationship between input and target. Relationships are prototypical. Classification and regression models are common supervised methods. Machine learning offers various data analysis types. This paper uses the J48 algorithm to cluster data from proposed indices as shown in Fig. 5. The C4.5 tree is j48. It creates datasets. Decision trees help classify and cluster. This method arranges a tree. If the tree exists, the tuple is added. During tree construction, j48 ignores forecasted missing values.
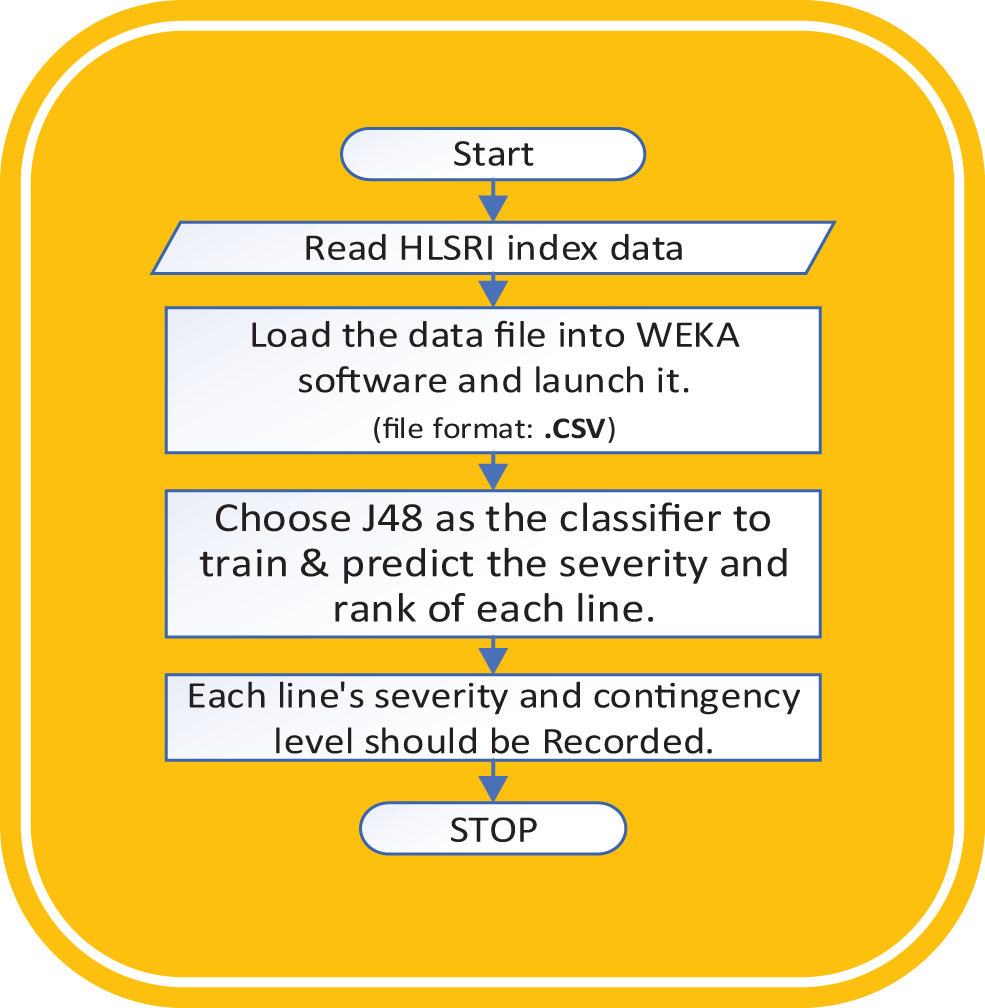
Figure 5: Data processing, classification, and forecast of transmission line severity
The HLSRI is used in conjunction with the J48 classification model in order to quickly predict and cluster the list of critical lines from high to low value. Once the critical line is found, compensation is used to make sure that the system stays stable and safe [18,19].
Figs. 6a and 6b show j48 classification. Fig. 6 shows that the arrangement is as stated. The 5-foot tree has one sub-tree and three leaves. It shows that decision tree size and leaves are constant, but HLSRI index range varies. Here, the classification of ranking is as three conditions for test system as given below:
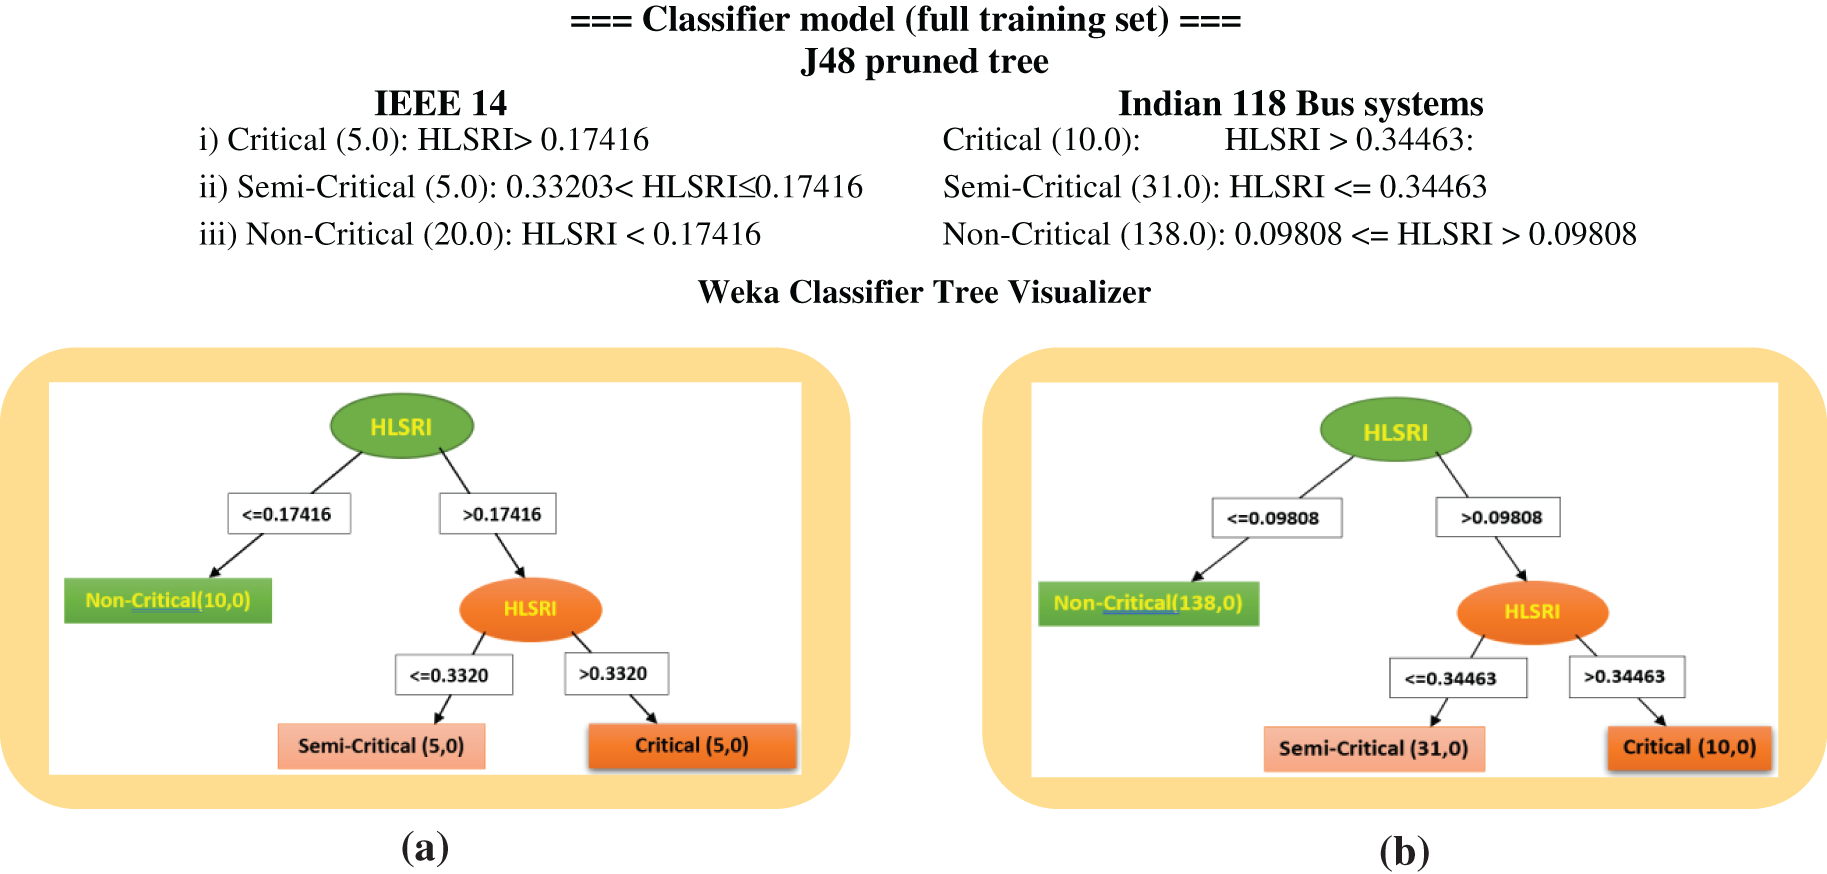
Figure 6: (a) J48 algorithm tree view of IEEE 14 Bus for HLSRI. (b) J48 algorithm tree view of IEEE 118 Bus for HLSRI
3 Unified Power Flow Controller
A FACTS device plays a vital role in controlling power and enhancing the working volume of existing lines. The basic purpose of the parallel inverter is to supply real power required by the series inverter through the common DC link. The parallel inverter can also grip or produce controllable reactive power, as shown in Fig. 7. Controlling active and reactive power flow through the lines is the job of a UPFC, which consists of a STATCOM and an SSSC coupled via a common DC voltage link. It also plays an important role in regulating voltage [20].
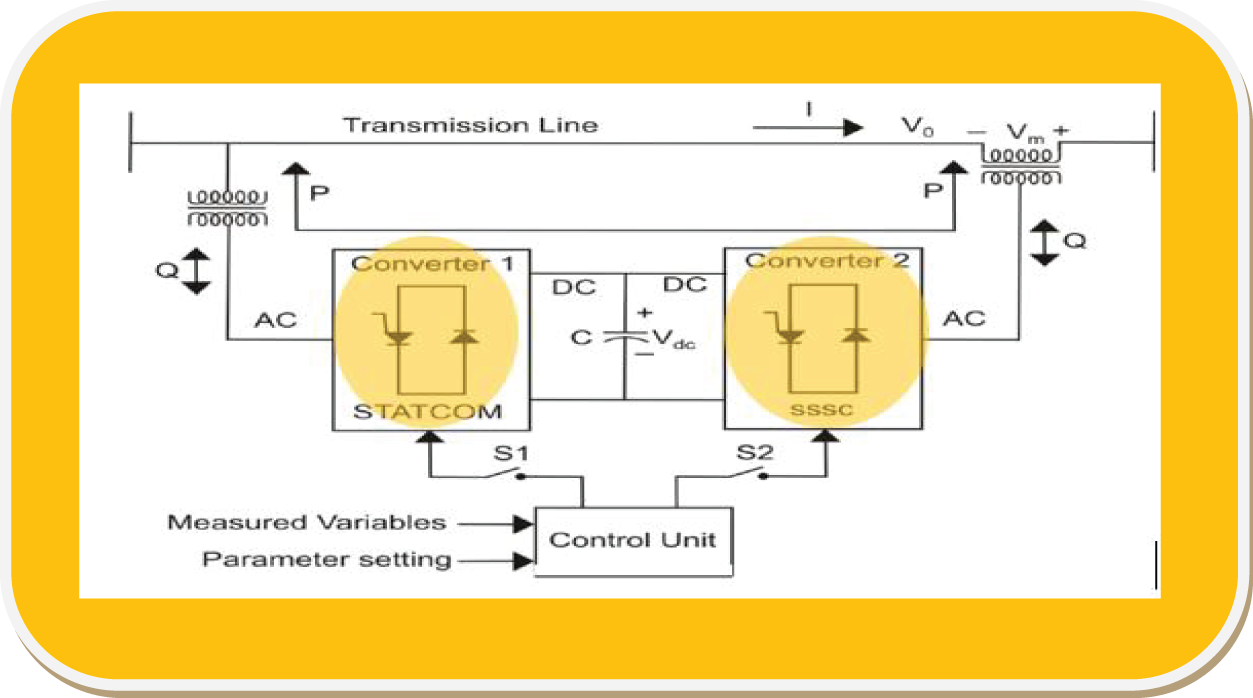
Figure 7: Representation of UPFC schematic diagram
The active and reactive power equation of the Unified Power Flow Controller is developed with ZIP load model as shown in below.
The crosswise and off-diagonal elements are developed. By using this developed mathematical model, MATLAB program is developed and used for compensating the most severe lines.
3.1 Implementation of PSO Algorithm
PSO searches for the optimal objective location using random agents. Each agent’s position and velocity are updated over generations. Each agent’s new position combines its previous velocity and current position. At each stage of an agent’s situation, Pbest is updated. Each agent knows the Gbest group is the Pbest’s best. After a fixed number of rounds, Pbest & Gbest agents reach global optimality. Updated agent velocity and position.
where
rand1 & rand2 = random numbers range from 0 to 1
C1, C2 = Accelerating constants
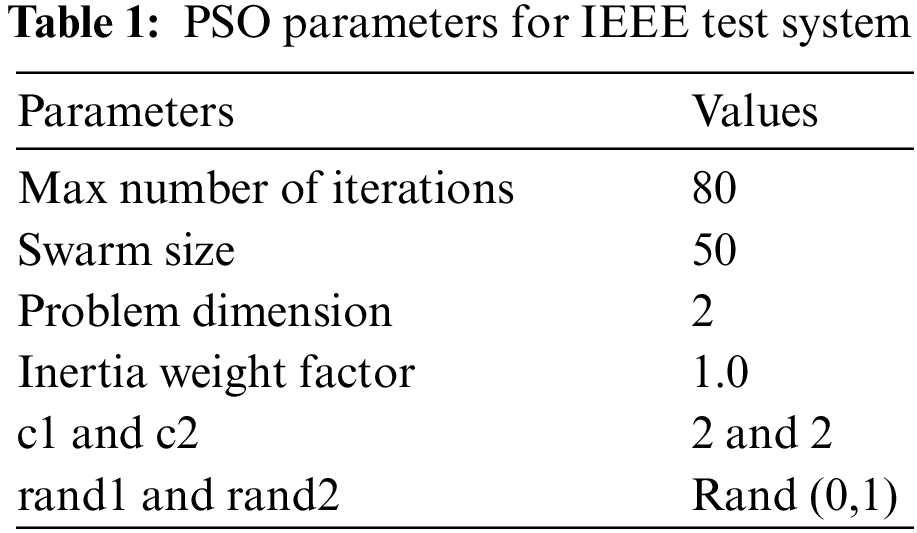
The order of magnitude and phase angles of the infused voltage of the UPFC’s VSC serve as optimal control parameters as shown in Table 1.
In this paper, the IEEE 14 test bus system is shown for 100% loading along with compensation as shown in Table 2.
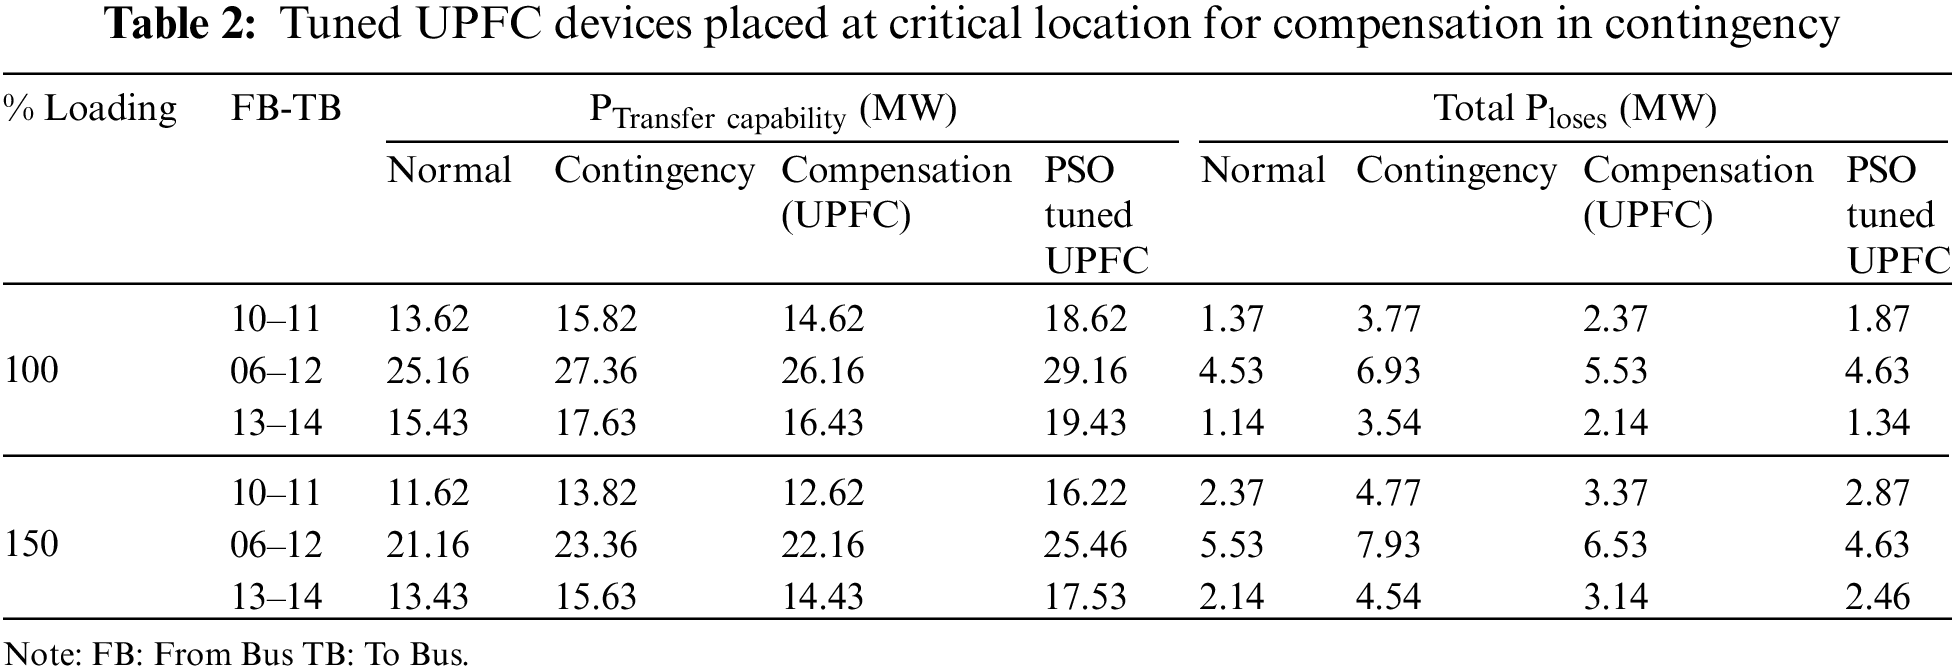
From the below Table 2, it shows the improved power flows with proper tuned UPFC compensation using pso in the most critical lines (which find with the help of Proposed index).
IEEE 118 bus test system which consists of 1 slack bus, 19 generator buses, 35 synchronous condensers, 124 load buses and 179 transmission lines is simulated using MATLAB for ZIP load modeling, following results are obtained for different loading conditions with and without contingency and compensation to improve the power transfer capability and reduce the losses. Table 3 shows the ZIP load model with 100% and 150% of loading for the critical lines without contingency, with contingency and compensation.
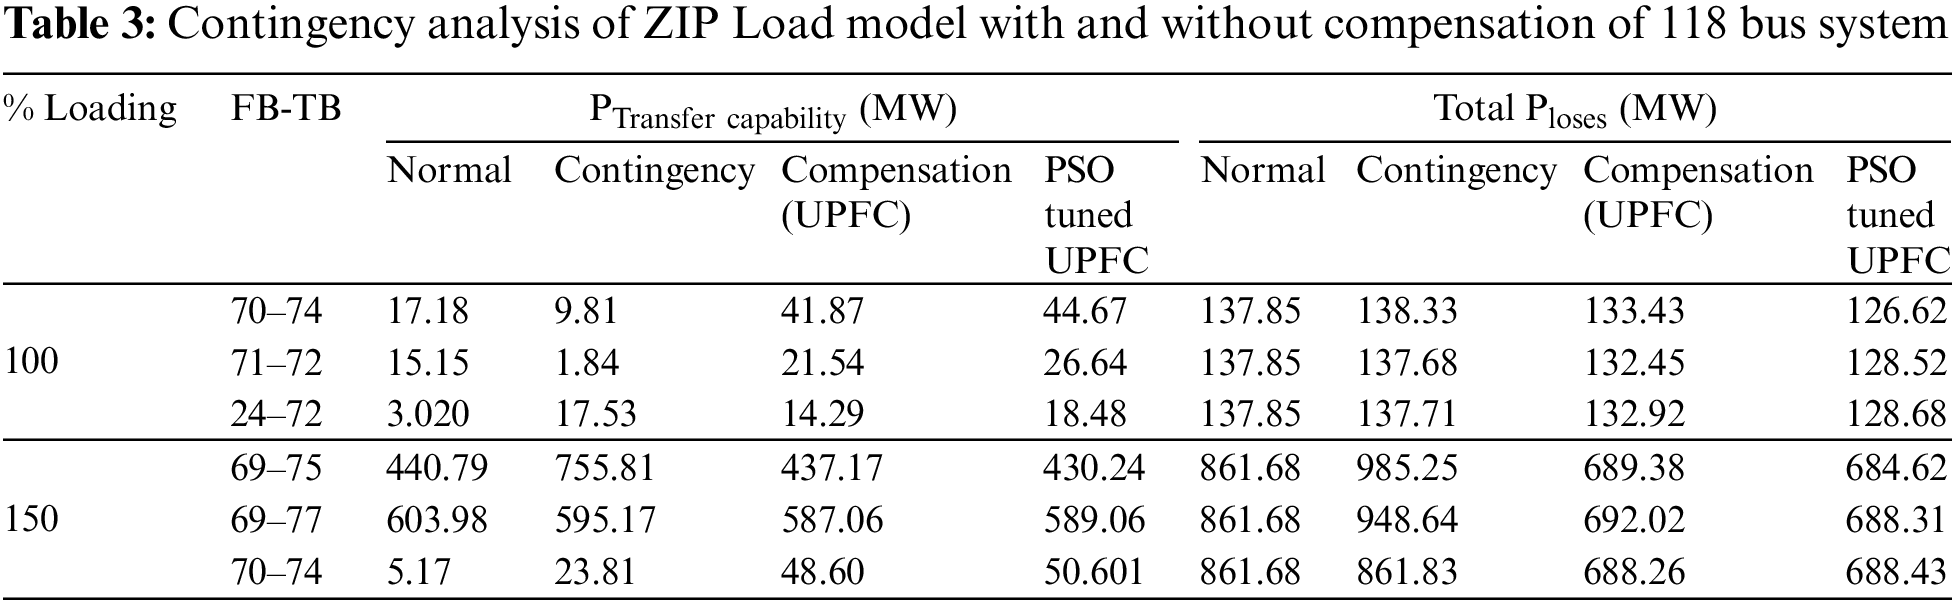
The Indian 118 bus test system is in Table 2. A bus system contingency analysis is carried out and finds the severity of the lines based on the ranking of the high bridge line stability index. Lines 70–74 are considered high-stressed lines, the second-stressed lines are 71–72, and the third-stressed line is 24–72 (single line outage at a time). From the results, it is clear that the values of the transmission line parameters are improved after compensation compared to before compensation. For example, when performing load modelling between buses 70 and 74, the results are active power-17.184, reactive power-14.0386, voltage profile-0.99, total system loss-137.85; when contingency is created, the results are active power-41.878, reactive power-88.37, voltage profile-0.96, total system loss-133.43 with compensation; and finally, when PSO tuned compensation is provided, the results are active power-44.67, reactive power-92.47, voltage profile-0.9 This demonstrates that after PSO tuned compensation, the voltage profile is maintained, active power flow is increased, reactive power flow is maintained, and total system losses are condensed, resulting in a stable system.
The proposed index is applied to the IEEE 14 and Indian 118 test systems and mathematical models of steady state and polynomial load models (ZIP) are developed and analysed with the IEEE test system in view of the single line outage at a time. The Indian 118 test system is analysed for various percentages of ZIP load model for contingency with and without compensation using the PSO algorithm. A Hybrid Line Stability Ranking Index shows the most critical lines in the system for which compensation is provided by placing a unified power flow controller with proper tuning using PSO. Based on the outcomes, it is apparent that the stress level is reduced, and the system is kept stable and healthy by providing suitable compensation at a suitable location.
Acknowledgement: The authors would like to thank JNT University Anantapur, Ananthapuramu and Sree Vidyanikethan engineering college, Tirupati, Andhra Pradesh, India and also, we like to thank Anonymous reviewers for their so-called insights.
Funding Statement: The authors received no specific funding for this study.
Conflicts of Interest: The authors declare that they have no conflicts of interest to report regarding the present study.
References
1. A. Mishra and G. V. Nagesh Kumar, “A risk of severity-based scheme for optimal placement of interline power flow controller using composite index,” International Journal of Power and Energy Conversion, vol. 8, no. 3, pp. 257–275, 2017. [Google Scholar]
2. P. Venkatesh and N. Visali, “Investigations on hybrid line stability ranking index with polynomial load modeling for power system security,” Electrical Engineering & Electromechanics, vol. 1, no. 1, pp. 3–8, 2023. [Google Scholar]
3. P. Venkatesh and N. Visali, “Assessment of power system security using contingency analysis,” International Journal of Control and Automation, vol. 12, no. 5, pp. 25–32, 2019. [Google Scholar]
4. J. Venkateswaran, P. Manohar, K. Vinothini, B. T. Monisha Shree and R. Jayabharthi, “Contingency analysis of an IEEE 30 bus system,” in 3rd IEEE Int. Conf. on Recent Trends in Electronics, Information and Communication Technology, Bangalore, India, IEEE, pp. 328–333, 2020. [Google Scholar]
5. S. Ncwane and K. A. Folly, “Impact of load variability modelling on probabilistic power system transient stability,” International Journal of Electrical and Electronic Engineering & Telecommunications, vol. 11, no. 5, pp. 344–350, 2022. [Google Scholar]
6. S. R. Seshapalli, “Analysis of hybrid power flow controller using static load model under contingency screening,” in IEEE Int. Conf. on Clean Energy and Energy Efficient Electronics Circuit for Sustainable Development, Krishnankoil, India, IEEE, pp. 1–6, 2019. [Google Scholar]
7. S. Asawa and S. Al-Attiyah, “Impact of FACTS device in electrical power system,” in Int. Conf. on Electrical, Electronics and Optimization Techniques, Chennai, India, IEEE, pp. 2488–2495, 2016. [Google Scholar]
8. A. Mishra, G. V. Nagesh Kumar and S. K. Bali, “Optimized utilization of interline power flow controller in an integrated power system,” World Journal of Engineering, vol. 17, no. 2, pp. 261–266, 2020. [Google Scholar]
9. R. A. Gamboa, C. V. Aravind and C. A. Chin, “Power system network contingency studies,” in IEEE Student Conf. on Research and Development, Selangor, Malaysia, IEEE, pp. 1–6, 2018. [Google Scholar]
10. S. Sairam and S. B. Daram, “Contingency ranking in a power transmission system using ZIP load modeling,” UPB Scientific Bulletin Series C: Electrical Engineering, vol. 82, no. 1, pp. 205–220, 2020. [Google Scholar]
11. M. K. Dosoglu and M. Dursun, “Investigation with ZIP load model of voltage stability analysis in wind turbine integrated power system,” in 2nd Int. Symp. on Multidisciplinary Studies and Innovative Technologies, Ankara, Turkey, IEEE, pp. 1–5, 2018. [Google Scholar]
12. S. S. Ram, S. B. Daram, P. S. Venkataramu and M. S. Nagaraj, “Analysis of ZIP load modelling in power transmission system,” International Journal of Control and Automation, vol. 11, no. 7, pp. 11–24, 2018. [Google Scholar]
13. S. Burada, D. Joshi and K. D. Mistry, “Contingency analysis of power system by using voltage and active power performance index,” in IEEE Int. Conf. on Power Electronics on Intelligence Control and Energy Systems, Delhi, India, IEEE, pp. 1–5, July, 2016. [Google Scholar]
14. S. Yari and H. Khoshkhoo, “Assessment of line stability indices in detection of voltage stability status,” in IEEE Int. Conf. on Environment and Electrical Engineering, Milan, Italy, IEEE, pp. 1–5, 2017. [Google Scholar]
15. T. U. Badrudeen, F. K. Ariyo, A. O. Salau and S. L. Braide, “Analysis of a new voltage stability pointer for line contingency ranking in a power network,” Bulletin of Electrical Engineering and Informatics, vol. 11, no. 6, pp. 3033–3041, 2022. [Google Scholar]
16. N. S. Goutham and Z. A. Ansari, “Determination of optimal location of FACTS devices for power system restoration including load flow and contingency analysis,” International Journal of Engineering Research and Technology (IJERT), vol. 5, no. 18, pp. 1–4, 2017. [Google Scholar]
17. A. N. Alsammak and H. A. Mohammed, “A literature review on the unified power flow controller UPFC,” International Journal of Computer Applications, vol. 182, no. 12, pp. 23–29, 2018. [Google Scholar]
18. R. V. Angadi, S. B. Daram and P. S. Venkataramu, “Contingency analysis of power system using big data analytic techniques,” in 5th Int. Conf. on Computing, Communication and Security (ICCCS), Patna, India, IEEE, pp. 1–7, 2020. [Google Scholar]
19. J. Lin, B. Zhang, L. Gao and P. Li, “Multi-mode coordination system control strategy and its operation performance of western nanjing power grid UPFC project,” in Int. Conf. on Power System Technology, Guangzhou, China, IEEE, pp. 2678–2684, 2018. [Google Scholar]
20. P. Singh, R. Tiwari, A. Singh and V. Sangwan, “Optimal allocation and comparative investigation of unified power flow controller using ASMO,” in 2020 Int. Conf. on Power Electronics & IoT Applications in Renewable Energy and its Control (PARC), Mathura, India, IEEE, pp. 497–502, 2020. [Google Scholar]
Cite This Article
 Copyright © 2023 The Author(s). Published by Tech Science Press.
This work is licensed under a Creative Commons Attribution 4.0 International License , which permits unrestricted use, distribution, and reproduction in any medium, provided the original work is properly cited.
 Downloads
 Citation Tools